state of california department of transportation technical …
TRANSCRIPT
STATE OF CALIFORNIA DEPARTMENT OF TRANSPORTATION TECHNICAL REPORT DOCUMENTATION PAGE TR0003 (REV. 10/98) 1. REPORT NUMBER
CA07-0990
2. GOVERNMENT ASSOCIATION NUMBER
3. RECIPIENT’S CATALOG NUMBER
4. TITLE AND SUBTITLE
San Joaquin Rail Corridor Crossing Survey 5. REPORT DATE June 2008
6. PERFORMING ORGANIZATION CODE
7. AUTHOR(S)
Daniel Greenhouse, Kent Christianson, Scott Johnston, Zu Kim
8. PERFORMING ORGANIZATION REPORT NO. UCB-ITS-PRR-2008-6
9. PERFORMING ORGANIZATION NAME AND ADDRESS
California PATH 1357 S.46th Street, Bldg. 452 Richmond, CA 94804-4648
10. WORK UNIT NUMBER
11. CONTRACT OR GRANT NUMBER
12. SPONSORING AGENCY AND ADDRESS
California Department of Transportation Division of Research and Innovation, MS-83 1227 O Street Sacramento CA 95814
13. TYPE OF REPORT AND PERIOD COVERED
Final Report 14. SPONSORING AGENCY CODE
15. SUPPLEMENTAL NOTES
16. ABSTRACT In this project we have accomplished three goals. First, we have merged two existing, complementary databases in an effort to produce a single database that lists all the railroad crossings, and their known properties, in the San Joaquin Rail Corridor. Second, we have demonstrated the practicality of using video data gathered from an existing Locomotive Video Data Acquistion System to search for crossing violations in order to populate a database of crossing violations, which we term “near-misses”. By this means, crossings that are particularly susceptible to violations, considered a precursor to collisions, can be identified. Third, we have demonstrated a new in-pavement crossing signal based upon LED technology that can serve to increase safety at crossings.
17. KEY WORDS
San Joaquin Rail Corridor, Crossings, LED lighting, Crossing Violations, Near Misses, Safety
18. DISTRIBUTION STATEMENT
No restrictions. This document is available to the public through the National Technical Information Service, Springfield, VA 22161
19. SECURITY CLASSIFICATION (of this report)
Unclassified
20. NUMBER OF PAGES
33
21. PRICE
Reproduction of completed page authorized

DISCLAIMER STATEMENT
This document is disseminated in the interest of information exchange. The contents of this report reflect the views of the authors who are responsible for the facts and accuracy of the data presented herein. The contents do not necessarily reflect the official views or policies of the State of California or the Federal Highway Administration. This publication does not constitute a standard, specification or regulation. This report does not constitute an endorsement by the Department of any product described herein.
For individuals with sensory disabilities, this document is available in Braille, large print, audiocassette, or compact disk. To obtain a copy of this document in one of these alternate formats, please contact: the Division of Research and Innovation, MS-83, California Department of Transportation, P.O. Box 942873, Sacramento, CA 94273-0001.

ISSN 1055-1425
June 2008
This work was performed as part of the California PATH Program of the University of California, in cooperation with the State of California Business, Transportation, and Housing Agency, Department of Transportation, and the United States Department of Transportation, Federal Highway Administration.
The contents of this report reflect the views of the authors who are responsible for the facts and the accuracy of the data presented herein. The contents do not necessarily reflect the official views or policies of the State of California. This report does not constitute a standard, specification, or regulation.
Final Report for Task Order 6201
CALIFORNIA PATH PROGRAMINSTITUTE OF TRANSPORTATION STUDIESUNIVERSITY OF CALIFORNIA, BERKELEY
San Joaquin Rail Corridor Crossing Survey
UCB-ITS-PRR-2008-6California PATH Research Report
Daniel Greenhouse, Kent Christianson, Scott Johnston, Zu Kim University of California, Berkeley
CALIFORNIA PARTNERS FOR ADVANCED TRANSIT AND HIGHWAYS


San Joaquin Rail Corridor Crossing Survey T.O.6201
Final Report
San Joaquin Rail Corridor Crossing Survey
March 3, 2008
Prepared for
Caltrans Task Order #6201: San Joaquin Rail Corridor Crossing Survey
by
Visual Detection Laboratory University of California, Berkeley
360 Minor Hall Berkeley, CA 94720
Daniel Greenhouse Kent Christianson
Scott Johnston Zu Kim
1


San Joaquin Rail Corridor Crossing Survey T.O.6201
San Joaquin Rail Corridor Crossing Survey Table of Contents Abstract 3 Introduction 3 Task I – Merging Crossing Databases 3 Task II – Near-Miss Database 12 Task III – SJRC Experimental Crossing Signal 15 Conclusions 27 Note on Figures Many of the figures in this report contain color information which is not reproduced in the printed version of this document. Please see the PDF format document, available online, to view the figures in color.
2


San Joaquin Rail Corridor Crossing Survey T.O.6201
San Joaquin Rail Corridor Crossing Survey Abstract In this project we have accomplished three goals. First, we have merged two existing, complementary databases in an effort to produce a single database that lists all the railroad crossings, and their known properties, in the San Joaquin Rail Corridor (SJRC). Second, we have demonstrated the practicality of using video data gathered from an existing Locomotive Video Data Acquistion System (LVDAS) to search for crossing violations in order to populate a database of crossing violations, which we term “near-misses”. By this means, crossings that are particularly susceptible to violations, considered a precursor to collisions, can be identified. Third, we have demonstrated a new in-pavement crossing signal based upon LED technology, that can serve to increase safety at crossings. Keywords: railroad crossing, crossing violation, crossing signal, San Joaquin Rail Corridor Introduction AMTRAK passenger and BNSF freight trains using the San Joaquin rail corridor (SJRC), each pass more than 600 crossings per one-way journey. Crossings are the site of collisions, and the risk of collisions limits the maximum speed that trains are allowed to achieve in the corridor. Limited speed, and collisions themselves, are costly and deleterious to the efficient and safe transport of goods and persons in the corridor. One would like to know what factors cause or predispose toward crossing collisions. Crossing collisions are difficult to analyze owing to their relative rarity. We have developed and installed a system that allows us to quantify crossing susceptibility to collisions by accumulating data concerning crossing violations, the precursors of collisions which are much more frequent than collisions themselves. This project was intended to accomplish three goals: (I) merging of two databases of SJRC crossings and their physical properties, (II) demonstration of feasibility of building a database of crossing violations (which we term “near-misses”) as observed by means of a digital video data gathering system mounted in an AMTRAK locomotive, and (III) demonstration of a new in-pavement crossing signal based upon LED technology temporarily installed at a test site on the SJRC. Task I: Merging Crossing Databases The original Volpe database with details of crossings in the SJRC was supplied to the Visual Detection Laboratory both as a Microsoft Access relational database file and a Microsoft Excel spreadsheet file, while the Federal Railroad Administration (FRA) information was available in Excel format only. We elected to merge the two databases into an Excel file, which should be acceptable for a database that is considered a reference or “snapshot” of a particular point in time. However, an Excel spreadsheet can easily be imported into Access, if desired, and the resulting file easily transformed within Access into a standard format. The careful steps we have taken to put the
3

San Joaquin Rail Corridor Crossing Survey T.O.6201
spreadsheet into a configuration compatible with a relational database are detailed below, should the end user wish to have the database in that format. While the particular number of rail crossings quoted for the SJRC in the original proposal for this project, as written by the former Principal Investigator of this project (who unfortunately can no longer can be queried) was 397, we have determined in the course of our work that the actual number is in fact much higher. Our final database for the SJRC and Volpe combined has 670 entries of which only two entries from the Volpe did not already exist in the SJRC information supplied to us. The disaparity of several hundred entries may be due to the fact that no “official” definition of the SJRC was found to exist. The resolution to this puzzle depends on the definition of “rail corridor”. Does it start in Oakland, Richmond, or Port Chicago? Does it end in Bakersfield or somewhere further north? Does one only count public crossings or private as well? Should discontinued crossings be included? What about crossings not at grade? What about crossings that are “new” in rural areas where a farmer (presumably) decides to drive (regularly) over the rail, at the same spot, between two parallel dirt tracks on either side of the line? Seen from an air survey the later scenario could be called a crossing and in fact something like that seems to account for at least one of the Volpe crossings. Spur lines and sidetracks can also generate crossings. The problem we faced was that no FRA format database was available to us that was officially labeled SJRC and that had crossings on that line and only on that line. Thus the overwhelming bulk of the work in generating the combined database was delineating a SJRC database in the first place. The current staff of the Visual Detection Laboratory were supplied a database (in spreadsheet format) that had over 500 crossing entries but we subsequently discovered that, while the number was a good deal higher than the 397 crossings quoted in the original proposal, the database was still very incomplete. We discovered this by extracting the latitude and longitude from the original database and plotting the results in Google Earth. See Figure 1 below.
Figure 1: Plot of original crossing database locations (left) and final database locations (right).
The leftmost picture has several “gaps” compared to the one on the right. On this scale, however, the gap that can most clearly be seen is in Kings County in the southern portion.
4

San Joaquin Rail Corridor Crossing Survey T.O.6201
Since plots in Google Earth were integral to completing the database we will elaborate how they were handled. From a given Excel file the columns representing crossing number, latitude, and longitude were extracted. The latitude and longitude were originally in the FRA database format (discussed below) and required some slight modifications. The resulting file (with 3 columns) was then saved in CSV (comma-separated value) format. A free, publicly available utility called Csv2kml (from http://www.tchartdev.com/csv2kml.htm) was used to convert from CSV to KML format; KML or kml stands for Keyhole Markup Language and is the standard file format for importing place markers or specific locations into Google Earth. After using the utility the resulting kml file could be put directly into Google Earth and the path of the markers could be followed by eye. This is how (large) gaps were identified. To fill in the gaps as well as check on the integrity of the data we were supplied, we needed a source. This was found at the FRA website (http://www.fra.dot.gov/). In particular the URL: http://safetydata.fra.dot.gov/officeofsafety/Downloads/Default.asp has downloadable highway-rail crossing inventories by state. Unfortunately, there is not an option to reduce the data to a finer grained level (i.e. the SJRC). We thus had the data for the entire state but in a format that meant we had to cull out only those sites falling within the SJRC. There was no “automatic” way to do this that we could discern and the data had to be selected out “by hand”. There were 16,751 crossing entries in the database for the state and we ended up with less than seven hundred in the SJRC database. To aid in this reduction, Ken Galt, the chief of the Railroad Crossing Safety Branch at Caltrans’ Division of Rail, sent us a kmz file with place markers showing, among other rail lines, the SJRC. This is seen in Figure 2, on the following page. A kmz file is a compressed version (“zipped”) version of a kml file, the latter being in ASCII text (i.e. not a binary file). Thus “unzipping” the kmz file should have given us a file in pure ASCII text. Unfortunately, while the resulting file worked fine in Google Earth, it was not pure text. Further contortions involving Microsoft Word were necessary to put it into a form that used only text. The idea here was to write a program to parse the kml file and extract the necessary information. Upon actual viewing of the kml file in a text editor we decided that doing this was more difficult than extracting the data directly from the FRA state database. Still the kmz file sent by Mr. Galt, at least when used in Google Earth, was a substantial help. The markers in Figure 2 could be overlaid with those, say, in Figure 1 and the routes compared. Searches and sortings were then done on the state database by latitude and longitude read off of Google Earth. The crossings falling within a small rectilinear box were extracted and were put (tentatively) into the SJRC database. This was then re-plotted and locations that didn’t match up with Ken Galt’s kmz file were either removed or marked for later verification. In this tedious, step-by-step manner, the SJRC was built up “by hand”.
5

San Joaquin Rail Corridor Crossing Survey T.O.6201
Figure 2: Major rail corridors in the state of California as seen in Google Earth.
The SJRC database we constructed thus had the format of the California rail crossing FRA database. The details of this format are too lengthy to reproduce here. Details are given in the FRA publications: U.S. DOT CROSSING INVENTORY FORM—DATA FILE STRUCTURE AND FIELD INPUT SPECIFICATIONS FORMAT FOR FRA INVENTORY FIELDS and FORMAT FOR FRA INVENTORY FIELDS - DATA ENTRY FIELD DESCRIPTION INVENTORY FIELD ORDER. These can be downloaded in pdf format from the FRA website— http://safetydata.fra.dot.gov/Objects/GxFile.pdf, or by clicking on the hyperlink called “current file specifications” at http://safetydata.fra.dot.gov/officeofsafety/Downloads/Default.asp. Upon examination of the Volpe source file we had been given and used as our “base”, a huge majority of the entries for fields 137 through 150 were blank and columns 151 and 152 were non-existent. While a specific tally was not done on the corresponding state FRA database, it appeared to have a majority of blanks for most of those fields (columns). Since the entries were overwhelmingly void,
6

San Joaquin Rail Corridor Crossing Survey T.O.6201
those fields were not reproduced in our SJRC database. Thus the SJRC (only) database had its last column (EF in Excel) representing field 136 of those 152 in the FRA format. As mentioned previously, since this was being put into Excel format some care had to be taken that the resulting file could be taken as a database (so-called “database normalization”). In particular duplicates had to be removed. Since there is no simple menu command to eliminate or even search out (en masse) duplicate entries in Excel, a rather involved procedure was used to get rid of repetitive crossing entries. We also searched visually on Google Earth for obvious errors—purported rail crossings in the middle of a building, a crossing number in the SJRC we built up matching one from Mr. Galt’s file but in a widely separated location, etc. But in a file with hundreds of crossings and roughly 100,000 cells, it is possible that some errors remain. Also our data is only as good as our source—the FRA state database. We also were very careful with our sorting routines in Excel. A wrong type of sort could misalign the columns making it useless as a database unless such a mistake were caught and undone or an earlier backup copy was available. As an additional precaution we spot-checked the data after every needed sorting to make sure that row alignment was preserved. After constructing and cleaning up the SJRC database, we took a look at the Volpe database. Its file format is short enough to be reproduced in its entirety: Volpe Data Format Fli-Map Based San Joaquin Corridor Grade Crossing Inventory This database contains one record for each road/rail grade crossing between Bakersfield, CA and Port Chicago, CA. It is based on video tapes and xyz coordinates obtained from the helicopter borne Fli-Map surveying system of John Chance Land Surveys, Inc. All data is based on the surveys that took place between 10/15/99 and 10/17/99. Only active crossings are in this list, crossings that appear to have been recently closed (e.g. Jersey Barriers blocking them ) were not included. Pedestrian, above and below grade crossings were also not included. Data fields end with "_fl" to indicate that the source is Fli-Map. CROSSING A unique Crossing ID. This Id is the DOT Crossing Identifier if the crossing could be found in the FRA Highway-Rail Inventory, otherwise it is a Volpe assigned number. REF_FL The Fli-Map reference number. This number is unique only within each flight ( the mapping required 6 flights ). Road crossings, above, below, or at grade, were assinged reference numbers ending with a "-3". In some cases the
7

San Joaquin Rail Corridor Crossing Survey T.O.6201
reference number is missing and in other cases the reference number does not end with "-3". These numbers should only be used as reference points when looking at the Fli-map data. ORDER_FL The order of the crossings sequenced from Bakersfield to Port Chicago. LOC_FL A general characterization of the crossing area and volume based on the Fli-Map video tape. RL - rural low volume ( agricultural / irrigation ) RN/L - rural normal to low volume RN - rural normal volume SL - suburban low volume SN - suburban normal volume SN/H - suburban normal to high volume UL - urban low UN/L - urban normal to low UN - urban normal UN/H - urban normal to high volume YARD - yard crossing / yard vehicles only ( low ) SKEW_FL The smallest angle between the road and the track(s) at the crossing based on the Fli-Map video tape. NUMTRKS_FL The number of tracks at the crossing based on the Fli-Map video tape. SIGHT_FL The visibility of the rail from the road near the crossing based on the Fli-Map video tape. valid values are : C - Clear P - Partially obstructed NC - Not Clear CUE_FL The distance to nearest road which might cause traffic to back up onto the tracks. If there are no roads nearby the value will be 'N'. In some cases where there was a potential traffic queue, the distance was not determined and only marked 'Y' for yes. HUMP_FL Whether or not the crossing is humped. Valid values are "Y" for yes, "M" for maybe, and "N" for no. In many cases it was very difficult to determine whether or not there was a hump from the Fli-Map videos alone, so this attribute may
8

San Joaquin Rail Corridor Crossing Survey T.O.6201
not be accurate. PROFILE_FL Whether or not profile data was created by John Chance Land Surveys, Inc. for this crossing. PAVED_FL whether or not the crossing is paved based on the Fli-Map videos. In a few cases it was difficult to determine and marked 'M' for maybe. "Y" means paved, "N" means not paved. LANES_FL The number of traffic lanes crossing the track based on the Fli-Map videos. The value for most roads is 2, one in each direction. ELEV_FL The elevation of the crossing in feet above sea level. Based on the xyz coordinates of the Fli-Map laser data. LATC_FL The latitude of the crossing based on the xyz laser coordinates of the Fli-Map data. LONC_FL The longitude of the crossing based on the xyz laser coordinates of the Fli-Map data. Longitude values should be multiplied by -1 to reflect the fact that they are in the western hemisphere. COMMENT_FL Comments about the crossing entered while looking at the Fli-Map video tapes. Reference contact : Gary Baker DTS-49 Volpe National Transportation Systems Center 55 Broadway Cambridge, MA 02142 (end of Volpe file format specification).
9

San Joaquin Rail Corridor Crossing Survey T.O.6201
The Volpe database file required some modifications from the form in which it was originally received. The “Volpe supplied” crossing numbers 100, 110, 130, 150 and 160 were replaced with D.O.T. (FRA) crossing numbers as follows in Table 1, below.
Volpe Supplied Number: Replaced with FRA Number: 100 756953E 110 028320G 130 028476F 150 028724C 160 029755E
Table 1: Changes to Volpe database crossing numbers These changes were deduced by visual inspection in Google Earth using the latitude and longitude in the Volpe data and comparing the resulting point with nearby points in the Galt/SJRC place markers. Some of these were obvious replacements and a couple were “judgment calls”. The “Volpe supplied” numbers 120 and 140 had no viable FRA crossing number replacements. These had a prefix “Volpe #” added to them in the crossing number column when the Volpe and SJRC databases were combined in order to clearly distinguish them. Additionally, the crossing number 028588W in the Volpe database could not be matched to any in the FRA database for the state. It was replaced with the crossing number 027488W based on latitude and longitude and comparison to Ken Galt’s crossing file. After these modifications to the Volpe data set, all the crossing numbers were compared to those in the SJRC (except the “Volpe supplied” numbers 120 and 140 as mentioned above) in order to make sure none of the Volpe crossings (sans 120 and 140) were without matches in the SJRC. A couple more crossings had to be added to the SJRC in order to bring everything into compliance. Then the databases were combined. The task of merging or joining tables in Excel is in fact not supported by Excel. In order to do this “database-type” task one needs either a rather complicated macro with additional editing in Visual Basic or an external program. We found a third-party program to accomplish this task at http://www.digdb.com/excel_add_ins/join_merge_tables_lists/.
10

San Joaquin Rail Corridor Crossing Survey T.O.6201
The nature of the combined file is best explained with the aid of a picture, as shown in Figure 3, below. Note that only the first 31 rows, and only three subsets of the 154 columns are reproduced here in this figure. The complete database, too large to be included in the print version of this report, can be found online at http://path.berkeley.edu/~zuwhan/railroad/sjrc.xls.
Figure 3: First 31 rows from an abbreviated version of the combined database. The combination of the SJRC and Volpe results in the first set of columns (A through EF), identical to the FRA format. Column EG denotes the crossings from the Volpe database. Since these are a subset (minus the “120” and “140” crossings mentioned above) of the SJRC they are matched across the row with column A. Since there are more SJRC crossings than Volpe crossings there are blank cells in the EG column (with a corresponding blank row from column EG to column EV. Columns EG to EV match up to the Volpe format. The penultimate column, EW, denotes whether there is a Volpe crossing to match the SJRC crossing. For example, while hard to read without magnification, the figure above shows the crossings in row two and in row six to be in both the Volpe and the SJRC. Thus column EW has a one in those rows. Rows 3, 4 and 5 are only in the SJRC and not in the Volpe thus giving a zero in column EW for those rows. As already noted the only crossings that are in Volpe and not in the SJRC are the “Volpe supplied” numbers 120 and 140. They are in the last rows (not shown above) in the database. Otherwise the SJRC is a superset of the Volpe. The final column contains various incidents (crossing violtaitons) that we found by analysis of the video footage. This will be described in the next section of this report.
11

San Joaquin Rail Corridor Crossing Survey T.O.6201
Task II: Near-Miss Database. In this task, we employed the Locomotive Video Data Acquisition System (LVDAS) previously installed by us at Caltrans’ request in their locomotive #2008, and fully describe in the Final Report to the California PATH project titled “Innovative Grade Crossing Safety Measures for the San Joaquin Rail Corridor” (contract #65A0089). A schematic representation is shown in Figure 4.
Figure 4. Schematic representation of Locomotive Video Data Acquisition System (LVDAS). Note the three cameras so as to be able to record images not just in the forward direction but
toward the sides as well, in order to capture full details of events at each crossing. For downloading data, the train computer can communicate with the yard computer via a wireless
connection, or the hard drive can be easily removed from the train computer. We used the LVDAS to begin the process of assigning near-miss events to the crossing at which they occur. This is a task unsuited to human observers because the violations may be numerous and the crossing at which they occur must be recorded contemporaneously if by human observation. In the initial design of the LVDAS we decided against requesting that rail personnel, such as the engineer, be asked to take on this task because it is both time consuming and potentially a safety hazard considering that it could prove to be distracting from best practices. Instead, we used a video-based system to record crossing violation data and employed an advanced machine vision algorithm, assisted by manual inspection of the video footage, to extract the particulars of each event from the stored data in the LVDAS. Those data were obtained by downloading them when the locomotive is at rest in Oakland. This could be done in two ways. One way, the preferred approach, was wireless transmission from locomotive to landside server maintained in the AMTRAK office. However, this approach proved unavailable to us for this project, owing to a relocation of the AMTRAK office, out of range of the wireless transmission. The other approach involved
12
San Joaquin Rail Corridor Crossing Survey T.O.6201
downloading data by hand directly from the locomotive. We accomplished this by swapping a pluggable hard drive in the LVDAS. A UC Berkeley lab assistant performed this task on a regular basis. The hard drive was then returned to the campus where our machine vision software was used to extract crossing violations. These were coded by crossing number and then placed into the crossing database (see Task I). The present project, being of small scope and short duration, planned only to demonstrate the feasability of this methodology in order to begin to populate the database. A subsequent project was envisioned to provide a larger number of database entries in order to allow statistically meaningful predictions of which crossings are most susceptible to collisions owing to a large number of crossing violations. We were successful in accomplishing this goal but it proved to be the case that the yield of crossing violations as a function of railroad miles traveled was extremely low owing to a number of factors. The locomotive in which the LDVAS was installed had to be at the front of the train, facing forwards, in order that the video data it acquired be useful. Often this locomotive, whose placement was not under our control, was not in the front position, often even in a backwards orientation. Only runs during the daytime hours in weather conditions with adequate visibility were capable of providing meaningful data. The locomotive often served other corridors besides the SJRC, hence much of the data acquired was not useful to us. In addition to these factors, the LVDAS system itself proved to be unreliable and only worked a certain portion of the time, and it was not within the budgetary means of this project to have the system removed and repaired by the vendor. Finally, the locomotive in which the LVDAS was installed was often out of service for extended periods for repair and maintenance by Caltrans during the term of this project. Consequently, and in spite of numerous runs to the Oakland yard to swap hard drives, and analysis of several hundred hours of video data, we were able to identify only five crossing violations. We have placed these into the rightmost column (#154) of the merged SJRC database, into the appropriate rows corresponding to the crossings at which the violations occurred: Row #128 – Crossing 28425V (van crossing right to left in front of train) Row #456 – Crossing 29603H (pickup truck crossing in front of train, left to right) Row #128 – Crossing 28425V (station wagon crossing left to right in front of train) Row #318 – Crossing 28673U (bicylist crossing left to right in front of train) Row #459 – Crossing 29606D (small truck crossing left to right in front of train) Interestingly, one of these crossings (#128) exhibited two violations among the total of only five incidents. While more data would need to be gathered for statistical significance, this particular crossing might prove to be a candidate for special attention. As stated earlier, the complete database, too large to be included in the print version of this report, can be found online at http://path.berkeley.edu/~zuwhan/railroad/sjrc.xls.
13

San Joaquin Rail Corridor Crossing Survey T.O.6201
A captured frame (from the forward facing frame camera only) of one of these incidents is shown in Figure 5 below. A video which shows the five crossing violations can be seen or downloaded at this URL: http://path.berkeley.edu/~zuwhan/railroad/incidents.avi.
Figure 5. Captured frame from video produced by LVDAS in moving locomotive. A crossing violation by a vehicle is clearly seen.
As a postscript, we have recently learned that Caltrans has removed the LVDAS from locomotive #2008 in order to install their own video recording system in this and other locomotives. Consequently, any additional analysis of video data from locomotives on the SJRC would require a retooling of our software to accommodate the format of the video system now in use.
14

San Joaquin Rail Corridor Crossing Survey T.O.6201
Task III: San Joaquin Rail Corridor Experimental Crossing Signal Project Site Physical Layout and Location Prior to our project, a CA-PUC project (FHWA #4-237, “In-Roadway Lights for Highway-Rail Grade Crossings- Kern County”, Principal Investigator Peter Lai) installed an innovative in-pavement LED-based crossing signal at the SJRC Poplar Street crossing in Kern Co. Such a signal ignites when the standard paired flashing light signal turns on. The rationale for such a signal is that it would present a sort of visual barrier that would deter motorists from crossing in front of an oncoming train. As part of our recent PATH project (TO-4138) we have discovered a means of optimizing the visibility of this new signal by adjusting its flash rate and flash geometry. We have also designed and commissioned the construction of an advanced controller that can cause the test signal at Poplar to operate with the parameters discovered to be ‘best’ in the lab studies that we completed. The controller needed only to be switched into service in order for the ‘best’ flashing configuration to be observable in the field. Our plan was to assemble an Expert Panel at the Poplar Street crossing in order to view the standard flash configuration presently in use in the CA-PUC project and then compare it to our preferred flash configuration. Such a test would require the transportation of the Panel members to the site plus intervention by BNSF signal personnel to make the swap (first to utilize our controller and then next to return to the native controller already in function). The site is shown in the next several figures.
Figure 6: An aerial view of the project site (with superimposed road labels) using Google Earth. Poplar Avenue runs north-south (vertical) while Madera Avenue runs east-west. The railroad track is the uppermost diagonal track running parallel to the two sides of
highway 43 (near Shafter, CA). 15
San Joaquin Rail Corridor Crossing Survey T.O.6201
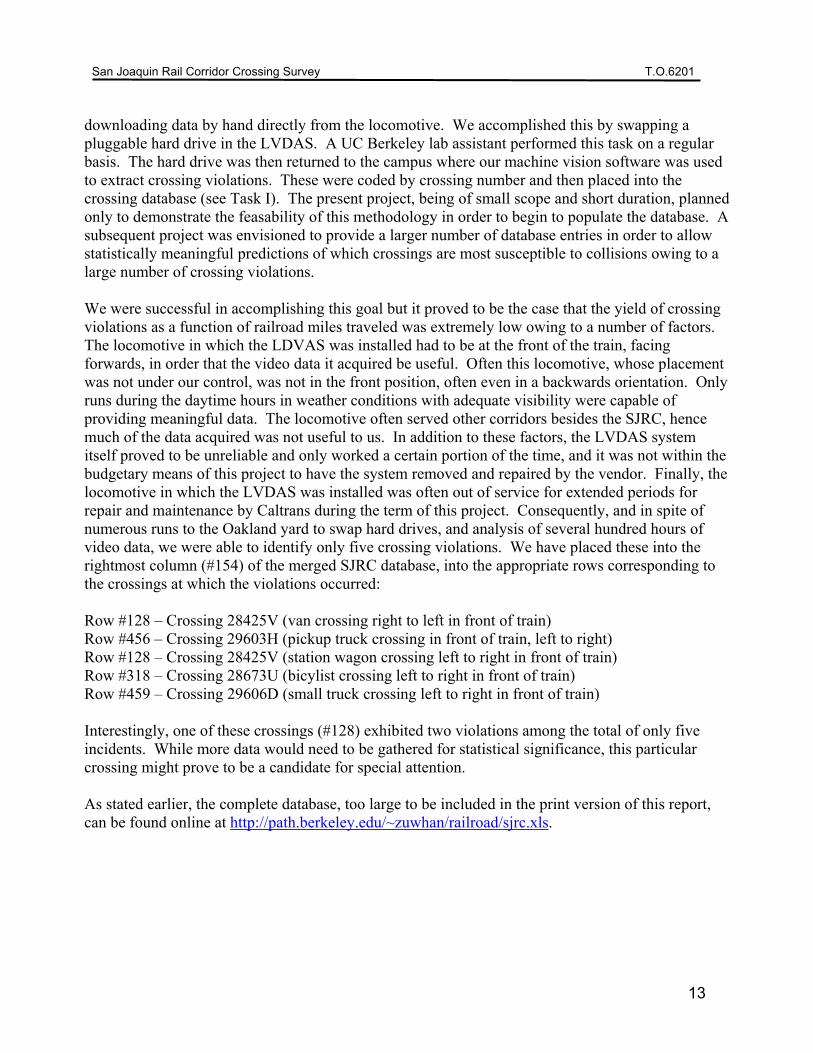
Figure 7: A map showing the site of the field test. The portion of Mr. Lai’s project used in this investigation consisted of five lights embedded in the pavement across southbound Poplar Avenue just north of the grade crossing. The light housings protruded just enough, on the order of a centimeter, to allow the lights themselves (a horizontal string of LEDs) to be visible above the pavement. While this allows the easy passage of vehicles over the lights, their small luminous area, a consequence of the short height, was perceived to be a problem, as described later in this section.
16

San Joaquin Rail Corridor Crossing Survey T.O.6201
The actual layout can be seen in the next two figures. The pictures were taken looking south along Poplar Avenue just north of the railroad tracks and Highway 43. The light housing at the end of the double yellow centerline just short of the left end of the white limit (double) line can be seen fairly easily in the first picture. The two lights to the left of this one (northbound side of Poplar) are less easily seen and the two to the right (southbound side) just before the white limit line are just barely visible in the photograph.
Figure 8: Grade crossing at Poplar Avenue looking south. The (five) embedded lights under
test run across the width of the road parallel to the white limit (double) line and just north (foreground) of it. Other than being too far to the right, the perspective of this photograph is
approximately that of a driver approaching the grade crossing.
17

San Joaquin Rail Corridor Crossing Survey T.O.6201
Figure 9: The same five embedded lights as seen from above and looking more easterly.
Figure 9 gives a better idea of the layout. The metal rectangle near the light in the middle of the southbound lane is the lid to a box containing an embedded magnetometer that was used in Mr. Lai’s project. Mr. Lai’s project was an effort to quantitatively establish the effectiveness of these embedded light signals as an aid to getting vehicles approaching the (ungated) grade crossing to slow and stop more quickly than heretofore upon approach of a train to the crossing. Unfortunately, the traffic volume was too low to generate sufficient statistics for analysis of near simultaneous automobile-train arrival at the crossing during the limited run of the experiment. Before the lights and associated equipment were permanently removed however, Mr. Lai was gracious enough to let the Visual Detection Laboratory “piggyback” our Task III observation on his setup, thereby saving the regulatory obstacles and great expense of duplicating this layout. Embedded Warning Signal – Regular and Modified The Lai project had the red embedded lights1 display the flashing pattern shown in Figure 10 when the lights were activated by the approach of a train. (This was in addition to the standard paired flashing light signal.) Disregarding the 300 ms period when all the lights stay on, the pattern basically consisted of all lights flashing in unison with 50 ms on and 100 ms off. This pattern was adopted without modification from that used at pedestrian crossings that had had embedded lights
1 The Lai project also had other embedded lights, specifically amber, beyond those shown above. These other lights were not part of task III and were not used.
18

San Joaquin Rail Corridor Crossing Survey T.O.6201
(albeit amber) put down along the crosswalk and used to signal to drivers that the crosswalk was in use. (Those lighted crosswalks partially inspired Mr. Lai’s project.)
Figure 10: "Standard" flashing sequence used during the CPUC experiment.
Based on previous laboratory experiments, the Visual Detection Lab felt that the signal pattern of the embedded lights could be changed so as to improve the signal’s effectiveness. The laboratory experiments had tested the reaction time of a number of observers who hit a response button upon seeing a given light pattern fire. Several patterns were tested. The best overall responses came from a pattern similar to that shown in Figure 11. (“Similar” because the lab test used four lights not five as shown here and the lighting sequence times were rounded off to those shown in the figure.)
Figure 11: Pattern and timing for field-deployed lights
We called the lighting pattern in Figure 11 the “Alternating Flashed Pair” (even though it consists of five lights) because it is very much like the flashing light pair used as the standard warning at railroad crossings. If the lights in this picture are thought of as being numbered from one to five as one moves left to right, then the pattern is basically the even numbered lights firing followed, after some “dead time”, by the odd numbered lights firing. The cycle then repeats.
19
San Joaquin Rail Corridor Crossing Survey T.O.6201
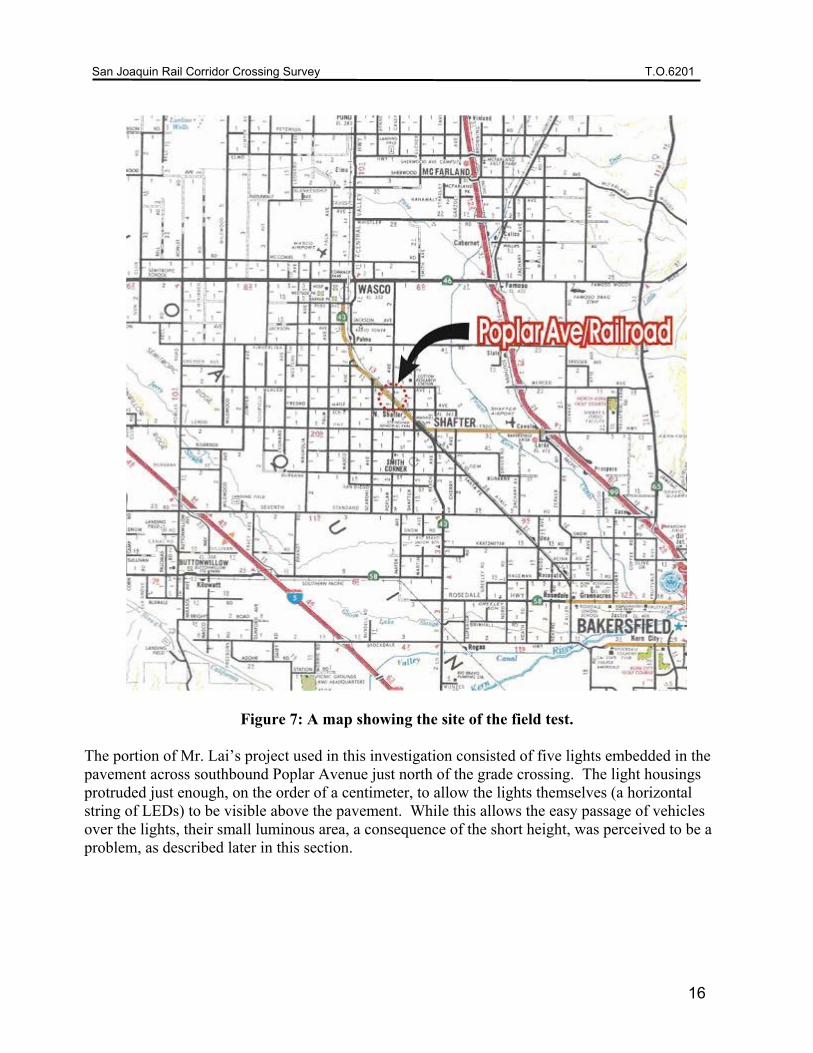
We believe that spatial as well as temporal variation in signals can increase their effectiveness, other factors (such as integrated light intensity) being equal. The combination of spatial and temporal variation can give rise to a phenomenon called apparent motion, where movement is perceived even though there is no physical movement present. Indeed, the standard flashing light pair at a railroad crossing evolved from a red lantern that was swung in an arc by a railroad worker. Since the human visual system evolved in part to spot motion of prey (and predators) we are more attuned to “moving” signals than static ones. The results of the laboratory study would seem to back this up. This is what motivated our choice of the pattern in Figure 11 for use in the field test. Alternate Controller The lights in the Lai project were activated by a controller that was triggered by the approach of a train. After discussions with the company that developed the embedded signaling system for Mr. Lai, the Visual Detection Lab determined, based on the advice of the contractor (LightGuard Systems, Inc.) that the original controller could not be reprogrammed to produce the Alternating Flashed Pair pattern. Thus the Visual Detection Lab designed our own replacement controller to signal the lights. To ensure compatibility with the embedded lights and the railroad equipment, LightGuard agreed to the actual construction of our design. The result is shown in Figure 12.
Figure 12: The alternate controller (right) and the rig used to test it (left). [“Korve” is the
name of the engineering firm that the Lai project used.]
During the field test Visual Detection Lab personnel swapped out the original controller used in the Lai project for this one.
20

San Joaquin Rail Corridor Crossing Survey T.O.6201
Field Deployment, Observations, and Evaluation The original intent for the use of this alternate pattern was to test it quantitatively after the “standard” pattern (Figure 10) ran in the Lai project. But since that project had insufficient statistics for a thorough quantitative analysis and since any test run of the alternate pattern would be greatly abbreviated in comparison to the original project, such a rigorous evaluation of the alternate pattern was not possible. Because the members of the proposed Expert Panel were not available to travel to the site during the brief period during which we were granted access to the site (with the embedded lights due for removal following completion of the PUC project), we elected to have Visual Detection Laboratory personnel view and record their observations of the field deployment. A time was scheduled that enabled both county traffic officials and BNSF personnel could be present, both groups’ presence being necessary for safety and legal reasons. Joseph E. Barton and Kent Christianson of the Visual Detection Laboratory made the trip to the Wasco/Shafter area to meet the county and railroad officials and conduct the test. To simplify the procedure, we used a commercially available inverter running off of a car battery to supply power to the system and obviate the need to use of the AC power within the railroad control box. This is shown in the Figure 13.
Figure 13: The inverter used to supply AC power is seen resting above the grill on the vehicle. This allowed complete isolation from the AC power in the railroad control box seen on the left.
21

San Joaquin Rail Corridor Crossing Survey T.O.6201
The inverter then supplied AC power to a heavy-duty DC power supply that in turn powered the low voltage (12 V) controller. The car battery was not used directly as a source of power because its output voltage, closer to 14 V under fully charged conditions, was outside the range allowed for the circutry in the controller. Employing the inverter and DC power supply was simpler than constructing voltage regulation circuitry to reduce the 14 V output of the car battery to the 12 V required by the controller. Alligator clip leads were used to connect the (low voltage) light wires to the new controller, which we placed adjacent to the original controller for this short-duration test (see Figure 14).
Figure 14: The heavy-duty DC supply rests on the board in the foreground. It is powered via the orange extension cord that comes from the inverter. Alligator clip leads were used to make
the remaining connections. The new controller rests near the lower right-hand corner of the open white control box.
Since the point of this exercise was to examine the effectiveness of the new pattern, the embedded lights were run when the train was not approaching. This was done for the safety of the personnel despite the fact that triggering-by-train-approach was necessarily built into the controller. Wiring up this additional capability was no longer needed at this point and would have merely represented an unnecessary additional complexity. Hence the lights were triggered manually when neither train nor
22

San Joaquin Rail Corridor Crossing Survey T.O.6201
vehicle traffic was at the grade crossing. The permanent, standard flashing pair warning signal continued to operate normally upon approach of a train after our experiment was over. A still photograph of the new pattern is shown below in Figure 15—embedded lights 2 and 4 are firing. The perspective is not too different from that of a driver approaching the grade crossing (perhaps a little closer to that of a passenger on the right). The lights are a little difficult to discern in the photograph printed in this report. While the dynamic nature of our experimental firing pattern improved upon the conspicuousness of these lights in relation to what can be conveyed in a still photograph, the improvement was not enough to make the embedded lights an effective signaling tool during daylight hours. The relatively low intensity of the embedded lights was a product of the installation carried out in the PUC experiment and thus beyond the control of the Visual Detection Laboratory.
Figure 15: The embedded lights firing the alternate pattern. Numbering the lights from left to
right from one to five, lights two and four are firing when this photograph was taken.
23

San Joaquin Rail Corridor Crossing Survey T.O.6201
In Figure 16 a close-up of a firing embedded light can be seen. Even though these lights use high brightness LEDs they can be difficult to see in direct sunlight. In comparison, the typical LED traffic lights are much more visible because 1) the number of LEDs is much greater and occupies a much greater area and 2) the traffic lights typically have a sunshade.
Figure 16: A close-up of one of the embedded lights as it is firing.
Given the difficulties involved in convening the BNSF and county officials during a narrow time window during the day, scheduling a test of this nature during the evening would have been formidably difficult to arrange, although the visibility of the embedded lights would have much improved. Nonetheless some feeling for the improvement of the signal’s visibility that could be gained at night can be garnered from the next picture. Figure 17 shows another close-up of the firing embedded light but this time it is in the shade of a handheld stop sign. A test during the night would have allowed much better discrimination between the alternate and standard patterns, but as mentioned above, arranging such a test under the time constraints that prevailed would have been insurmountably difficult.
24

San Joaquin Rail Corridor Crossing Survey T.O.6201
Figure 17: The conspicuousness of the firing light improves markedly when not in direct sunlight.
In our judgment, the signal strength of the embedded lights under daylight conditions, as would be seen from the viewpoint of drivers approaching the grade crossing, was too weak to allow judgments to be made regarding the superiority of any particular firing pattern based on this evidence alone. If the basic embedded signaling configuration could be redesigned to allow improved signal visibility during daylight hours then, based on previous laboratory tests, we are confident that the apparent motion visual stimulus generated by our firing pattern, employing both spatial and temporal components, would prove more effective than using mere temporally varying signals (as is the case with signals that merely flash on and off uniformly).
25
San Joaquin Rail Corridor Crossing Survey T.O.6201
Acknowledgements (Task III) For Task III of our project, the Visual Detection Laboratory would like to thank Peter Lai of the CPUC for allowing us to “piggyback” on his project thereby saving great expense. We would like to thank the FHWA, the California Traffic Control Devices Committee, the BNSF railroad, and the County of Kern Roads Department Traffic Engineering Division. With regard to the latter department we would especially like to thank Royce Edmiaston who was very helpful to us during the entire process. Juan Rivera of BNSF also deserves special thanks. He was able to schedule our test and provide the requisite safety personnel on very short notice. He also took the time to actually visit us on site although he was not required to do so. We would also like to acknowledge the help early on of Joaquin Siques, formerly of Korve Engineering (the engineering firm employed by Mr. Lai). He and Mr. Edmiaston kept us apprised of the numerous changes and challenges as Mr. Lai’s project proceeded.
Figure 18: Railroad and Kern County officials along with Kent Christianson (2nd from right) of VDL. Our great thanks to Juan Rivera of BNSF (3rd from the left) and Royce Edmiaston
(right end) of Kern County Roads Department.
26

San Joaquin Rail Corridor Crossing Survey T.O.6201
Conclusions: The major benefit of conducting this project was to complete the implementation of a data-gathering and analysis tool to study crossing violations (which we term “near-misses”) at rail crossings in the San Joaquin Rail Corridor (SJRC). The tool promises a much more fine-grained and valuable look at factors leading to rail crossing collisions. Our strategy was to build a database of the near-misses, those precursors of collisions, on the grounds that they are far more numerous than the collisions themselves and that they therefore can supply a statistically useful approach to rapidly identifying risk factors for collisions. The stage is now set for a larger-scale project to populate the near-miss database with sufficient data to allow statistically meaninful specification of which crossings in the SJRC are candidates for either equipment upgrade (e.g. placing gates where only signals are in place) or for decommission. While Caltrans has removed our Locomotive Video Data Acquisition System in favor of their own video technology, it is likely that their new system could be accessed, and our video analysis software modified, to allow additional data collection in the future. A secondary benefit was the merging of databases from mulitple government agencies in order to provide, in a single source, a current inventory of crossings in the SJRC. Finally, we have gained additional knowledge concerning the details of a proposed new technology to improve signaling at crossings. Such knowledge will prove to be be important if this fairly low cost technology can make meaningful inroads into the collision problem.
27