state of california regional water quality … · 7/4/2018 · measure aa and bay margin wetland...
TRANSCRIPT

STATE OF CALIFORNIA REGIONAL WATER QUALITY CONTROL BOARD SAN FRANCISCO BAY REGION
MEETING DATE: July 11, 2018
ITEM: 4
SUBJECT: EXECUTIVE OFFICER’S REPORT

Executive Officer’s Report 2 July 3, 2018

EXECUTIVE OFFICER’S REPORT: July 2018 A Monthly Report to the Board and Public
NEXT MEETING: July 11, 2018 WEBSITE: http://www.waterboards.ca.gov/sanfranciscobay/
Items in this Report (Author[s])
Measure AA and Bay Margin Wetland Restoration Projects (Naomi Feger and Keith Lichten) ................................................................................................................ 1
Stevens Creek Quarry (Christine Boschen) ................................................................ 2
Abandoned Mine Cleanup Program Accomplishments (Lindsay Whalin) ............... 3
Wastewater Mercury and PCBs Loads Update (Jerry Xu and James Parrish)......... 6
Board Priorities - Focus on Climate Change (Lisa Horowitz McCann) ..................... 7
Staff Presentations...................................................................................................... 10
In-house Training ........................................................................................................ 10
Enforcement Actions (Mary Boyd and Brian Thompson) ........................................ 11
401 Water Quality Certification Applications Received (Abigail Smith) ................. 11
Measure AA and Bay Margin Wetland Restoration Projects (Naomi Feger and Keith Lichten)
In June 2016, Bay Area voters approved Measure AA, a parcel tax raising $25 million per year for 20 years to pay for wetland restoration, flood management, and sea level rise adaptation projects around the Bay margin. The funds are overseen by the San Francisco Bay Restoration Authority, which in April approved the first round of Measure AA-funded projects. Projects receiving funding included already-permitted projects such as the South Bay Salt Pond Restoration Project, the South Bay Shoreline Levee Project, and several North Bay wetland restoration projects. Future Measure AA funding is anticipated to support projects that are not yet permitted, leading to a need to permit many projects in addition to our regular permitting load. Over the past year, a multi-agency team has collaboratively developed an approach to ensure those projects can be efficiently designed, permitted, and constructed. The approach included a set of performance measures.
At its June 1 meeting, the Restoration Authority’s Governing Board authorized disbursement of up to $650,000 annually for five years to provide approximately 50 percent of the needed support for the proposed Bay Restoration Regulatory Integration Team, a coordinated team of agency staff dedicated to reviewing and approving Measure AA-funded projects. The team would be housed at the Army Corps of Engineers’ offices in San Francisco and would include a

Executive Officer’s Report 2 July 3, 2018
staffer from the Water Board, as well as from the Corps, U.S. Fish and Wildlife Service, National Marine Fisheries Service, State Department of Fish and Wildlife, and the Bay Conservation and Development Commission. It is anticipated that additional funding would come from Bay Area project sponsors and other funding entities. In addition to funded projects, any project that is deemed eligible for Measure AA funding could be included in the team’s workload. In addition, the team will develop guidance to assist project sponsors in design and will develop a list of initiatives to increase efficiencies in permitting or resolve policy issues, such as how to consider the placement of fill for shallowly-sloped “ecotone” levees that can maintain salt marsh habitat in the face of anticipated sea level rise. Contingent on funding, we anticipate the team moving into action in early 2019.
Stevens Creek Quarry (Christine Boschen)
At the June 13 Board meeting, a member of the public inquired as to the Board’s role in regulating Stevens Creek Quarry (Quarry). The Quarry is in the Coast Range hills in Cupertino, in the next valley south of the Lehigh Quarry, and just upstream of the Stevens Creek Reservoir. Quarry operations include aggregate mining, concrete recycling, and a small compost facility operated seasonally by the City of Cupertino. Because its activities are considered industrial activities with the potential to discharge pollutants to surface water, we regulate the Quarry under the statewide Industrial Stormwater NPDES General Permit. In addition, we coordinate with Santa Clara County, which regulates the Quarry under the Surface Mining and Reclamation Act.
Water Board staff inspected the facility in 2016 and 2017 and found opportunities for improvement in site operations that led to the issuance of notices of violation and requirements for the Quarry to submit technical reports intended to guide that improvement. Water quality concerns at the Quarry include:
• The potential for sediment and other pollutants to discharge from the working areas ofthe Quarry to nearby receiving waters (including two onsite creeks, Rattlesnake andSwiss creeks, and the Stevens Creek Reservoir) and the adequacy of onsite measures tocontrol pollutants prior to discharge; and
• The use of manmade sediment basins and flocculent in Rattlesnake Creek to controlsediment discharges from the Quarry before they discharge further downstream.
Our regulations generally require pollutant control to be accomplished prior to discharge to a receiving water like a creek and typically prohibit the discharge of chemicals like flocculants to a receiving water. Staff is continuing to work with the Quarry to improve operations and to evaluate the need for actions to address past discharges, including flocculant use. We will meet with Quarry staff later this month.
Also, as part of the Stevens Creek Toxicity TMDL development, we collected water samples in early 2018 from Stevens Creek Quarry discharges and their receiving waters that flow into the Stevens Creek Reservoir. This was done to identify if the Quarry discharges contribute any pollutants that might be responsible for the observed toxicity in Stevens Creek downstream of the reservoir. Staff plans to complete evaluation of this data in the next few months.

Executive Officer’s Report 3 July 3, 2018
Abandoned Mine Cleanup Program Accomplishments (Lindsay Whalin) In the San Francisco Bay Region, about 50 mines have been abandoned after mineral extraction and processing (Figure 1.), with many leaving behind a legacy of contamination that threatens the environment and human health. Almost half of these (23) are mercury mines, which are of concern because discharges to water can lead to high concentrations of the neurotoxin methylmercury in fish and shellfish consumed by people and wildlife, a widespread problem in the Bay and its tributaries for which fish consumption advisories have been issued. Staff have overseen the cleanup of five mines in the Region (including the primary contaminated areas of the New Almaden and Gambonini mercury mines as well as the Leona Heights sulfur mine) and are currently investigating and overseeing remediation at nine additional mines.
Figure 1. Known mines in San Francisco Bay Region.
In 2017, the threat of unaddressed mines to water quality was ranked in a desktop analysis and prioritization process. A summary of the approach and links to the prioritization results, project quality assurance documents, and a GIS layer that can be uploaded to Google Earth to obtain information and status on specific mines can be found on our webpage at:

Executive Officer’s Report 4 July 3, 2018
https://www.waterboards.ca.gov/sanfranciscobay/water_issues/programs/MinesCleanupProgram.html
Elements of our Region’s mine ranking strategy were adopted by the California Abandoned Mine Lands Agency Group, which has undertaken an effort to prioritize the State’s 47,000+ mines. Lindsay Whalin has represented our Region in this group and participated in this effort.
Three mercury mines in the Region (St. John’s and Hastings mines in Solano County and Chileno Valley mine in Marin County) were identified as priorities for inspection due to commodity toxicity, mine productivity, onsite ore processing, potential or known presence and mobility of mining waste, and connectivity to impaired State waters that have fish consumption advisories issued due to mercury. In 2018, Board staff completed inspections of St. John’s and Hastings mines, producing comprehensive, site-specific inspection plans to investigate mine and hydrologic features prepared using satellite reconnaissance and data collected in the desktop analysis. (Figure 2.) illustrates areas of concern identified and then investigated during the inspection of St. John’s mine.
Figure 2. Areas of Concern at St. John's mine identified in desktop analysis.
In addition to visual observations of mine features, contaminant mobility, and hydrologic connectivity, staff measured concentrations of metals and metalloids from suspected wastes using a hand-held X-Ray Fluorescence Spectrometer (Figure 3.). The final inspection report for St. John’s mine can be found at: https://geotracker.waterboards.ca.gov/profile_report?global_id=T10000011123. Staff are awaiting results of seep water quality samples before publishing the inspection report for Hastings mine.

Executive Officer’s Report 5 July 3, 2018
Figure 3. Ore roasting furnace and mercury analysis with X-Ray Fluorescence Spectrometer by Nicholas Piucci.
Once initial investigations of priority mines are complete, staff will require comprehensive site characterization/risk assessments and will prepare cleanup orders as necessary, prioritizing mines with the most significant water quality impacts. That process can be lengthy, especially as we may need to search responsible parties going back over a century. Interim remedial efforts may be necessary at St. John’s mine given high concentrations of mercury found in
waste piles that are eroding into Rindler Creek (Figure 4.). Staff are working with the St. John’s mine property owners to evaluate whether mercury in the waste piles is in a form that can potentially be methylated.
Much work on this project was completed with the assistance of our Scientific Aids. Nicholas Piucci has been instrumental since June of 2017. Figure 4. Areas of Concern with high mercury concentrations eroding to
Rindler Creek (in light blue).

Executive Officer’s Report 6 July 3, 2018
Wastewater Mercury and PCBs Loads Update (Jerry Xu and James Parrish)
The loads of mercury and PCBs in wastewater discharges during 2017 were below the wasteload allocations for mercury and PCBs set by the Board in its 2006 and 2008 TMDLs. These allocations are specified in a watershed permit that the Board reissued most recently in 2017. As shown in Figure 5, 2017 mercury loads for municipal and industrial wastewater discharges – while relatively consistent with previous years – increased compared to the previous two years. Even with these increases, the mercury loads from municipal and industrial wastewater dischargers were 70 and 51 percent below the allocations.
Figure 5. Mercury Loads from 2008 to 2017.
The graphs in Figure 6 show that PCBs loads from municipal and industrial wastewater discharges were also well below the allocations. Similar to mercury, PCBs loads from municipal wastewater discharges increased, while PCBs loads from industrial wastewater discharges were consistent with previous years. Last year, PCB loads from municipal and industrial wastewater discharges were 57 and 61 percent below the wasteload allocations.
Figure 6. PCBs Loads from 2012 to 2017.
Spikes in mercury and PCBs loading from various years could be due to timing of samples, analytical variability, or mobilization of solids from the collection system. The increased mercury and PCBs loadings from municipal wastewater discharges can largely be attributed to the wet season in January and February of last year, which increased inflow and infiltration to collection systems and reduced pollutant removal efficiency during peak flows to treatment plants. The increased mercury loads from industrial wastewater discharges can mostly be traced to the Shell Refinery, which experienced two mercury effluent limit exceedances in
Executive Officer’s Report 7 July 3, 2018
January and February. This, in turn, significantly increased Shell’s annual mercury loading from the previous year. Regardless, the effluent limits adopted under the watersheds permit appear effective; the total mercury and PCBs loadings from the municipal and industrial wastewater dischargers have been consistently below the wasteload allocations by about half or more.
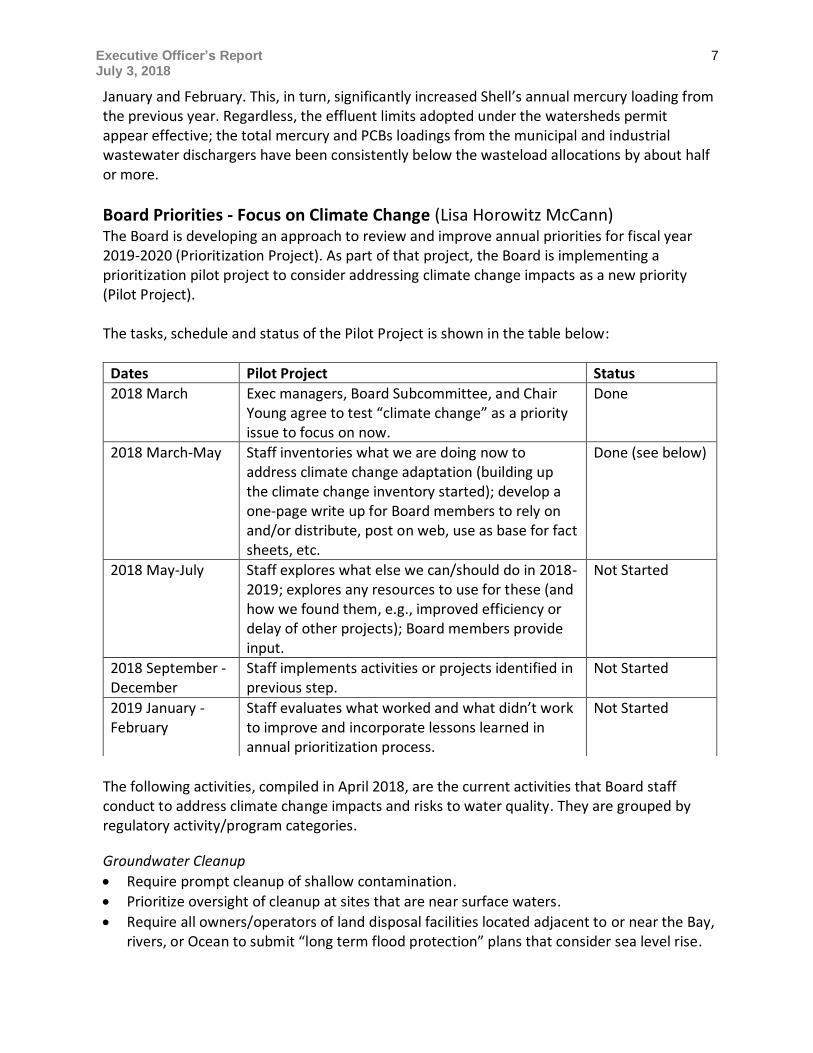
Board Priorities - Focus on Climate Change (Lisa Horowitz McCann)
The Board is developing an approach to review and improve annual priorities for fiscal year 2019-2020 (Prioritization Project). As part of that project, the Board is implementing a prioritization pilot project to consider addressing climate change impacts as a new priority (Pilot Project). The tasks, schedule and status of the Pilot Project is shown in the table below:
Dates Pilot Project Status
2018 March Exec managers, Board Subcommittee, and Chair Young agree to test “climate change” as a priority issue to focus on now.
Done
2018 March-May Staff inventories what we are doing now to address climate change adaptation (building up the climate change inventory started); develop a one-page write up for Board members to rely on and/or distribute, post on web, use as base for fact sheets, etc.
Done (see below)
2018 May-July Staff explores what else we can/should do in 2018-2019; explores any resources to use for these (and how we found them, e.g., improved efficiency or delay of other projects); Board members provide input.
Not Started
2018 September - December
Staff implements activities or projects identified in previous step.
Not Started
2019 January - February
Staff evaluates what worked and what didn’t work to improve and incorporate lessons learned in annual prioritization process.
Not Started
The following activities, compiled in April 2018, are the current activities that Board staff conduct to address climate change impacts and risks to water quality. They are grouped by regulatory activity/program categories.
Groundwater Cleanup
• Require prompt cleanup of shallow contamination.
• Prioritize oversight of cleanup at sites that are near surface waters.
• Require all owners/operators of land disposal facilities located adjacent to or near the Bay, rivers, or Ocean to submit “long term flood protection” plans that consider sea level rise.

Executive Officer’s Report 8 July 3, 2018
• For cleanup sites located in the San Francisco Bay margin, e.g., Hunter’s Point and Treasure Island, specifically require climate change adaptation or sea level rise strategies. Cleanup sites include facilities cleaning up past spills, leaks, and contamination, including Department of Defense (DoD) facilities.
• Require cleanup plans with schedules that will lead to reducing risk or meeting protective levels long before sea level rise impacts affect the contamination conditions.
• For DoD facilities undergoing cleanup and/or transfer for civilian reuse, comment that they must include implications of sea level rise and how addressed during the remedy selection process, preferably at the Feasibility Study stage (when remedial alternatives are first being considered), and again at the proposed plan stage when the preferred alternative is being considered.
Permitting Discharge and Bay/Wetland Fill
• Issue permits for capital projects such as Bay margin restoration projects (e.g., the South Bay Salt Pond Restoration Project and the South Bay Shoreline Levee Project), efforts to restore tidal marsh in the North Bay, and projects to protect existing development from the effects of sea level rise by coordinating with internal and external stakeholders, and identifying opportunities for flexibility within existing regulations. Examples of such flexibility include using anticipated sea level rise to recognize restoration elements like shallowly-sloped ecotone levees as net benefits, rather than fill requiring mitigation, or considering how thin applications of sediment to subsided diked former salt marsh tend to replicate the effects of sediment deposition from flooding, and thus are a net benefit leading to restoration, rather than fill requiring mitigation.
• Issue permits for ongoing operation and maintenance for flood management by working with local flood control agencies to: (1) consider how climate change may increase fluvial flooding (e.g., through increased backwater from higher tides or from increases in storm intensity) and (2) find opportunities to address this through methods that provide a net benefit to beneficial uses. Examples of these efforts include creation of floodplain benches along creeks where space is available, management of vegetation in a manner that mimics natural disturbance regimes to reduce fire fuel loads, and promotion of a healthy riparian corridor that more efficiently transports sediment, potentially reducing maintenance costs in the face of increasing numbers of sediment transport events.
• Require wastewater treatment plants that discharge to the Bay to consider sea level rise and climate change as part of evaluating nutrient upgrade options via the San Francisco Bay Nutrients Watershed Permit.
• Require dischargers of extracted and treated groundwater associated with groundwater cleanup of volatile organic compounds and fuels to regularly review and evaluate their facilities and operational practices to adapt to the potential impacts of sea level rise and storm surges.
• Require individually-permitted wastewater treatment facilities to consider climate change and sea level rise as part of required studies or reports.
• Coordinate and advise wastewater treatment facilities considering changes that address or will be affected by sea level rise.

Executive Officer’s Report 9 July 3, 2018
Planning and Policies and Regional Monitoring
• Update existing polices for wetland fill and use of treated wastewater in wetlands to address regulatory challenges for large-scale wetland restoration and shoreline adaptation projects. Support regional planning efforts and tool development for sea level rise adaptation, including the San Francisco Estuary Institute’s operational landscape unit project to identify shoreline adaptation strategies.
• Provide ongoing engagement in the Bay Regional Monitoring Program to assess trends in water quality, for example, impacts of nutrients, emerging contaminants, sediment supply and transport, and ocean acidification.
• Collaborate with partners in developing a Wetland Regional Monitoring Program for tidal wetlands that will evaluate the impacts of sea level rise and climate change on bay habitats.
• Provide expertise internally regarding climate science, adaptation strategies, and the Ocean Protection Council’s Sea Level Rise Guidance.
• Participate in regional planning efforts and interagency project development, such as Resiliency by Design, Marin County’s Vulnerability Assessment, and the Highway 37 Planning Process, to address climate change by providing guidance on our regulatory requirements and opportunities for flexibility to encourage development of innovative solutions that protect beneficial uses for future generations, (e.g., South Bay Shoreline Levee Project, Novato Creek Dredging Project, Bothin Marsh).
• Continue to work collaboratively through the LTMS program and stakeholders, State Coastal Conservancy, Bay Planning Coalition, San Francisco Bay Joint Venture, etc., to achieve goals of increasing beneficial reuse of dredge sediments to support restoration projects that provide shoreline resiliency and climate adaptation.
• Participate in national and regional workgroups and technical advisory groups that address climate change, sea level rise, and innovative solutions to improve the resilience of natural and built environment along the Bay and Pacific shorelines, e.g., San Francisco Bay Joint Venture, Bay Conservation and Development Commission’s Adapting to Rising Tides Program, and the Coastal and Ocean Resources Working Group of the Ocean Protection Council.
Water Recycling and Stormwater Management
• Issue permits for water recycling projects that improve the resilience of water supply, such as the City and County of San Francisco’s regulatory program for the reuse of non-potable water sources.
• Coordinate with local regulatory agencies to plan non-potable water reuse strategies, both public (e.g., municipal wastewater treatment facilities) and private (e.g., technology company campuses).
• Support the State Water Board’s Strategy to Optimize Resource Management of Stormwater (STORMS), which seeks to evolve stormwater management in California by considering it a valuable resource to be captured and put to multiple beneficial uses to improve water quality and supply.
• Regulate municipal stormwater discharges with increasing emphasis and requirements for green infrastructure and stormwater capture as beneficial strategies for water quality control.

Executive Officer’s Report 10 July 3, 2018
Board members and staff will review these activities and explore opportunities for additional or different activities. New activities will be considered for assignment and implementation if and as resources become available.
Staff Presentations
On May 31, the Water Board and the Bay Area Flood Protection Agencies Association (BAFPAA) co-hosted a Stream Management Planning Workshop. The workshop focused on how flood protection agencies and the Water Board use stream management programs, including their associated 5-year maintenance permits, to efficiently and predictably permit needed maintenance activities. It included a discussion of opportunities for improved permitting and how agencies are working to better understand their systems, allowing them to focus maintenance and reduce costs while improving water quality functions and values. It was attended by staff of flood protection agencies across the Bay Area, including both agencies with current maintenance permits (e.g., Marin County, Napa County, the Sonoma County Water Agency, and the Santa Clara Valley Water District), and those who anticipate soon applying for them (e.g., Contra Costa and San Mateo counties), as well as agency staff from the Water Board, State Department of Fish and Wildlife, U.S. EPA, and U.S. Army Corps of Engineers. Watershed Management Division Chief Keith Lichten and Napa Valley Flood Control District head Rick Thomasser organized the workshop, which was held in memory of Carl Morrison, the late former executive director of BAFPAA.
In-house Training
There were no in-house trainings held in June. In-house trainings are scheduled to resume in the fall.

Executive Officer’s Report 11 July 3, 2018
Enforcement Actions (Mary Boyd and Brian Thompson)
The following table shows the proposed enforcement actions since last month’s report. In addition, enforcement actions are available on our website at:
http://www.waterboards.ca.gov/sanfranciscobay/public_notices/pending_enforcement.shtml
Proposed Settlements The following are noticed for a 30-day public comment period. If no significant comment is received by the deadline, the Executive Officer will sign an order implementing the settlement.
Discharger Violation(s) Proposed Penalty
Comment Deadline
Lehigh Southwest Cement Company
Unauthorized discharge, violations of Cease and Desist Order interim effluent limits, and violations of NPDES effluent limits.
$301,000 July 23, 2018
Sewer Authority Mid-Coastside
11 unauthorized sanitary sewer overflow discharges
$600,000 July 25, 2018
401 Water Quality Certification Applications Received (Abigail Smith)
The table below lists those applications received for Clean Water Act section 401 water quality certification from April 11 through May 8, 2018. A check mark in the right-hand column indicates a project with work that may be in BCDC jurisdiction.
Project Name City/Location County May have BCDC
Jurisdiction
2018 Channel Bank Repair Projects Dublin Alameda
Union Sanitary District – Emergency Outfall Improvements Project
Union City ✓
Blackhawk Country CIub – Pond 11 Silt Removal
Blackhawk Contra Costa
Buchanan Field – Airport Business Park Project
Concord
Linton Terrace Embankment Stabilization-Culvert Replacement
Martinez
Hetfield Estates Residential Development Moraga
E-003 Outfall Repair Project Rodeo ✓
Crow Canyon Road Erosion Repair San Ramon
South San Ramon Creek – Erosion Repair at California High School
San Ramon
Arroyo San Jose - Emergency Bank Repair Novato Marin
201 Chula Vista – Ephemeral Drainageway Improvement
San Rafael ✓
Flanders Ottolini Ranch – Woodacre

Executive Officer’s Report 12 July 3, 2018
Wet Meadow-Pasture Headcut Repairs
Napa County Stream Maintenance Program Napa Napa
Upper York Creek – Ecosystem Restoration Project - Phase I
Saint Helena
Decarle Vineyard Bank Repair Saint Helena
Burlingame Interim Creek and Drainage Channel Maintenance Project
Burlingame San Mateo ✓
Harwood and Keystone Creeks Crossing -Stabilization Project
Loma Mar
Cordilleras Creek Routine Maintenance Redwood City ✓
Maintenance Dredging at South SF Ferry Terminal and Oyster Point Marina
South San Francisco
✓
459 Willow Street Bank Stabilization Project San Jose Santa Clara
Maintenance Dredging at USCG Station in Vallejo Marina
Vallejo Solano ✓
Vallejo Ferry Terminal Dredging Project Vallejo ✓
6500 Lakeville Highway – Waterfront Improvements
Lakeville Sonoma ✓
Speedway Sonoma – Sediment Removal from Detention Basins
Sears Point ✓