state of the art in java-based information visualization on mobile
TRANSCRIPT
State of the Art in Java-basedInformation Visualization on
Mobile DevicesBACHELORARBEIT
zur Erlangung des akademischen Grades
Bachelor of Science
im Rahmen des Studiums
Medieninformatik und Visual Computing
eingereicht von
Christian OsebitzMatrikelnummer 0426358
an derFakultät für Informatik der Technischen Universität Wien
Betreuung: Dipl.Ing. Bilal Alsallakh, Dr.techn.Dipl.Ing. Tim Lammarsch, Dr.techn.
Wien, 23.04.2015(Unterschrift Verfasser) (Unterschrift Betreuung)
Technische Universität WienA-1040 Wien � Karlsplatz 13 � Tel. +43-1-58801-0 � www.tuwien.ac.at


State of the Art in Java-basedInformation Visualization on
Mobile DevicesBACHELOR’S THESIS
submitted in partial fulfillment of the requirements for the degree of
Bachelor of Science
in
Media Informatics and Visual Computing
by
Christian OsebitzRegistration Number 0426358
to the Faculty of Informaticsat the Vienna University of Technology
Advisor: Dipl.Ing. Bilal Alsallakh, Dr.techn.Dipl.Ing. Tim Lammarsch, Dr.techn.
Vienna, 23.04.2015(Signature of Author) (Signature of Advisor)
Technische Universität WienA-1040 Wien � Karlsplatz 13 � Tel. +43-1-58801-0 � www.tuwien.ac.at

Abstract
Developers of mobile applications are facing the question of how information can be visualizedon mobile devices in an effective way. While modern mobile-based web browsers can supportthe development of interactive web-based visualizations, native mobile applications can cur-rently deliver significantly better performance in terms of speed and scalability in the volume ofdata.
However, due to limited resources available on mobile devices such as power supply, avail-able screen size and the capabilities of the operating system, desktop applications can not bereadily ported to mobile applications without accounting for these limitations. For example,although the Android mobile operating system is based on Java, it does not support Java appli-cations that use the built-in Java graphical libraries. When writing an application for visualiz-ing abstract data on Android-based devices the question occurred, whether there are alternativegraphical libraries satisfying the needs or whether it is necessary to implement this functionality.A search on the topic of information visualization on mobile devices revealed that it is a rela-tively new and active topic, with many software libraries and expert discussions being dedicatedto it. In this work, I first survey available information visualization libraries for developing Java-based Android mobile applications. I then summarize key features of the libraries includingsupported chart types, possible interaction with the charts such as zooming or panning and listkey figures reported by the library provider such as the number of downloads and the numberof mobile applications that use the library. As a result interested developers get an overview ofthese libraries along with a comparison of the key features and figures. Based on this overview,I select five libraries and conduct a detailed performance test by measuring rendering time andmemory usage on datasets having different sizes. Both measures should be taken into con-sideration when choosing a library for visualizing desired volumes of data on mobile devices.This is because these devices might impose limitations on memory and computational resourcesavailable for mobile applications.
i

Contents
1 Introduction 1
2 Related Work 3
3 Method 5
4 Overview of Libraries 74.1 Open source libraries . . . . . . . . . . . . . . . . . . . . . . . . . . . . . . . 84.2 Commercial libraries . . . . . . . . . . . . . . . . . . . . . . . . . . . . . . . 174.3 Discussion . . . . . . . . . . . . . . . . . . . . . . . . . . . . . . . . . . . . . 21
5 Comparison of Libraries Performance 255.1 Experiment . . . . . . . . . . . . . . . . . . . . . . . . . . . . . . . . . . . . 255.2 Duration . . . . . . . . . . . . . . . . . . . . . . . . . . . . . . . . . . . . . . 265.3 Memory usage . . . . . . . . . . . . . . . . . . . . . . . . . . . . . . . . . . 285.4 Lines of code . . . . . . . . . . . . . . . . . . . . . . . . . . . . . . . . . . . 295.5 Discussion . . . . . . . . . . . . . . . . . . . . . . . . . . . . . . . . . . . . . 30
6 Conclusion 33
References 35
iii

CHAPTER 1Introduction
The modern society is confronted with a data explosion. Stock trading at stock exchanges, enor-mous simulations on supercomputers and devices like MRI-scanners lead to a large amount ofdata [van Wijk, 2005]. Understanding abstract data is difficult. [Purchase et al., 2008] mentionthat computer graphics and interaction can enhance the cognition of abstract data. Visualizinginformation with graphics has the advantage that the abstract data will be represented not onlyverbally but also in a second, pictorial way. In many ways a graphic communicates more infor-mation than many words [Tversky et al., 2002]. Visualization has a growing role in a varietyof domain because it helps people to understand problems easier and make faster and betterdecisions [Chittaro, 2006]. [Tversky et al., 2002] shows that an effective way of expressing pro-cesses could be animation. [Tversky et al., 2002] also mentions that animation is a change overtime and that there are many different ways how this occurs from i.e. the simple movement of adot to a movement of the part of an object or system with respect to each other.
Information visualization can be created in various ways, e.g. with the use of commercialprograms like Microsoft Excel or Tableau, self-implemented programs or using programminglanguage specific libraries. Additionally, a variety of software libraries are available to allow thedevelopment of interactive visualizations as part of a software system.
The prognosis of [Gartner, 2013] shows that the shipment of devices with Android operat-ing system triple from 2012 to 2017. The shipment of PCs (desktop systems and notebooks)decreases on the contrary. For this reason, mobile devices such as tablets, mobile phones andultra-mobile PCs gaining increasing importance in the software industry.
Mobile devices come with limitations for the software. There is a difference between in-formation visualization on mobile and traditional devices. According to [Chittaro, 2006] and[Yoo and Cheon, 2006] there are hardware restrictions such as screen size, height/width ratioof the screen, CPU power and input devices. In addition to the hardware restrictions there arelimitations imposed by mobile operating systems, especially with Android. Google follows hisstrategy to use a common-programming language but not supporting the whole development kit.In the case of Android the Android-SDK is missing the AWT- and Swing-classes from the Javadevelopment kit (JDK). These are basic classes for information visualization with Java. [Delap,
1
Scott, 2007]. Libraries used on desktop-systems cannot be used on Android devices but mobileplatforms using the Java-SDK for mobile devices (Java-ME) are able to.
We are facing the question whether or not these Java libraries will meet the needs of in-formation visualization on mobile devices on Android. Do existing charting and visualizationlibraries fit the needs for data visualization on mobile devices? This work gives an overviewof existing libraries and their key figures to make better decisions to choose a library which isappropriate for the requirements of a given application.
The next chapter introduces some related work from the information visualization domain.Chapter 3 describes the methodology followed in this work, in particular, how available li-braries were found and compared which libraries were selected for detailed performance anal-ysis. Chapter 4 gives overview of found libraries and a detailed description and comparisonof these libraries. Chapter 5 reports the results of detailed performance test was performed forselected libraries, along with discussion of these results. Chapter 6 concludes with summary ofthe work, lessons learned, and future challenges in Java-based mobile visualizations.
2
CHAPTER 2Related Work
Interactive visualization in web browser based applications is the focus of [Lammarsch et al.,2008]. Several Technologies such as Java, Silverlight and Flash are compared against each otheron criteria such as animation, interactivity and future perspective. The study was conducted onstandard PCs without accounting for the restrictions that come with mobile devices (as men-tioned in Chapter 1). One of the main results is that there is no general solution. Each pro-gramming platform has its advantages and disadvantages. Simply porting visualizations fromdesktop computers to mobile devices is impossible due to the limitations of mobile devices[Chittaro, 2006]. The following papers focus on the design and enhancement of informationpresentation on mobile devices. [Chittaro, 2006] depicts that the design process of visualiza-tions on mobile devices differs from the traditional visualization because of the restrictions onmobile devices. The focus is how to design more effective visualizations and to avoid failures.Different information types have different needs so the information types handled in five mobilevisualization classes (text, pictures, maps, physical objects and abstract data). [Yoo and Cheon,2006] also show that the aspects of visualization distinguish on the type of information to visu-alize. The authors define three conditions for effective information processing. First, choose alayout based on the information type and an effective use of the limited screen. Second, use visu-alization algorithms optimized for mobile devices. Third, use animations for better recognitionof information change.
Information visualization with Java on mobile devices is a quite new area. This is whymuch information on this topic has been published in forums, blogs or conventional websites.One example is a popular entry on a question and answer (Q&A) website is [StackOverflow,2012]. The page is a discussion about good graphing packages for Android. Information aboutlibraries was posted and the libraries are ranked. The solution supported by the questioner calledRapidAndroid [Dimagi, 2009] has a description that the library is an implementation of a SMSgateway (send and receive SMS without mobile device). For this reason, it was not feasibe forus to test this library, and there were no additional information about charts on the product page.Therfore, this library is not considered.
3
Several other addressing similar questions such as [Reddit, 2013], often refer to [StackOver-flow, 2012].
4
CHAPTER 3Method
At the start of the project we decided to describe and compare the libraries based on informationpublished on product sites. The search started with academic search engines Google-Scholarand CiteSeerX. The following terms were used as search keywords:
• graphics
• charts
• Android
• library
The result was not satisfying because it’s a relatively new area with few related results. The nextstep consisted of searching the web with the same keywords using Google as a search engine.One noteable search result was the (Q&A)page described in Chapter 2 [StackOverflow, 2012]. Avariety of Java-based charting libraries for mobile devices were proposed by various contributorsto the discussion on this page. These libraries, along with other ones returned by our search havebeen collected and analyzed for relevance to this work based on the following criteria:
1. Popularity of the libraryA large number of downloads and mobile applications using the library is an indication ofuser acceptance
2. License / priceIs the library commercial or distributed under an open source license? If the library wascommercial the price was noted, and the possibility of a testing a trail version is reported
3. Last activityIs the Library still under development? This is measured by the existence of new releases,software fixes, and feature enhancements
5

4. ChartsWhich chart types are supported
5. InteractivityIs interaction with the chart possible? Example interactions are zooming and panning
6. Additional informationThis includes special features provided by the product page that are worth considering,such as capability of GPU rendering
In the next step some libraries were picked based on the information on number of chartsand the reported performance of the libraries. For each library a performance test with paral-lel coordinates chart with a large amount of lines was created and the results were comparedaccording to the following criteria:
1. DurationTime to render the chart
2. Memory usageMemory used by the app with and without drawing the lines
3. Lines of CodeNumber of lines of code to draw the chart
Chapter 5 outlines major advantages and disadvantages of the libraries selected for performancetest.
6

CHAPTER 4Overview of Libraries
This section presents the results of the research on visualization libraries for mobile devices.The results are compared in the next table to give an overview. The table is ordered descendingby the number of downloads and the number of supported chart types.
Library Distribution License /price from
Lastactivity
Numberof charts
Interac-tivity
Additional infor-mation
AChartEngine[AChartEngine,2015]
Version 1.1: 40.742downloadsVersion 1.0 26.510downloadsTotal: 3.000 mobileapplications
Apache Li-cense v2.0
May 2013 12 ZoomPan
-
charts4j[charts4j, 2013]
Version 1.3: 21.026downloads
MIT Li-cense
January2011
8 Zoom Uses Google chartsAPI. Calculation inthe cloud
Androidplot[Androidplot,2013]
Version 0.6: -Total: 500 mobileapplications
Apache Li-cense v2.0
Septem-ber 2014
5 PanZoom
supports dynamicand static charts
AFreeChart[AFreeChart,2011]
Version 0.0.4:10.237 downloads
GNULGPL
April2012
9 - Based onJFreeChart 1.0.13
Chartdroid[Chartdroid,2015]
Version 2.0: 8.849downloadsTotal: 5 mobile ap-plications
Apache Li-cense v2.0
Novem-ber 2010
5 - -
GraphView[Gehring, 2015]
Version 4.0: -Total: 26 mobile ap-plications
GNULGPL
Decem-ber 2014
2 Zoom -
Snowdon [Snow-don, 2015]
- Apache Li-cense v2.0
- 6 - -
Droidcharts[Droidcharts,2015]
- GNULGPL
Novem-ber 2010
5 - Attempt to portJFreeChart toAndroid
7
HoloGraph-Library [Nadeau,2013]
- Apache Li-cense v2.0
April2014
3 - -
Processing [Pro-cessing, 2015]
- GNULGPL
February2015
- Zoom create graphicswith textures,shades
RChart[Java4Less,2015]
Version 2.2: - 45,5$ April2012
14 ZoomPan
3D line, bar and piechartBar with images in-stead of label
aiCharts [Artful-Bits, 2015]
Version 1.7: -Version 2.0 beta: -
299$ - 14 ZoomPan
-
ShinobiCharts[Controls, 2015]
Version 1.7 995$ - 9 - GPU rendering
Android chart li-brary [NiftyMo-bileApps, 2015]
Version 1.0: - 99$ - 6 - -
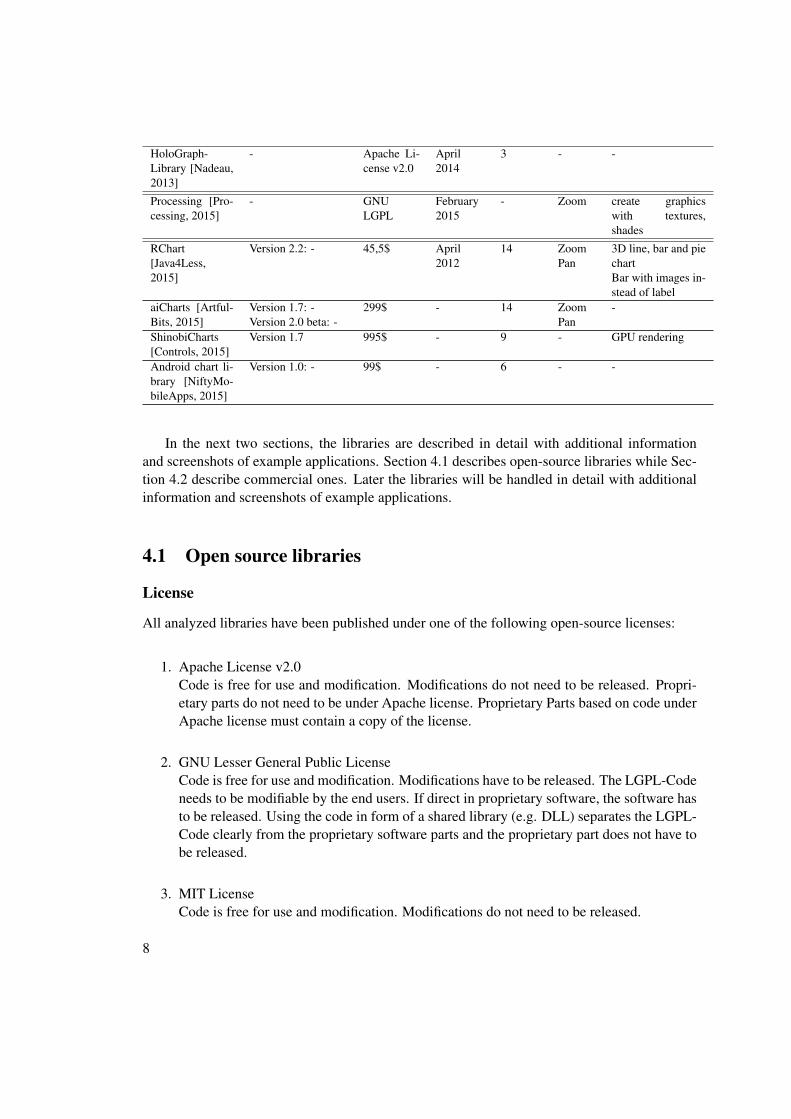
In the next two sections, the libraries are described in detail with additional informationand screenshots of example applications. Section 4.1 describes open-source libraries while Sec-tion 4.2 describe commercial ones. Later the libraries will be handled in detail with additionalinformation and screenshots of example applications.
4.1 Open source libraries
License
All analyzed libraries have been published under one of the following open-source licenses:
1. Apache License v2.0Code is free for use and modification. Modifications do not need to be released. Propri-etary parts do not need to be under Apache license. Proprietary Parts based on code underApache license must contain a copy of the license.
2. GNU Lesser General Public LicenseCode is free for use and modification. Modifications have to be released. The LGPL-Codeneeds to be modifiable by the end users. If direct in proprietary software, the software hasto be released. Using the code in form of a shared library (e.g. DLL) separates the LGPL-Code clearly from the proprietary software parts and the proprietary part does not have tobe released.
3. MIT LicenseCode is free for use and modification. Modifications do not need to be released.
8
AChartEngine
[AChartEngine, 2015] is the widely distributed library. 3.000 mobile applications use this li-brary. Twelve kinds of charts are supported and the interactions zoom and pan are possible. Inthe last three years two new versions have been released. This indicates that further updates ofthe library are likely. Figure 4.1 shows examples for three charts: a line chart, a range chart anda combination of line and area chart.Supported charts:
• line chart
• bar chart
• doughnut chart
• pie chart
• scatter chart
• area chart
• time chart
• bubble chart
• range (high-low) bar chart
• dial chart / gauge
• combined (any combination of chart)
• cubic line chart
9

Figure 4.1: A line chart, a range bar chart and a combined chart generated using AChartEngine[AChartEngine, 2015]
charts4j
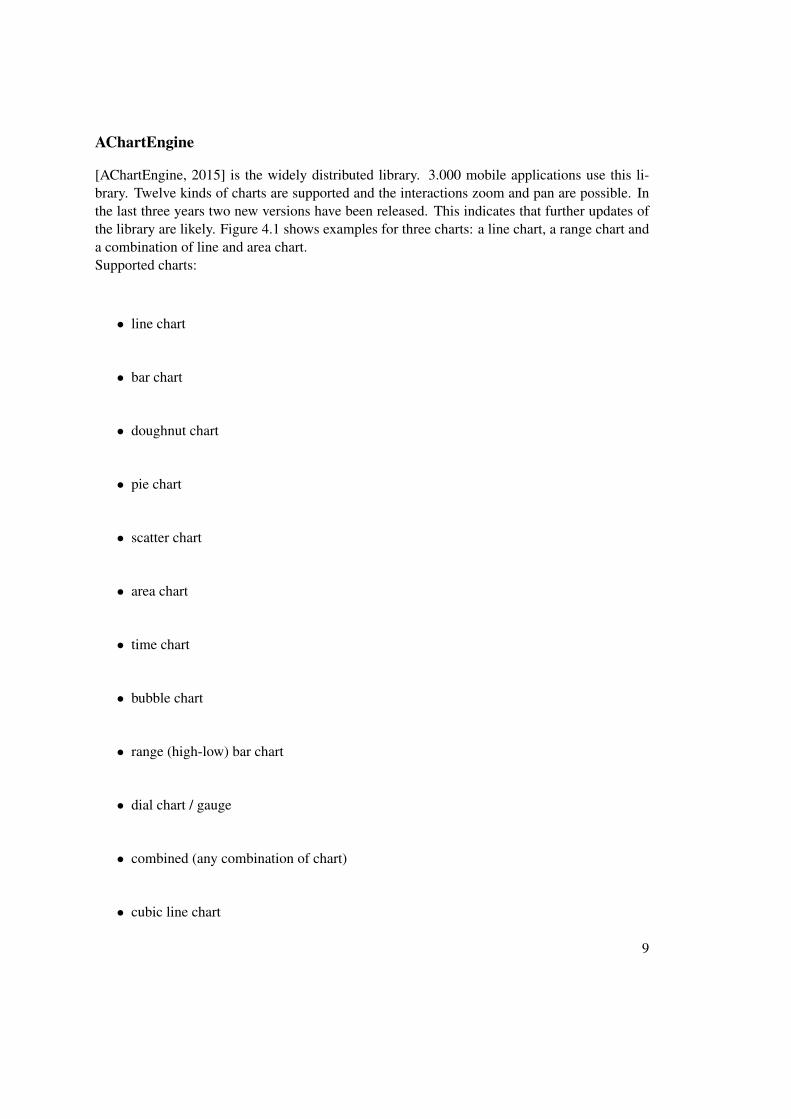
[charts4j, 2013] uses the Google charts API to create charts. This means that an internet connec-tion is necessary to create a visualization. The library supports many features of the Google charttools, which are deprecated. Eight different types of charts are possible. Last change occurredapproximately four years ago. It’s possible that no new enhancements are planned. Figure 4.2shows a radar chart and some basic line and bar charts.
Supported charts:
• line chart
• bar chart
• pie chart
• scatter chart
• radar chart
• XY chart
• map chart
• Venn chart
10
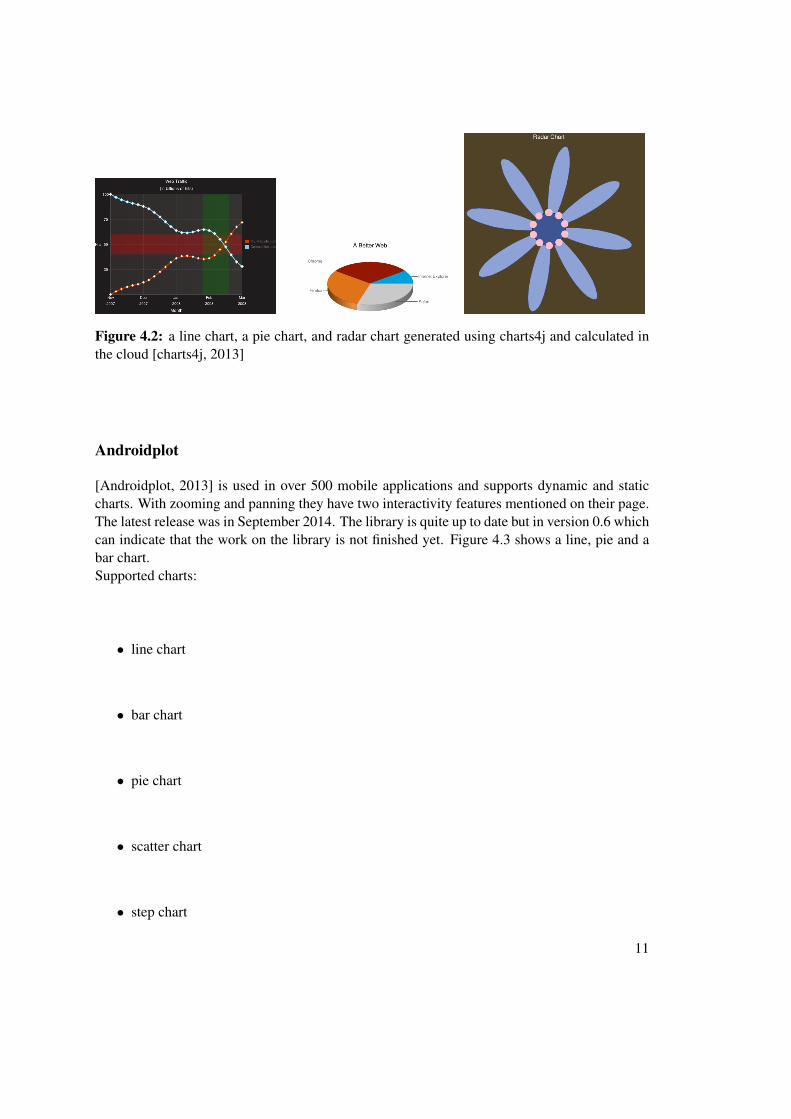
Figure 4.2: a line chart, a pie chart, and radar chart generated using charts4j and calculated inthe cloud [charts4j, 2013]
Androidplot
[Androidplot, 2013] is used in over 500 mobile applications and supports dynamic and staticcharts. With zooming and panning they have two interactivity features mentioned on their page.The latest release was in September 2014. The library is quite up to date but in version 0.6 whichcan indicate that the work on the library is not finished yet. Figure 4.3 shows a line, pie and abar chart.Supported charts:
• line chart
• bar chart
• pie chart
• scatter chart
• step chart
11
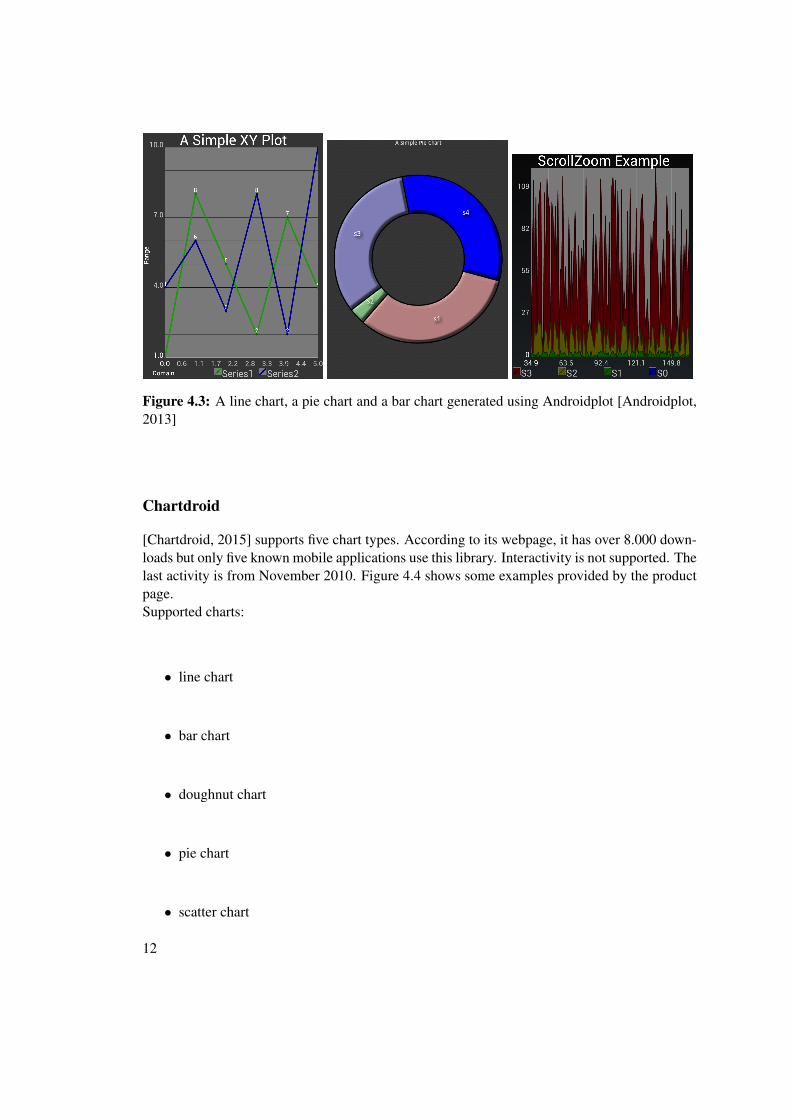
Figure 4.3: A line chart, a pie chart and a bar chart generated using Androidplot [Androidplot,2013]
Chartdroid
[Chartdroid, 2015] supports five chart types. According to its webpage, it has over 8.000 down-loads but only five known mobile applications use this library. Interactivity is not supported. Thelast activity is from November 2010. Figure 4.4 shows some examples provided by the productpage.Supported charts:
• line chart
• bar chart
• doughnut chart
• pie chart
• scatter chart
12

Figure 4.4: Line and pie chart generated with Chartdroid [Chartdroid, 2015]
AFreeChart
[AFreeChart, 2011] is based on JFreeChart 1.0.13. It supports many of the features of JFreeChartbut not all. Eight chart types are supported. No information could be found about interactiv-ity. Since April 2012 there has been no further activity. The Library is in Version 0.0.4. Theperspective of the library is hard to predict. JFreeChart will be enhanced [JFreeChart, 2011] soit’s possible that new features will be ported to AFreeChart. Figure 4.5 shows a special type ofchart: a vector chart. Additional candlestick and pie charts are shown.Supported charts:
• line chart
• bar chart
• pie chart
• scatter chart
• area chart
• candlestick chart
• vector chart
• combined charts (any combination of the above charts)
13

Figure 4.5: Candlestick, pie and vector chart generated with AFreeChart [AFreeChart, 2011]
GraphView
[Gehring, 2015] allows interactivity by zooming. The library only supports two types of charts.The last release was in August 2013. That means, that the library is relatively new. Figure 4.6shows a line and a bar chart provided by the product page.Supported charts:
• line chart
• bar chart
Figure 4.6: Line and bar chart generated using GraphView [Gehring, 2015]
Snowdon
Little information could be found on the webpage of [Snowdon, 2015]. The library supportsdifferent types of charts such as histogram and heat maps. Figure 4.7 shows a heat map generated
14

using Snowdon and a line and scatter chart.Supported charts:
• line chart
• bar chart
• area chart
• scatter chart
• histogram
• heat map
Figure 4.7: Line chart, heat map and scatter chart generated using Snowdon [Snowdon, 2015]
Droidcharts
[Droidcharts, 2015] is another attempt to port JFreeChart [JFreeChart, 2011] to the Androidplatform. Five chart types are supported. The latest activity was in November 2010 means thatAFreeChart is a two year younger attempt with more functionality. No screen-shots were found.Supported charts:
• line chart
• bar chart
15

• pie chart
• XY line chart
• category bar chart
HoloGraphLibrary
[Nadeau, 2013] is a new library and started in February 2013. The last activity was in April2014. Currently the library supports three types of charts but because it’s a new library updatesshould bring further charts. Figure 4.8 shows sample charts provided by the product page.Supported charts:
• line chart
• bar chart
• pie chart
Figure 4.8: A line chart, a pie chart and bar chart generated using HoloGraphLibrary [Nadeau,2013]
Processing
[Processing, 2015] is a programming language, development environment and online commu-nity are available. The development of Processing started in 2001. With version 2.0 they in-troduced an Android and a JavaScript mode. The Android version of Processing is still in Beta
16

state. In contrast to the other libraries Processing is not a charting library. It provides graphicsfrom the sketch. Charts must be implemented by the developer. Figure 4.9 shows sample graph-ics provided by the product page.Supported graphical objects:
• 2D primitives
• 3D primitives
• (Bezier-)Curves
Figure 4.9: 3D, vector and bezier graphics created with Processing [Processing, 2015]
4.2 Commercial libraries
The commercial libraries do not report the number of downloads and mobile applications thatuse the library. Only basic information such as chart types are made public.
RChart
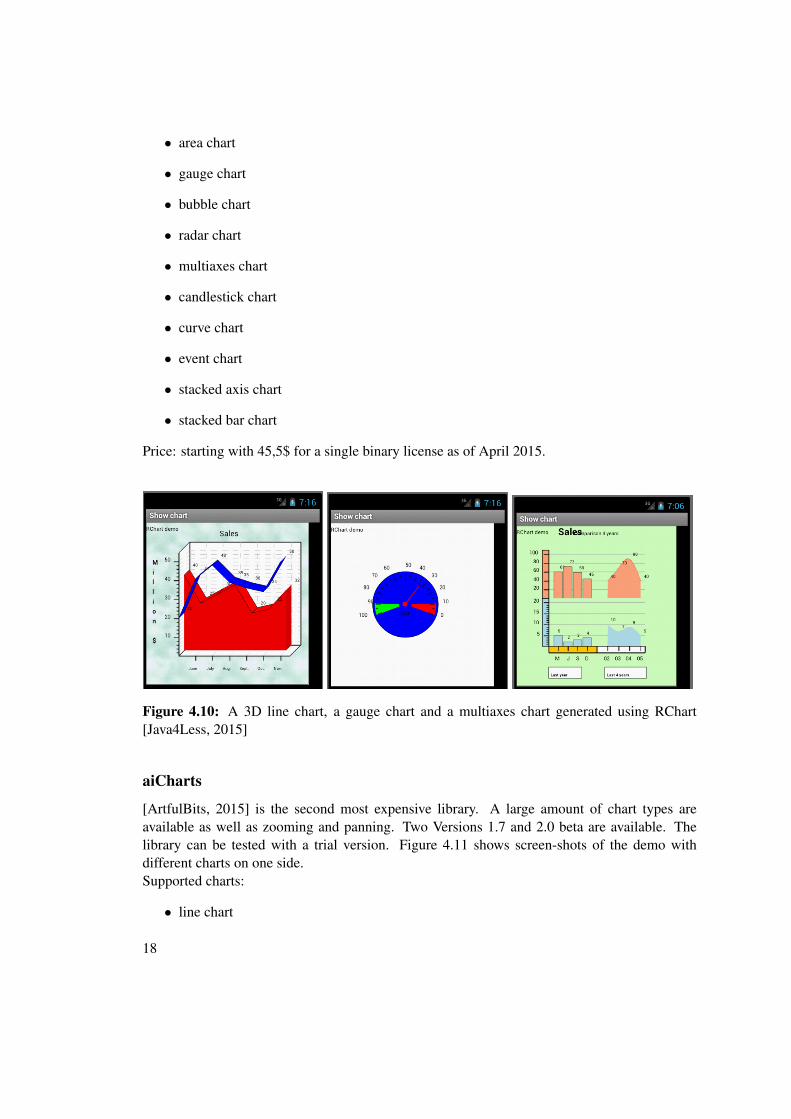
[Java4Less, 2015] is the cheapest of the commercial libraries. It supports zooming and panningand is the only library with 3D charts (line, bar and pie). A demo version is available. Figure4.10 shows a 3D line chart, gauge chart and a multiaxes chart.Supported charts:
• line chart
• bar chart
• pie chart
• scatter chart
17
• area chart
• gauge chart
• bubble chart
• radar chart
• multiaxes chart
• candlestick chart
• curve chart
• event chart
• stacked axis chart
• stacked bar chart
Price: starting with 45,5$ for a single binary license as of April 2015.
Figure 4.10: A 3D line chart, a gauge chart and a multiaxes chart generated using RChart[Java4Less, 2015]
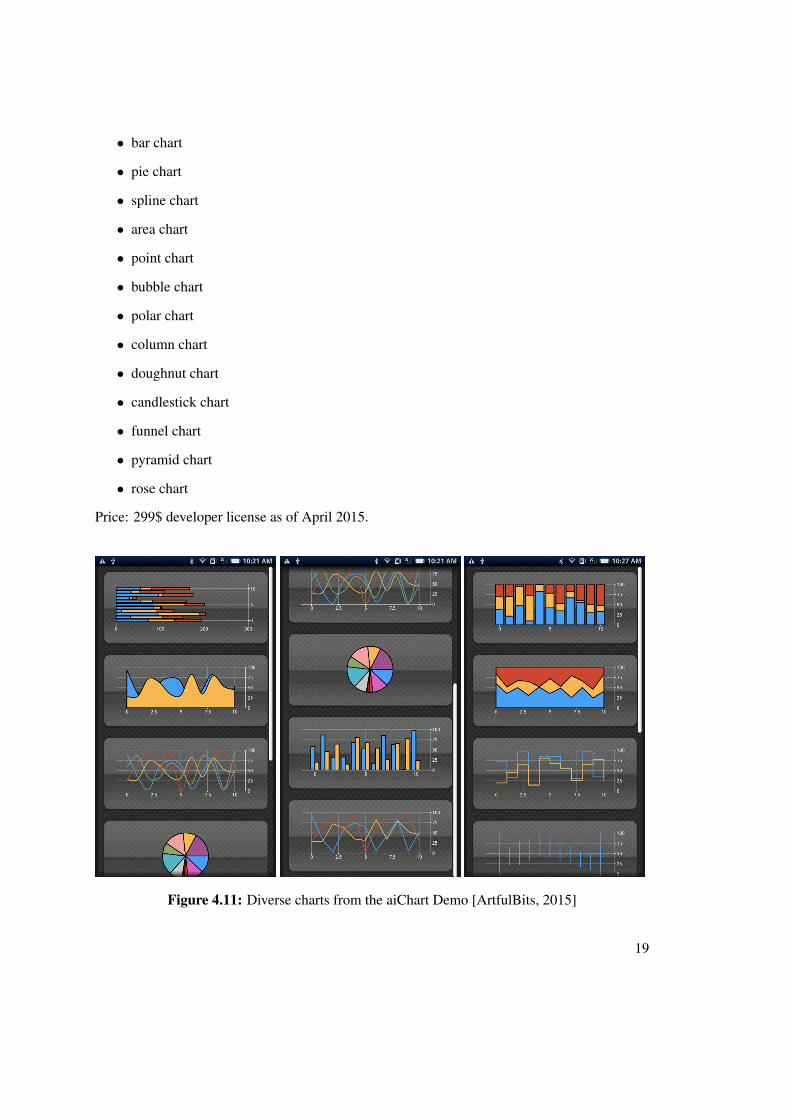
aiCharts
[ArtfulBits, 2015] is the second most expensive library. A large amount of chart types areavailable as well as zooming and panning. Two Versions 1.7 and 2.0 beta are available. Thelibrary can be tested with a trial version. Figure 4.11 shows screen-shots of the demo withdifferent charts on one side.Supported charts:
• line chart
18
• bar chart
• pie chart
• spline chart
• area chart
• point chart
• bubble chart
• polar chart
• column chart
• doughnut chart
• candlestick chart
• funnel chart
• pyramid chart
• rose chart
Price: 299$ developer license as of April 2015.
Figure 4.11: Diverse charts from the aiChart Demo [ArtfulBits, 2015]
19

ShinobiCharts
[Controls, 2015] has nine types of charts. The license cost is the highest. The library utilizes theGPU for rending the charts and should be very fast. Trial version can be downloaded. Figure4.12 shows a chart on a tablet and on a mobile phone.Supported charts:
• line chart
• bar chart
• pie donut chart
• scatter chart
• column chart
• histogram
• area chart
• stacked chart
• step chart
Price: 995$ per developer
Figure 4.12: Line and bar chart on tablet and mobile phone with ShinobiCharts [Controls, 2015]
Android chart library
[NiftyMobileApps, 2015] supports six chart types and is released in version 1.0. It has the fewestnumber of supported charts but is much cheaper than ShinobiChart and aiCharts. The demo appis available in the Google play store. Figure 4.13 shows some sample charts provided by theproduct page.Supported charts:
20

• line chart
• bar chart
• pie chart
• area chart
• point chart
• column chart
Price: 99$ developer license
Figure 4.13: Line, area and bar chart with Android chart library [NiftyMobileApps, 2015]
4.3 Discussion
In the sections above we get an overview of existing libraries. This overview is sorted by numberof downloads and mobile applications that use the library but which libraries are best in othercriteria e.g. number of chart types and time performance.
Number of charts
This section presents the results of number of supported chart types. The results are comparedin the next table to give an overview.
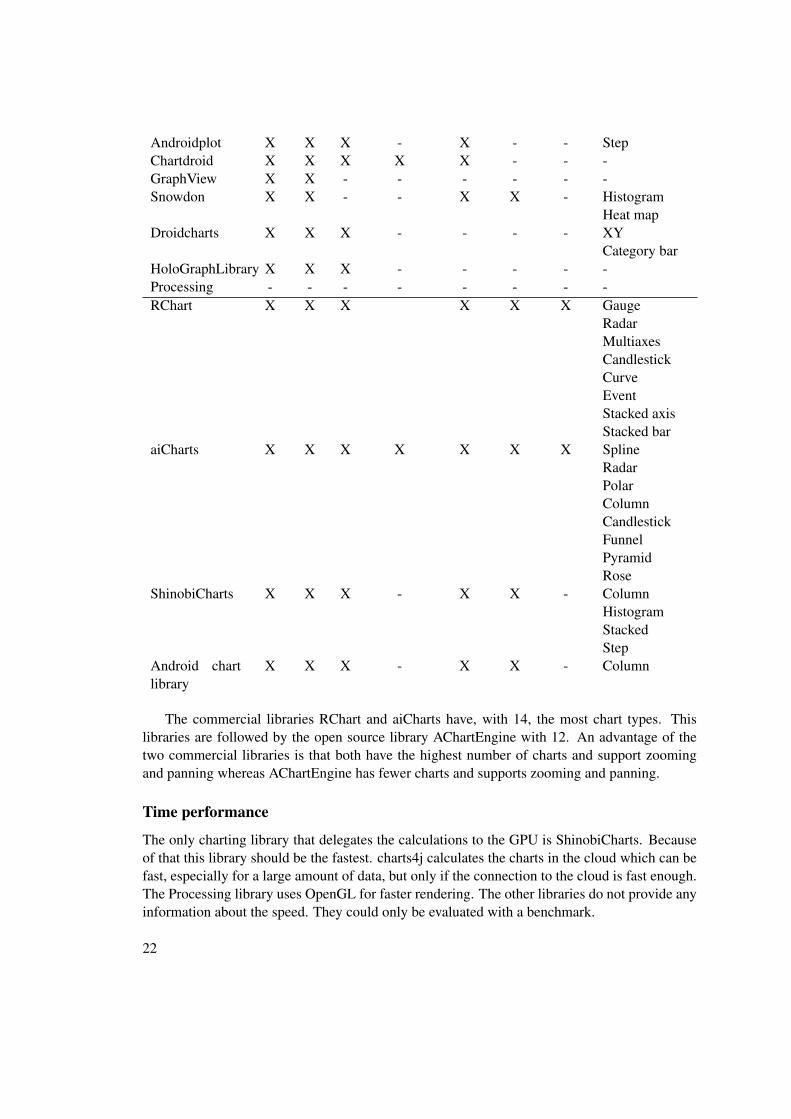
Library Line Bar Pie Doughnut Scatter Area Bubble Other chartsAChartEngine X X X X X X X time
range (high-low) bardial / gaugecubic linecombined
charts4j X X X - X - - XYRadarMapVehn
21
Androidplot X X X - X - - StepChartdroid X X X X X - - -GraphView X X - - - - - -Snowdon X X - - X X - Histogram
Heat mapDroidcharts X X X - - - - XY
Category barHoloGraphLibrary X X X - - - - -Processing - - - - - - - -RChart X X X X X X Gauge
RadarMultiaxesCandlestickCurveEventStacked axisStacked bar
aiCharts X X X X X X X SplineRadarPolarColumnCandlestickFunnelPyramidRose
ShinobiCharts X X X - X X - ColumnHistogramStackedStep
Android chartlibrary
X X X - X X - Column
The commercial libraries RChart and aiCharts have, with 14, the most chart types. Thislibraries are followed by the open source library AChartEngine with 12. An advantage of thetwo commercial libraries is that both have the highest number of charts and support zoomingand panning whereas AChartEngine has fewer charts and supports zooming and panning.
Time performance
The only charting library that delegates the calculations to the GPU is ShinobiCharts. Becauseof that this library should be the fastest. charts4j calculates the charts in the cloud which can befast, especially for a large amount of data, but only if the connection to the cloud is fast enough.The Processing library uses OpenGL for faster rendering. The other libraries do not provide anyinformation about the speed. They could only be evaluated with a benchmark.
22

Interactivity
Only a few libraries allow interaction with the charts. From the open source libraries theseare AChartEngine, Androidplot, charts4j, GraphView and Processing. Among the commerciallibraries, both aiCharts and RChart support interaction. The commercial libraries are in advan-tage because they support more chart types with zooming and panning. Androidplot supportspanning and zooming but only 5 types of charts. GraphView supports panning and zoomingbut only in line and bar charts. In AChartEngine zoom and pan are available. charts4j andProcessing allow zooming.
Future perspective of the open source libraries
The future of the commercial libraries will be left out because of the lack of their usage details(number of downloads and number of mobile applications using them). We estimate they will beenhanced in the future by the respective commercial companies. Among open-source librariesAChartEngine, Androidplot, GraphView and HoloGraphLibrary all have their last activity in thelast two years and Processing has shown activity in 2015. We estimate these libraries will con-tinue to be enhanced and supported. The last activities in Droidcharts, Chartdroid and charts4jwere about four years ago. We therefore estimate that the libraries will not be used actively inthe future.
Category LibrariesNumber of charts RChart, aiCharts, AChartEngineTime performance ShinobiCharts, charts4j, ProcessingInteractivity aiCharts, RChart, Androidplot, GraphView, charts4j,
AChartEngine, ProcessingGood future perspective AChartEngine, Androidplot, GraphView,
HoloGraphLibrary, ProcessingTable 4.3: Overview of the Categories with most applicable li-braries
23


CHAPTER 5Comparison of Libraries Performance
Based on the results of chapter 4 the following libraries are compared against each other:
• AChartEngine
• Androidplot
• AFreeChart
• ShinobiCharts
• Processing
The libraries were picked based on the numbers of charts supported (AChartEngine, An-droidplot, AFreeChart) or based on reported high performance (ShinobiCharts, Processing).
The comparison is based on a performance test, the measurement of the memory usage, thelines of code used to draw a chart and a list of advantages and disadvantages for every library.
5.1 Experiment
The performance criteria rendering duration and memory usage are measured while renderinga varying number of lines in a line chart to simulate a parallel coordinate chart. The datasetcontains 5.000 records. Each library has to render a increasing number of lines.
Mobile applications will be created to run the tests on the mobile device. Each applicationshould work similar and distinguish only in the library specific part.
The device used to measure the performance has the following specifications:
• Qualcomm MSM8226 Snapdragon 400 @ 4x 1.20GHz Cortex-A7
• GPU Adreno 305
• 1GB RAM
25
• Android 4.4.2
• Processing
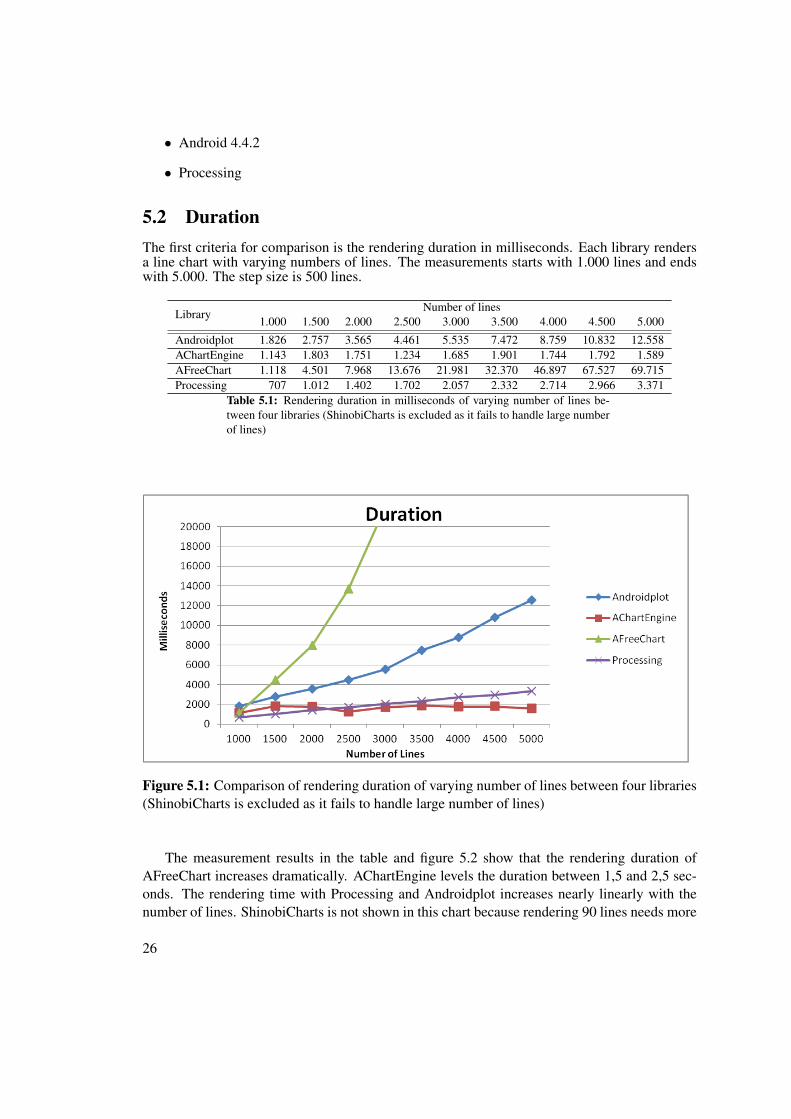
5.2 DurationThe first criteria for comparison is the rendering duration in milliseconds. Each library rendersa line chart with varying numbers of lines. The measurements starts with 1.000 lines and endswith 5.000. The step size is 500 lines.
LibraryNumber of lines
1.000 1.500 2.000 2.500 3.000 3.500 4.000 4.500 5.000
Androidplot 1.826 2.757 3.565 4.461 5.535 7.472 8.759 10.832 12.558AChartEngine 1.143 1.803 1.751 1.234 1.685 1.901 1.744 1.792 1.589AFreeChart 1.118 4.501 7.968 13.676 21.981 32.370 46.897 67.527 69.715Processing 707 1.012 1.402 1.702 2.057 2.332 2.714 2.966 3.371
Table 5.1: Rendering duration in milliseconds of varying number of lines be-tween four libraries (ShinobiCharts is excluded as it fails to handle large numberof lines)
Figure 5.1: Comparison of rendering duration of varying number of lines between four libraries(ShinobiCharts is excluded as it fails to handle large number of lines)
The measurement results in the table and figure 5.2 show that the rendering duration ofAFreeChart increases dramatically. AChartEngine levels the duration between 1,5 and 2,5 sec-onds. The rendering time with Processing and Androidplot increases nearly linearly with thenumber of lines. ShinobiCharts is not shown in this chart because rendering 90 lines needs more
26
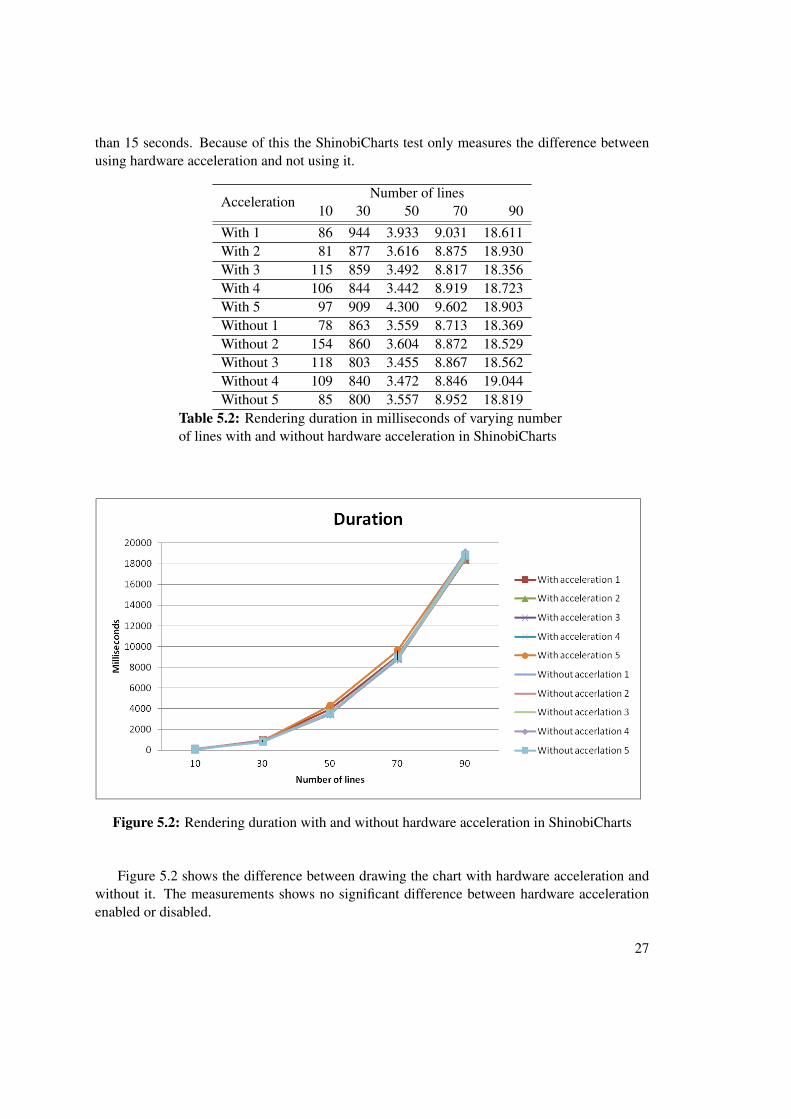
than 15 seconds. Because of this the ShinobiCharts test only measures the difference betweenusing hardware acceleration and not using it.
AccelerationNumber of lines
10 30 50 70 90With 1 86 944 3.933 9.031 18.611With 2 81 877 3.616 8.875 18.930With 3 115 859 3.492 8.817 18.356With 4 106 844 3.442 8.919 18.723With 5 97 909 4.300 9.602 18.903Without 1 78 863 3.559 8.713 18.369Without 2 154 860 3.604 8.872 18.529Without 3 118 803 3.455 8.867 18.562Without 4 109 840 3.472 8.846 19.044Without 5 85 800 3.557 8.952 18.819
Table 5.2: Rendering duration in milliseconds of varying numberof lines with and without hardware acceleration in ShinobiCharts
Figure 5.2: Rendering duration with and without hardware acceleration in ShinobiCharts
Figure 5.2 shows the difference between drawing the chart with hardware acceleration andwithout it. The measurements shows no significant difference between hardware accelerationenabled or disabled.
27

5.3 Memory usage
This section shows the results of the comparison of the memory usage of the in section 5.1described applications. The memory usage is measured for each step of number of lines whilerunning the test scenario described in section 5.2. For comparison the values of the garbagecollector (’GC_FOR_ALLOC’) were extracted from the log-files. The values are in Megabyte(MB).
LibraryNumber of lines
1.000 1.500 2.000 2.500 3.000 3.500 4.000 4.500 5.000Processing 8,9 8,9 8,9 8,9 8,9 8,9 8,9 8,9 8,9Androidplot 11,4 13,7 20,3 23,6 29,4 37,5 42,4 49,8 57,3AChartEngine 9,1 11,0 14,2 17,8 20,8 21,7 22,8 24,7 28,8AFreeChart 8,2 8,3 8,5 9,0 9,1 10,3 10,5 11,5 12,4
Table 5.3: Memory usage in Megabyte of mobile applicationsrendering varying number of lines between four libraries (Shino-biCharts is excluded as it fails to handle large number of lines)
Figure 5.3: Memory usage of mobile applications rendering varying number of lines betweenfour libraries (ShinobiCharts is excluded as it fails to handle large number of lines)
Figure 5.3 shows that Processing levels off whereas the memory usage of AFreeChart in-crease up to 50% but uses still few memory. Androiplot doubles the used memory. AChartEnginehas the biggest increase in memory usage. 3,5 times more memory is needed to draw the line
28

charts in the experiment described in section 5.1. Except Processing all libraries increase theused memory nearly linearly with the number of lines being rendered.
LibraryNumber of lines
10 30 50 70 90ShinobiCharts 7 7,6 8,1 9,0 9,7
Table 5.4: Memory usage in Megabyte of mobile applications ren-dering varying number of lines in ShinobiCharts
Figure 5.4: Memory usage in Megabyte of mobile applications rendering varying number oflines in ShinobiCharts
Figure 5.4 shows that the memory usage of ShinobiCharts increases linearly up to 40%.
5.4 Lines of code
In this section the implementation effort will be compared. The libraries are compared againsteach others by the lines of code used to draw the chart. Counted are only the lines that arenecessary to draw the chart and not the number of lines of code to run the whole app.
Library Shinobi Processing Androidplot AChartEngine AFreeChartLines of code 17 10 12 20 14
29
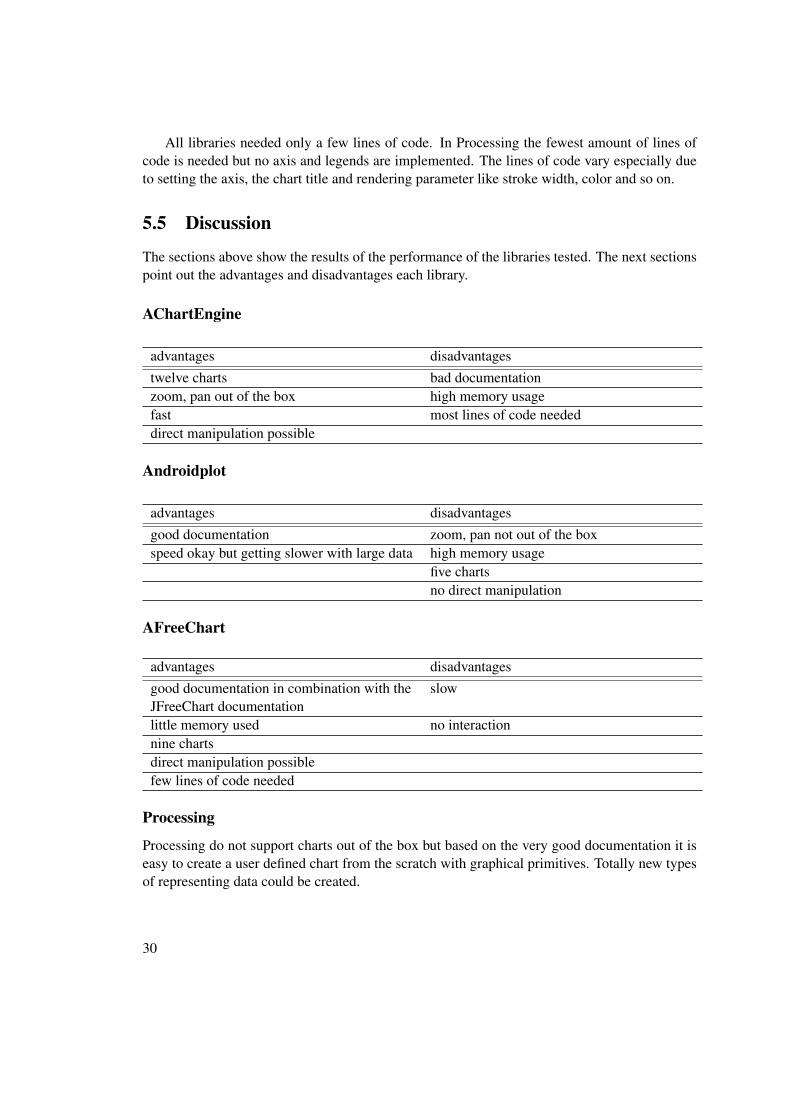
All libraries needed only a few lines of code. In Processing the fewest amount of lines ofcode is needed but no axis and legends are implemented. The lines of code vary especially dueto setting the axis, the chart title and rendering parameter like stroke width, color and so on.
5.5 Discussion
The sections above show the results of the performance of the libraries tested. The next sectionspoint out the advantages and disadvantages each library.
AChartEngine
advantages disadvantagestwelve charts bad documentationzoom, pan out of the box high memory usagefast most lines of code neededdirect manipulation possible
Androidplot
advantages disadvantagesgood documentation zoom, pan not out of the boxspeed okay but getting slower with large data high memory usage
five chartsno direct manipulation
AFreeChart
advantages disadvantagesgood documentation in combination with theJFreeChart documentation
slow
little memory used no interactionnine chartsdirect manipulation possiblefew lines of code needed
Processing
Processing do not support charts out of the box but based on the very good documentation it iseasy to create a user defined chart from the scratch with graphical primitives. Totally new typesof representing data could be created.
30
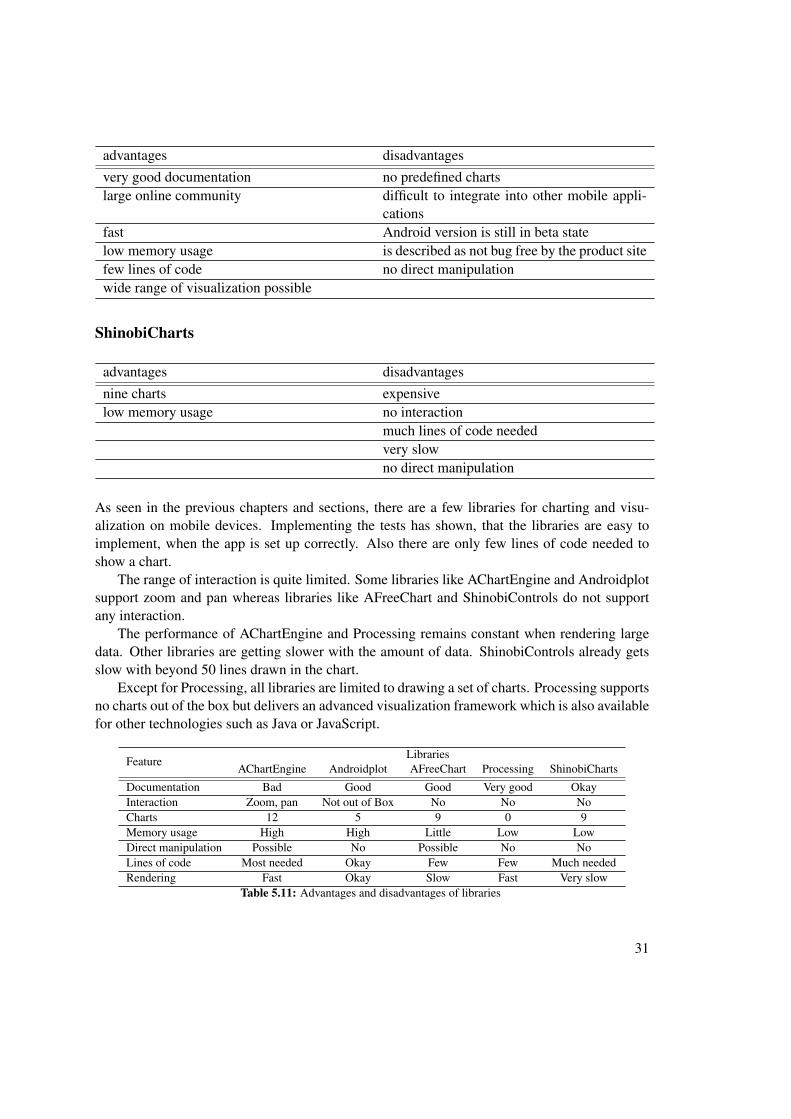
advantages disadvantagesvery good documentation no predefined chartslarge online community difficult to integrate into other mobile appli-
cationsfast Android version is still in beta statelow memory usage is described as not bug free by the product sitefew lines of code no direct manipulationwide range of visualization possible
ShinobiCharts
advantages disadvantagesnine charts expensivelow memory usage no interaction
much lines of code neededvery slowno direct manipulation
As seen in the previous chapters and sections, there are a few libraries for charting and visu-alization on mobile devices. Implementing the tests has shown, that the libraries are easy toimplement, when the app is set up correctly. Also there are only few lines of code needed toshow a chart.
The range of interaction is quite limited. Some libraries like AChartEngine and Androidplotsupport zoom and pan whereas libraries like AFreeChart and ShinobiControls do not supportany interaction.
The performance of AChartEngine and Processing remains constant when rendering largedata. Other libraries are getting slower with the amount of data. ShinobiControls already getsslow with beyond 50 lines drawn in the chart.
Except for Processing, all libraries are limited to drawing a set of charts. Processing supportsno charts out of the box but delivers an advanced visualization framework which is also availablefor other technologies such as Java or JavaScript.
FeatureLibraries
AChartEngine Androidplot AFreeChart Processing ShinobiCharts
Documentation Bad Good Good Very good OkayInteraction Zoom, pan Not out of Box No No NoCharts 12 5 9 0 9Memory usage High High Little Low LowDirect manipulation Possible No Possible No NoLines of code Most needed Okay Few Few Much neededRendering Fast Okay Slow Fast Very slow
Table 5.11: Advantages and disadvantages of libraries
31

CHAPTER 6Conclusion
This thesis gives an overview of Java-based visualization libraries for mobile devices to helpdevelopers of mobile applications in choosing a library suited for their application.
The search for available libraries shows that commercial libraries generally support severalchart types but do not provide detailed information about the popularity of the library in termsof number of downloads or mobile applications using it. On the other hand, the more an opensource library is used, the better is its documentation and the information on usage statistics.The search shows that interaction with the rendered data is limited to some basic functionalityand that the guaranteed future of the open source libraries is doubtful. This work providesdetail feature analysis of available libraries, and compare them based on these features, to aiddevelopers choosing a suited library for their application.
This work further conducts performance analysis of selected libraries, in terms of runningtime and memory usage. The performance test shows that assumptions like a library that usesGPU rendering should be faster are not necessarily correct. It also shows that the renderingduration can be a main criteria delivering a mobile application for large data. Another insight ofthe performance test is that the used memory should be kept in view.
In further work the libraries can be tested in a more detailed way to prove the correctnessof the information of the product owner. Furthermore, other visualization frameworks for Java-based desktop application can be ported to Android as was done with AFreeChart, Droidcharts(both based on JFreeChart) or Processing.
33

References
AChartEngine (2015). Achartengine. Created at: n.d.. Retrieved at: April 5, 2015.http://www.achartengine.org/.
AFreeChart (2011). Afreechart. Created at: 22.10.2011.. Retrieved at: April 5, 2015.http://code.google.com/p/afreechart/.
Androidplot (2013). Androidplot. Created at: n.d.. Retrieved at: April 5, 2015.http://androidplot.com/.
ArtfulBits (2015). aicharts. Created at: n.d.. Retrieved at: April 5, 2015.http://www.artfulbits.com/products/android/aicharts.aspx.
Chartdroid (2015). Chartdroid - native chart engine for android. Created at: n.d.. Retrieved at:April 5, 2015. http://code.google.com/p/chartdroid.
charts4j (2013). charts4j - let the computer in the cloud build your charts. Created at: 27.02.2013.Retrieved at: April 5, 2015. http://code.google.com/p/charts4j/.
Chittaro, L. (2006). Visualizing information on mobile devices. Computer, 39:40–45.
Controls, S. (2015). Shinobicharts - powerful, flexible ui controls for android. Created at: n.d..Retrieved at: April 5, 2015. http://www.shinobicontrols.com/android/.
Delap, Scott (2007). Google’s android sdk bypasses java me in favor of java lite andapache harmony. Created at: November 12, 2007. Retrieved at: October 10, 2013.http://www.infoq.com/news/2007/11/android-java.
Dimagi (2009). Rapidandroid - an sms gateway on your phone. Created at: 17.07.2009.. Re-trieved at: December 1, 2013. http://www.dimagi.com/rapidandroid/.
Droidcharts (2015). Droidcharts - porting jfreecharts library to android. Created at: n.d.. Re-trieved at: April 5, 2015. http://code.google.com/p/droidcharts/.
Gartner (2013). Gartner says worldwide pc, tablet and mobile phone combined shipments toreach 2.4 billion units in 2013. Created at: April 4, 2013. Retrieved at: October 10, 2013.http://www.gartner.com/newsroom/id/2408515.
35

Gehring, J. (2015). jjoe64 developer blog - graphview library. Created at: n.d.. Retrieved at:April 5, 2015. http://www.android-graphview.org.
Java4Less (2015). J4l rchart 2.2 (android edition). Created at: n.d.. Retrieved at: April 5, 2015.http://www.java4less.com/android/charts.php.
JFreeChart (2011). Jfreechart. Created at: 22.10.2011.. Retrieved at: December 1, 2013.http://www.jfree.org/jfreechart/.
Lammarsch, T., Aigner, W., Bertone, A., Gärtner, J., Miksch, S., and Turic, T. (2008). A com-parison of programming platforms for interactive visualization in web browser based applica-tions. In Banissi, E., Stuart, L., Jern, M., Andrienko, G., Marchese, F. T., Memon, N., Alhajj,R., Wyeld, T. G., Burkhard, R. A., Grinstein, G., Groth, D., Ursyn, A., Maple, C., Faiola,A., and Craft, B., editors, Proceedings of 12th International Conference on Information Vi-sualisation (IV08), page 194–199. IEEE Computer Society Press, IEEE Computer SocietyPress. <p>Vortrag: 12th International Conference on Information Visualisation (IV08), Lon-don, UK; 2008-07-09 – 2008-07-11</p>.
Nadeau, D. (2013). Holographlibrary. Created at: 27.02.2013. Retrieved at: April 5, 2015.https://bitbucket.org/danielnadeau/holographlibrary/wiki/Home.
NiftyMobileApps (2015). Android chart library. Created at: n.d.. Retrieved at: December 1,2013. http://www.niftymobileapps.com/android-chart-library/.
Processing (2015). Processing. Created at: n.d.. Retrieved at: April 5, 2015.https://processing.org/.
Purchase, H. C., Andrienko, N., Jankun-Kelly, T. J., and Ward, M. (2008). Theoretical founda-tions of information visualization. in information visualization: Human-centered issues andperspectives. In Kerren, A., Stasko, J. T., Fekete, J., and North, C., editors, Lecture Notes InComputer Science, volume 4950. Springer-Verlag, Berlin, Heidelberg 46-64.
Reddit (2013). Reddit - basic data visualization in android develop-ment. Created at: May 4, 2013. Retrieved at: December 1, 2013.http://www.reddit.com/r/androiddev/comments/1dp0er/basic_data_visualization_in_android_development/.
Snowdon (2015). Snowdon - a simple, fast, graphing library for android. Created at: n.d..Retrieved at: April 5, 2015. http://code.google.com/p/snowdon/.
StackOverflow (2012). Stackoverflow - any good graphing packages for an-droid? Created at: April 11, 2012. Retrieved at: October 10, 2013.http://stackoverflow.com/questions/424752/any-good-graphing-packages-for-android.
Tversky, B., Y, J. B. M., and Betrancourt, M. (2002). Animation: Can it facilitate. InternationalJournal of Human-Computer Studies, 57:247–262.
van Wijk, J. J. (2005). The value of visualization. Visualization Conference, IEEE, 0:11.
36

Yoo, H. Y. and Cheon, S. H. (2006). Visualization by information type on mobile device. InProceedings of the 2006 Asia-Pacific Symposium on Information Visualisation - Volume 60,APVis ’06, pages 143–146, Darlinghurst, Australia, Australia. Australian Computer Society,Inc.
37