state of the canadian oilfield services industry and 2015 outlook webinar
TRANSCRIPT
Presented by:
Date:
David Yager, National Leader Oilfield Services
February 2015
Strategies Produced for
Today and Tomorrow
State of the Canadian Oilfield
Services Industry and 2015
Outlook
Rig photos courtesy of Beaver Drilling Ltd.


Page 3
Program
1. About MNP.
2. What is Oilfield Services?
3. Where have we been?
4. Where are we going?
5. How should a client manage
its company in a challenging
market environment.

Page 4
OUR PEOPLE
The MNP Advantage:
• Fifth largest tax, accounting and business advisory services firm in Canada.
• Offices in strategic locations throughout all the major producing areas of the Western Canadian Sedimentary Basin.
• Experience with over 5,500 oilfield services clients.
• Over 150 dedicated OFS professionals.
• Member of the major OFS industry associations.
• Only professional services firm with an on-hands industry specialist.
• Corporate restructuring specialists in all major Canadian centres.
• Alberta based corporate recovery specialists experienced in the major Alberta industries.
Page 5
OUR PEOPLE
“Think Global, Act Local”
• Over 75 offices from Montreal to Vancouver Island.
• Member of Praxity Global Alliance of Independent Firms giving us
worldwide presence.
• We have specialists located in the areas necessary to meet the local
needs of our OFS clients.

Page 6
Where We Operate
Western Canadian
Sedimentary Basin
We work where you work

Page 7
1 - What is Oilfield Service?
E&P company seeks to
develop an oil or gas
reservoir
Delivery of oil or gas to refinery
terminal or pipeline access
facility
1. Exploration
2. Engineering & Consulting
3. Construction
4. Transportation
5. Drilling & Service Rigs
6. Wellhead Services
7. Downhole Tools
8. Equipment Rentals
9. Equipment Supply
10.Logistics
11.Fabrication & Manufacturing
12.Production
All the products and
services an oil company
does not supply itself

Page 8
1 Exploration
2 Engineering
3 Construction
4 Transportation
5 Drilling & Service Rigs
6 Wellhead Services7 Downhole Tools
8 Equipment Rentals
9 Equipment Supply
10 Logistics
11 Fabrication,
Manufacturing
12 Production
OILFIELD SERVICES
Major subsectors in
the Exploration &
Production process
from early stage
investment to
commercial
development
MNP Oilfield Services Subsectors Through
Oil and Gas Development Investment Cycle

Page 9
Sources of Revenue for OFS
WHERE DO PRODUCERS GET THEIR MONEY
• Cashflow from oil and gas production sales (net of operating expenses)
• E&P capital inflows (debt, equity)
WHERE DO OFS COMPANIES GETS THEIR MONEY
• E&P Capital Expenditures (CAPEX)
• E&P operating costs
• Service sector CAPEX
Page 10
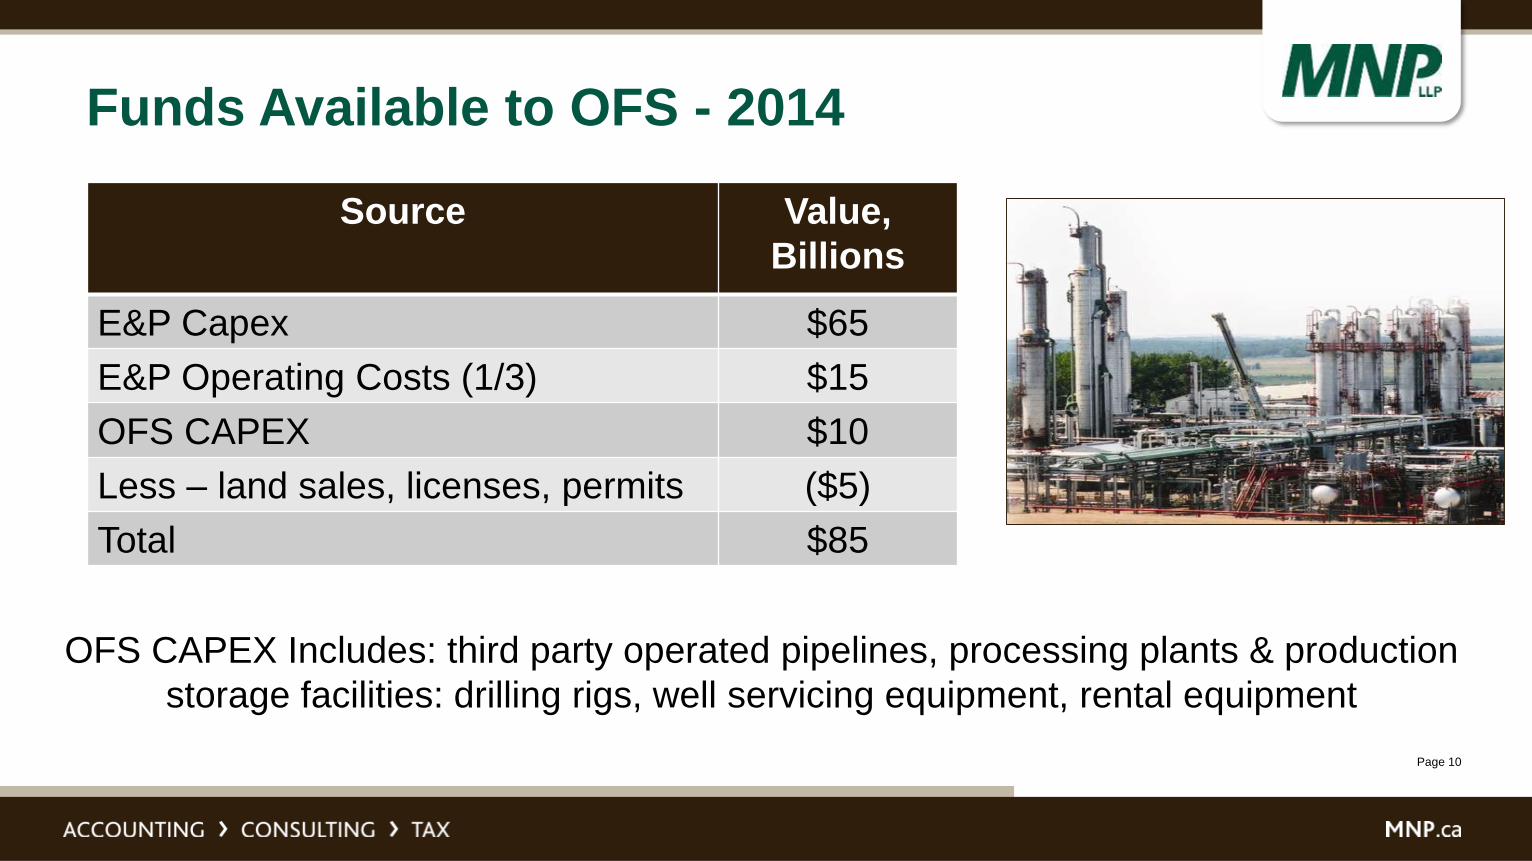
Funds Available to OFS - 2014
Source Value,
Billions
E&P Capex $65
E&P Operating Costs (1/3) $15
OFS CAPEX $10
Less – land sales, licenses, permits ($5)
Total $85
OFS CAPEX Includes: third party operated pipelines, processing plants & production
storage facilities: drilling rigs, well servicing equipment, rental equipment

Page 11
2 – Where Have We Been?
• Summary of upstream oil industry
macro-economic drivers
–Production
–Revenue and cashflow
–Capital expenditures – conventional
and oilsands
–The gas boom
–The oilsands boom
–Upstream operating expenditures –
conventional and oilsands

Page 12
Production Volumes
0.0
1.0
2.0
3.0
4.0
5.0
6.0
7.0
1999
2000
2001
2002
2003
2004
2005
2006
2007
2008
2009
2010
20
11
2012
2013
2014
Oil/Liquids
Bitumen
Gas
Total
SOURCE: ARC Financial
Millions of Barrels of Oil or Natural Gas Liquids
Millions of Barrels of Oil Equivalent of Gas (@ 6:1) Per Day

Page 13
Revenue/Cashflow 1998 - 2015
$0.0
$20.0
$40.0
$60.0
$80.0
$100.0
$120.0
$140.0
$160.0
1998
1999
2000
20
01
2002
2003
2004
2005
2006
2007
2008
2009
2010
2011
2012
2013
2014
2015
Billions of $ Cdn – (Estimates 2014 & 2015)
SOURCE: ARC Financial Jan 27/15
Record Year
Page 14
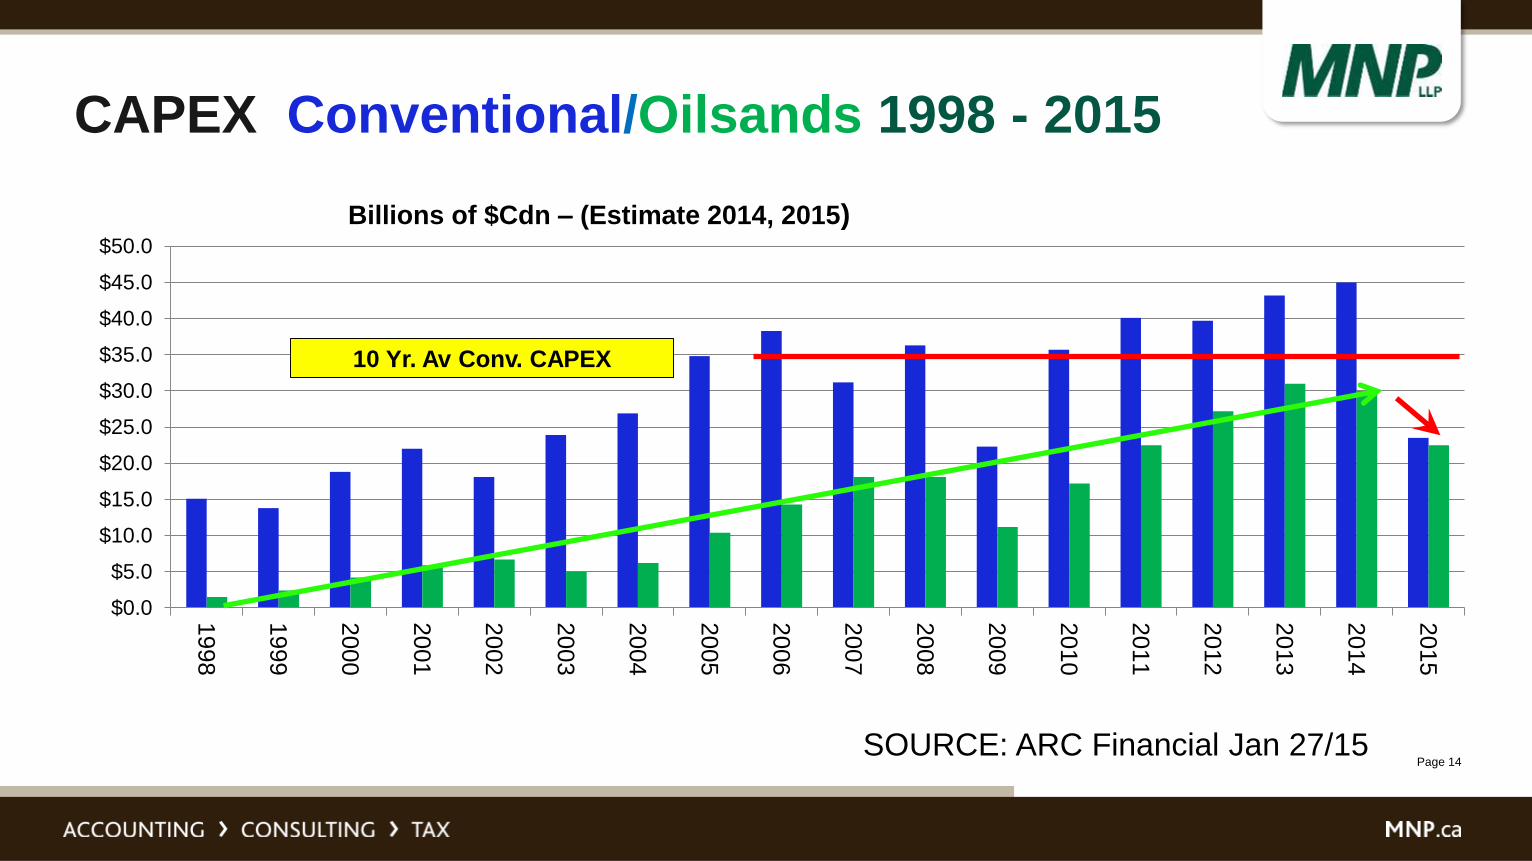
CAPEX Conventional/Oilsands 1998 - 2015
$0.0
$5.0
$10.0
$15.0
$20.0
$25.0
$30.0
$35.0
$40.0
$45.0
$50.0
1998
1999
2000
20
01
2002
2003
2004
20
05
2006
2007
2008
2009
2010
2011
2012
2013
2014
2015
Billions of $Cdn – (Estimate 2014, 2015)
SOURCE: ARC Financial Jan 27/15
10 Yr. Av Conv. CAPEX

Page 15
$0
$10
$20
$30
$40
$50
$60
199
1
199
2
199
3
199
4
19
95
199
6
199
7
199
8
199
9
200
0
200
1
200
2
200
3
20
04
200
5
200
6
200
7
200
8
200
9
201
0
201
1
201
2
20
13
201
4
Production
Value
SOURCE: CAPP, ARC
YAHOO!
The Gas Boom – 2000 to 2008
Billions of dollars of revenue
Billions of cubic feet per day
Page 16
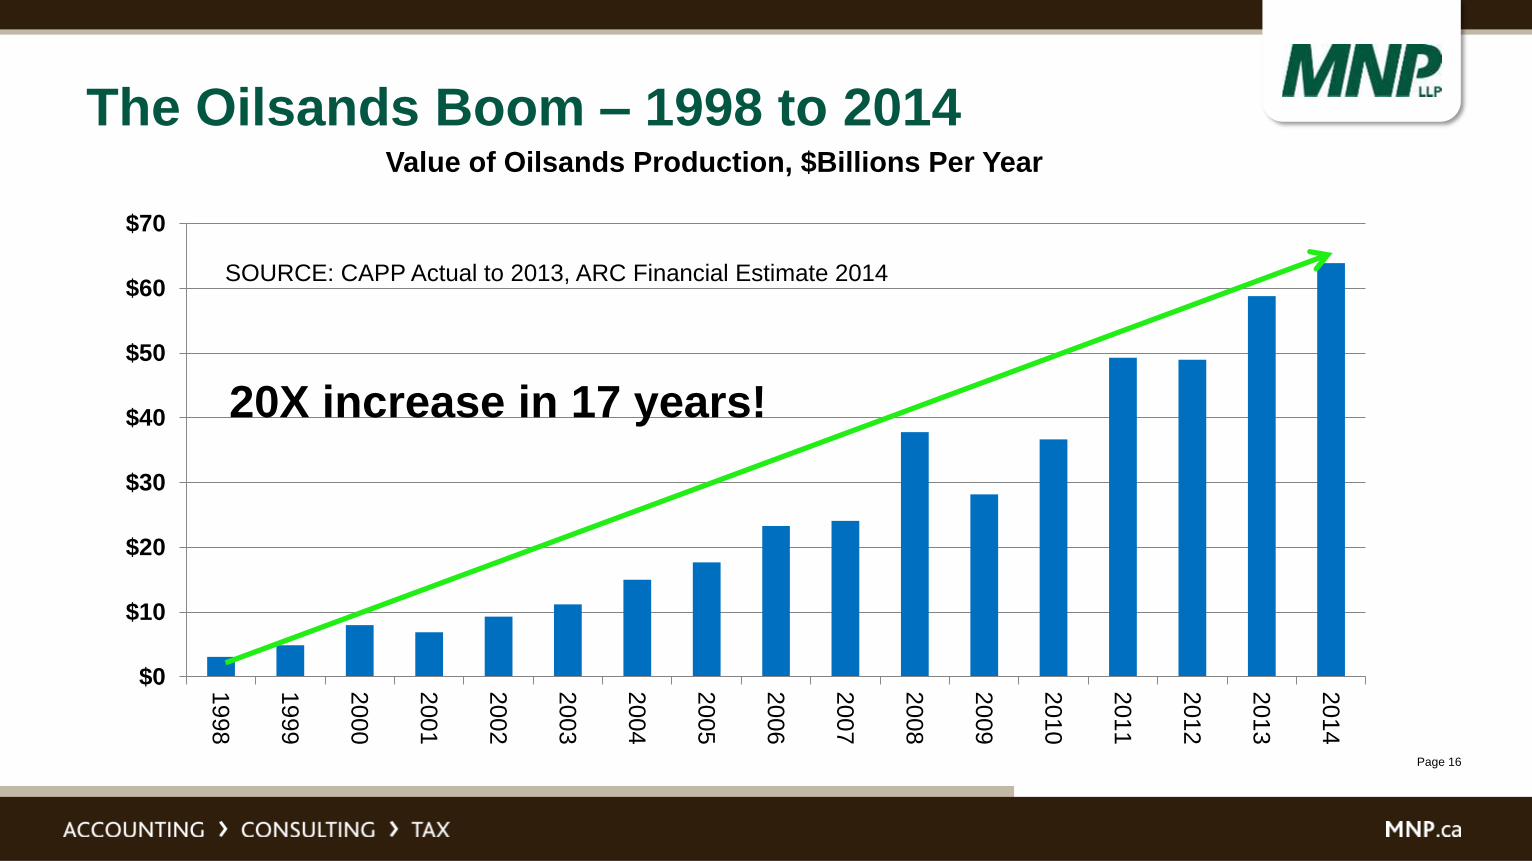
The Oilsands Boom – 1998 to 2014
$0
$10
$20
$30
$40
$50
$60
$70
1998
1999
2000
2001
2002
2003
2004
2005
2006
2007
2008
2009
2010
2011
2012
2013
20
14
Value of Oilsands Production, $Billions Per Year
20X increase in 17 years!
SOURCE: CAPP Actual to 2013, ARC Financial Estimate 2014
Page 17
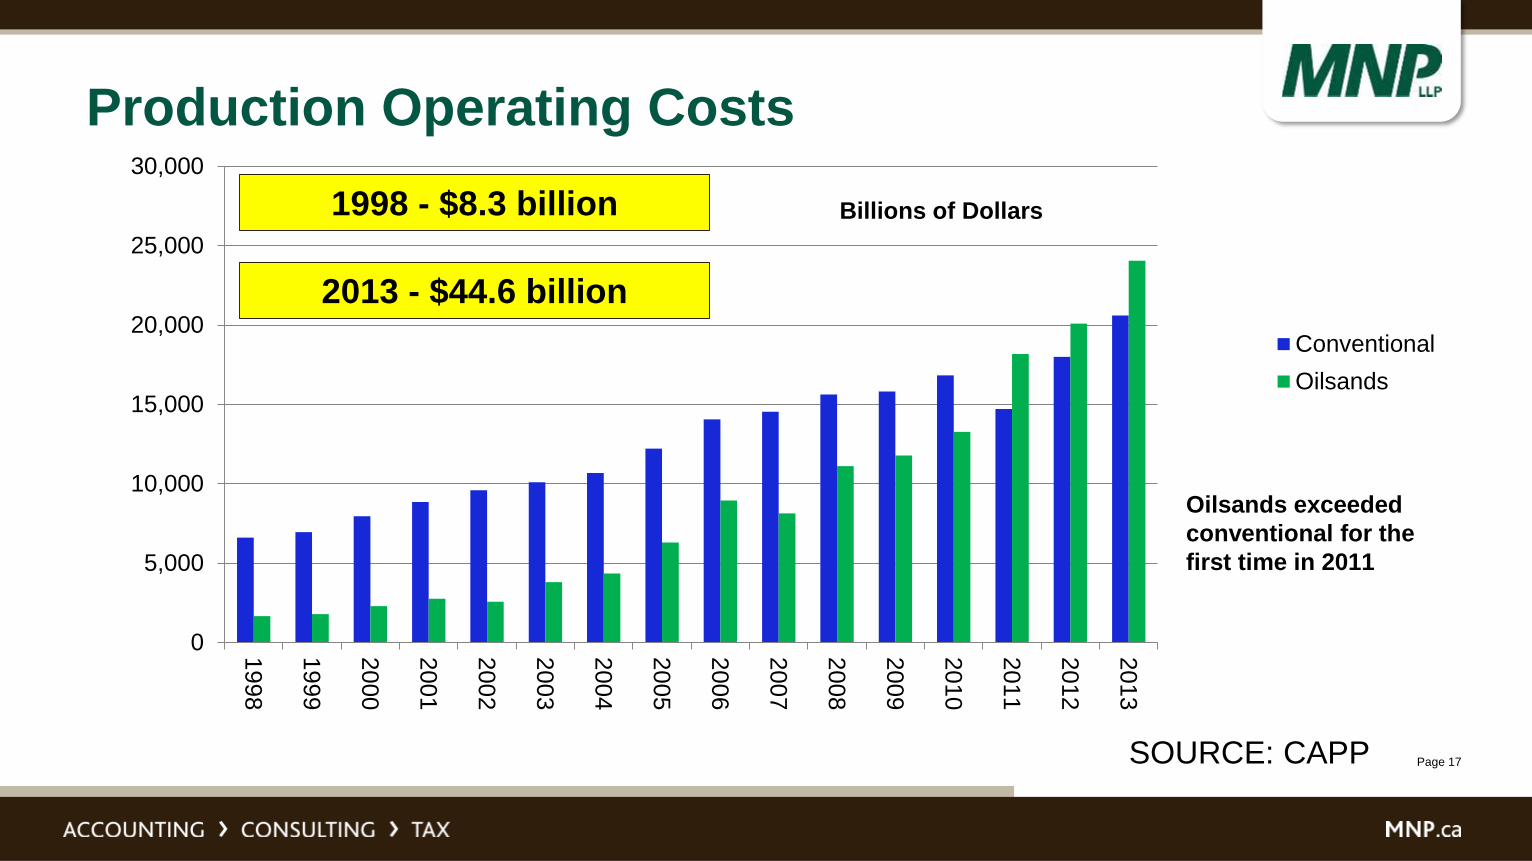
Production Operating Costs
0
5,000
10,000
15,000
20,000
25,000
30,000
1998
1999
20
00
2001
2002
2003
2004
2005
2006
2007
2008
2009
2010
2011
2012
2013
Conventional
Oilsands
Billions of Dollars
Oilsands exceeded
conventional for the
first time in 2011
SOURCE: CAPP
1998 - $8.3 billion
2013 - $44.6 billion

Page 18
0.0%
20.0%
40.0%
60.0%
80.0%
100.0%
120.0%
140.0%
160.0%
1998
1999
2000
2001
2002
2003
2004
2005
2006
2007
20
08
2009
20
10
2011
2012
2013
2014
2015
Equity/Debt Inflows
Oil Price Collapses
Royalty Trust Era
Oil hits $147/bbl
Reinvestment Ratio: CAPEX/After-Tax Cashflow
(Estimates 2014, 2015)
SOURCE: ARC Financial Jan 20/15

Page 19
3 - Where Are We Going?
• Oil prices – recent versus current
• Gas prices – recent versus current
• Current oil and gas pricing environment
• PSAC drilling forecast – wells
• PSAC drilling forecast – meters drilled
• PSAC drilling forecast – rig operating days
• CAPEX – CAPP
• CAPEX – Peters & Company & Woods Mackenzie
• Outlook by sector – MNP classification system
• Winners and losers by service line
• Three major positive outlook drivers
• How it looks today – major revenue contraction
Page 20
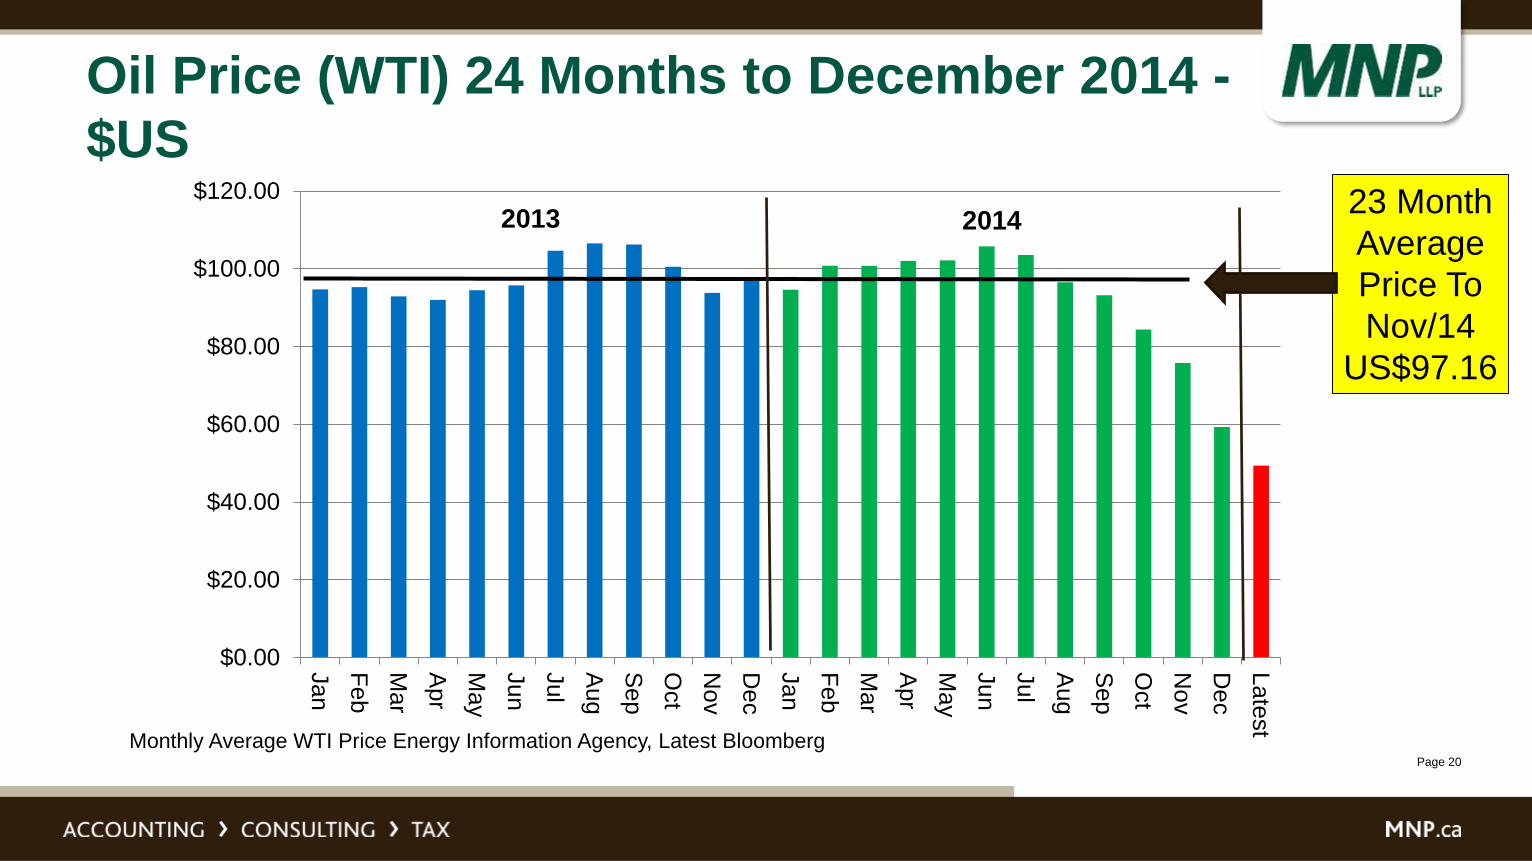
Oil Price (WTI) 24 Months to December 2014 -
$US
$0.00
$20.00
$40.00
$60.00
$80.00
$100.00
$120.00
Jan
Feb
Mar
Ap
r
May
Ju
n
Jul
Au
g
Se
p
Oct
No
v
De
c
Jan
Feb
Mar
Ap
r
May
Jun
Jul
Au
g
Se
p
Oct
No
v
De
c
La
test
20142013
Monthly Average WTI Price Energy Information Agency, Latest Bloomberg
23 Month
Average
Price To
Nov/14
US$97.16
Page 21
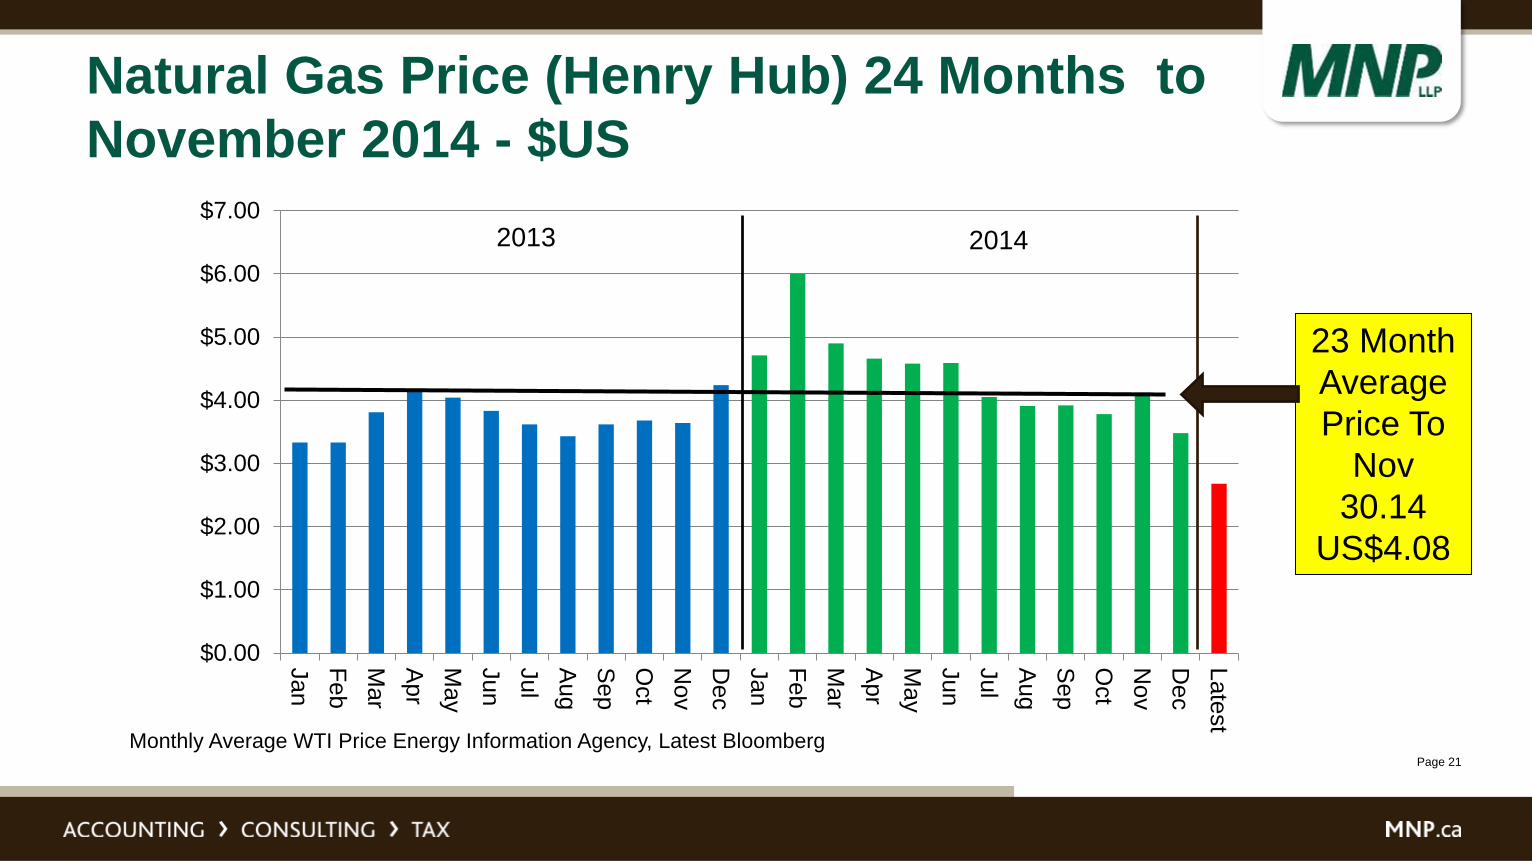
Natural Gas Price (Henry Hub) 24 Months to
November 2014 - $US
$0.00
$1.00
$2.00
$3.00
$4.00
$5.00
$6.00
$7.00
Jan
Fe
b
Mar
Apr
May
Jun
Jul
Aug
Sep
Oct
Nov
Dec
Jan
Feb
Mar
Apr
May
Jun
Jul
Aug
Sep
Oct
Nov
Dec
Late
st
2013 2014
23 Month
Average
Price To
Nov
30.14
US$4.08
Monthly Average WTI Price Energy Information Agency, Latest Bloomberg
Page 22
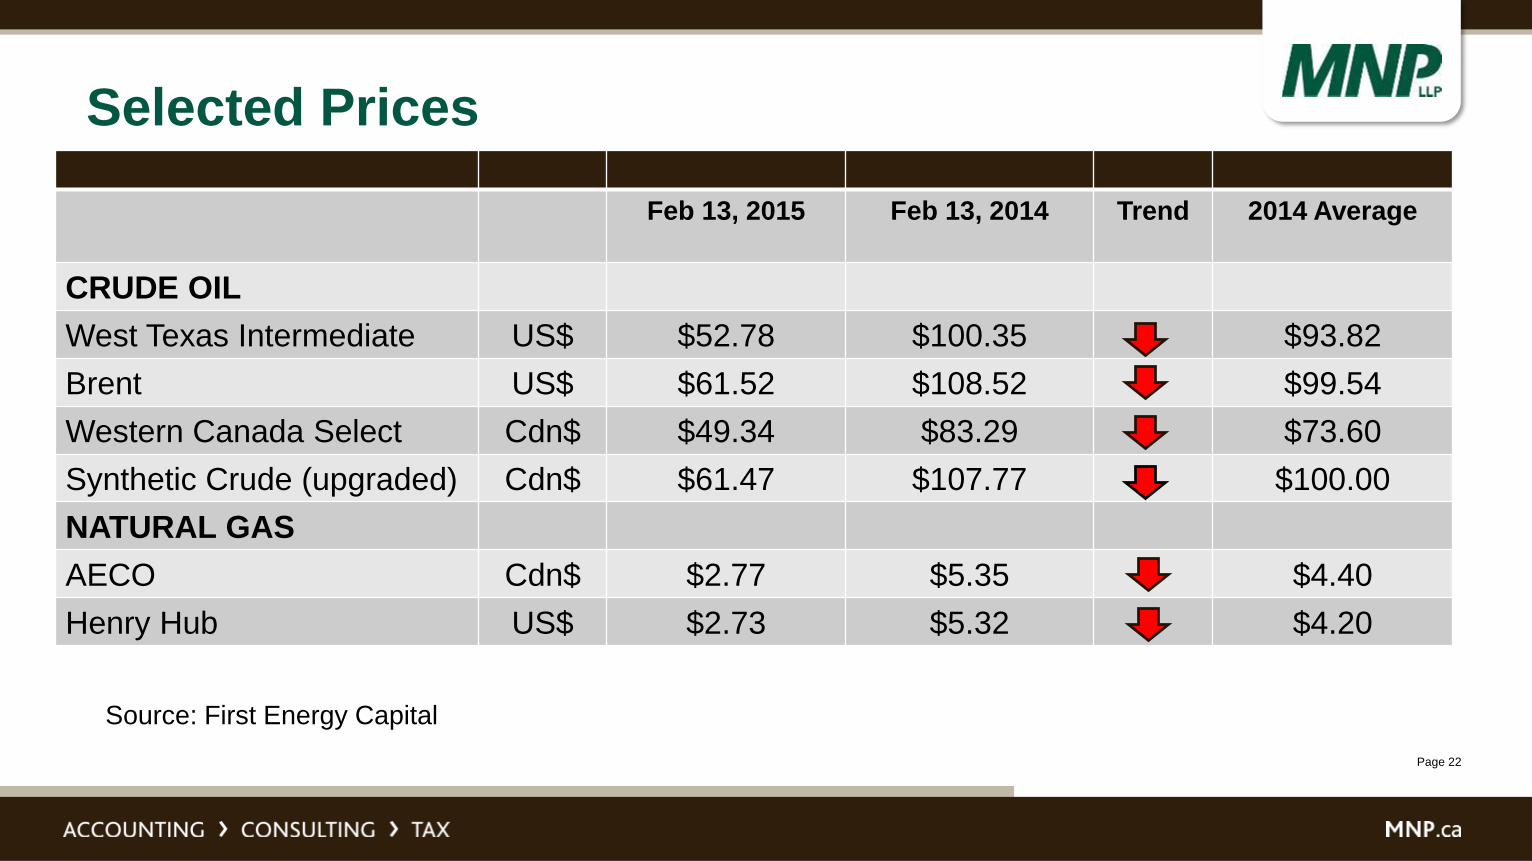
Selected Prices
Feb 13, 2015 Feb 13, 2014 Trend 2014 Average
CRUDE OIL
West Texas Intermediate US$ $52.78 $100.35 $93.82
Brent US$ $61.52 $108.52 $99.54
Western Canada Select Cdn$ $49.34 $83.29 $73.60
Synthetic Crude (upgraded) Cdn$ $61.47 $107.77 $100.00
NATURAL GAS
AECO Cdn$ $2.77 $5.35 $4.40
Henry Hub US$ $2.73 $5.32 $4.20
Source: First Energy Capital
Page 23
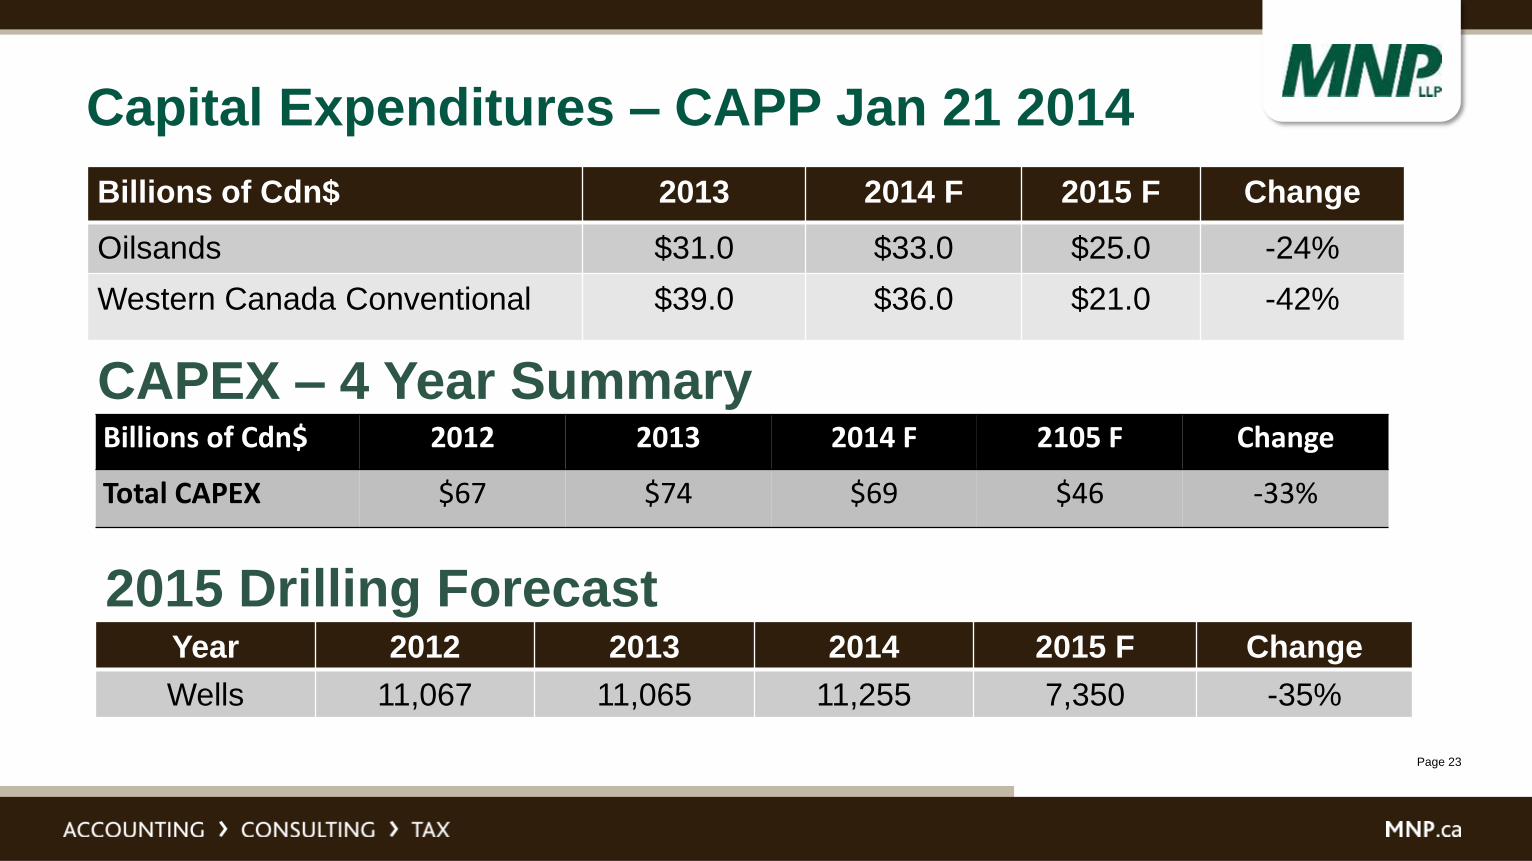
Capital Expenditures – CAPP Jan 21 2014
Billions of Cdn$ 2013 2014 F 2015 F Change
Oilsands $31.0 $33.0 $25.0 -24%
Western Canada Conventional $39.0 $36.0 $21.0 -42%
Billions of Cdn$ 2012 2013 2014 F 2105 F Change
Total CAPEX $67 $74 $69 $46 -33%
CAPEX – 4 Year Summary
Year 2012 2013 2014 2015 F Change
Wells 11,067 11,065 11,255 7,350 -35%
2015 Drilling Forecast
Page 24
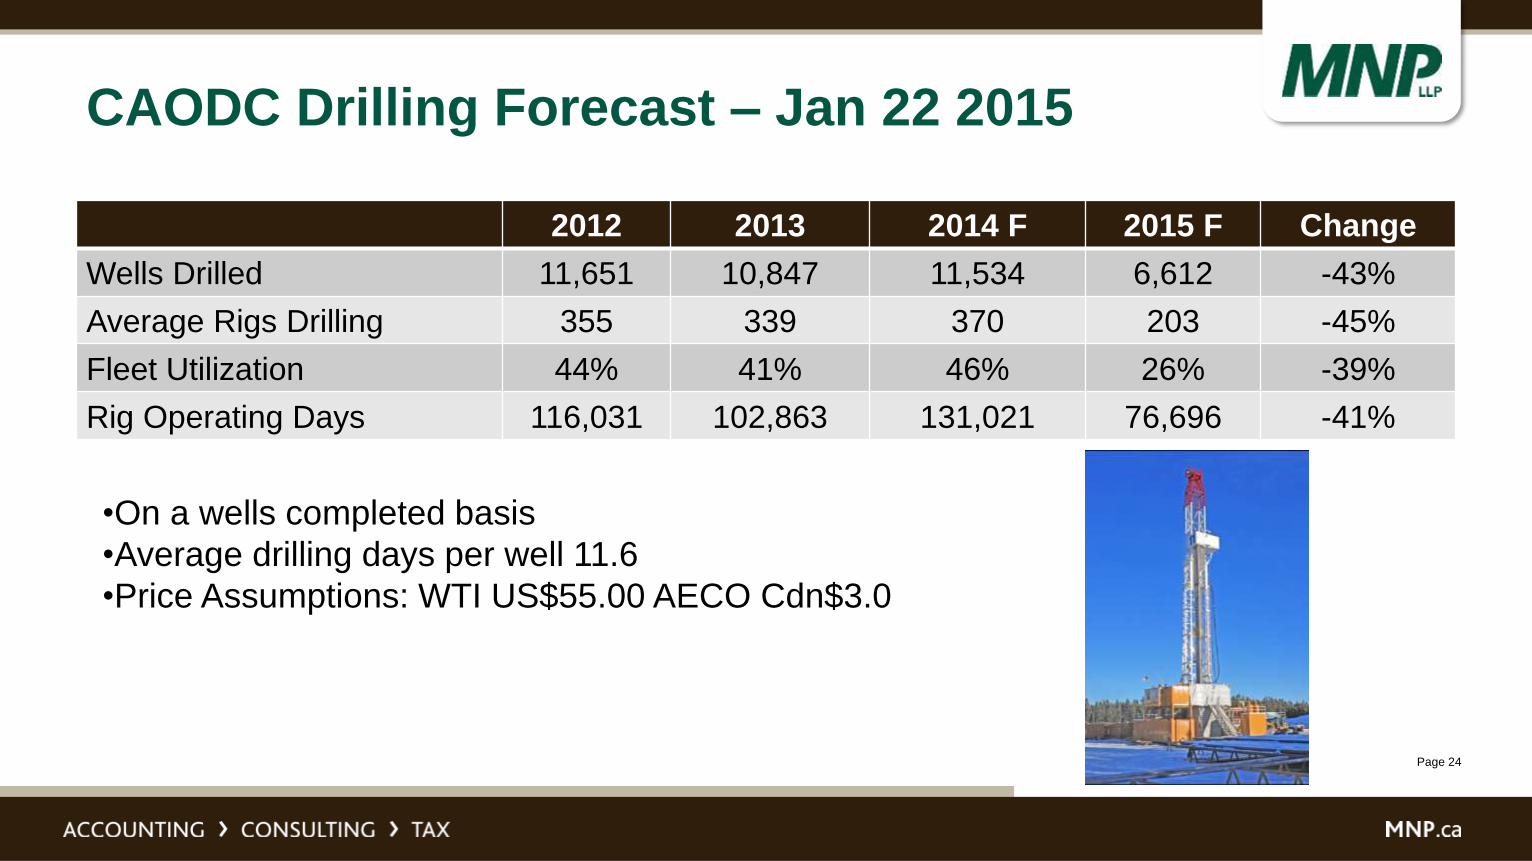
CAODC Drilling Forecast – Jan 22 2015
2012 2013 2014 F 2015 F Change
Wells Drilled 11,651 10,847 11,534 6,612 -43%
Average Rigs Drilling 355 339 370 203 -45%
Fleet Utilization 44% 41% 46% 26% -39%
Rig Operating Days 116,031 102,863 131,021 76,696 -41%
•On a wells completed basis
•Average drilling days per well 11.6
•Price Assumptions: WTI US$55.00 AECO Cdn$3.0

Page 25
2015 Trends By MNP Sector
Exploration Downhole Tools
Engineering & Consulting Equipment Rentals
Construction Supply
Transportation Logistics
Drilling & Service Rigs Manufacturing & Fabrication
Wellbore Services Production

Page 26
Rebound By Sector
OFS Activity Sector Outlook
Production Services – keep the cash
flowing
Continuing, pricing main challenge
Facilities & Pipelines – processing plants
and gathering systems
Expanding with production volume, pricing
pressure main problem
Shale Oil Drilling Down for now but first to recover with oil
prices
Oilsands sustaining CAPEX Ongoing because of harsh operating
conditions, pricing main challenge
Oilsands growth CAPEX Winding down as construction finishes, no
new projects, no recovery imminent

Page 27
Major Positive Potential Changes
• LNG Project Announced – B.C. tax
changes in place: will somebody
commit?
• Keystone XL Approval – will
Republicans overpower President
Obama?
• Supply/Demand Balance Oil Price
Recovery in mid-2015 – lower prices
drive demand, lower prices reduce
North American shale oil output

Page 28
How It Looks Today
• Producer cashflow in 2015 forecast to fall by
50%, all E&P CAPEX budgets reduced
• Overall reduction in demand for goods and
services with the exception of production
infrastructure
• Pricing pressure will follow
• Capital markets have contracted
• Over-leverage (too much debt) will be difficult
to manage
• The 2011 – 2014 business plan will not work in
2015

Page 29
2015 Drilling Starts Slowly
Date Active Drilling Rigs Change
February 10, 2015 359 -43%
February 11, 2014 632 -1%
February 12, 2013 624
Source: June-Warren Nickles Rig Locator Feb 10, 2015

Page 30
U.S. Oil Drilling Rig Count Declining
0
200
400
600
800
1,000
1,200
1,400
1,600
1,800
Feb
14/1
5
Feb
6/1
5
Jan 3
0/1
5
Jan 2
3/1
5
Jan 1
6/1
5
Jan 9
/15
Jan 2
/15
De
c 2
6/1
4
De
c 1
9/1
4
De
c 1
2/1
4
De
c 5
/14
No
v 2
6/1
4
No
v 2
1/1
4
No
v 1
4/1
4
No
v 7
/14
Oct 31
/14
Oct 24
/14
Oct 17
/14
Oct 10
/14
Oct 3/1
4
Sep 2
6/1
4
Sep 1
9/1
4
Sep 1
2/1
4
Sep 5
/14
Aug 2
9/1
4
Aug 2
2/1
4
Aug 1
5/1
4
Aug 8
/14
Aug 1
/14
Jul 25/1
4
Jul 18/1
4
Jul 11/1
4
July
3/1
4
Rigs Drilling For Oil in the United States, Baker Hughes July 3, 2014 - February 13, 2015
Down 35% from October 2014 peak

Page 31
4 – What Should Clients Do?
• Understand where they make
their money
• Understand operational
considerations
• Have a cash management system
• Have financial flexibility
• Have a risk management system

Page 32
Does Clients Know Where They Make (or
Lose) Money?
• Pricing, job costs, and field margins
• Variable expenses versus fixed
expenses – do they know what they
are?
• Do they have monthly internal
financial reports per station, division,
product line so they can detect
problems?
• Are they paying too much tax in
Canada or internationally?

Page 33
Operations Considerations
• Do our clients understand
the implications of a more
challenging business
environment?
• Is everyone in the
company going in the
same direction?
• Are they using the lowest
cost suppliers and vendors
(without compromising
quality)?

Page 34
Collections
• Do they undertake credit checks on
their customers?
• Do they get their field tickets signed
and processed to the invoice stage
in a timely manner?
• Does their operations team know a)
how important this is and b) the best
practices for faster payment
• Do they know what late payments
cost?

Page 35
Financial Flexibility
• Are they employing the cheapest
possible sources of capital?
• Do they have the financial reports
necessary to secure lower cost
capital?
• If they wanted to sell, buy or merge
with a competitor, do they have the
financial information required to
actually do a deal?

Page 36
Risk Management
• Are they taking on excessive credit risk in the event of a significant
downturn?
• Are they experiencing “leakage”? Are tools going out the back door?
Is all the fuel going into company vehicles?

Page 37
CONTACTS
Oilfield Services LeaderDavid Yager
Direct: 403 461 8566
Corporate Recovery
CalgaryVictor Kroeger Verne Wood
Direct: 403 298 8479 Direct: 403 537 1621
[email protected] [email protected]
EdmontonEric Sirrs
Direct: 780 969 1491