state of the humanities 2021: workforce & beyond
TRANSCRIPT
Workforce & BeyondA REPORT FROM THE HUMANITIES INDICATORS PROJECT
OF THE AMERICAN ACADEMY OF ARTS & SCIENCES
State of the Humanities 2021

136 Irving Street Cambridge, MA 02138
Telephone: 617-576-5000 Email: [email protected]
Website: www.amacad.org

Workforce & Beyond
american academy of arts & sciencesCambridge, Massachusetts
A REPORT FROM THE HUMANITIES INDICATORS PROJECTOF THE AMERICAN ACADEMY OF ARTS & SCIENCES
State of the Humanities 2021

© 2021 by the American Academy of Arts & Sciences
Published under a Creative Commons Attribution-NonCommercial 4.0 International License (CC BY-NC 4.0); licensing guidelines may be found at https://creativecommons.org/licenses/by-nc/4.0/.
ISBN: 0-87724-144-9
This publication is available online at www.amacad.org/humanities-indicators.
Suggested citation: American Academy of Arts and Sciences, State of the Humanities 2021: Workforce & Beyond (Cambridge, Mass.: American Academy of Arts and Sciences, 2021).
The views expressed in this report are those held by the authors and are not necessarily those of the Officers and Members of the American Academy of Arts and Sciences.
The Academy gratefully acknowledges the financial support of The Andrew W. Mellon Foundation, which funded this study and the other work of the Humanities Indicators.
Please direct inquiries to: American Academy of Arts and Sciences 136 Irving Street Cambridge, Massachusetts 02138-1996 Telephone: (617) 576-5000 Facsimile: (617) 576-5050 Email: [email protected] Visit our website at www.amacad.org
Prepared by the Humanities Indicators Staff: Norman M. Bradburn, Codirector Robert B. Townsend, Codirector Carolyn Fuqua, Senior Research Associate Jessica Taylor, Louis W. Cabot Fellow in Humanities Policy
With special thanks to Judith Tanur (Distinguished Teaching Professor Emerita of Sociology, Stony Brook University) for her statistical review.

Contents 5 Introduction
6 A Note on Interpreting the Information
7 Share of College Graduates Who Are Satisfied with Their Life, by Field of Bachelor’s Degree, 2019
8 Share of College Graduates Who Consider Aspects of Work “Very Important,” by Field of Bachelor’s Degree, 2019
9 Occupational Distribution of Terminal Bachelor’s Degree Holders, by Field of Bachelor’s Degree, 2018
10 Earnings Comparison: Workers with a Terminal Bachelor’s Degree (by Field of Degree) versus Those without a Four-Year Degree, 2018
11 Earnings of College Graduates, by Field of Bachelor’s and Highest Degree, 2018
12 Gender Earnings Gap among College Graduates, by Field of Bachelor’s and Highest Degree, 2018
13 Earnings of Older College Graduates, by Highest Degree: Humanities Compared to Other Fields of Bachelor’s Degree, 2018
14 College Graduates’ Financial Satisfaction, by Field of Bachelor’s Degree, 2019
15 Unemployment among Humanities Bachelor’s Degree Holders, by Age and Highest Degree, 2013–2018
16 Unemployment among College Graduates, by Field of Bachelor’s and Highest Degree, 2018
17 Satisfaction of College Graduates with Monetary Aspects of Their Job, by Field of Bachelor’s Degree, 2019
18 Occupational Distribution of Humanities Bachelor’s Degree Holders, by Highest Degree, 2018
19 Share and Number of Workers in Various Occupations Who Hold a Bachelor’s Degree in the Humanities, 2018
20 Employer Assessment of Importance of Humanities Skills and Recent College Graduates’ Preparation, 2020
21 Adult Workers’ Use of Humanities-Related Skills on the Job (Self-Reported), 2019
22 Share of College Graduates Who Are Generally Satisfied with Their Job, by Field of Bachelor’s and Highest Degree, 2019
23 Share of College Graduates with Positive Perceptions of Their Job, by Field of Bachelor’s Degree, 2019
24 Satisfaction of Humanities Bachelor’s Degree Holders with Nonmonetary Aspects of Their Job, by Field of Bachelor’s Degree, 2019
25 Satisfaction of Humanities Bachelor’s Degree Holders with Aspects of Their Job, by Highest Degree, 2019
26 Terminal Bachelor’s Degree Holders’ Perception of How Related Their Job Is to Their Degree, by Field of Degree, 2019
27 College Graduates’ Perception of the Value of Their Undergraduate Education, 2018/2019
28 College Graduates’ Assessment of Their Current and Future Progress Toward “My Best Possible Life,” by Field of Degree, 2019
29 Endnotes
STATE OF THE HUMANITIES 2021: WORKFORCE & BEYOND 3


Introduction
H ow should one measure the value of a college degree? In recent years, policy-makers have fo-cused their attention on earnings as the primary measure of the value of a degree, often using that metric to single out humanities degrees as less valuable than others.1 But there are other—
less tangible—measures of value, such as satisfaction with one’s work and life more generally, that might also be applied to these discussions.
Without taking a position on which metrics are best, this report, based largely on original research commissioned by the American Academy of Arts and Sciences’ Human-ities Indicators, examines a variety of outcome measures, including graduates’ satisfaction with their jobs, their fi-nances, and their lives generally. The evidence shows that humanities graduates tend to earn less and have slightly higher levels of unemployment than business majors and graduates from some STEM fields. With respect to perceived well-being, however, humanities majors are similar to grad-uates from almost every other field. The data cannot explain the seeming disparity between the objective and subjective measures, but they provide a starting point for a more nu-anced discussion about the relationship among fields of un-dergraduate study, employment, and quality of life. And for faculty, the report also points to a potential area of concern regarding the way they communicate to students about the skills developed in the course of an education in the field, as a substantial share of humanities graduates perceive little or no relationship between their job and their degree. The data were all gathered prior to the COVID-19 pandemic, but
past experience tracking this sort of data for the human-ities—particularly through the Great Recession—gives us little reason to expect a significant shift in values over the medium term.
This report reflects the ongoing mission of the Humanities Indicators, a nationally recognized source of nonpartisan information about the field. The Indicators website (https://HumanitiesIndicators.org) covers 121 topics and includes more than 340 graphs detailing the state of the humanities in schools, higher education, and the workforce; levels of support for research and other key activities; and the role of the humanities in the day-to-day life of the nation. The proj-ect draws on data sources that meet the highest standards of social scientific rigor, relying heavily on the products of the U.S. federal statistical system.
For those wishing to create custom visualizations or perform analyses beyond those described in the following pages, the values underlying the graphs can be downloaded from the report website.
STATE OF THE HUMANITIES 2021: WORKFORCE & BEYOND 5

A Note on Interpreting the Information
Field ComparisonsThis report draws on three major national surveys—the American Community Survey, the National Survey of College Graduates, and the Gallup Alumni Survey. Unfor-tunately, each classifies academic fields and disciplines in a different way, and thus the broad field categories shown in the following graphs vary somewhat depending on the survey source. Visit https://www.amacad.org/publication/humanities-workforce-beyond for information about the disciplines included in each category, as well as the number of graduates in each field and the share of all college gradu-ates they represent.
The fields of study compared in this publication differ with respect to their graduates’ demographics and other charac-teristics. When these characteristics are correlated with an outcome of interest, whether earnings or job satisfaction, they produce “compositional effects” on group outcomes. For example, bachelor’s degree recipients in the humanities are substantially more likely than degree recipients in en-gineering to be women. Thus, to the extent there is a gen-der gap in earnings (as reported on page 12), the median earnings of humanities graduates will be more affected by that gap than the median for engineering graduates. For breakdowns of earnings by age and gender, see the Indica-tors website.
EarningsThis publication reports median earnings rather than the more familiar mean (“average”). This is necessary because of the highly skewed nature of the U.S. earnings distribution; that is, by the small share of the U.S. population who earn considerably more than the vast majority of Americans. The mean is sensitive to such extreme values and thus can pre-sent a distorted picture of the bulk of the distribution. The median is far less sensitive to extreme values and is thus a better measure of “typical” earnings. Fifty percent of gradu-ates in the field earn less than the median, while 50 percent earn more.
All earnings estimates have been rounded to the nearest $1,000.
6 HumanitiesIndicators.org

Share of College Graduates2 Who Are Satisfied with Their Life, by Field of Bachelor’s Degree, 2019
ASK A COLLEGE GRADUATE whether they are satisfied or dissatisfied with their life, and they are highly likely to report that they are satisfied—regardless of their field of de-gree. Approximately 90% of college graduates from each of the major fields indicated as much.3 So why, one might ask, is there a perception that graduates from some fields—most notably the humanities—end up worse off after earning their degree?
This report unpacks that assumption, presenting what high-quality national data reveal about differences among fields in the career and other life outcomes of their grad-uates. Identifying the sources of these differences—under-standing the “why” behind the “what” presented in these pages—will require further research.
0%
10%
20%
30%
40%
50%
60%
70%
80%
90%
100%
Education Engineering Health &Medical
Sciences
NaturalSciences
Business Humanities Behavioral &Social
Sciences
Arts All Fields
STATE OF THE HUMANITIES 2021: WORKFORCE & BEYOND 7
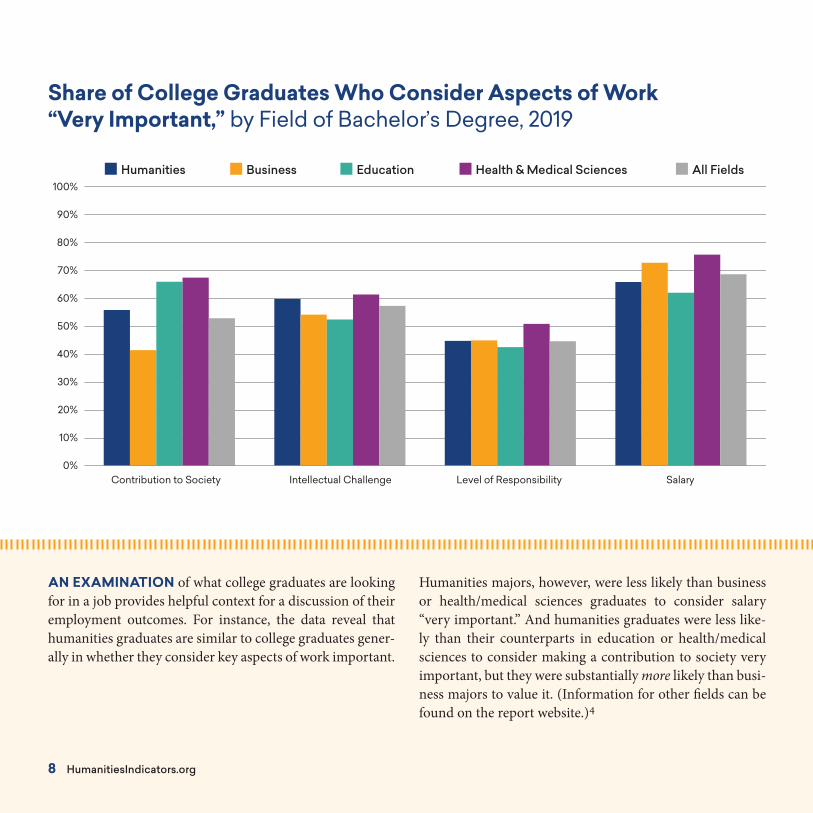
Share of College Graduates Who Consider Aspects of Work “Very Important,” by Field of Bachelor’s Degree, 2019
AN EXAMINATION of what college graduates are looking for in a job provides helpful context for a discussion of their employment outcomes. For instance, the data reveal that humanities graduates are similar to college graduates gener-ally in whether they consider key aspects of work important.
Humanities majors, however, were less likely than business or health/medical sciences graduates to consider salary “very important.” And humanities graduates were less like-ly than their counterparts in education or health/medical sciences to consider making a contribution to society very important, but they were substantially more likely than busi-ness majors to value it. (Information for other fields can be found on the report website.)4
0%
10%
20%
30%
40%
50%
60%
70%
80%
90%
100%
Contribution to Society Intellectual Challenge Level of Responsibility Salary
Humanities Business Education Health & Medical Sciences All Fields
8 HumanitiesIndicators.org

Occupational Distribution of Terminal Bachelor’s Degree Holders, by Field of Degree, 20185
ALSO SHAPING PERCEPTIONS about the value of hu-manities degrees is the sense that graduates from the field are less likely than other graduates to be prepared for a va-riety of occupations, a belief encapsulated in the stereotype of humanities majors as baristas and reflected in pressure on college provosts “to focus on academic programs that have a clear orientation toward careers.”6 Contrary to the
stereotype, humanities graduates—even those without ad-vanced degrees—are widely distributed across occupational categories, similar to college graduates generally and those from the science disciplines.7 This report will offer a clos-er look at where humanities graduates find work, as well as their satisfaction with those jobs.
0%
10%
20%
30%
40%
50%
60%
70%
80%
90%
100%
Humanities Behavioral & Social Sciences
Life Sciences Physical Sciences
All Fields
Other
Service
Sales
Administrative Support & Office
Other Management, Professional,& Related Occupations
Management
Healthcare
Education
Computer
Community & Social Services
Business & Financial Operations
Arts, Design, Entertainment, & Media
STATE OF THE HUMANITIES 2021: WORKFORCE & BEYOND 9

Earnings Comparison: Workers8 with a Terminal Bachelor’s Degree (by Field of Degree) versus Those without a Four-Year Degree, 2018
EARNINGS TEND TO BE THE FOCUS of conversations about the value of college degrees, in part because they are relatively easy to measure. Median annual earnings for work-ers with a terminal bachelor’s degree in the humanities stood at $58,000 in 2018, which was somewhat below the median for all college graduates ($63,000) but similar to the earnings for graduates from the behavioral/social and life sciences and considerably higher than those with a baccalaureate degree in education ($46,000). The relatively low median earnings
of education majors are notable given their high levels of job and life satisfaction (discussed elsewhere in this publication).
While humanities graduates’ earnings were lower than those for engineering, business, and some science graduates, they were much higher than those of workers who lack a bache-lor’s degree—both those with an associate’s degree or some college ($45,000) and those with only a high school diploma ($38,000).9
Engineering Business Physical Sciences
Health& MedicalSciences
Behavioral& Social
Sciences
Humanities LifeSciences
Arts Education AllFields
Associate’s Deg. or
Some College
HighSchool
Diploma
$0
$20,000
$40,000
$60,000
$80,000
$100,000
$120,000
Med
ian
Ann
ual E
arni
ngs
Workers with a Terminal Bachelor’s DegreeWorkers without aBachelor’s Degree
10 HumanitiesIndicators.org

Earnings of College Graduates, by Field of Bachelor’s and Highest Degree, 2018
AS OF 2018, approximately 41% of humanities graduates held an advanced degree (similar to the share of all college graduates who had earned such a degree).10 As with other college graduates, obtaining an advanced degree made a sub-stantial difference in the earnings of humanities majors. The median earnings of humanities majors who went on to earn
an advanced degree (which may be in another field) were 34% higher than those of workers with only a bachelor’s de-gree ($78,000 as compared to $58,000). Among college grad-uates generally, advanced degree holders earned 37% more than terminal bachelor’s degree holders, with the largest in-crease found among graduates from the life sciences (80%).11
$0
$20,000
$40,000
$60,000
$80,000
$100,000
$120,000
$140,000
Med
ian
Ann
ual E
arni
ngs
Humanities Arts Behavioral & Social
Sciences
Business Education Engineering Health &Medical
Sciences
LifeSciences
PhysicalSciences
All Fields
Bachelor’s Degree Advanced Degree (in Any Field)
STATE OF THE HUMANITIES 2021: WORKFORCE & BEYOND 11

Gender Earnings Gap12 among College Graduates, by Field of Bachelor’s and Highest Degree, 2018
GENDER ALSO MAKES A DIFFERENCE in gradu-ates’ earnings. Among college graduates generally, wom-en earned substantially less than their male counterparts, though the 16% gender gap in earnings among holders of terminal bachelor’s degrees in the humanities was smaller than the gap among graduates from business, the physical sciences, or the behavioral/social sciences.
For most fields, including the humanities, the gap in earn-ings between men and women was larger for those who had earned advanced degrees. But the difference between humanities graduates with only a bachelor’s and those who had gone on to earn an advanced degree was modest com-pared to that found among life or health/medical science graduates.13
Humanities Arts Behavioral & Social
Sciences
Business Education Engineering Health &Medical
Sciences
LifeSciences
PhysicalSciences
All Fields0%
10%
20%
30%
40%
50%
60%
70%
80%
90%
100%Bachelor’s Degree Advanced Degree (in Any Field)
12 HumanitiesIndicators.org

Earnings of Older College Graduates, by Highest Degree: Humanities Compared to Other Fields of Bachelor’s Degree, 2018
WHILE HUMANITIES GRADUATES have substantial me-dian earnings in their peak earnings years (from their late 40s into their 50s), they earned less than graduates from business and several STEM fields. The median earnings of terminal bach-elor’s degree holders generally were 8.5% higher than those of humanities graduates whose highest degree was a bachelor’s.
The differential between every higher-earning field and the humanities was almost as large if not larger when the focus
shifts to workers with an advanced degree. A particularly dramatic example is the life sciences, whose advanced de-gree holders earned 40% more than their counterparts in the humanities, even though median earnings of the two fields’ graduates were almost identical for those with just a bachelor’s degree. Advanced degree holders generally earned 11% more than humanities graduates with the same level of education.14
Arts Behavioral & Social
Sciences
Business Education Engineering Health &Medical
Sciences
LifeSciences
PhysicalSciences
All Fields
Med
ian
Ann
ual E
arni
ngs
(Tho
usan
ds)
$0
$20
$40
$60
$80
$100
$120
$140
$71
$91
Bachelor’s Degree Advanced Degree (in Any Field)
Earnings of Humanities Majors
STATE OF THE HUMANITIES 2021: WORKFORCE & BEYOND 13

College Graduates’ Financial Satisfaction, by Field of Bachelor’s Degree, 2019
WITH THE EXCEPTION OF ENGINEERING on the high side and the arts on the low side, from 46% to 55% of each field’s graduates agreed they had “enough money to do ev-erything I want to do.” Conversely, from 31% to 41% of the graduates from those “typical” fields reported they had wor-ried about money in the past seven days.
Graduates from the humanities, arts, and behavioral/social sciences were similar in that less than half of graduates felt they had enough money, while slightly more than 40% had worried about money. Curiously, however, a majority of education graduates felt they had enough money—a share similar to that of several higher-earning fields—even though graduates from the field had the lowest median earnings.15
Perc
enta
ge A
gree
ing
with
Sta
tem
ent
0%
10%
20%
30%
40%
50%
60%
70%
80%
90%
100%
Humanities Arts Behavioral & Social
Sciences
Business Education Engineering Health &Medical
Sciences
NaturalSciences
All Fields
I have enough money to do everything I want to do. In the last seven days, I have worried about money.
14 HumanitiesIndicators.org

Unemployment among Humanities Bachelor’s Degree Holders, by Age and Highest Degree, 2013–2018
RELATIVE UNEMPLOYMENT RATES can also play an important part in perceptions of the postcollegiate out-comes of humanities graduates. Like graduates from every other field, holders of bachelor’s degrees in the humanities experienced a sharp drop in unemployment from the Great Recession to the COVID-19 pandemic. From 2013 to 2018,
the rate fell to near 3% for those with just a bachelor’s degree, and to below 2% among older advanced degree holders. (In 2018, the unemployment rate among workers who complet-ed high school but did not attend college was 7.3% for those ages 24–34, and 4.4% for those ages 35–54.)16
0%
1%
2%
3%
4%
5%
6%
7%
8%
9%
10%2013 20182015
Ages 24 to 34 Ages 35 to 54 Ages 24 to 34 Ages 35 to 54
Bachelor's Degree Advanced Degree (in Any Field)
STATE OF THE HUMANITIES 2021: WORKFORCE & BEYOND 15

Unemployment among College Graduates, by Field of Bachelor’s and Highest Degree, 2018
WHILE THEIR UNEMPLOYMENT RATE had declined since the Great Recession, humanities graduates in 2018 had a slightly higher level of unemployment than the bach-elor’s-holding population as a whole. The 3.6% unemploy-ment rate among terminal bachelor’s degree holders in the humanities compares to 2.9% among graduates from all fields combined. Education and health/medical sciences graduates had the lowest levels of unemployment among terminal bachelor’s degree holders (2.0%).
For every field, unemployment was lower among advanced degree holders than among those with just a bachelor’s de-gree. Among graduates with an advanced degree, the hu-manities’ rate (2.4%) was virtually identical to that of busi-ness and engineering. Education graduates had the lowest rate among advanced degree holders (1.4%).17
Humanities Arts Behavioral & Social
Sciences
Business Education Engineering Health &Medical
Sciences
LifeSciences
PhysicalSciences
All Fields0%
1%
2%
3%
4%
5%
6%
7%
8%
9%
10%Bachelor’s Degree Advanced Degree (in Any Field)
16 HumanitiesIndicators.org

Satisfaction of College Graduates with Monetary Aspects of Their Job, by Field of Bachelor’s Degree, 2019
DESPITE DISPARITIES AMONG FIELDS in graduates’ median earnings, when college graduates were asked about their satisfaction with various financial aspects of their job, humanities majors’ responses were similar to those of col-lege graduates in general. The figure above highlights a few of the fields to which the humanities is often compared.
On salary, 74% of humanities graduates expressed satisfac-tion, a slightly smaller share than among college graduates generally (78%) but almost 11 percentage points smaller than for engineering graduates. Graduates from education, engi-neering, and health/medical sciences were somewhat more likely to express satisfaction about their opportunities for advancement than humanities majors. The share of human-ities graduates expressing satisfaction with job security was very similar to the shares in the other fields examined here.18
0%
10%
20%
30%
40%
50%
60%
70%
80%
90%
100%
Perc
enta
ge S
atis
fied
Salary Job Security Opportunities for Advancement
Humanities Business Education Health & Medical SciencesEngineering All Fields
STATE OF THE HUMANITIES 2021: WORKFORCE & BEYOND 17

Occupational Distribution of Humanities Bachelor’s Degree Holders, by Highest Degree, 2018
THE OCCUPATIONAL DISTRIBUTION of humanities majors who went on to earn an advanced degree differs substantially from that of their counterparts with a termi-nal bachelor’s degree. Among those whose highest degree was a bachelor’s, over a third were employed in office, sales, and service jobs, as compared to only 13% of those with ad-vanced degrees. In contrast, those who had gone on to earn
an advanced degree (in any field) were likeliest to work in education occupations, with 28% holding such jobs (the bulk of them in precollegiate teaching), with another 12% employed in legal occupations. The share in management jobs, however, was similar between terminal bachelor’s and advanced degree holders, accounting for 15% and 12% of each group, respectively.19
Percentage of Graduates in Occupation0% 5% 10% 15% 20% 25% 30%
Other
Service
Sales
Management
Library & Museum
Legal
Healthcare
Engineering & Sciences
Education—Other
Education—Postsecondary Teaching
Education—Precollegiate Teaching
Computer
Community & Social Services
Business & Financial Operations
Arts, Design, Entertainment & Media
Administrative Support & Office
Bachelor’s Degree
Advanced Degree (in Any Field)
18 HumanitiesIndicators.org

Share and Number of Workers in Various Occupations20 Who Hold a Bachelor’s Degree in the Humanities, 2018
WHILE HUMANITIES GRADUATES can be found in every broad occupation category, they account for a wide-ly varying share of each, ranging from more than a third of the employees in library/museum jobs to less than 5% of those in engineering/sciences positions. In addition to the sizable share of library/museum workers they represented, humanities graduates accounted for more than 20% of the employees in both legal and arts/media jobs.
Given the disparities in the size of each occupation, howev-er, the largest number of employees with a bachelor’s degree in the humanities, over 1.1 million, was found in the educa-tion category. Over 900,000 humanities graduates were em-ployed in management positions. Substantial numbers were also employed in administrative support/office, business/financial, and sales occupations (with more than 600,000 humanities graduates in each of these categories).21
Percentage of Workers in Occupation WhoMajored in the Humanities (with Number of Workers)
0% 5% 10% 15% 20% 25% 30% 35% 40% 45% 50%
Engineering & Sciences
Healthcare
Computer
Business & Financial Operations
Management
Service
Sales
Community & Social Services
Administrative Support & Office
Education
Arts, Design, Entertainment & Media
Legal
Library & Museum
132,967
307,017
221,467
667,479
913,501
452,882
624,838
264,383
630,868
1,170,583
379,514
388,733
68,350
STATE OF THE HUMANITIES 2021: WORKFORCE & BEYOND 19

Employer Assessment of Importance of Humanities Skills and Recent College Graduates’ Preparation, 202022
GIVEN THE VARIETY OF OCCUPATIONS performed by humanities graduates, further study is needed to assess how their college coursework prepares them for employ-ment. What research does exist highlights the value to employers of a range of skills thought to be developed in humanities courses. For instance, a recent survey of 500 employers commissioned by the Association of American
Colleges & Universities found that a majority of employers considered several such skills—including writing, public speaking, and collaborating with people of different cul-tures—to be very important for their employees. For every skill, a smaller share of employers believed recent college graduates were “very well prepared” to use the skill in the workplace.23
0% 10% 20% 30% 40% 50% 60% 70% 80% 90% 100%
Consider Skill “Very Important”
Report that Recent Graduates Are “Very Well Prepared”
Locate, Evaluate & Use Informationin Decision Making
Integrate Ideas/Information acrossDifferent Settings & Contexts
Critical Thinking Skills
Communicate/Work with Peoplefrom Different Cultural Backgrounds
Communicate Effectivelythrough Writing
Communicate Effectively throughSpeaking/Presentation Skills
20 HumanitiesIndicators.org

Adult Workers’ Use of Humanities-Related Skills on the Job (Self-Reported), 2019
THE EXTENT TO WHICH PEOPLE actually use such skills offers another measure of the value of a humanities education. A survey of American adults by the Humanities Indicators found that most workers used humanities-relat-ed skills on the job. Of the seven skill areas included in the survey, workers used an average of four at least sometimes,
and 81% used at least one of these skills often or very often in their jobs. More than half of employed Americans worked with people from different cultures often or very often as part of their job, and approximately the same percentage en-gaged in descriptive writing; however, workers were far less likely to use other humanities-related skills that frequently.24
Work withPeople from
Different Cultures
Write to Describeor Explain
Something
Balance OpposingViewpoints in a
Discussion, Argument,or Decision
Engage inConcentrated
Reading for Morethan 20 Minutes
Write toPersuadeSomeone
Do HistoricalResearch or Apply
a Historical Perspective
Use a LanguageOther than
English
0%
10%
20%
30%
40%
50%
60%
70%
80%
90%
100%Often Sometimes NeverVery Often Rarely
STATE OF THE HUMANITIES 2021: WORKFORCE & BEYOND 21
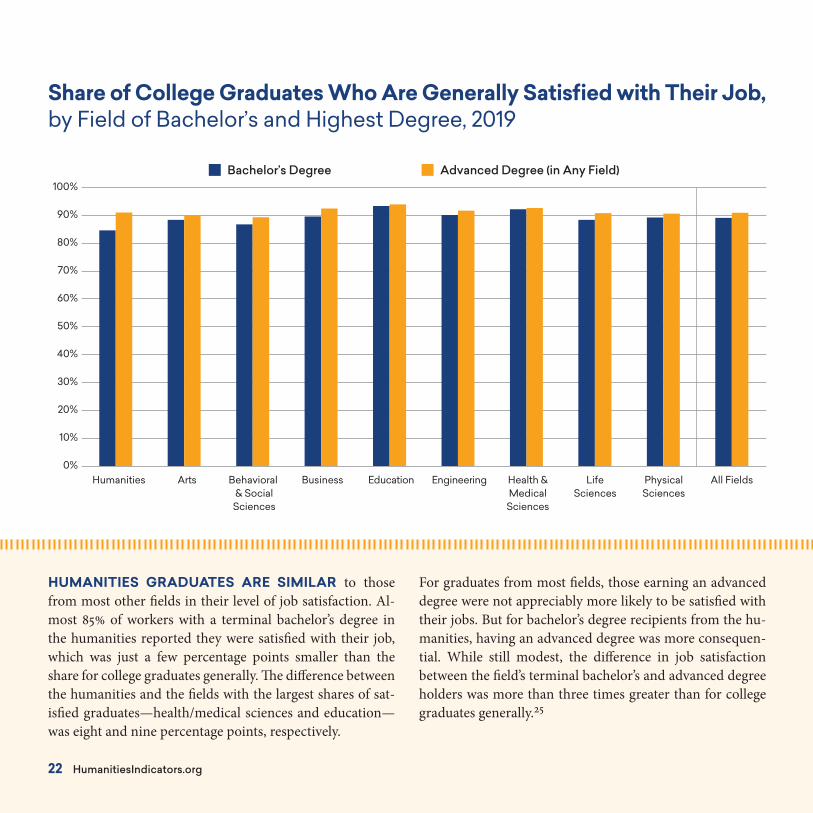
Share of College Graduates Who Are Generally Satisfied with Their Job, by Field of Bachelor’s and Highest Degree, 2019
HUMANITIES GRADUATES ARE SIMILAR to those from most other fields in their level of job satisfaction. Al-most 85% of workers with a terminal bachelor’s degree in the humanities reported they were satisfied with their job, which was just a few percentage points smaller than the share for college graduates generally. The difference between the humanities and the fields with the largest shares of sat-isfied graduates—health/medical sciences and education—was eight and nine percentage points, respectively.
For graduates from most fields, those earning an advanced degree were not appreciably more likely to be satisfied with their jobs. But for bachelor’s degree recipients from the hu-manities, having an advanced degree was more consequen-tial. While still modest, the difference in job satisfaction between the field’s terminal bachelor’s and advanced degree holders was more than three times greater than for college graduates generally.25
Humanities Arts Behavioral & Social
Sciences
Business Education Engineering Health &Medical
Sciences
LifeSciences
PhysicalSciences
All Fields0%
10%
20%
30%
40%
50%
60%
70%
80%
90%
100%Bachelor’s Degree Advanced Degree (in Any Field)
22 HumanitiesIndicators.org

Share of College Graduates with Positive Perceptions of Their Job, by Field of Bachelor’s Degree, 2019
MORE SPECIFIC MEASURES of job satisfaction reveal similarities between the humanities and other fields. For in-stance, more than half of humanities graduates believe they have the “ideal job” for them, which was similar to college graduates in general but a modestly smaller share than for education or STEM majors (with the exception of behavior-al/social sciences graduates).
Approximately two-thirds of humanities graduates re-ported they were “deeply interested in the work that I do,” and a nearly equal share indicated that their job provided the “opportunity to do what I do best every day.” This was again similar to the share for college students in general but a somewhat smaller percentage than for education or STEM graduates (again excluding behavioral/social sciences majors).26
Perc
enta
ge W
ho A
gree
0%
10%
20%
30%
40%
50%
60%
70%
80%
90%
100%
Humanities Arts Behavioral & Social
Sciences
Business Education Engineering Health &Medical
Sciences
NaturalSciences
All Fields
At work, I have the opportunity to do what I do best every day.I am deeply interested in the work I do.I have the ideal job for me.
STATE OF THE HUMANITIES 2021: WORKFORCE & BEYOND 23

Satisfaction of Humanities Bachelor’s Degree Holders with Nonmonetary Aspects of Their Job, by Field of Bachelor’s Degree, 2019
HUMANITIES GRADUATES WERE ALSO SIMILAR to college graduates generally in their attitudes about some of the less tangible aspects of their job. The shares of graduates with bachelor’s degrees in the humanities who expressed satisfaction about the degree of independence and level of responsibility in their job were very similar to the shares for fields to which the humanities is often compared. Two fields,
however, stand out for the satisfaction their graduates derive from their work.27 Education and health/medical sciences graduates were appreciably more likely to express satisfac-tion (in comparison both to the humanities and to college graduates generally) with the intellectual challenges and contributions to society afforded by their jobs.
Perc
enta
ge S
atis
fied
0%
10%
20%
30%
40%
50%
60%
70%
80%
90%
100%
Contribution to Society Degree of Independence Intellectual Challenge Level of Responsibility
Humanities Business Education Health & Medical Sciences All Fields
24 HumanitiesIndicators.org

Satisfaction of Humanities Bachelor’s Degree Holders with Aspects of Their Job, by Highest Degree, 2019
AMONG THOSE WHO EARNED a bachelor’s degree in the humanities, the rates of satisfaction with various aspects of their job tended to be at least somewhat higher among those who had gone on to complete an advanced degree. Humanities majors who had earned an advanced degree (in either the humanities or a nonhumanities field) were appre-ciably more likely to be satisfied with the contribution their work allowed them to make to society as well as the intellec-tual challenge of their job.
Advanced degree holders were also modestly more likely to express satisfaction with their opportunities for advance-ment. A similar difference—though still quite modest—was observed between terminal humanities bachelor’s degree holders and holders of an advanced degree in the human-ities with regard to their level of job responsibility.28
Percentage Satisfied0% 10% 20% 30% 40% 50% 60% 70% 80% 90% 100%
Salary
Opportunities for Advancement
Level of Responsibility
Job Security
Job Location
Intellectual Challenge
Degree of Independence
Contribution to Society
Benefits
Bachelor’s Degree inthe Humanities
Advanced Degree inthe Humanities
Advanced Degree in aNonhumanities Field
STATE OF THE HUMANITIES 2021: WORKFORCE & BEYOND 25

Terminal Bachelor’s Degree Holders’ Perception of How Related Their Job Is to Their Degree, by Field of Degree, 2019
THOUGH THE PREVIOUS PAGES have highlighted ar-eas in which humanities graduates tend to be similar to their counterparts in other fields, humanities graduates differ in at least one key way that may reinforce negative perceptions of the field. A wide gap separates humanities majors and graduates from certain professional and STEM fields in their perception of the relationship between their job and their degree. (Graduates from the behavioral/social sciences were
more similar to humanities graduates in this regard.) Ex-cluding those with advanced degrees, more than a third of bachelor’s degree holders from the humanities saw no rela-tionship between their degree and their job, as compared to less than 15% of graduates from engineering and the health/medical sciences, and approximately 20% of education and business graduates.29
Perc
enta
ge D
escr
ibin
g Jo
b &
Bac
helo
r’s D
egre
e as
. . .
0%
10%
20%
30%
40%
50%
60%
70%
80%
90%
100%
Humanities Arts Behavioral & Social
Sciences
Business Education Engineering Health &Medical
Sciences
PhysicalSciences
LifeSciences
All Fields
Closely Related Somewhat Related Not Related
26 HumanitiesIndicators.org

College Graduates’ Perception of the Value of Their Undergraduate Education, 2018/201930
A SUBSTANTIAL SHARE of humanities graduates also ex-pressed ambivalence about their degrees. Approximately 40% in-dicated that they would not choose the same major again, and a similar share reported they did not believe that their undergrad-uate institution prepared them for life. In these respects, human-ities majors were similar to college students in general and also to business and behavioral/social sciences majors. Engineering and health/medical sciences graduates were considerably more likely to say that they would choose the same major again.
Because graduates were not asked to identify a major they would have preferred, we cannot conclude that they would have chosen a major in a different field. Some humanities graduates, for example, might have chosen to major in a dif-ferent discipline within the humanities. Nevertheless, this finding and the lack of a perceived relationship between job and degree point to a challenge for the field.
Perc
enta
ge W
ho . .
.
0%
10%
20%
30%
40%
50%
60%
70%
80%
90%
100%
Humanities Arts Behavioral & Social
Sciences
Business Education Engineering Health &Medical
Sciences
NaturalSciences
All Fields
Would Choose the Same Major Believe “My College/University Prepared Me Well for Life Outside of College”
STATE OF THE HUMANITIES 2021: WORKFORCE & BEYOND 27

College Graduates’ Assessment of Their Current and Future Progress Toward “My Best Possible Life,” by Field of Degree, 2019
DESPITE THE AMBIVALENCE about their degrees, more than three-quarters of humanities graduates saw themselves at least 70% of the way to realizing their “best possible” life, a similar share to that for college graduates generally. Health/medical sciences majors were the most likely to feel they had made that much progress (with a share of 84%).
The difference between the humanities and other fields was even smaller in terms of graduates’ estimate about where they would stand in the future. Ninety percent of human-ities majors believed they would be approaching their best life in five years, a share almost identical to that for gradu-ates from each of the other major fields.31
0%
10%
20%
30%
40%
50%
60%
70%
80%
90%
100%
Humanities Arts Behavioral & Social
Sciences
Business Education Engineering Health &Medical
Sciences
NaturalSciences
All Fields
Today In Five YearsShare Believing that They Are/Will Be at Least 70% of the Way to Their “Best Possible Life”
28 HumanitiesIndicators.org

Endnotes
1. In Florida, for instance, a bill was recently introduced in the state senate to limit scholarships for degree programs that “do not lead di-rectly to employment.” Both wages and industry demand for gradu-ates would be used to exclude degree programs (https://flsenate.gov/Session/Bill/2021/86/BillText/c2/PDF). The bill was widely interpret-ed as an effort to reduce funding for arts and humanities subjects. See, for instance, Irfan Kovankaya, “I Was a Liberal Arts Major: Educa-tion Is about More than Jobs,” Tallahassee Democrat, March 4, 2021.
2. This report describes two populations. The population mentioned here, “college graduates,” includes everyone with a bachelor’s de-gree from the field, regardless of whether they went on to earn an advanced degree. Other graphs refer to “terminal bachelor’s degree holders,” which excludes graduates with an advanced degree.
3. Gallup Alumni Survey, 2019 (custom data analysis performed by Gallup for the Humanities Indicators, 2021; a description of the sur-vey’s methodology is available at https://www.gallup.com/185474/strada-gallup-alumni-survey.aspx). The values presented in this graph (and every other one in this publication) are estimates derived from data collected from a sample of the population.
Regardless of the data source, the “health and medical sciences” field-of-degree category used in this publication includes nursing, pharma-cy, and other fields of study designed to prepare students for specific medical vocations. Most students who go on to earn an M.D., D.D.S., or D.V.M., however, will not have earned an undergraduate degree of this type. While these students may have been on what their institu-tion refers to as a “pre-med track,” their major is most often in biolo-gy, which is included in the “life sciences” field-of-degree category (or “natural sciences,” depending on the data source).
4. Original analysis by the Humanities Indicators of data from the National Science Foundation, National Survey of College Graduates, 2019.
5. Degree holders are those employed at any time in the five years preceding their response to the American Community Survey, the source of the data on which this graph is based.
6. Scott Jaschik and Doug Lederman, 2021 Survey of College and Uni-versity Chief Academic Officers (Washington, D.C.: Inside Higher Ed, 2021). See, for instance, the findings from the “What Everyone Says about the Humanities” study of news coverage of the field, such as The Media Assesses the Value of the Humanities Both Economically and In-trinsically—But the Great Recession Changed the Balance of the Dis-cussion, WE1S Key Finding KF-4-1 (last revised August 2, 2020), at https://we1s.ucsb.edu/wp-content/uploads/KF-4-1.pdf.
7. Original analysis by the Humanities Indicators of U.S. Census Bu-reau, 2018 American Community Survey Public Use Microdata Sam-ple (PUMS).
8. All earnings estimates presented in this publication are for grad-uates who worked 35 or more hours per week for 50 or more weeks in the 12 months preceding the date on which they responded to the American Community Survey. Earnings estimates for workers with-out college degrees are for people age 24 or older.
9. 2018 American Community Survey PUMS.
10. For information regarding the share of each field’s graduates who have an advanced degree, see the report website.
STATE OF THE HUMANITIES 2021: WORKFORCE & BEYOND 29

11. 2018 American Community Survey PUMS.
12. In keeping with the practice of the Organisation for Economic Co-operation and Development, the gap was calculated by dividing the difference between men’s and women’s median earnings by men’s median earnings. For a breakdown of humanities graduates’ earnings by gender, see the Humanities Indicators website.
13. 2018 American Community Survey PUMS.
14. Ibid.
15. Gallup Alumni Survey, 2019.
16. 2018 American Community Survey PUMS.
17. Ibid.
18. National Survey of College Graduates, 2019. Information for the other fields can be found on the report website.
19. 2018 American Community Survey PUMS. Degree holders are those employed at any time in the five years preceding their response to the survey.
20. Currently employed workers only.
21. 2018 American Community Survey PUMS.
22. The preparedness opinions refer to all recent graduates, not just humanities majors.
23. Ashley Finley, How College Contributes to Workforce Success: Employer Views on What Matters Most (Washington, D.C.: Asso-ciation of American Colleges and Universities, 2021), 16, https://www.aacu.org/sites/default/files/files/research/AACUEmployer Report2021.pdf. This study involved a survey of approximately 500 employers chosen to ensure equal representation of firms in terms of size, as well as diversity with respect to industry, control (for- profit, not-for-profit, government, etc.), and geographic scale of op-eration (local/regional/national/multinational). Because the sur-vey used nonprobability sampling, its findings may not be national-ly representative.
24. Humanities Indicators of the American Academy of Arts and Sci-ences, The Humanities in American Life: Insights from a 2019 Survey of the Public’s Attitudes & Engagement (Cambridge, Mass.: American Academy of Arts and Sciences, 2020), 69–70.
25. National Survey of College Graduates, 2019.
26. Gallup Alumni Survey, 2019.
27. National Survey of College Graduates, 2019. Information for the other fields can be found on the report website.
28. Ibid.
Endnotes
30 HumanitiesIndicators.org

29. Ibid.
30. Gallup Alumni Survey, 2018 (for item about college major); and Gallup Alumni Survey, 2019 (for item about preparation for life).
31. Gallup Alumni Survey, 2019.
STATE OF THE HUMANITIES 2021: WORKFORCE & BEYOND 31
Humanities Indicators
Project DirectorsNorman M. Bradburn, NORC at the University of Chicago Robert B. Townsend, American Academy of Arts and Sciences
Project StaffCarolyn Fuqua, Senior Research Associate Jessica Taylor, Louis W. Cabot Fellow in Humanities Policy
Advisory CommitteeEdward Ayers, University of Richmond Jack Buckley, American Institutes for Research Jonathan R. Cole, Columbia University Joy Connolly, American Council of Learned Societies John Dichtl, American Association for State and Local History Michael Hout, New York University Felice J. Levine, American Educational Research Association Phoebe Stein, Federation of State Humanities Councils Judith Tanur, Stony Brook University
The Academy gratefully acknowledges the financial support of The Andrew W. Mellon Foundation, primary funder of the Humanities Indicators.
32 HumanitiesIndicators.org


@americanacadwww.amacad.org
HumanitiesIndicators.org