state of the lake 2017 - home - waihora ellesmere trust · the state of the lake 2017 report...
TRANSCRIPT

Te Waihora/Lake Ellesmere State of the Lake 2017Edited by: Denise E. Ford, Kenneth F. D. Hughey, Kenneth J. W. Taylor
AcknowledgementsTe Waihora/Lake Ellesmere State of the Lake and Future Monitoring 2017 represents the collective effort of many people and organisations – partners, sponsors and contributors alike.
Partners Partners have contributed data, knowledge and expertise, and have helped with planning and preparing this report and the sixth Living Lake symposium.
We would like to thank: Waihora Ellesmere Trust, Environment Canterbury, Te Rūnanga o Ngāi Tahu, Selwyn District Council, Waterways Centre (Lincoln University and the University of Canterbury).
Gold Sponsors The following organisations have sponsored the symposium. We would like to thank:
Silver SponsorsThe following organisations were Silver Sponsors for the symposium. We would like to thank:
Ravensdown, EOS Ecology, Ballance Agri Nutrients Ltd, Rabobank, Our Land and Water – National Science Challenge, ESR (the Institute of Environmental Science and Research).
In Addition we would like to acknowledge EOS Ecology, and in particular Bronwyn Day, for the design and preparation of the Symposium promotional material.
Bronze SponsorsThe following organisations were Bronze Sponsors for the symposium. We would like to thank:
Central Plains Water, ASB Rural Banking, Lincoln Agritech Ltd, Selwyn District Council.
Authors, editors, design and printingThe completion of this report was made possible with the support of:
Lead authors Andrew Crossland, Shannan Crow, Tim Davie, Kimberley Dynes, Denise Ford, Philip Grove, Ken Hughey, Don Jellyman, Phil Jellyman, Kirsty Johnston, Verity Kirstein, David Perenara O’Connell, Craig Pauling, Darcel Rickard, Jodi Rees, Lisa Scott, Marc Schallenberg, Liza Scott, Nigel Scott, Diane Shelander, Anita Spencer, Kenneth Taylor, Murray Washington, Erica Williams.
Content editors Denise Ford, Waihora Ellesmere Trust, Kenneth F. D. Hughey, Waihora Ellesmere Trust/Lincoln University, Kenneth J. W. Taylor, Our Land and Water – National Science Challenge.
Design and printing In addition to providing content and assistance with developing the ideas behind this report, we must acknowledge Environment Canterbury Creative Services for the design and layout, in particular Melanie Banfield. We would also like to thank the Waterways Centre for Freshwater Management for printing the report.
Other contributors and reviewers Juila Fettes, Chelsea Halliwell, Mike Exner-Kittridge, Adrienne Lomax, Mark Parker, Maree Pycroft, Ian Whitehouse, Tami Woods.
Photo credits – listed by section Cover – Robin Smith
Contents page – ©Steve Attwood (Banded Dotterel)
2. Environment Canterbury (Mananui Ramsden – Cultural Land Management Advisor/Kaitohutohu Tikanga Role)
2a. Environment Canterbury (lake opening photos)
4. Denise Ford (Coes Ford)
5. Philip Grove (native vegetation recovery), Jodi Rees (Willow control), Robin Smith (Williams Wildlife Management Reserve)
6. ©Steve Attwood (Royal Spoonbills nesting, White herons, Moko gecko), Anita Spencer, ©DOC (Kupe’s grassmoth, Canterbury Mudfish)
7. NIWA (sampling eels, water overtopping bar)
9. Denise Ford (Lakeside Domain), Adrienne Lomax (interpretation panel)
10. Craig Pauling (Pātiki – flounder, Tuna – eel)
11. Mac Schallenberg (PhD Student, sediment core)
12. Denise Ford (Kaitorete Spit)
2

Reference informationAny part of this report may be reproduced for private study, research or review. Images remain the copyright of the credited photographer, and may not be reproduced without their prior written permission.
We suggest this publication be referenced as: Ford, D.E., Hughey, K.F.D., and Taylor K.J.W. (eds). 2017. Te Waihora/Lake Ellesmere: State of the Lake 2017. Waihora Ellesmere Trust Technical Report No.3.
ISBN 978-0-473-41545-7 (Softcover); 978-0-473-41546-4 (PDF)
This report has been prepared as a downloadable resource and is available from the WET website: www.wet.org.nz. Many sections in this report are based on more detailed reports and where possible those reports or links to them have been made available on the WET website, along with links to other information of interest.
PrefaceThe Waihora Ellesmere Trust continues to facilitate the biennial Living Lake Symposium and 2017 heralds the sixth such effort. While the health of lake itself will always remain dear to the hearts of those who use and treasure it, what is happening within the catchment environs is also important and should not be lost sight of. With that in mind the theme for this year is “Streams of Actions”, a theme that continues to embrace “ki uta ki tai/from the mountains to the sea” principles.
In keeping with the goal of this Symposium, and of those who are dedicated to the health of Te Waihora/Lake Ellesmere, it is important to persist with developing a more complete understanding of how the Lake functions (both as an ecosystem and as part of a wider ecosystem), how people identify with and value it and its surrounds, and most importantly, how it can be cared for, celebrated and appreciated by all. This “picture” can only be illustrated through the gathering of diverse but valid data and information.
Therefore, the content of this report covers a wide range and depth of information, building on the set of indicators that were reported against in 2015 and 2013. Whilst this represents further evolution in State of the Lake reporting, it is by no means a job completed. Future reporting will be guided by the recommendations in this document, to build a fuller picture of the Lake, what influences its health, and how we can better achieve our goal of continued improvement.
I encourage you to review, reflect and discuss the findings in this year’s report, and to consider what further information might be required for your own vision of Te Waihora/Lake Ellesmere to be realised.
Ray Maw Chair, Waihora Ellesmere Trust
ContentsCatchment map 4
Introduction 5
Governance and management 8
Lake level management 11
Land 13
Water 17
Vegetation 22
Wildlife 25
Fish 29
Economy 33
Recreation 36
Horomaka Kōhanga 39
In Lake Nutrient Processing 42
City to lake links 44
Discussion 47
DisclaimerThe authors and publishers have endeavoured to ensure that the information contained in this publication is accurate and up to date at the time of publication. Neither the publishers nor the authors accept responsibility for any errors or omissions or for the results of any actions taken in reliance on the contents of this publication. The authors and publishers expressly disclaim any and all liability for any loss or damages, whether direct or indirect or consequential arising from anything done or omitted to be done based wholly or in part on the contents of this publication.
Feedback on the reportWaihora Ellesmere Trust would like to hear your feedback on this report. What is missing, what do you want to know more about? What data exists that we have overlooked? If you have any comments please send them to [email protected].
3

Sour
ce: E
nviro
nmen
t Can
terb
ury
2015
4

Te Waihora/Lake Ellesmere is one of New Zealand’s most important wetland systems. It is an area of cultural, natural, historic, recreational and economic importance to many people. The outstanding values of the lake are recognised in the National Water Conservation Order over the lake as: habitat for wildlife, indigenous wetland vegetation and fish; and as being of significance in accordance with tikanga Māori in respect of Ngāi Tahu history, mahinga kai and customary fisheries. Internationally Te Waihora/Lake Ellesmere is significant for its abundance and diversity of birdlife.
Why are we reporting on the state of the lake? The State of the Lake report is written in conjunction with the Living Lake Symposium. The first Living Lake Symposium held in 2007 was partly in response to media reports that the lake was “technically dead”.
The first Symposium had several key objectives:
• To determine the overall state of the lake, by first defining the key value sets, and indicators that could be reported against;
• To suggest future management actions that would address key issues affecting the defined values;
• To provide a forum within which lay individuals, scientists and managers could openly debates issues; and
• To provide a launching pad for integrated and focused future management of the lake and its environs.
Following the 2007 Symposium the Te Waihora/Lake Ellesmere State of the Lake and Future Management report was published in 2008. This report brought together ten principal presentations at the symposium. Subsequently the Living Lake Symposium has been held biennially with this year 2017 being the sixth. The State of the Lake report published in 2013 and 2015 provided an update to the topics identified and reported on in the 2008 report.
It has long been recognised that the health of the lake and tributaries has declined over past decades through land use changes. Ongoing reporting on the health of the lake will indicate if management interventions; not only in and around the lake but in the broader catchment, are reversing these declines. We also hope to identify other issues that may impact on the lake and environs such as climate change, urban development, and rural land use changes in the catchment. Importantly, our aim is to strengthen links between science, monitoring and management, along with informing the public. Ten years on much public perception of the state of the lake remains as it was in 2007.
The 2017 report is an update to the Te Waihora/Lake Ellesmere State of the Lake 2013 and Te Waihora/Lake Ellesmere State of the Lake 2015 reports. This year additional sections have been included: City to Lake Links, Christchurch City Council, whom joined the Te Waihora Co-Governance Group in 2016; and, In Lake Nutrient Processing, based on research funded by Whakaora
Te Waihora and Environment Canterbury examining how Te Waihora/Lake Ellesmere processes nitrogen and phosphorus loads entering the lake.
The State of the Lake 2017 report particularly focuses on providing an update on the period July 1, 2015 to June 30, 2017. This report is for anyone with an interest in the lake – people who work and play in the area, decision makers and managers, industry and interest groups, and the wider community.
Authors and dataIndividuals and organisations with expertise in the different topics have contributed content for the sections, integrated here into one report to give an overview of the current state of the lake and its environs and, where possible, trends in selected indicators. All sections draw on more detailed sources of information and where possible we have made these available on the Waihora Ellesmere Trust website (www.wet.org.nz).
Outcomes, Targets and IndicatorsThe 2017 report draws on the same state of the environment framework used in the previous two reports; an expanded version of the OECD’s Pressure-State-Response framework (Figure 1.1).
The indicators and measures of success for each section are based on those identified and reported on in the 2013 and 2015 reports. For each topic an outcome statement was agreed1; how will we know if we have achieved success? Where possible, targets were identified to enable success to be measured (see Table 1.1) enabling an overview of progress or otherwise in relation to achieving the desired outcomes.
Summarising the dataThe traffic light bar provides a simple visual way to represent the current state of the lake. The bar, a continuum from very poor current state/progress (red) through to good current state/progress (green) was first used in the 2015. It has been used again this year to allow a comparison of progress.
current state for each indicator
IntroductionTe Waihora/Lake Ellesmere – State of the Lake 2017Lead authors: Kenneth F. D. Hughey, Denise E. Ford – Waihora Ellesmere Trust
Intr
oduc
tion
Section 1
1 For an explanation of the source of the outcome statements see www.wet.org.nz/wp-content/uploads/2013/10/2013-November-summary-of-outcomes-for-Te-Waihora.pdf
Intr
oduc
tion
DRIVING FORCESHuman influences and activities,
and natural conditions, which underpin environmental change
RESPONSESSocietal responses to mitigate
negative impacts on the environment, halt or reverse
environmental damage, and to manage resources sustainably
PRESSURESDirect or indirect pressures on the functionality and quality of the environment, resulting from
driving forces
IMPACTSEnvironmental effects of
pressures on the natural state
STATEThe current status of the
environment in terms of quality/quantity of natural resources
Figure 1.1: OECD’s Pressure-State-Response framework.
5

Recommendations This is a report on monitoring and the recommendations it includes relate largely to monitoring, rather than management. Are we looking at the right indicators, what are the data gaps, what are suggestions for future monitoring? Are the targets realistic/achievable, do we need to identify some interim targets to aim for in the short term?
Integrated monitoring strategy An integrated monitoring strategy for Te Waihora/Lake Ellesmere has been developed by Ken Hughey from Lincoln University. This is a living document which aims to develop and have implemented an ongoing set of indicators that can consistently report on targets set for the lake and environs. It recognises there will be occasional change to some indicators but that a core is necessary to provide ongoing trend monitoring.The monitoring and reporting strategy builds on existing data summarised from the 2013 and 2015 symposia. The 2017 Symposium and State of the Lake Report is a continuation of refining this strategy.
Topic How will we know if we have achieved success? Measures of success2 What gaps have been identified?
What are the recommendations?
– Governance and management
The role of Ngāi Tahu and kaitiakitanga is recognised in governance of the lake and catchment, there is integrated management of land and water use, and the wider community included in decision making
● Ngāi Tahu express satisfaction with governance and management arrangements
● All other agencies and key stakeholders are satisfied ● Community are happy with levels of consultation
and understand the decision making processes with respect to the lake and environs
A survey of awareness of and attitudes towards the lake among local community members
– Land use and land cover
Land use and development is integrated with water management; natural and cultural values are respected; all land use activities operate at good practice or better
● Diverse agricultural landscapes are supported with no one predominant land use
● Properties >20ha have restored/managed native vegetation/naturally occurring wetlands
● Restoration plantings show positive annual survival and growth trends
● Land and Water Regional Plan, Plan Change 1 (PC1) stock exclusion targets for waterways being met
● Farm Environment Plans receive audit grade A or B
● FEP audit results ● quantitative data about riparian management
and restoration projects, ● explore ways of sharing data, including making
better use of geographic information systems (GIS) and the web for state of the lake reporting.
– Water quantity and water quality
Water quantity: ecosystem and cultural health is restored and safeguarded; water users have reliable supplies, including for customary use, and recreational activitiesWater quality: water quality is improved to sustain cultural values; indigenous and wildlife species are supported; drinking water is safe and water quality suitable for recreation
● Trophic Lake Index (TLI) - mid lake limit = 6.6, margins = 6 (PC1)
● Water Quality Index - Fair or better (Canterbury Water Management Strategy (CWMS target)
● Invertebrate/habitat grades - Fair or better (CWMS target)
● Recreation grades - ‘Suitability for Recreation Grade’ of Good-fair (PC1, derived from MfE 2003)
● Potentially toxic cyanobacteria - < 1.8 mm3/L (Public health guideline -Ministry for the Environment and Ministry of Health in 2009)
● Ground water quality (N&P) - 8.5 mg/L for nitrate nitrogen (PC1), NB for drinking water Maximum Allowable Value of 11.3 mg/L nitrate nitrogen for drinking water (MoH, 2013), E. coli < 1 organism/100 ml (PC1), no target set for P
● Water Quantity (tributaries) minimum flow and restriction regimes set out in PC1
● Maximise the impact of available information, including real time monitoring data, through visual interpretation that speaks directly to the many communities of interest in lake management.
● other parties (e.g., universities, local community) involvement in additional monitoring of the lake/tributaries
● information is stored in a central repository/data base
Further recommendations will come from a current Waterways Centre research project to design a water quality monitoring programme for the lake and catchment.
– Vegetation Significant indigenous vegetation of the lake margin, wetlands and tributary streams is protected and restored
● An annual net gain of key habitat (e.g., raupō) and maintenance of important habitat types (e.g., saltmarsh)
● Maintain or increase populations of threatened or at risk plant species
● Annually reduce and stop spread of key problem willow species and other significant animal and pest weeds of native vegetation
● Aquatic macrophyte beds re-established and show positive growth rates
● Establishing permanent 10x10 m monitoring plots on public conservation land and ensuring comprehensive monitoring is undertaken at regular intervals, e.g., 3 yearly
● Continue to monitor lake margins and key tributaries for weed spread
● Where willows have been removed, and where vehicle/stock access has been removed from lake shore, establish photo points to monitor change
An offer has been made to compile a list of threatened species known to be present around the lake, and current threat ranking
– Wildlife Indigenous wildlife (birds, lizards, terrestrial invertebrates) and associated habitats are protected
BIRDS: ● Bird species diversity is maximised with a target
average level of 39 species from 7 guilds recorded per annum
● Bird species with a defined conservation risk and which rely on the lake for critical life stage requirements have populations enhanced
● The optimised range of habitat conditions for the diversity of bird species present is provided
LIZARDS: Specific measures not yet identifiedTERRESTRIAL INVERTEBRATES: Specific measures not yet identifiedAQUATIC INVERTEBRATES (LAKE): Measures neededNB aquatic invertebrates are monitored for rivers and streams and reported in the Water section
For birds and lizards: ● maintain current monitoring and species recovery
interventions, and report on responses
Terrestrial invertebrates: ● maintain current monitoring and species
recovery interventions, and report on responses ● encourage student researchers to target key
shoreline areas of the lake to document species presence
Aquatic invertebrates: ● develop and implement a monitoring programme
for lake flies (Chironomus zealandicus) that links to changing lake levels.
6
2 Source of measures of success acknowledged where derived from a planning document or similar; otherwise developed by author of the monitoring strategy based on discussion with a reference group
Topic How will we know if we have achieved success? Measures of success2 What gaps have been identified?
What are the recommendations?
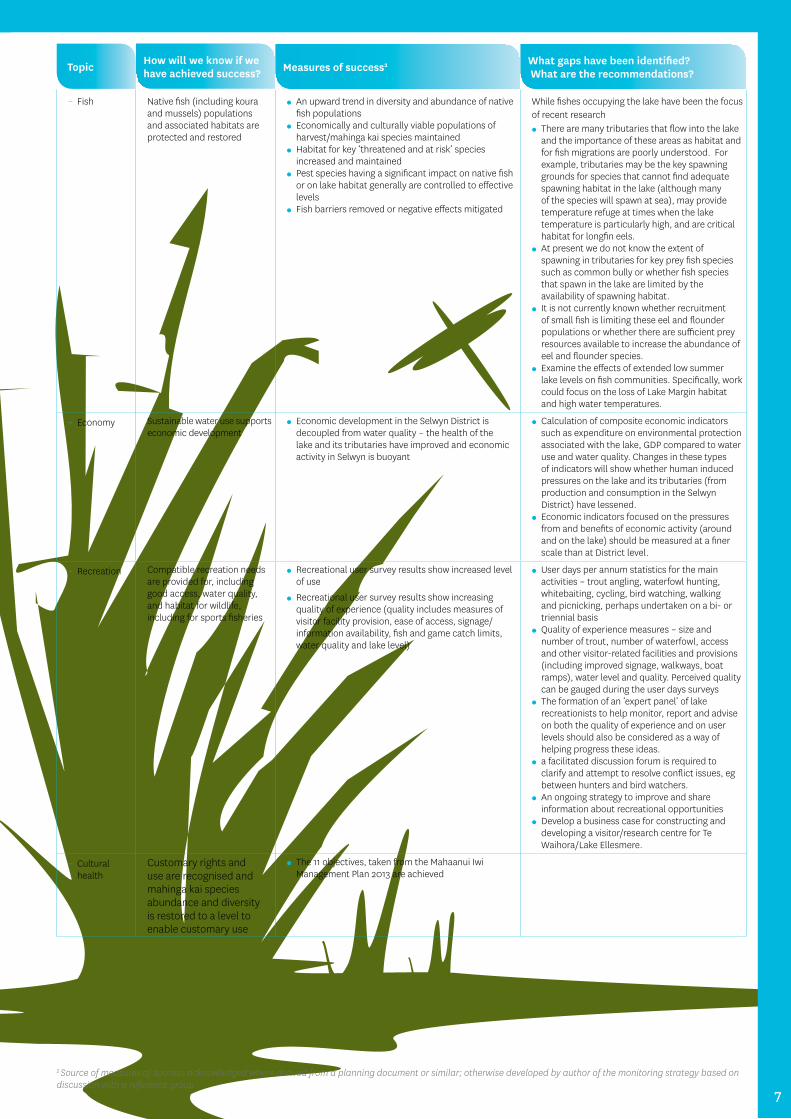
– Fish Native fish (including koura and mussels) populations and associated habitats are protected and restored
● An upward trend in diversity and abundance of native fish populations
● Economically and culturally viable populations of harvest/mahinga kai species maintained
● Habitat for key ‘threatened and at risk’ species increased and maintained
● Pest species having a significant impact on native fish or on lake habitat generally are controlled to effective levels
● Fish barriers removed or negative effects mitigated
While fishes occupying the lake have been the focus of recent research
● There are many tributaries that flow into the lake and the importance of these areas as habitat and for fish migrations are poorly understood. For example, tributaries may be the key spawning grounds for species that cannot find adequate spawning habitat in the lake (although many of the species will spawn at sea), may provide temperature refuge at times when the lake temperature is particularly high, and are critical habitat for longfin eels.
● At present we do not know the extent of spawning in tributaries for key prey fish species such as common bully or whether fish species that spawn in the lake are limited by the availability of spawning habitat.
● It is not currently known whether recruitment of small fish is limiting these eel and flounder populations or whether there are sufficient prey resources available to increase the abundance of eel and flounder species.
● Examine the effects of extended low summer lake levels on fish communities. Specifically, work could focus on the loss of Lake Margin habitat and high water temperatures.
– Economy Sustainable water use supports economic development
● Economic development in the Selwyn District is decoupled from water quality – the health of the lake and its tributaries have improved and economic activity in Selwyn is buoyant
● Calculation of composite economic indicators such as expenditure on environmental protection associated with the lake, GDP compared to water use and water quality. Changes in these types of indicators will show whether human induced pressures on the lake and its tributaries (from production and consumption in the Selwyn District) have lessened.
● Economic indicators focused on the pressures from and benefits of economic activity (around and on the lake) should be measured at a finer scale than at District level.
– Recreation Compatible recreation needs are provided for, including good access, water quality, and habitat for wildlife, including for sports fisheries
● Recreational user survey results show increased level of use
● Recreational user survey results show increasing quality of experience (quality includes measures of visitor facility provision, ease of access, signage/information availability, fish and game catch limits, water quality and lake level)
● User days per annum statistics for the main activities – trout angling, waterfowl hunting, whitebaiting, cycling, bird watching, walking and picnicking, perhaps undertaken on a bi- or triennial basis
● Quality of experience measures – size and number of trout, number of waterfowl, access and other visitor-related facilities and provisions (including improved signage, walkways, boat ramps), water level and quality. Perceived quality can be gauged during the user days surveys
● The formation of an ‘expert panel’ of lake recreationists to help monitor, report and advise on both the quality of experience and on user levels should also be considered as a way of helping progress these ideas.
● a facilitated discussion forum is required to clarify and attempt to resolve conflict issues, eg between hunters and bird watchers.
● An ongoing strategy to improve and share information about recreational opportunities
● Develop a business case for constructing and developing a visitor/research centre for Te Waihora/Lake Ellesmere.
– Cultural health
Customary rights and use are recognised and mahinga kai species abundance and diversity is restored to a level to enable customary use
● The 11 objectives, taken from the Mahaanui Iwi Management Plan 2013 are achieved
7

Key Author: Karen Banwell, Environment Canterbury
Governance and managementTe Waihora/Lake Ellesmere – State of the Lake 2017Lead author: David Perenara-O’Connell - Environment Canterbury
Section 2
How will we know when we have achieved success?
The role of Ngāi Tahu and kaitiakitanga is recognised in governance of the lake and catchment; there is integrated management of land and water use, with all activities operating at good practice or better, and the wider community included in decision making.
ContextThe importance of Te Waihora/Lake Ellesmere is recognised in a National Water Conservation Order, which lists the lake’s outstanding features as wildlife habitat, habitat for indigenous wetland vegetation and fish, and significance in relation to tikanga Māori in respect of Ngāi Tahu history, mahinga kai and customary fisheries. All regional policy statements, regional plans and district plans must be consistent with the provisions of the Water Conservation Order. The majority of the Te Waihora lakebed and all surrounding Conservation lands are managed in accordance with the Te Waihora Joint Management Plan (JMP) 2005 (prepared by the Department of Conservation and Ngāi Tahu in accordance with the Ngāi Tahu Claims Settlement Act 1998) which has the status of an Iwi Management Plan under the Resource Management Act and that of a Conservation Management Plan under the Conservation Act 1987.
A significant amount of lake margin, approximately 70% or 53 km, is owned or administered by the Department of Conservation (DOC), Te Rūnanga o Ngāi Tahu (TRoNT), Selwyn District Council (SDC), Environment Canterbury (ECan), and Christchurch City Council (CCC). Additional to lake margin land, Te Rūnanga o Ngāi Tahu holds the fee simple ownership of the Te Waihora lakebed on behalf of the iwi.
The catchment for the lake is large and activities throughout the catchment have varying impacts on the lake and its tributaries. Many organisations play important roles in the governance and management of Te Waihora and its catchment. These include organisations with a statutory role (namely, Environment Canterbury, Selwyn District Council, Christchurch City Council, Department of Conservation, Ministry for Primary Industries, Fish & Game NZ, and Te Rūnanga o Ngāi Tahu), non-statutory organisations, and a range of interest groups whose views are taken into consideration.
Committed PartnersThere continues to be a number of key organisations and partnerships that play important roles in managing Te Waihora and its catchment. The partnerships between Te Rūnanga o Ngāi Tahu, Papatipu Rūnanga, Department of Conservation, Environment Canterbury, Selwyn District Council, and Christchurch City Council have strengthened over the past two years and continue to play a pivotal role in the governance and management of the physical resources of the lake and catchment. Industry, community organisations and other stakeholders including Fonterra, Waihora Ellesmere Trust (WET), Fish and Game, Te Ara Kākāriki and local universities continue to play an increasingly valuable role in delivering tangible and meaningful action on the ground.
Over the past two years the Selwyn Waihora Zone Committee has focused on the implementation of the solutions package developed in consultation with the community, to improve cultural and environmental outcomes in the Selwyn Waihora catchment while maintaining farm viability and economic growth. The actions to achieve this objective are described in the Zone Implementation Programme (ZIP) Addendum and have been enabled through the Selwyn Waihora sub-regional plan (Plan Change 1 to the Land and Water Regional Plan1) that became operative in February 2016. A special feature of the Selwyn Te Waihora sub-region, a first of its kind in resource management planning, is the Cultural Landscape/Values Management Area (CLVMA), an area encompassing the lake, its margins, wetlands, springs and tributaries.
The CLVMA recognises the significance of Te Waihora/Lake Ellesmere to Ngāi Tahu. The Area is managed as a single integrated freshwater system with outstanding values in order to:
● Protect mahinga kai, wāhi tapu and wāhi taonga; ● Restore the health of the lake; and ● Recognise the cultural and ecological sensitivity of the Area to discharges of contaminants and the taking and use of fresh water.
Working Collaboratively Individual agencies have their specific statutory roles but working in collaboration has brought many benefits to the catchment. The following table outlines some of the key achievements by the various governance and management collaborative groups over the past two years.
Gov
erna
nce
and
man
agem
ent
8

Name Parties What they do Key achievements over the last 2 years
Te Waihora Co-Governance
– Te Rūnanga o Ngāi Tahu – Environment Canterbury – Selwyn District Council – Christchurch City Council
Collaboratively exercise the following statutory and non-statutory powers:
– Preparation, review or change of RMA planning and policy instruments
– Resource consenting – Compliance, monitoring and
enforcement – Annual and long term planning – Operational works within the catchment
including lake opening, drain management and other works
– Biodiversity and biosecurity – Bylaw making – Relationship management
– Selwyn District Council and Christchurch City Council have become full participants in the Co-Governance Agreement
– Lake opening actions that include 0 Spring openings that have enabled fish recruitment 0 Sought to minimise low levels over summer 0 Responded as soon as practicable, and within health
& safety constraints, to openings at times of severe flooding
– Implementation of last two years of Whakaora Te Waihora programme
– Completed several research projects that will support further lake restoration actions
– Secured further funding for Whakaora Te Waihora projects
Selwyn- Waihora Zone Committee
– Environment Canterbury – Selwyn District Council – Christchurch City Council – Members of Papatipu Rūnanga (6) – Community members
– Facilitate community involvement in the development, implementation, review and updating of the water management solutions package as described in the Zone Implementation Programme (ZIP) and Addendum that gives effect to the Canterbury Water Management Strategy in the Selwyn Waihora Zone.
– Monitor progress of the implementation of the ZIP, ZIP Addendum and Selwyn Te Waihora Plan Change (Variation 1 to the Land and Water Regional Plan).
– The Selwyn Te Waihora Plan Change came into force in February 2016. This imposes new limits and rules to manage water quality and quantity in the Selwyn Waihora catchment.
– Implementation of the Plan included direct mail to 2,000 rural properties advising them of their good management practice (GMP) responsibilities; recruitment of a Cultural Land Management Advisor and preparation of mahinga kai guidelines for farmers.
– $100,000 per year of Immediate Steps funding was allocated to local initiatives to protect and enhance biodiversity.
– Selwyn Water Seminars in Lincoln attended by around 1000 people.
– Application to Freshwater Investment Fund (MfE) for Near River Recharge Project on Selwyn River/Waikirikiri and granted $1.14M.
Ngāi Tahu – Te Rūnanga o Ngāi Tahu – Te Taumutu Rūnanga – Te Ngāi Tūāhuriri Rūnanga – Te Hapū o Ngāti Wheke – Te Rūnanga o Koukourārata – Ōnuku Rūnanga – Wairewa Rūnanga
– Owner of the lake bed – Aboriginal/customary rights and
interests – Joint holder lake opening consent – Manage commercial fishing activities on
lakebed – Represent Papatipu Rūnanga – Joint Management Plan implementation – Whakaora Te Waihora Joint Plan
implementation – Statutory Advisor to Fish & Game
Councils – Advocacy
– Advocacy on Osbornes Drain consents to progress an agreed consent application that was subsequently granted.
– Focus and support on Kaituna River restoration initiatives.
– Ongoing management and maintenance of Horomaka Kōhanga (non-commercial fishing area) including buoy replacement and fishery research.
– Retirement of Te Koraha Reserve (Māori Reserve land adjacent to Ahuriri Lagoon) from dairy farming.
– 100’s of voluntary Rūnanga member hours into supporting agency and community relationships and projects across the catchment.
Whakaora Te Waihora
– Ministry for the Environment – Environment Canterbury – Te Rūnanga o Ngāi Tahu
A joint cultural and restoration programme that aims to:
– Accelerate restoration of ecosystem health
– Begin restoration of cultural sites and mahinga kai
– Protect and restore lake margin wetland habitats, indigenous vegetation and wildlife and low land tributaries
– Improve lake and catchment management practices
– Establish a robust monitoring and investigations programme
– Willow and weed control at key lake-shore sites - willows now largely controlled on the eastern shore of the lake.
– With Te Taumutu Rūnanga, the restoration of Te Repo Orariki (Taumutu Wetlands).
– Sediment source investigation and landscape plans for two lowland stream riffles (Huritini/Halswell) completed (delivered by EOS Ecology).
– Murray’s Drain re-battered. – Two wave barriers were installed, macrophytes
were planted behind the first wave barrier (trial re-establishment), and artificial habitats were installed behind both (delivered by NIWA).
– Investigation into fish recruitment during lake openings and review of fisheries management (delivered by NIWA).
– Investigations into in-lake nutrient processing (delivered by the University of Otago), and an updated nutrient model for Te Waihora/Lake Ellesmere developed (delivered by the University of Waikato).
– A habitat investigation was completed for the critically endangered Canterbury mudfish (delivered by Ichthyo-niche).
– Ongoing water quality monitoring. – Ongoing support of the Kids Discovery Plant-out
(delivered by Te Ara Kākāriki (TAK)). – Eight riparian sites planted and fenced on Waikekewai
Stream and Harts Creek. – Kaituna Catchment COMAR data analysis completed. – Electro Fishing field day held on the Kaituna River. – New stories were added to the programme’s website
(http://tewaihora.org/ourstories/). – The number of followers of the programme’s Twitter
account (@tewaihora) reached 1,189. – Application to Freshwater Investment Funding (MfE)
for Whakaora Te Ahuriri (establishment of nutrient and sediment filter wetlands at Ahuriri Lagoon and granted $1.25M.
9
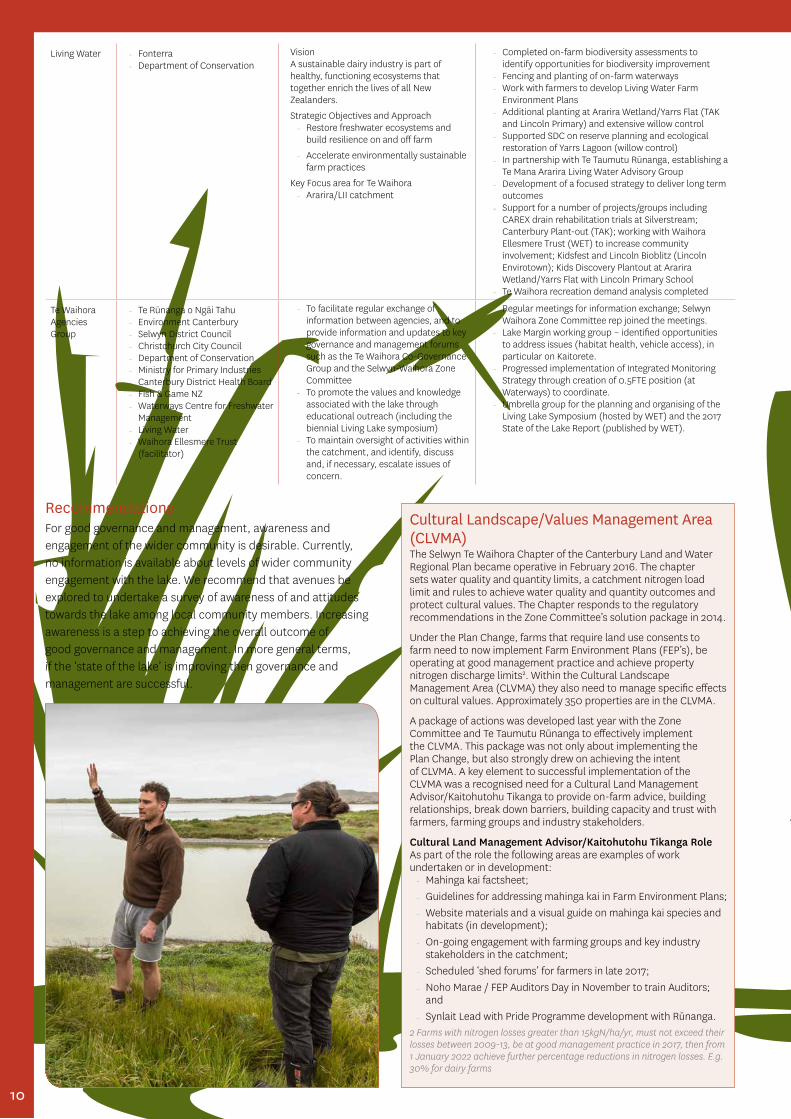
Living Water – Fonterra – Department of Conservation
VisionA sustainable dairy industry is part of healthy, functioning ecosystems that together enrich the lives of all New Zealanders.
Strategic Objectives and Approach – Restore freshwater ecosystems and
build resilience on and off farm
– Accelerate environmentally sustainable farm practices
Key Focus area for Te Waihora – Ararira/LII catchment
– Completed on-farm biodiversity assessments to identify opportunities for biodiversity improvement
– Fencing and planting of on-farm waterways – Work with farmers to develop Living Water Farm
Environment Plans – Additional planting at Ararira Wetland/Yarrs Flat (TAK
and Lincoln Primary) and extensive willow control – Supported SDC on reserve planning and ecological
restoration of Yarrs Lagoon (willow control) – In partnership with Te Taumutu Rūnanga, establishing a
Te Mana Ararira Living Water Advisory Group – Development of a focused strategy to deliver long term
outcomes – Support for a number of projects/groups including
CAREX drain rehabilitation trials at Silverstream; Canterbury Plant-out (TAK); working with Waihora Ellesmere Trust (WET) to increase community involvement; Kidsfest and Lincoln Bioblitz (Lincoln Envirotown); Kids Discovery Plantout at Ararira Wetland/Yarrs Flat with Lincoln Primary School
– Te Waihora recreation demand analysis completed
Te Waihora Agencies Group
– Te Rūnanga o Ngāi Tahu – Environment Canterbury – Selwyn District Council – Christchurch City Council – Department of Conservation – Ministry for Primary Industries – Canterbury District Health Board – Fish & Game NZ – Waterways Centre for Freshwater
Management – Living Water – Waihora Ellesmere Trust
(facilitator)
– To facilitate regular exchange of information between agencies, and to provide information and updates to key governance and management forums such as the Te Waihora Co-Governance Group and the Selwyn-Waihora Zone Committee
– To promote the values and knowledge associated with the lake through educational outreach (including the biennial Living Lake symposium)
– To maintain oversight of activities within the catchment, and identify, discuss and, if necessary, escalate issues of concern.
– Regular meetings for information exchange; Selwyn Waihora Zone Committee rep joined the meetings.
– Lake Margin working group – identified opportunities to address issues (habitat health, vehicle access), in particular on Kaitorete.
– Progressed implementation of Integrated Monitoring Strategy through creation of 0.5FTE position (at Waterways) to coordinate.
– Umbrella group for the planning and organising of the Living Lake Symposium (hosted by WET) and the 2017 State of the Lake Report (published by WET).
Recommendations For good governance and management, awareness and engagement of the wider community is desirable. Currently, no information is available about levels of wider community engagement with the lake. We recommend that avenues be explored to undertake a survey of awareness of and attitudes towards the lake among local community members. Increasing awareness is a step to achieving the overall outcome of good governance and management. In more general terms, if the ‘state of the lake’ is improving then governance and management are successful.
Cultural Landscape/Values Management Area (CLVMA)The Selwyn Te Waihora Chapter of the Canterbury Land and Water Regional Plan became operative in February 2016. The chapter sets water quality and quantity limits, a catchment nitrogen load limit and rules to achieve water quality and quantity outcomes and protect cultural values. The Chapter responds to the regulatory recommendations in the Zone Committee’s solution package in 2014.
Under the Plan Change, farms that require land use consents to farm need to now implement Farm Environment Plans (FEP’s), be operating at good management practice and achieve property nitrogen discharge limits2. Within the Cultural Landscape Management Area (CLVMA) they also need to manage specific effects on cultural values. Approximately 350 properties are in the CLVMA.
A package of actions was developed last year with the Zone Committee and Te Taumutu Rūnanga to effectively implement the CLVMA. This package was not only about implementing the Plan Change, but also strongly drew on achieving the intent of CLVMA. A key element to successful implementation of the CLVMA was a recognised need for a Cultural Land Management Advisor/Kaitohutohu Tikanga to provide on-farm advice, building relationships, break down barriers, building capacity and trust with farmers, farming groups and industry stakeholders.
Cultural Land Management Advisor/Kaitohutohu Tikanga Role As part of the role the following areas are examples of work undertaken or in development:
– Mahinga kai factsheet; – Guidelines for addressing mahinga kai in Farm Environment Plans; – Website materials and a visual guide on mahinga kai species and
habitats (in development); – On-going engagement with farming groups and key industry
stakeholders in the catchment; – Scheduled ‘shed forums’ for farmers in late 2017; – Noho Marae / FEP Auditors Day in November to train Auditors;
and – Synlait Lead with Pride Programme development with Rūnanga.
2 Farms with nitrogen losses greater than 15kgN/ha/yr, must not exceed their losses between 2009-13, be at good management practice in 2017, then from 1 January 2022 achieve further percentage reductions in nitrogen losses. E.g. 30% for dairy farms
10

Gov
erna
nce
and
man
agem
ent
ContextTe Waihora/Lake Ellesmere has no natural outlet to the sea and there is a long history of opening the lake to the sea by breaching Kaitorete Spit. Prior to European settlement of Te Wai Pounamu, tribal records/mātauranga indicate tangata whenua made periodic breaches of Kaitorete Spit to facilitate fish migration and to reduce flooding at Taumutu. The first written record of the artificial opening of Te Waihora was in 1852 and from 1868 local farmers started opening the lake in an informal way until the Lake Ellesmere Drainage Board was formally set up in 1905. There were no set levels at this time for an opening. Permanent outlets, primarily constructed of wood, were built in 1904 (Dobson’s Culvert) and 1908 (Pannett’s Culvert). Pannett’s Culvert lasted until 1925 when it was destroyed by the sea. In 1947 the North Canterbury Catchment Board succeeded the Drainage Board and managed the lake openings until the creation of Environment Canterbury in 1989. Minimum opening levels were agreed in 1947 as 1.05 m.s.l (summer) and 1.13 m.s.l (winter). Today, these levels are specified in a National Water Conservation Order (WCO) as minimum levels above which the lake may be opened.
The levels are:
● 1.05 m.a.s.l. – 1 August to 31 March ● 1.13 m a.s.l. – 1 April to 31 July ● Any level between 15 September to 15 October ● Any level between 1 April to 15 June
The ability to decide to open at any level in spring and autumn is to allow decision makers to consider opening to facilitate fish passage. The lake level is determined each week by averaging readings taken at gauges at Nutts Cut and Taumutu.
Environment Canterbury maintains a dataset that records every lake opening since 1901. The introduction of power scoops in the 1930s resulted in an average lake opening at around 1.54m reduced to around 1.19m by the 1950s. Parallel to this, on average the number of lake openings each year also increased. Today the number of openings each year generally varies between 2 and 6 and it is not automatic that the lake will be opened as soon as minimum potential opening levels are exceeded.
The WCO also allows for consideration of closing of the lake once it drops below 0.60 m.a.s.l. between 1 October and 31 March. To date, mechanical closure of the lake has never been attempted and depending on the circumstances may not be practical. Many factors need to be considered before a closure could be attempted which include: volume of material on site to infill the cut, the length and width of the cut, forward weather forecast, sea conditions including tidal variations and how close natural closure may be.
How is the lake opened to the sea? Openings are achieved by using heavy earthmoving machinery to make a pilot cut through Kaitorete Spit near Taumutu. The cut can be over 300 metres long (depending on the amount of gravel over-wash into the lake) and connects to a widened deep water pool in the lake to maximise flow into the cut. The deep water is vital for opening the lake and work is done to protect it by maintaining and creating a seawall (gravel bund) on the Spit to attempt to minimise gravel over-washing into the lake during large seas. Difference in water level between the lake and the sea is vital for getting water running out to sea (lake water level must be higher than sea water level) with the final work to open occurring just after high tide.
The success of any lake opening depends on favourable weather conditions. Wind strength, wind direction, sea swell, wave direction, and tides are all factors that can affect openings.
In difficult weather and/or with adverse sea conditions multiple attempts may be made and a successful opening may take weeks, or even months to achieve. An opening is generally considered successful when it persists for at least four days. In bad weather with rough seas it is simply not possible to access the site or to operate machinery safely.
Key Author: Karen Banwell, Environment Canterbury
Lake level managementTe Waihora/Lake Ellesmere – State of the Lake 2017Lead author: Verity Kirstein – Environment Canterbury
Lake
leve
l man
agem
ent
Section 2a
1880s - opening the lake with horse drawn scoops
Outlet to the sea - note the difference between the colour of the lake water and the sea
11

Lake Openings between 1 December 2012 and 1 October 2017The lake was open for 16 periods between 1 June 2013 and 14 August 2017.Te Waihora openings:
Date opened Date closed No. days open
Level open
Level closed
15/12/2012 21/02/2013 68 1.08 0.51
29/06/2013 15/08/2013 47 1.81 0.52
5/10/2013 4/12/2013 60 1.07 0.51
21/04/2014 29/04/2014 8 1.25 1.03
2/05/2014 11/05/2014 9 1.24 0.84
15/06/2014 21/05/2014 6 1.24 1.12
24/06/2014 29/06/2014 6 1.18 0.85
29/07/2014 9/08/2014 15 1.19 0.73
30/09/2014 6/10/2014 6 1.15 0.99
9/10/2014 25/10/2014 16 1 0.58
24/07/2015 9/08/2015 17 1.23 0.95
21/09/2015 8/10/2015 18 1.21 0.77
1/07/2016 18/07/2016 18 1.19 0.65
28/09/2016 31/10/2016 34 1.11 0.69
29/06/2017 12/07/2017 14 1.21 0.84
25/07/2017 2/09/2017 40 1.56 0.75
1/10/2017 - - 1.09 -
Future OpeningsEnvironment Canterbury has committed to co-governance within the Selwyn/Waihora catchment and joint decision making will continue in the future. Further potential changes to funding of the rating district and land use change within the catchment may lead to openings for different values or more frequent openings. Sea level around Canterbury is also rising at 1.9 +/- 0.1 mm/yr (Hannah and Bell 2012) which is making the lake harder to open and will likely mean that the lake will need to be opened at higher levels in the future.
Annual mean sea level time series to 2008 from the four primary tide gauges (Auckland, Wellington, Lyttelton, Dunedin) before detrending. Sea level is relative to a particular port datum, with an arbitrary 0.6 m offset subtracted from Auckland to reduce the plot size. (Hannah and Bell 2012).
References ● Environment Canterbury has a dataset of all lake openings since records began in 1901.
● http://www.hydroeco.net/tewaihora/
● Hannah, J. and Bell, R.G. (2012) Regional sea level trends in NZ. Journal of Geophysical Research 117: C01004
Acknowledgements: Bruce Gabites (Coastal and Fluvial Resource Scientist – Environment Canterbury), Justin Cope (Team Leader Hazards and Coastal – Environment Canterbury), Leigh Griffiths (Manager River Engineering).
Lake
Lev
el (M
SL)
Te Waihora Water Levels - 1 Dec 2012 to 25 Oct 2017Te Waihora Water Levels - 1 Dec 2012 to 25 Oct 2017
Lake level (m MSL)
WCO OpeningLevels (m MSL)
0
0.2
0.4
0.6
0.8
1
1.2
1.4
1.6
1.8
2
Dec-2012 Apr-2013 Aug-2013 Dec-2013 Apr-2014 Aug-2014 Dec-2014 Apr-2015 Aug-2015 Dec-2015 Apr-2016 Aug-2016 Dec-2016 Apr-2017 Aug-2017
Earth moving machinery opening the lake
12

LandTe Waihora/Lake Ellesmere – State of the Lake 2017Lead author: Kirsty Johnston, compiled with information prepared by Chelsea Halliwell, Ian Whitehouse, Tami Woods, Julia Fettes, Mike Exner-Kittridge – Environment Canterbury
How will we know when we have achieved success?
Land use and development is integrated with water management; natural and cultural values are respected; all land use activities operate at good management practice or better.
ContextMeasures of land cover and land use are descriptive indicators for state of the environment reporting. Land cover is the physical material at the earth’s surface, such as forests, pasture, water, or asphalt. Land use is the activity or economic function to which people put the land, such as forestry, farming, recreation, or urban settlement.
Land cover is a state indicator, describing quantity and quality. It reflects changes in land use.
Land use is a pressure indicator and tells us about the driving forces that change environmental conditions.
When land use affects the quality of the environment, information about changes in land use treatments and management practices, and the driving forces behind these, shines a light on the responses needed for sustainable management (refer to Figure 1.1, Section 1 of this report).
Over the past 150 years, ongoing development of farmland and townships in Selwyn District has resulted in gradual degradation of Te Waihora/Lake Ellesmere. In pre-European times, Te Waihora was twice its current size and regularly flooded to more than four metres above sea level – and in extreme times, as far inland as Lincoln. Extensive wetlands around the lake margins acted as a filter and played an important role in maintaining water quality, but these have been largely drained. The 1968 Wahine storm, also, tipped Te Waihora from a relatively clear water lake to a murky, algae-dominated one. The storm ripped out the once extensive Ruppia aquatic plants that anchored the bed of the lake, minimising the suspension of sediment.
Situated at the bottom of the Selwyn Catchment, Te Waihora receives contaminants from its large and predominantly agricultural catchment - what is done on the land impacts the waterways.
Ongoing development of farmland and townships in Selwyn District has given rise to four main waterway contaminants that affect the health of Te Waihora and its tributaries. These are nitrogen, phosphorus, sediment, and microbes such as Escherichia coli.
Phosphorus and sediment have accumulated in the lake from our agricultural past. Nitrogen already making its way through the groundwater system to Te Waihora will appear in the next 10 to 60 years (as a result of previous and current land use). Microbes are carried in runoff from land where animal wastes are deposited or where sewerage seeps in from leaky septic tanks.
Looking back to move forward – driving forces and the pressures that arise from changing land useAgricultural Production Statistics published in 2002 and 2012 for Selwyn District report on past land use and land use treatments. Data reveal land use pressures and the driving forces behind these, the impacts of which gave rise to the streams of action underway to improve water quality in the lake and its tributaries.
Twenty years ago, farming patterns changed with a move away from sheep and beef farming to dairy, deer and forestry. Good milk prices, and a growing international demand for processed milk products, compared to depressed wool and beef prices at the time, drove conversion from sheep and beef farming into dairy cattle farming.
Deer numbers increased in the mid to late 1990s – a reflection of higher economic surpluses per hectare than for sheep at the time.
Good export log prices from 1996 until about 2002, and the introduction of the New Zealand Emissions Trading Scheme, encouraged forest planting and allowed eligible foresters to earn New Zealand emission units as their trees grew and absorbed carbon dioxide. Exotic forest planting increased in response at the time. This included conversion of grassland, and exotic scrub and shrubland, into plantation forests.
With the increase in dairy cattle numbers (Figure 3.1), came the shift to more intensive pastoral farming. Irrigated area increased, as did irrigation water consented volume (Figures 3.2a and 3.2b).
Solid fertiliser use increased between 1994 and 2002. The use of urea fertiliser in Selwyn District more than doubled between 2002 and 2012, as did effluent area sprayed over (Figure 3.3).
With conversion of tussock grasslands for pastoral farming, including more intensive farming in hill and high country, the area of tussock grassland reduced as the area of tussock used for grazing increased - conversion brought exotic pasture grasses, and more recently fodder crops. The area of arable cropland increased also, with the domestic demand for fodder crops and grains as stock feeds (Figure 3.4).
Land
Section 3
Selwyn District
Dairy cattle
Beef cattle Sheep Deer Pigs Goats Horses
At 30 June 2002
105,069 53,838 1,049,428 45,420 64,248 4,174 3,870
At 30 June 2012
199,014 52,384 745,487 40,759 53,135 1,657 3,671
Figure 3.1: Livestock numbers by type in Selwyn District in 2002 and 2012 Source: Statistics New Zealand Agricultural Production Statistics 2002; 2012
13
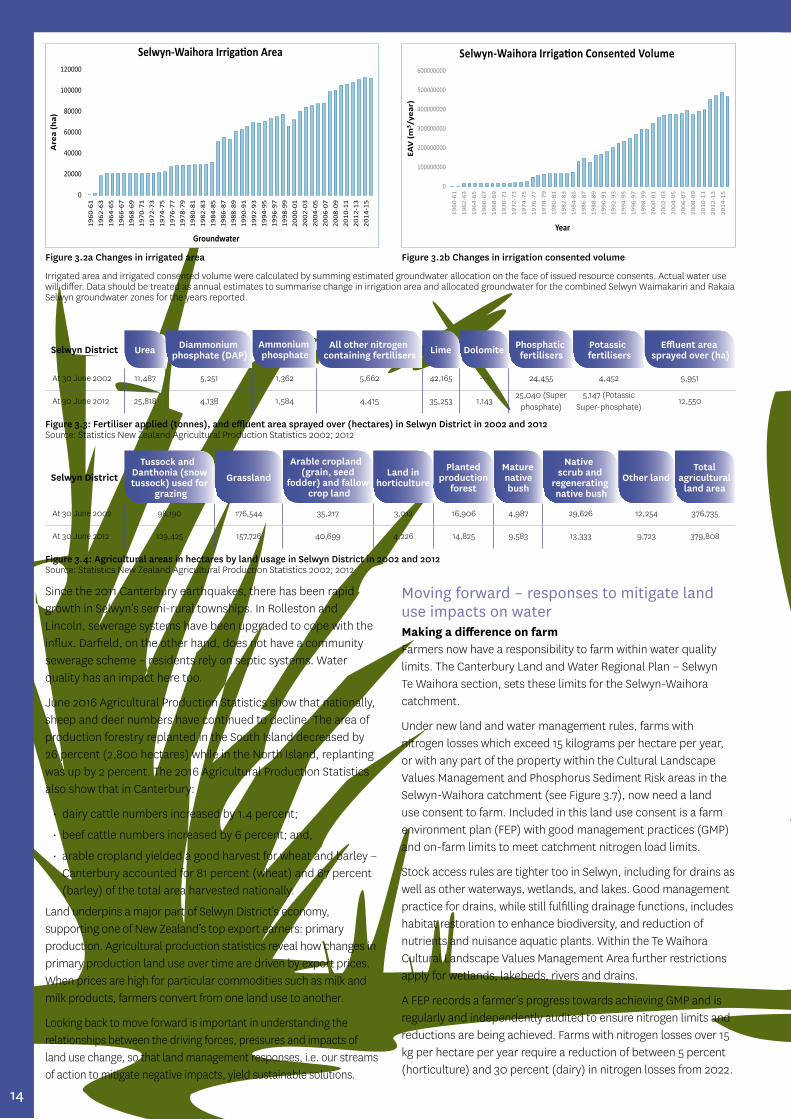
Figure 3.2b Changes in irrigation consented volumeFigure 3.2a Changes in irrigated area
Selwyn District Urea Diammonium phosphate (DAP)
Ammonium phosphate
All other nitrogen containing fertilisers Lime Dolomite Phosphatic
fertilisers Potassic fertilisers
Effluent area sprayed over (ha)
At 30 June 2002 11,487 5,251 1,362 5,662 42,165 --- 24,455 4,452 5,951
At 30 June 2012 25,818 4,138 1,584 4,415 35,253 1,14325,040 (Super
phosphate)5,147 (Potassic
Super-phosphate)12,550
Figure 3.3: Fertiliser applied (tonnes), and effluent area sprayed over (hectares) in Selwyn District in 2002 and 2012 Source: Statistics New Zealand Agricultural Production Statistics 2002; 2012
Selwyn District
Tussock and Danthonia (snow tussock) used for
grazing
Grassland
Arable cropland (grain, seed
fodder) and fallow crop land
Land in horticulture
Planted production
forest
Mature native bush
Native scrub and
regenerating native bush
Other landTotal
agricultural land area
At 30 June 2002 98,190 176,544 35,217 3,012 16,906 4,987 29,626 12,254 376,735
At 30 June 2012 129,425 157,726 40,699 4,226 14,825 9,583 13,333 9,723 379,808
Figure 3.4: Agricultural areas in hectares by land usage in Selwyn District in 2002 and 2012 Source: Statistics New Zealand Agricultural Production Statistics 2002; 2012
Since the 2011 Canterbury earthquakes, there has been rapid growth in Selwyn’s semi-rural townships. In Rolleston and Lincoln, sewerage systems have been upgraded to cope with the influx. Darfield, on the other hand, does not have a community sewerage scheme – residents rely on septic systems. Water quality has an impact here too.
June 2016 Agricultural Production Statistics show that nationally, sheep and deer numbers have continued to decline. The area of production forestry replanted in the South Island decreased by 26 percent (2,800 hectares) while in the North Island, replanting was up by 2 percent. The 2016 Agricultural Production Statistics also show that in Canterbury:
• dairy cattle numbers increased by 1.4 percent;
• beef cattle numbers increased by 6 percent; and,
• arable cropland yielded a good harvest for wheat and barley – Canterbury accounted for 81 percent (wheat) and 67 percent (barley) of the total area harvested nationally.
Land underpins a major part of Selwyn District’s economy, supporting one of New Zealand’s top export earners: primary production. Agricultural production statistics reveal how changes in primary production land use over time are driven by export prices. When prices are high for particular commodities such as milk and milk products, farmers convert from one land use to another.
Looking back to move forward is important in understanding the relationships between the driving forces, pressures and impacts of land use change, so that land management responses, i.e. our streams of action to mitigate negative impacts, yield sustainable solutions.
Moving forward – responses to mitigate land use impacts on waterMaking a difference on farmFarmers now have a responsibility to farm within water quality limits. The Canterbury Land and Water Regional Plan – Selwyn Te Waihora section, sets these limits for the Selwyn-Waihora catchment.
Under new land and water management rules, farms with nitrogen losses which exceed 15 kilograms per hectare per year, or with any part of the property within the Cultural Landscape Values Management and Phosphorus Sediment Risk areas in the Selwyn-Waihora catchment (see Figure 3.7), now need a land use consent to farm. Included in this land use consent is a farm environment plan (FEP) with good management practices (GMP) and on-farm limits to meet catchment nitrogen load limits.
Stock access rules are tighter too in Selwyn, including for drains as well as other waterways, wetlands, and lakes. Good management practice for drains, while still fulfilling drainage functions, includes habitat restoration to enhance biodiversity, and reduction of nutrients and nuisance aquatic plants. Within the Te Waihora Cultural Landscape Values Management Area further restrictions apply for wetlands, lakebeds, rivers and drains.
A FEP records a farmer’s progress towards achieving GMP and is regularly and independently audited to ensure nitrogen limits and reductions are being achieved. Farms with nitrogen losses over 15 kg per hectare per year require a reduction of between 5 percent (horticulture) and 30 percent (dairy) in nitrogen losses from 2022.
Irrigated area and irrigated consented volume were calculated by summing estimated groundwater allocation on the face of issued resource consents. Actual water use will differ. Data should be treated as annual estimates to summarise change in irrigation area and allocated groundwater for the combined Selwyn Waimakariri and Rakaia Selwyn groundwater zones for the years reported.
14

FEPs and achievement of on-farm limits will be audited once land use consents to farm are obtained. The performance target is an A or B rating in the audit. C or D grades are non-compliant. FEP audit results, in future, will provide a measure of success for integrated land and water management.
Making a difference in townsSelwyn District is the fastest growing district in New Zealand, made up of many smaller towns and villages. Good secure community drinking water supplies are essential, and serve 70 percent of the population, but around 30 percent rely on private domestic water supply from shallow wells. Shallow wells are vulnerable to contamination from nitrates and microbes. Nitrate is commonly leached into the groundwater from agricultural land and wastewater disposal areas. Bacteria and other microbial contaminants (E.coli) can be carried into groundwater from septic tanks, effluent disposal areas and, under some conditions, from faeces of grazing animals. Management of groundwater quality requires management of point, and non-point, contaminant sources. Actions in place include farmers farming within water quality limits, the Rolleston and Lincoln sewerage system upgrades, and a programme involving Environment Canterbury and the Canterbury District Health Board to address nitrate levels of drinking water drawn from shallow, private wells.
SummaryAgricultural production statistics, changes in irrigated area and irrigation consented volume, and land cover (Figure 3.7), shed light on land use activities over time. Data show the expansion of intensive land use, both rural and urban, and illuminate some of the driving forces behind this change. Interpreting the data together provides context for summarising land use and land cover:
• Pressures on the lake from catchment land use have increased
• Land cover shows ‘exotic grassland’ as the predominant land cover and reflects the business enterprises from which these pressures arise
• Expansion of intensive land use, where land is irrigated for primary production, includes for dairy farming as well as other livestock farming, cropping and horticulture
• Expansion of urban settlement has been influenced by population growth and shifts in business enterprise (refer economy section).
Great effort by Fonterra Suppliers continues in the Selwyn-Waihora catchmentDairy farmers supplying Fonterra milk continue to achieve 100% compliance fencing their stock out of defined permanent waterways on their farms. A defined waterway is one that permanently contains water and is greater than 1 metre in width and deeper than 30cm at any point at any time of year. Fonterra’s minimum standard for stock exclusion is a permanent fence, i.e. no standards or fences on reels. Data from Fonterra (Figure 3.6) report the change in farmer effort and compliance from mid-2013 to September 2017.
2017 statistics show a reduction in the extent of waterways with stock exclusion when compared to previous years. This is due to two factors;
- Changes in those farms who are supplying to Fonterra
- Historically Fonterra have reported extent of waterways both on the dairy platform (and attached land) and those on non-attached support land. Fonterra are now only maintaining the data for the dairy platform (and attached land).
The main rationale for this change in reporting is the fact that a portion of non-attached land utilised to support the dairy platform is leased by Fonterra farmers’; and is therefore subject to frequent change. Because of this frequent change in terms of areas that are used as non-attached support land, and to align Fonterra reporting with the requirements under the Sustainable Dairying: Water Accord, Fonterra are no longer in a position to accurately verify and report on this non-attached land.
Table 3.6: Fonterra suppliers and defined waterways stock exclusion in the Selwyn-Waihora catchment Source: Fonterra Ltd. 2017Key: DWW: defined waterways; FDSE: Fonterra defined stock exclusion; NFDSE: Non Fonterra defined stock exclusion
Jul 2013 Jan 2014 Jul 2014 Jan 2015 May 2015 Sept 2017
Defined Waterways (DWW) Stock Excluded (km) 225 278 307 325 390 221
DWW NOT Stock Excluded (km) 28 13 3 2 2 0
Total DWW (km) 253 292 310 327 391 221
% FDSE 89% 95.4% 99.0% 99.5% 99.5% 100%
Non-DWW Stock Excluded (km) 242 238 233 234 261 184
Non-DWW NOT Stock Excluded (km) 53 60 52 56 70 35
Total Non-DWW (km) 296 299 286 290 331 219
% NFDSE 81.9% 79.8% 81.6% 80.6% 78.8% 84%
Total DWW's (km) 549 591 596 617 722 440
Crossings Compliant (number) 129 199 267 307 307 257
Crossings Non-Compliant (number) 0 1 1 0 0 0
% Compliant Crossings 100% 99.5% 99.6% 100% 100% 100%
Number of Verified Farms 64 118 144 152 152 144
15

Figure 3.7: Land Cover (2012/13) mapped in 12 land cover classes for the Selwyn District/ Selwyn-Waihora water management zone (Refer to Te Waihora/Lake Ellesmere State of the Lake 2015 for land cover change statistics). Source: Land Cover Database4. Environment Canterbury 2017.
Measures of success
Diverse agricultural landscapes are supported with no one predominant land use
All properties >20ha have restored/managed native vegetation/naturally occurring wetlands
All restoration sites show positive annual survival and growth trends for plantings
Land and Water Regional Plan Change 1 (PC1) stock exclusion targets for waterways are met
Farm environment plans receive audit grade A or B
Recommendations The 2013 and 2015 state of the lake reports posed the questions “Have we got the right information?” and “Have we got enough of the right information?”. While more data are becoming available for reporting the suggested set of land indicators (refer State of the Lake 2013), the same challenge remains: the availability of timely, relevant, data critical to land and water management in the Selwyn-Waihora catchment.
We recommend that, consistent with the integrated lake monitoring strategy, people and agencies involved in monitoring land indicator data continue to explore ways of sharing their data, including making better use of geographic information systems (GIS), and the web, for integrated land and water management and state of the lake reporting.
State of the lake monitoring and reporting must include data about the driving forces behind land use and land cover change, not just pressure, state, impact, and response.
Ultimately, our understanding of what difference we are making for the lake and its tributaries depends on knowledge about managing land and water in a sustainable way. Managing sustainably obliges us to know about the social and economic benefits we gain from land use, and to understand how these benefits, as driving forces, underpin environmental change.
References/ useful links• Canterbury Water (Chelsea Halliwell, Ian Whitehouse,
authors). 2017. Selwyn Te Waihora Our water story booklet. Environment Canterbury. Christchurch. New Zealand.
• See www.wet.org.nz for more information about references and data used here.
• Lomax, A.J., Johnston, K.A., Hughey, K.F.D., and Taylor, K.J.W. (eds). 2015. Te Waihora / Lake Ellesmere: State of the Lake 2013. Technical Report No. 2, Waihora Ellesmere Trust, Christchurch. New Zealand.
• Hughey, K.F.D., Johnston, K.A., Lomax, A.J. and Taylor, K.J.W. (eds). 2013. Te Waihora / Lake Ellesmere: State of the Lake 2013. Technical Report No. 1, Waihora Ellesmere Trust, Christchurch. New Zealand.
• See http://www.stats.govt.nz/browse_for_stats/environment/environmental-reporting-series/environmental-indicators/Home/Land.aspx for national environmental reporting.
• See Environmental Reporting Canterbury Water Management Zones for Biodiversity reporting https://apps.canterburymaps.govt.nz/SOE/Biodiversity.html for Selwyn-Waihora.
• See https://www.lawa.org.nz/ for regional state of the environment reporting for Canterbury, including for land, and fresh and ground water monitoring sites in the Selwyn-Waihora water management zone.
16
WaterTe Waihora/Lake Ellesmere – State of the Lake 2017Lead authors: Kimberley Dynes, Lisa Scott & Tim Davie - Environment Canterbury
Wat
er
How will we know when we have achieved success?Water quantity: ecosystem and cultural health is restored and safeguarded; water users have reliable supplies, including for customary use, and recreational activitiesWater quality: water quality is improved to sustain cultural values; indigenous and wildlife species are supported; drinking water is safe and water quality suitable for recreation
Section 4
ContextTe Waihora/Lake Ellesmere is predominately fed by surface water inflows, rainfall on the lake, and seawater intrusion. The majority of water is lost via outflows to the coast and evapotranspiration (Renwick et al. 2010). The wider catchment of Te Waihora/Lake Ellesmere encompasses a large proportion of tributary streams sourced from upwelling groundwater. The water quality and quantity of Te Waihora/Lake Ellesmere is not only influenced by water bodies in the immediate vicinity of the lake, but also from the wider catchment across the Canterbury Plains and foothills.
Te Waihora/Lake Ellesmere is intermittently open to the coastal environment at the southern end of Kaitorete Spit, near Taumutu. The managed opening of the lake plays an important role with respect to the water quantity, quality and ecology of Te Waihora/Lake Ellesmere and environs. Lake openings ensure lake levels do not encroach on surrounding land. Healthy aquatic life is sustained by allowing fish passage of migratory species, and flushing of the lake.
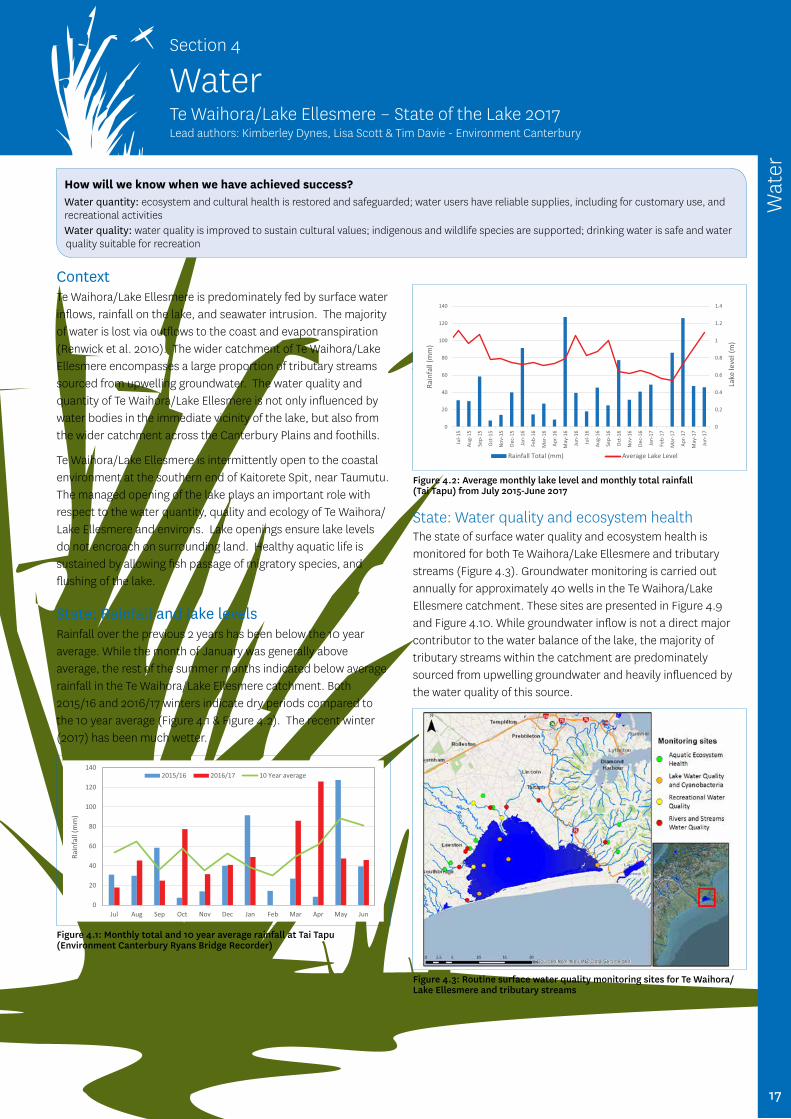
State: Rainfall and lake levels Rainfall over the previous 2 years has been below the 10 year average. While the month of January was generally above average, the rest of the summer months indicated below average rainfall in the Te Waihora/Lake Ellesmere catchment. Both 2015/16 and 2016/17 winters indicate dry periods compared to the 10 year average (Figure 4.1 & Figure 4.2). The recent winter (2017) has been much wetter.
State: Water quality and ecosystem healthThe state of surface water quality and ecosystem health is monitored for both Te Waihora/Lake Ellesmere and tributary streams (Figure 4.3). Groundwater monitoring is carried out annually for approximately 40 wells in the Te Waihora/Lake Ellesmere catchment. These sites are presented in Figure 4.9 and Figure 4.10. While groundwater inflow is not a direct major contributor to the water balance of the lake, the majority of tributary streams within the catchment are predominately sourced from upwelling groundwater and heavily influenced by the water quality of this source.
Figure 4.3: Routine surface water quality monitoring sites for Te Waihora/Lake Ellesmere and tributary streams
Figure 4.1: Monthly total and 10 year average rainfall at Tai Tapu (Environment Canterbury Ryans Bridge Recorder)
Figure 4.2: Average monthly lake level and monthly total rainfall (Tai Tapu) from July 2015-June 2017
17

Lake trophic statusThe state of water quality for Te Waihora/Lake Ellesmere is illustrated by the trophic level index (TLI), an indicator of enrichment based on raw water quality measurements of nutrients, algae and water clarity. The overall TLI score is categorised into trophic states to describe the condition of the lake. As the TLI increases, nutrient concentrations and algae increase, while water clarity decreases.
Te Waihora/Lake Ellesmere has generally been in a hypertrophic state for the duration of sampling (approximately 20 years), with the exception of 2013 when the lake was open to the sea for a prolonged period. Since the dip in trophic status in 2013, the lake steadily increased in hypertrophic state before plateauing over the past two years. Te Waihora/Lake Ellesmere has returned to a similar trophic state to pre-2010 when the lake was identified as have the highest TLI in New Zealand (Verburg et al. 2010) (Figure 4.4).
Water Quality of Tributary StreamsThe water quality of tributary streams is measured monthly for the Te Waihora/Lake Ellesmere catchment. Water quality measurements such as nutrients, water clarity and faecal indicator bacteria (Escherichia coli) are summarised into an annual water quality index used to describe the overall condition of a site.
Streams within the Te Waihora/Lake Ellesmere catchment are generally of poor-fair water quality with include nutrient enrichment and elevated faecal indicator bacteria. Streams are generally clear, however water clarity is often reduced following heavy rainfall.
Most recently there has been an improvement in two tributary streams from Fair to Good, and a reduction in the number of sites graded poor. This improvement is heartening and could be a response to riparian improvements in the catchments. Before confirming it is through land management improvements we need to consider that the past two years have been particularly dry years with below average rainfall and irrigation restrictions. It is likely that low runoff and leaching potential has reduced contaminant pathways during this dry period (Figure 4.5). There is potential that nutrients that have been held in the soil profile and not utilised during this time will eventually be flushed into the system with increased rainfall or irrigation.
Aquatic ecosystem health of tributary streamsAquatic ecosystem health is monitored annually for selected tributary streams via the collection of invertebrate species and a habitat assessment. Invertebrate taxa are good indicators of water quality as they live in the stream year round and respond to changes in water quality and habitat such as increases in sedimentation or algae/plants.
Invertebrate grades are variable throughout the Te Waihora/Lake Ellesmere catchment. Over the past two years there has been an increase in sites with a poor or very poor invertebrate grade, while the habitat grade has improved (Figure 4.6 & Figure 4.7). This indicates that any improvements in macroinvertebrate scores that may expected from improving the surrounding habitat may have been offset by water quality and flow pressures.
Figure 4.4: Trophic level index for Te Waihora/Lake Ellesmere
Figure 4.5: Percentage of water quality index grades for streams within Te Waihora/Lake Ellesmere catchment
Figure 4.6: Percentage of invertebrate grades for streams within Te Waihora/Lake Ellesmere catchment
Figure 4.7: Percentage of water quality index grades for streams within Te Waihora/Lake Ellesmere catchment
18

Recreational water qualityRecreational water quality monitoring is carried out weekly during the summer months for both Te Waihora/Lake Ellesmere and Waikirikiri/Selwyn River. A suitability for recreation grade for each site is derived from raw faecal indicator bacteria (Escherichia coli) measurements and a qualitative risk based assessment (Sanitary inspection category). This grade is used to describe the overall condition of the site in terms of suitability for recreation and the risk of becoming sick from contact with bacteria, viruses and other water-borne pathogens. Sites graded ‘poor’ and ‘very poor’ are generally considered unsuitable for recreation. In the past four years, the recreational water quality site for Te Waihora/Lake Ellesmere at Lakeside Domain has been graded poor. This indicates an increased risk of becoming ill from water based recreational activities that result in full immersion. Recreational water quality has been consistently poor or very poor for the lower Selwyn River over the duration of monitoring (Table 4.1). Previous studies have identified Silverstream (a spring-fed tributary which flows into Waikirikiri/Selwyn River immediately upstream of Coes Ford) as a likely source of faecal contamination, resulting in the decline of grade from good at Chamberlains Ford, to poor at Coes Ford (Robinson, 2013).
Potentially toxic cyanobacteriaToxin-producing cyanobacteria in the lake may be a health risk for both recreational activities and cultural practices such as mahinga kai gathering. These cyanobacteria may also be toxic to animals such as dogs and livestock, due to the production of cyanotoxins. Since 2014, the lake has been dominated by the potentially toxic picocyanobacteria. This bloom has prevailed in the lake year round and the public health warning for this bloom remains current for the third year (Figure 4.8). These cyanobacteria do not appear to produce the visible scums that species such as Anabaena and Nodularia have produced for Te Waihora/Lake Ellesmere in the past.
Groundwater QualityGroundwater is used extensively in the Te Waihora catchment for drinking water, stock water and irrigation. Groundwater also has a strong influence on the water quality and quantity of tributary streams that are fed by groundwater baseflow, particularly in dry periods. This subsequently influences the lake water resource. Nitrate nitrogen concentrations in groundwater near the lake are low (less than 1.0 mg/L). The upwelling of clean, deep groundwater near the coast and denitrification in the sediments around the lake help to maintain the low concentrations. Further up the plains the concentrations are higher. The higher concentrations occur near the spring heads and have the potential to influence the nitrate concentrations in nearby spring-fed streams that flow into Te Waihora/Lake Ellesmere.
Results from the spring 2016 groundwater quality survey showed one well out of 39 where nitrate nitrogen concentrations were greater than 11.3 mg/L, and therefore exceeded the national drinking water standard (MOH, 2008). The majority (80%) of the monitoring wells in the survey are less than 50 m deep (Figure 4.9).
Phosphorus concentrations in groundwater show an inverse pattern to nitrate nitrogen with higher dissolved reactive phosphorus (DRP) concentrations near the lake, particularly near Banks Peninsula, and lower DRP concentrations further up the plains. Rock and soil types near the lake are likely influencing the availability and mobility of phosphorus in the groundwater. The concentrations of DRP recorded in groundwater have been mostly consistent over the five years that they have been measured (2007, 2008, 2014 – 2016). The results for 2016 are shown in Figure 4.10.
Figure 4.9: Nitrate-nitrogen concentrations recorded in groundwater during 2016
2005-06 2006-07 2007-08 2008-09 2009-10 2010-11 2011-12 2012-13 2013-14 2014-15 2015-16 2016-17
Te Waihora/Lake Ellesmere - Domain
Fair Fair Fair Good Good Good Good Fair Poor Poor Poor Poor
Waikirikiri/Selwyn River - Chamberlains Ford
Good Good Good Fair Good Good Good Good Good Good Good Good
Waikirikiri/Selwyn River - Coes Ford
Poor Very poor Very Poor Very Poor Very Poor Poor Poor Poor Poor Poor Poor Poor
Waikirikiri/Selwyn River - Upper Huts
Poor Poor Poor Poor Poor Very Poor Very Poor Very Poor Very Poor Very Poor Very Poor Very Poor
Table 4.1: Suitability for recreation grades for Te Waihora/Lake Ellesmere and Waikirikiri/Selwyn River
Figure 4.8: Potentially toxic cyanobacteria biovolumes for selected sites in Te Waihora/Lake Ellesmere
15-M
ar-1
0
15-J
ul-1
0
15-N
ov-1
0
15-M
ar-1
1
15-J
ul-1
1
15-N
ov-1
1
15-M
ar-1
2
15-J
ul-1
2
15-N
ov-1
2
15-M
ar-1
3
15-J
ul-1
3
15-N
ov-1
3
15-M
ar-1
4
15-J
ul-1
4
15-N
ov-1
4
15-M
ar-1
5
15-J
ul-1
5
15-N
ov-1
5
15-M
ar-1
6
15-J
ul-1
6
15-N
ov-1
6
15-M
ar-1
7
120
Toxicity Threshold
O Selwyn River Mouth
Sth of Timber Yard Pt/Lakeside Domain
Mid Lake
Taumutu/Fishermans Point
Kaituna
0
5
10
15
20
25
30
Pote
nal
ly T
oxic
Cya
noba
cter
iaBi
ovol
ume
(mm
3/L)
19

From time to time, faecal indicator bacteria are detected in the groundwater, particularly after heavy rain. In the 2016 survey, all 39 wells tested for E.coli indicator bacteria had less than one microorganism per 100 millilitres. In 2015, one of the monitoring wells with high nitrate nitrogen also had E.coli present, and therefore exceeded the national drinking water standard (MOH, 2008).
State: Water quantityDuring the 2016/2017 summer groundwater levels and spring fed stream flows in the Te Waihora catchment were much lower than average. The Selwyn River was particularly low, it stopped flowing at Coes Ford for the first time since records began in 1984. Figure 4.11 shows the 7 day mean annual low flow (i.e. the long term average) and the 7 day annual low flow for the 2016/2017 water year. These statistics show that the annual low flow for 2016-17 was much lower for these tributary streams compared to the mean annual low flow.
PressureTe Waihora/Lake Ellesmere continues to be under considerable pressure from surrounding land use such as intensification and water usage. Over the long term poor water quality, sediment inputs and areas of degraded stream habitat for a large proportion of tributary streams have been potential pressures influencing aquatic communities. Sediment and nutrient loads from tributary streams contribute towards further pressure on the lake. This has potential to contribute to the turbid nature of the lake via sediment suspension, and the support of algal production by nutrient enrichment.
The past two years have been very dry years with well-below average groundwater recharge and record low groundwater levels. Over the summer of 2016/17 several groundwater-fed
streams, including the Selwyn River at Coes Ford, went dry. The dry period has meant less nutrients and faecal bacteria have been flushed into surface and groundwater concentrations. However, this dry period has put further pressure on these ecosystems with low flows and warmer water temperatures, and aquatic communities have suffered as a response. Several fish rescues have been conducted as a result of drying reaches in rivers and streams, and invertebrate communities in some tributary streams have shifted to represent those considered more resistant to stream degradation in the past two years (Stark, 1998).
Response– Plan Change 1 was made operative on 1 February 2016. Plan
Change 1 sets rules for
0 nutrient loss reduction
0 Tighter stock exclusion rules that are extended to drains. Drains are an important pathway of nutrient, sediment and microbial contaminants to waterways.
0 Defines Cultural Landscape/Values Management Areas, and Phosphorus and Sediment Risk Areas with tighter restrictions on agricultural activities
– Under Plan Change 1 (Selwyn- Waihora sub regional plan), land owners/managers should have, or be beginning to apply for a land use consent to farm if their farm is over 10 hectares, and;
0 nitrogen losses exceed 15 kilograms/hectare/year, and/or;
0 any part of the property is within the Cultural or Phosphorus and Sediment Area
– Farming at Good Management Practice or better is expected. Good Management Practices have been developed by the relevant Industry Bodies for particular land uses. Farm Environment Plans are used to demonstrate Good Management Practices are being adhered to.
– Whakaora Te Waihora has established wave barriers to reduce wave height and allow macrophyte beds to establish in the lake. Macrophyte beds have been established to reduce bank erosion, improve water clarity and provide habitat for fish.
Lake level managementLake level management in Te Waihora plays the greatest role on ecology by aiding the migration of aquatic species, such as diadromous fish.
Management of the lake level in the last 4 years is unlikely to have had a major long-term influence on water quality. However, intermittent openings of the lake to the sea may alter the water chemistry of the lake when the lake is opened to the sea for a prolonged period of time. In 2013, a reduction in nutrients and algal biomass for the outer lake sites resulted in a shift in trophic status from hypertrophic to supertrophic, and the water was visibly clearer. Prolonged periods of lake opening facilitate the shift of the lake towards a more saline environment. An increasingly saline environment may exert considerable pressure on some freshwater species that cannot tolerate saline environments. For example, an increase in salinity may be detrimental to some macrophyte/plant species re-establishing in the lake bed. Macrophyte beds have been established in the lake as a restoration effort to reduce bank erosion, improve water clarity and provide habitat for fish.
Figure 4.10: Dissolved reactive phosphorus concentrations recorded in groundwater during 2016
Figure 4.11: 7 day MALF and 7 day ALF for Te Waihora/Lake Ellesmere Tributary streams
20

Summary - What are the data telling us?Overall water quality in tributary streams and groundwater have shown improvements over the two years. The water quality index has indicated improvements at several sites, with some sites graded “Good” in 2016-17. This may be a result of land management interventions in the catchment but with much drier weather conditions, contaminants such as nutrients, bacteria and sediment may not have been flushed into surface and groundwater systems as readily. It will require a longer monitoring period to see if the improving trends are long-lasting. However, low flows and warmer temperatures have seen a shift in aquatic invertebrate communities with 70% of sites monitored indicating ‘Poor’ or ‘Very Poor’ invertebrate grades in the past two years. Rainfall in the catchment has generally been below average for the past two years, with all streams monitored indicating that the annual low flow in 2016-17 was well below the mean.
Annual indicators are very sensitive to annual climatic variation, and such changes to water quality and quantity may be short lived. Long term changes are more responsive to a change in land use practices. The lake itself is more buffered from annual variation due to long residence times. The Trophic Level Index has remained as ‘Hypertrophic’ since 2013 when the lake was open for a prolonged period.
References/useful linksMinistry of Health (MoH), 2008. Drinking-Water Standards for New Zealand 2005 (revised 2008). Published by the New Zealand Ministry of Health, Wellington.
Renwick, J., Horrell, G., McKerchar, A., Verburg, P., Hicks, M., and Hreinsson, E.O., 2010. Climate change impacts on Te Waihora/Lake Ellesmere.
Robinson KM. 2013. Selwyn River/Waikirikiri and the Silverstream tributary: Summer Water Quality Investigation 2012-2013. Unpublished Environment Canterbury report.
Stark, J. D. 1998: SQMCI: a biotic index for freshwater macroinvertebrate coded abundance data. New Zealand Journal of Marine and Freshwater Research 32: 55-66.
Verburg P., Hamill K,. Unwin M. and Abell J. 2010 Lake water quality in New Zealand 2010: Status and trends. Prepared for the Ministry for the Environment, Wellington.
Water coming across Coes Ford Oct 2017
Trophic Lake Index - mid lake limit = 6.6, margins = 6 (PC1)
Water Quality Index - Fair or better (CWMS target)
Invertebrate/habitat grades - Fair or better (CWMS target)
Recreation grades - Good-fair (PC1, derived from MfE 2003)
Potentially toxic cyanobacteria - < 1.8 mm3/L (MfE, MoH 2009)
Ground water quality*
Water Quantity (tributaries) Targets in PC1 – consents will align on renewal
*Ground water quality (N&P) - 8.5 mg/L for nitrate nitrogen (PC1), NB for drinking water Maximum Allowable Value of 11.3 mg/L nitrate nitrogen for drinking water (MoH, 2013), E. coli < 1 organism/100 ml (PC1), no target set for P
21

VegetationTe Waihora/Lake Ellesmere – State of the Lake 2017Lead authors: Phillip Grove, Jodi Rees – Environment Cantebury
How will we know when we have achieved success?Significant indigenous vegetation of the lake margin, wetlands and tributary streams is protected and restored.
Section 5
ContextMonitoring of vegetation around the margin of Te Waihora is carried out through repeated survey, mapping and description of lakeshore habitats. Reporting on trends in lake shore vegetation is done by comparing results from recent and past surveys. Data from two surveys, carried out in 1983 and 2007, were analysed and trends reported in the State of the Lake 2013.
Field survey of Te Waihora shoreline wetlands was repeated in January-April 2017. At the time of writing this report survey information is being entered into a spatial database. This will enable further analysis of trends in lake shore wetland habitats and vegetation cover over the last ten years. Full results of this study will be presented in a technical report.
Some preliminary observations and comments on state and trends in lake shore wetland vegetation are provided here.
StateOur impression is that, overall, the state of lakeshore wetland vegetation has improved over the last ten years. This has been in response to reduced stock grazing pressure or cessation of grazing over extensive areas of lakeshore, on both public and private land, and recent environmental weed control programmes. However, there have also been some other parts of the lake shore where the state of indigenous vegetation has declined due to vegetation clearance, increased grazing pressure, vehicle damage and spread of weeds. Examples are the further spread of grey willow south of Lakeside Scientific Reserve. Prolonged low lake levels over the last summer-autumn period, following lake opening in September 2016, also had an adverse impact on some wetland plant communities. These pressures are discussed further in the section below.
Environmental changes – potential shift in bed levels post 2010-11 earthquakes and lake shore erosionWhen comparing the aerial photographs used at the time of the 2007 survey to those of the recent survey, we noticed that extent of low-elevation mudflats and sandflats supporting saltmarsh herbfield vegetation was greatly reduced, particularly along the eastern lakeshore from Kaituna Lagoon to the Halswell River mouth (Figure 5.1). Areas of lake bed which had previously been regularly exposed at times of low lake water level, remained underwater and therefore un-vegetated when surveyed in summer 2017, even though lake water levels were very low (c. 0.6 m asl) at that time. We surmise that this may be a response to change in lake bed levels following the 2010-11 Canterbury earthquakes, although we are not aware that this
has been documented for Te Waihora. Marked changes to bed levels of the Avon-Heathcote Estuary (Meadows et al 2013) and the lower Waimakariri-Brooklands Lagoon estuaries occurred following the earthquakes , and have resulted in significant hydrological changes, and therefore also changes in extent and type of associated wetland habitats and plant communities (Cochrane et al. 2014).
Wavelap erosion of Te Waihora shoreline has been recorded for many years along the entire lake shore line at various times (Taylor et al 1996). Over the last ten years, wavelap erosion has been most noticeable along parts of the south-west shoreline where mid-to-high elevation lake margin wetland vegetation, e.g. three-square reedland, has retreated by about 10-15 metres in places (Figure 5.2). However other parts of the shoreline and associated plant communities have been stable or even advanced over the same period.
Figure 5.1: 2015 aerial photo of eastern Waihora showing retreat of the vegetated area of low-elevation mudflats and saltmarsh herbfield, surveyed and mapped in summer 2007 and summer 2017.
Figure 5.2: 2015 aerial photo showing advance of open water and retreat of lake margin wetland vegetation at Taumutu Commonage, surveyed and mapped in summer 2007 and summer 2017.
Vege
tatio
n
22
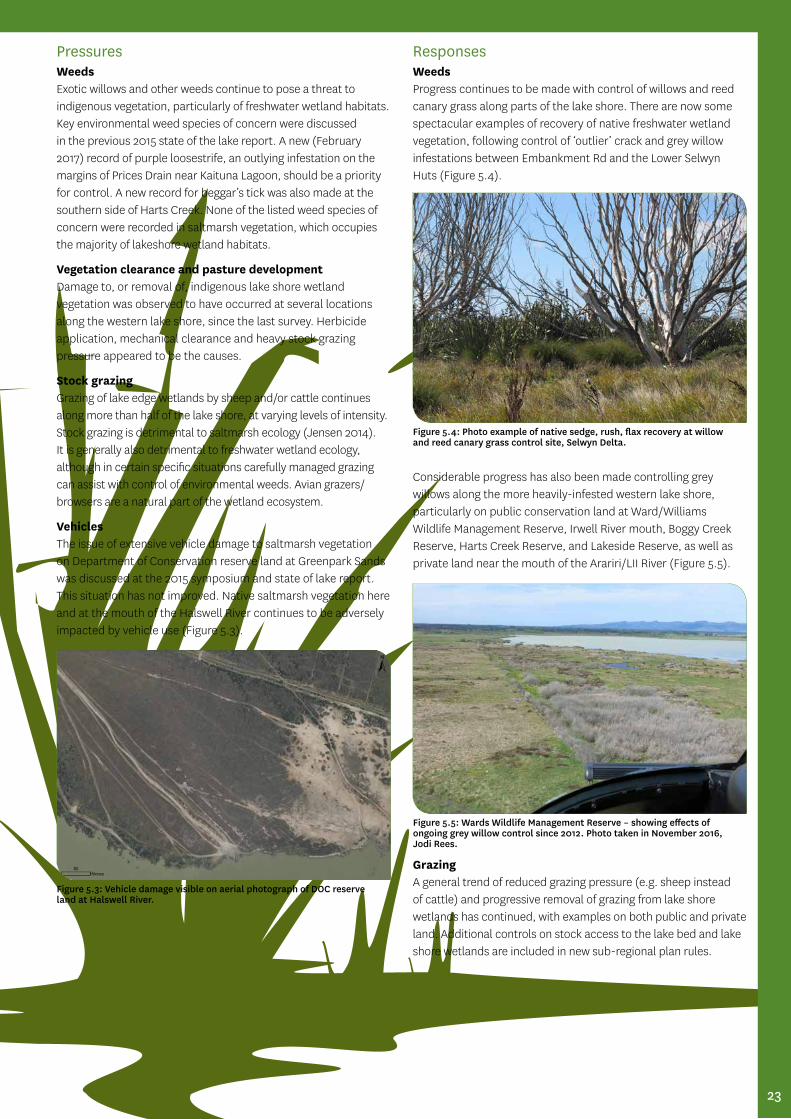
Pressures WeedsExotic willows and other weeds continue to pose a threat to indigenous vegetation, particularly of freshwater wetland habitats. Key environmental weed species of concern were discussed in the previous 2015 state of the lake report. A new (February 2017) record of purple loosestrife, an outlying infestation on the margins of Prices Drain near Kaituna Lagoon, should be a priority for control. A new record for beggar’s tick was also made at the southern side of Harts Creek. None of the listed weed species of concern were recorded in saltmarsh vegetation, which occupies the majority of lakeshore wetland habitats.
Vegetation clearance and pasture developmentDamage to, or removal of, indigenous lake shore wetland vegetation was observed to have occurred at several locations along the western lake shore, since the last survey. Herbicide application, mechanical clearance and heavy stock grazing pressure appeared to be the causes.
Stock grazingGrazing of lake edge wetlands by sheep and/or cattle continues along more than half of the lake shore, at varying levels of intensity. Stock grazing is detrimental to saltmarsh ecology (Jensen 2014). It is generally also detrimental to freshwater wetland ecology, although in certain specific situations carefully managed grazing can assist with control of environmental weeds. Avian grazers/browsers are a natural part of the wetland ecosystem.
VehiclesThe issue of extensive vehicle damage to saltmarsh vegetation on Department of Conservation reserve land at Greenpark Sands was discussed at the 2015 symposium and state of lake report. This situation has not improved. Native saltmarsh vegetation here and at the mouth of the Halswell River continues to be adversely impacted by vehicle use (Figure 5.3).
Responses WeedsProgress continues to be made with control of willows and reed canary grass along parts of the lake shore. There are now some spectacular examples of recovery of native freshwater wetland vegetation, following control of ‘outlier’ crack and grey willow infestations between Embankment Rd and the Lower Selwyn Huts (Figure 5.4).
Considerable progress has also been made controlling grey willows along the more heavily-infested western lake shore, particularly on public conservation land at Ward/Williams Wildlife Management Reserve, Irwell River mouth, Boggy Creek Reserve, Harts Creek Reserve, and Lakeside Reserve, as well as private land near the mouth of the Arariri/LII River (Figure 5.5).
GrazingA general trend of reduced grazing pressure (e.g. sheep instead of cattle) and progressive removal of grazing from lake shore wetlands has continued, with examples on both public and private land. Additional controls on stock access to the lake bed and lake shore wetlands are included in new sub-regional plan rules.
Figure 5.3: Vehicle damage visible on aerial photograph of DOC reserve land at Halswell River.
Figure 5.4: Photo example of native sedge, rush, flax recovery at willow and reed canary grass control site, Selwyn Delta.
Figure 5.5: Wards Wildlife Management Reserve – showing effects of ongoing grey willow control since 2012. Photo taken in November 2016, Jodi Rees.
23

VehiclesThe Department of Conservation has restricted vehicle access to Yarrs Flat Wildlife Management Reserve and vegetation is recovering in response.
Native plantingNative restoration plantings have been successfully established at a number of sites around the lake shore. Planting sites are generally in terrestrial and riparian habitats immediately adjoining lake shore wetlands. Examples include Irwell River Mouth Conservation Area, Timberyard Road (landing Yard Point Reserve), Lakeside Wildlife Management Reserve.
Lake level managementAfter an opening on 28 September 2016, the lake remained open to the sea for the next 34 days and effectively functioned as a tidal estuary over that time. The lake water level remained low (at or below 0.6 m asl) over the next six months and did not top 1 m asl until June 2017. We observed localised dieback of saltmarsh vegetation during the summer-autumn period presumably as a result of moisture stress. Rushes and some marsh ribbonwood shrubs along the upper saltmarsh margin were affected, as were mid-elevation glasswort beds. The low lake levels did provide opportunity for expansion of native musk (Thyridia repens) herbfield cover on low-elevation mudflats along some parts of the lake shore.
Summary Ongoing weed control has protected some areas of freshwater wetland habitat and facilitated regeneration of native freshwater wetland vegetation. However, other areas of lake shore freshwater wetland vegetation are still being lost to willow spread, as well as from direct human action (mechanical clearance, herbicide, conversion to pasture and heavy grazing pressure). For saltmarsh vegetation, there has been an overall improvement in vegetation condition with reduction in grazing pressure, but damage or loss from vehicles and mechanical vegetation clearance was evident in some areas.
Measures of success for lake margin vegetation can be summarised as:
Annual net gain of key habitats (e.g. raupō) and maintenance of other important habitat types (e.g. saltmarsh)
Maintain or increase populations threatened or at risk plant species
Annually reduce and stop spread of key problem willow species and other significant animal and pest weeds of native vegetation
Recommendations Measures to address damage caused by vehicle access, and additional resourcing for further weed control and lake margin land acquisition; implementation of regional and sub-regional plan rules relating to protection of wetland habitats are recommended.
Williams Wildlife Management Reserve on the western shore of Te Waihora 2016.
24
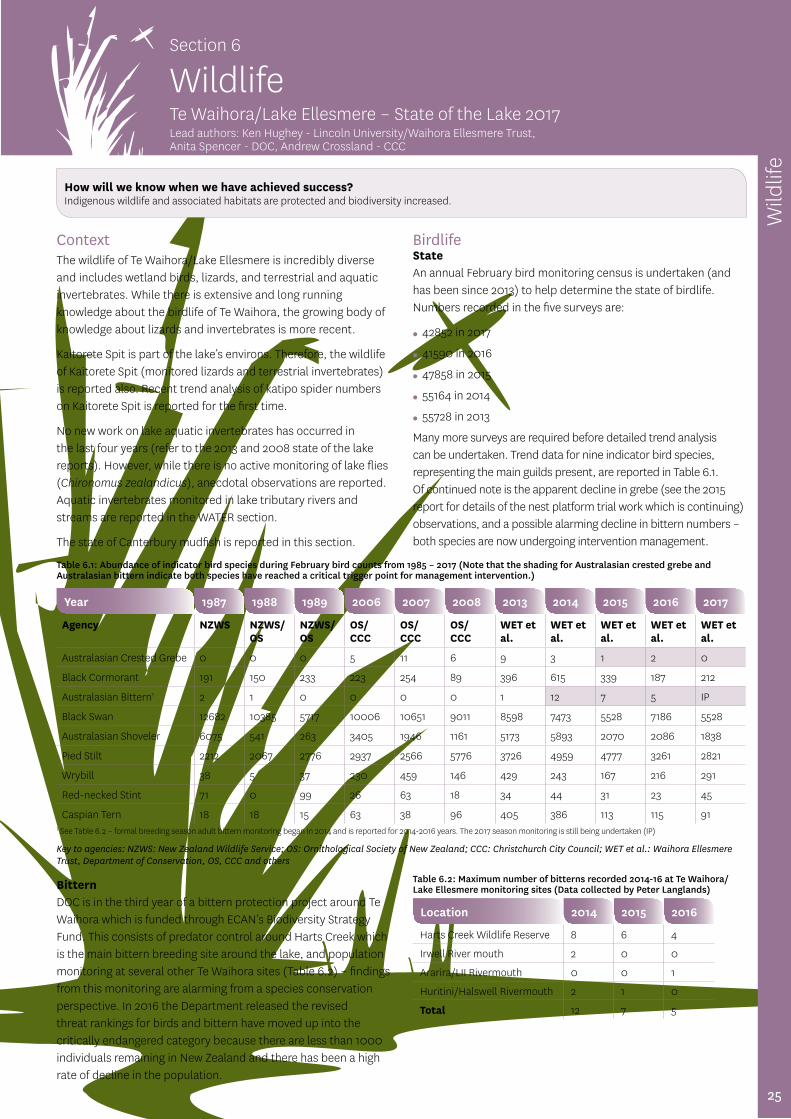
ContextThe wildlife of Te Waihora/Lake Ellesmere is incredibly diverse and includes wetland birds, lizards, and terrestrial and aquatic invertebrates. While there is extensive and long running knowledge about the birdlife of Te Waihora, the growing body of knowledge about lizards and invertebrates is more recent.
Kaitorete Spit is part of the lake’s environs. Therefore, the wildlife of Kaitorete Spit (monitored lizards and terrestrial invertebrates) is reported also. Recent trend analysis of katipo spider numbers on Kaitorete Spit is reported for the first time.
No new work on lake aquatic invertebrates has occurred in the last four years (refer to the 2013 and 2008 state of the lake reports). However, while there is no active monitoring of lake flies (Chironomus zealandicus), anecdotal observations are reported. Aquatic invertebrates monitored in lake tributary rivers and streams are reported in the WATER section.
The state of Canterbury mudfish is reported in this section.
BirdlifeState An annual February bird monitoring census is undertaken (and has been since 2013) to help determine the state of birdlife. Numbers recorded in the five surveys are:
● 42852 in 2017
● 41590 in 2016
● 47858 in 2015
● 55164 in 2014
● 55728 in 2013
Many more surveys are required before detailed trend analysis can be undertaken. Trend data for nine indicator bird species, representing the main guilds present, are reported in Table 6.1. Of continued note is the apparent decline in grebe (see the 2015 report for details of the nest platform trial work which is continuing) observations, and a possible alarming decline in bittern numbers – both species are now undergoing intervention management.
Table 6.1: Abundance of indicator bird species during February bird counts from 1985 – 2017 (Note that the shading for Australasian crested grebe and Australasian bittern indicate both species have reached a critical trigger point for management intervention.)
Year 1987 1988 1989 2006 2007 2008 2013 2014 2015 2016 2017
Agency NZWS NZWS/ OS
NZWS/ OS
OS/ CCC
OS/ CCC
OS/ CCC
WET et al.
WET et al.
WET et al.
WET et al.
WET et al.
Australasian Crested Grebe 0 0 0 5 11 6 9 3 1 2 0
Black Cormorant 191 150 233 223 254 89 396 615 339 187 212
Australasian Bittern1 2 1 0 0 0 0 1 12 7 5 IP
Black Swan 12682 10385 5717 10006 10651 9011 8598 7473 5528 7186 5528
Australasian Shoveler 6075 541 263 3405 1946 1161 5173 5893 2070 2086 1838
Pied Stilt 2212 2067 2776 2937 2566 5776 3726 4959 4777 3261 2821
Wrybill 38 5 37 230 459 146 429 243 167 216 291
Red-necked Stint 71 0 99 26 63 18 34 44 31 23 45
Caspian Tern 18 18 15 63 38 96 405 386 113 115 911 See Table 6.2 – formal breeding season adult bittern monitoring began in 2014 and is reported for 2014-2016 years. The 2017 season monitoring is still being undertaken (IP)
Key to agencies: NZWS: New Zealand Wildlife Service; OS: Ornithological Society of New Zealand; CCC: Christchurch City Council; WET et al.: Waihora Ellesmere Trust, Department of Conservation, OS, CCC and others
BitternDOC is in the third year of a bittern protection project around Te Waihora which is funded through ECAN’s Biodiversity Strategy Fund. This consists of predator control around Harts Creek which is the main bittern breeding site around the lake, and population monitoring at several other Te Waihora sites (Table 6.2) – findings from this monitoring are alarming from a species conservation perspective. In 2016 the Department released the revised threat rankings for birds and bittern have moved up into the critically endangered category because there are less than 1000 individuals remaining in New Zealand and there has been a high rate of decline in the population.
Table 6.2: Maximum number of bitterns recorded 2014-16 at Te Waihora/Lake Ellesmere monitoring sites (Data collected by Peter Langlands)
Location 2014 2015 2016
Harts Creek Wildlife Reserve 8 6 4
Irwell River mouth 2 0 0
Ararira/LII Rivermouth 0 0 1
Huritini/Halswell Rivermouth 2 1 0
Total 12 7 5
WildlifeTe Waihora/Lake Ellesmere – State of the Lake 2017Lead authors: Ken Hughey - Lincoln University/Waihora Ellesmere Trust, Anita Spencer - DOC, Andrew Crossland - CCC
Section 6
How will we know when we have achieved success?Indigenous wildlife and associated habitats are protected and biodiversity increased.
Wild
life
25

Where the cause of death is known for bittern, starvation is becoming one of the leading reasons. Providing bittern with a network of wetlands with abundant food and safe nesting sites could be the key to protecting this mobile species. In response ECAN have increased their funding for the project and it has expanded over a wider area. Plans for the 2017 breeding season involve bittern expert Dr Emma Williams catching bittern and attaching GPS tags which will enable monitoring across the landscape and the gathering of more information about bittern nesting success and adult survival.
Royal SpoonbillA successful self-colonist from Australia, the royal spoonbill (Platalea regia) has undergone a remarkable population increase in New Zealand over recent decades, with the national population rising from 52 birds in 1977 (Heather & Robertson 1996) to 956 by 2000 and 2361 in 2012 (Schweigman & Thompson 2012). Royal spoonbills were first noticed flocking on an island near the Halswell River mouth during the 2010/11 breeding season, but as the site was on private land and was separated from the lake edge by 700m of water, the site was not visited.
The following breeding season a much larger concentration was noted close to the 2010/11 site and an investigation found a colony with nests and chicks. By season’s end this new colony comprised 59 nests. The 2010/11 colony was located and found to have 12 old nests. Breeding occurred again in 2012/13. As spoonbills are sensitive to disturbance, managers have kept away during the active breeding/chick-raising period and have done a nest count shortly after breeding has finished. Nest totals increased to 83 in 2012/13 and 118 in 2013/14.
In late 2013 a trap line was set up along the rail trail to partially protect the colony from mammalian predation, but despite this the royal spoonbills have suffered a series of mishaps in recent breeding seasons - flooding, human disturbance, and predation by black-backed gulls - the colony was much diminished in the 2016/17 season with at least 71 nests. Breeding success is unknown but it is suspected that many eggs/chicks were washed away by the high lake levels which over topped the colony.
Pressures (and known driving forces) on birdlife are diverse, namely:
– predation by introduced mammals (and some native birds, e.g., harrier hawk and black-backed gull)
– wetland habitat loss as a result of: 0 land use intensification 0 invasion by exotic species, e.g., willows – see VEGETATION
section
– the lake opening and closing regime, especially for some species, including Australasian crested grebe
– physical disturbance, mainly via recreational users, both around the lake and on Kaitorete Spit.
Most notable amongst the above pressures has been spring opening of the lake to allow migratory fish to enter. This has rapidly lowered lake and river levels mid nesting season. As a result grebe nests, which are built on the water attached to submerged vegetation, fail.
Response ● traplines (CCC) to protect royal spoonbill and white-fronted tern nesting areas, including key areas of Kaitorete Spit also for banded dotterel
● traplines (DOC) along the Kaituna River to protect nesting Australasian crested grebe with traps maintained each spring/summer through the nesting period
● installation and improvement of nesting platforms for grebes (see 2015 State of the Lake Report Wildlife Section)
● DOC trapping in the Harts Creek area to enhance bittern conservation
LizardsSince 2015 there has been no significant new information available about lizards around the lake.
Terrestrial InvertebratesKiwaia and KupeaMonitoring of the two species of moth endemic to Kaitorete Spit began in 2013. The moths spend most of their life as pupae under the ground feeding on host plants and only emerge for a few weeks a year which is when DOC does its monitoring. In 2017 numbers at a key Kupe’s grass moth site plummeted due to high rabbit numbers which had decimated the moths’ host plant, Zoysia minima. DOC has undertaken rabbit control at the site.
KatipoTwo yearly monitoring of the Kaitorete katipo population continues to be carried out at 10 sites in the front dunes (Figure 6.1). The trend over the past 12 years shows an increase in numbers - this is likely related to the large scale weed control carried out by DOC leading to substantial improvement in the habitat, particularly pingao which is the main plant used for web building. Kaitorete Spit is the national stronghold for the species. The monitoring also shows that the ‘false katipo’ Steatoda capensis (see Sutton et al. 2006), an introduced South African species, which is considered to possibly out compete katipo in some areas, has remained in low numbers.
Spoonbills
Kupe’s grassmoth
26
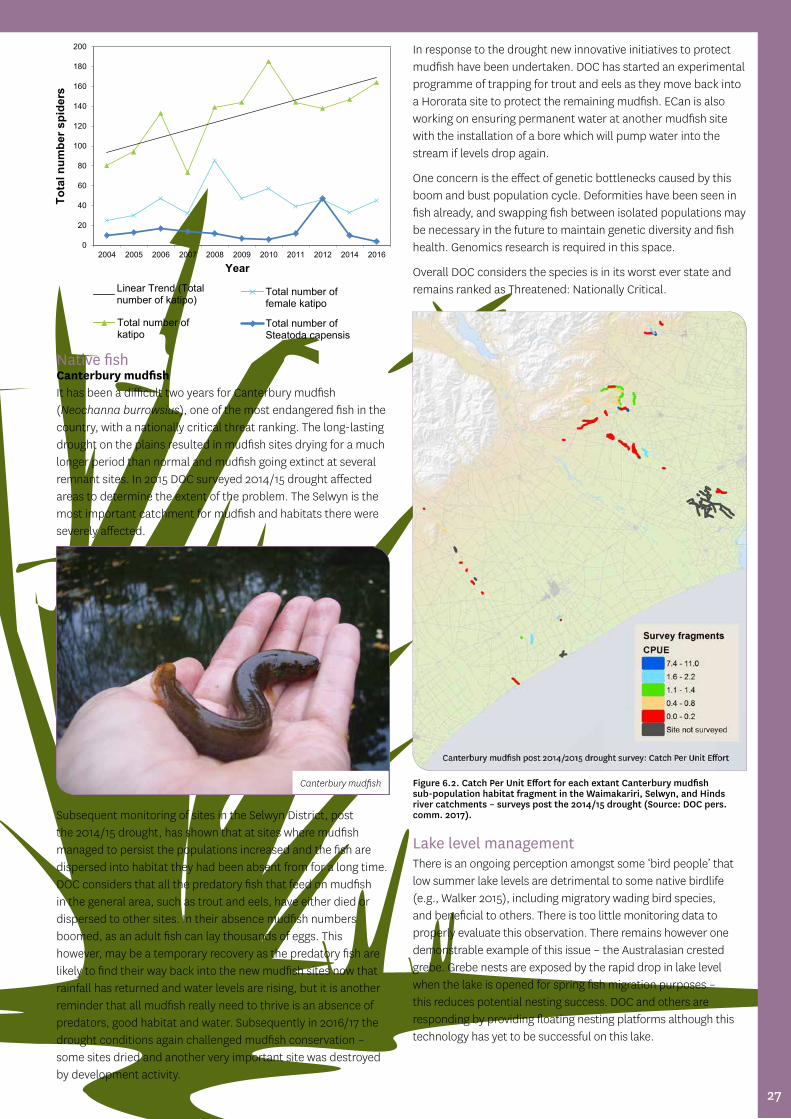
Native fishCanterbury mudfishIt has been a difficult two years for Canterbury mudfish (Neochanna burrowsius), one of the most endangered fish in the country, with a nationally critical threat ranking. The long-lasting drought on the plains resulted in mudfish sites drying for a much longer period than normal and mudfish going extinct at several remnant sites. In 2015 DOC surveyed 2014/15 drought affected areas to determine the extent of the problem. The Selwyn is the most important catchment for mudfish and habitats there were severely affected.
Subsequent monitoring of sites in the Selwyn District, post the 2014/15 drought, has shown that at sites where mudfish managed to persist the populations increased and the fish are dispersed into habitat they had been absent from for a long time. DOC considers that all the predatory fish that feed on mudfish in the general area, such as trout and eels, have either died or dispersed to other sites. In their absence mudfish numbers boomed, as an adult fish can lay thousands of eggs. This however, may be a temporary recovery as the predatory fish are likely to find their way back into the new mudfish sites now that rainfall has returned and water levels are rising, but it is another reminder that all mudfish really need to thrive is an absence of predators, good habitat and water. Subsequently in 2016/17 the drought conditions again challenged mudfish conservation – some sites dried and another very important site was destroyed by development activity.
In response to the drought new innovative initiatives to protect mudfish have been undertaken. DOC has started an experimental programme of trapping for trout and eels as they move back into a Hororata site to protect the remaining mudfish. ECan is also working on ensuring permanent water at another mudfish site with the installation of a bore which will pump water into the stream if levels drop again.
One concern is the effect of genetic bottlenecks caused by this boom and bust population cycle. Deformities have been seen in fish already, and swapping fish between isolated populations may be necessary in the future to maintain genetic diversity and fish health. Genomics research is required in this space.
Overall DOC considers the species is in its worst ever state and remains ranked as Threatened: Nationally Critical.
Lake level managementThere is an ongoing perception amongst some ‘bird people’ that low summer lake levels are detrimental to some native birdlife (e.g., Walker 2015), including migratory wading bird species, and beneficial to others. There is too little monitoring data to properly evaluate this observation. There remains however one demonstrable example of this issue – the Australasian crested grebe. Grebe nests are exposed by the rapid drop in lake level when the lake is opened for spring fish migration purposes – this reduces potential nesting success. DOC and others are responding by providing floating nesting platforms although this technology has yet to be successful on this lake.
Canterbury mudfish Figure 6.2. Catch Per Unit Effort for each extant Canterbury mudfish sub-population habitat fragment in the Waimakariri, Selwyn, and Hinds river catchments – surveys post the 2014/15 drought (Source: DOC pers. comm. 2017).
27

There is no research demonstrating a link between lake level management and lizards or terrestrial invertebrates. There is anecdotal observation of a relationship between extended spring-early summer openings and lower lake fly numbers which needs research – this observation was made in 2015 and has not been explored further.
Summary To gauge our measure of success for wildlife, the overall state for each subset of animals: birds, lizards, invertebrates, native fish, is evaluated using the traffic light bar. Exceptions are noted, i.e., Australian grebe and bittern; aquatic invertebrates unknown.
Native bird species diversity is maximised with a target average level of 39 species from 7 guilds recorded per annum
Native bird species with a defined conservation risk status and which rely on the lake for critical life stage requirements have populations enhanced
Australasian grebe, Bittern
The optimum range of habitat conditions for the diversity of native bird species present is provided
Australasian grebe, Bittern
Lizards (specific measures not yet identified)
(Unknown)
Terrestrial invertebrates (specific measures not yet identified)
(Unknown)
Aquatic invertebrates (specific measures not yet identified)
(Unknown)
Canterbury mudfish viable populations and habitats maintained
The overall state of native birdlife is good, except for the key species noted, but the status ‘arrow’ has been shifted further to the left to reflect the parlous state of grebe and bittern. It is too soon to detect trends for the existing five years of bird monitoring data across the full suite of species although it does appear that some Arctic migratory wading bird species that visit the lake have declined in numbers over many years. This is likely the result of conditions in the Arctic, and on the flyways, rather than lake conditions.
For at risk lizard, bird, and terrestrial invertebrate species, interventions are in place. Species recovery will be monitored and reported. Monitoring data from Kaitorete Spit over a range of habitats and species is demonstrating some improvement, e.g., with lizards and katipo. No improvement is yet occurring for bittern or grebe. For Canterbury mudfish interventions are in place to safeguard the species in the face of drought and predation.
There is no active monitoring of ‘lake flies’, an issue that needs addressing.
Recommendations – For birds and lizards:
0 maintain current monitoring and species recovery interventions, and report on responses
– Terrestrial invertebrates:
0 maintain current monitoring and species recovery interventions, and report on responses
0 encourage student researchers to target key shoreline areas of the lake to document species presence
– Aquatic invertebrates:
0 develop and implement a monitoring programme for lake flies (Chironomus zealandicus) that links to changing lake levels.
– Native fish – Canterbury mudfish:
0 Maintain the monitoring and reporting programme.
References Hitchmough R., Anderson P., Barr B., Lettink M., Reardon J., Tocher, M., Whitaker, T. 2013. Conservation Status of New Zealand Reptiles 2012. New Zealand Threat Classification Series 2. Department of Conservation, Wellington.
Sutton M.E., Christensen B, Hutcheson J.A. 2006. Field identification of katipo (DOC Research & Development Series 237) (PDF). Department of Conservation, Wellington, New Zealand.
Walker, J. 2015. Droppings from the RR. P4, in: The Wrybill, Newsletter of the Canterbury Region, Ornithological Society of New Zealand, February.
White herons. Photo Steve Attwood
Moko gecko shedding skin. Photo Steve Attwood
28

FishTe Waihora/Lake Ellesmere – State of the Lake 2017Lead authors: Shannan Crow, Phil Jellyman, Don Jellyman, Darcel Rickard and Erica Williams - NIWA
FishHow will we know when we have achieved success?
Native fish populations and associated habitats are protected and/or restored
ContextWith almost 50 fish species recorded from Te Waihora (Lake Ellesmere) over the years, it is likely to have amongst the highest recorded fish diversity of any lake in New Zealand. It is not however, the freshwater fish species that has resulted in such high diversity, but rather the occasional influx of nearly 30 marine species. The influx of fish species, both freshwater and marine, occurs when Te Waihora is open to the sea and fishes migrate into and out of the lake. When the lake is open for extended periods, the lake level decreases until it reaches sea level and then tidal exchanges occur between the lake and sea that increases lake salinity levels. These salinity levels can vary widely across the lake creating conditions that are suitable for both freshwater and marine fish species.
Artificial lake openings are a critical tool used to manage fishery values in Te Waihora. The outlet of Te Waihora naturally closes to the sea during southerly swells, which restricts migrations of fishes into and out of the lake. These migrations are essential for some species to complete their life cycle and to sustain the fishery in the lake. If we consider the two eel species as an example (Figure 7.1), both longfin eels and shortfin eels begin their life in the ocean and enter the lake as juveniles (elvers). After growing for around 20-40 years in the lake, the adult eels must then return to the ocean to spawn and complete their lifecycle. This means that there are two critical life stages where eels must move through the outlet of the lake, which is problematic if the lake is closed. The lake is artificially opened to allow fish to migrate into and out of the lake, but with only limited numbers of lake opening events occurring each year it is important to know how the timing and duration of lake openings influence fish recruitment.
StateAssessing the state of native fishes in the lake is more complex than for other lake values such as water quality or bird fauna, because in the murky lake waters it is not easy to observe whether fisheries values are markedly changing without intensive sampling. The high resource requirements for sampling freshwater fishes means that there are often limited data available for managers. Regular commercial catch data are available for eels and flounder (see Figure 7.2) and these species have also been the focus of various research projects during the last few decades. For most other native species, data are either limited or practically non-existent, although for yelloweye mullet the Ministry for Primary Industries (MPI) have recorded data on the intermittent commercial catch since 1990. The commercial eel fishery in Te Waihora commenced in the early 1970s and peaked in the late 1970s when it accounted for almost half of the total New Zealand eel catch. However, concerns over the sustainability of these catches led the lake to be declared a controlled fishery in 1978. Various restrictions on the total eel catch have been in place since 1978 and from 2000, the annual Total Allowable Commercial Catch (TACC) has been set at 121.93 tonnes; this has been reached most years (Figure 7.2a). MPI also hold data on the customary permits issued by lake kaitiaki (guardians) on behalf of Ngāi Tahu for customary harvest in Te Waihora because a certain percentage of the quota is also set aside for customary and recreational fishers.
Section 7
Figure 7.1: Life cycle of shortfin (Anguilla australis) and longfin (Anguilla dieffenbachii) eels
Figure 7.2: Annual commercial catch of eels (a) and flatfish (b) from Te Waihora: Note that the commercial fisheries differ in total duration and that the 2013 fishing year was still in progress when these figures were produced. Data from MPI.
29

Goldfish
The average size and condition of shortfin eels has not changed between the 1970s and 2005. However, during 1970 – 1990 there was a much higher percentage of tuna captured that were around the 400 – 450 mm lengths, while in the 2000-2010 decade there are more larger shortfins (Figure 7.3). Currently there may be larger eels appearing in catches more frequently compared to the 1970s when we would have just caught tuna around 400-500 mm. The high abundance of small tuna (450 mm) seen in the 1970 – 1990s, is characteristic of a fishery that has received high harvest pressure. The shift to a fishery that has more large eels in recent times suggest that the fishery and tuna population has improved.
The commercial flounder fishery in Te Waihora varies dramatically from year to year, as do the proportions of the three main species in the catch, but catches of black flounder are typically double those of either sand or yellowbelly flounder. Annual variation in catches of flounder can be seen from the commercial catches of flounder over the past 60 years, which shows that flounder catches in adjacent years can vary by more than 10-fold (Figure 7.2b). There has been an active commercial flounder fishery in the lake since the late 1890s, and the variability of catch reflects flounder abundance rather than fishing effort. Most commercial flounder fishers in the lake also fish for eels, and observing the number and size of the bycatch of juvenile flounder enables them to predict the strength of upcoming cohorts of flounder because these species only occupy the lake for 2 to 3 years before leaving to spawn in the ocean.
The other commercial fishery in the lake is that of yelloweye mullet although it is significantly smaller than either the eel or flounder fishery averaging only 5.8 tonnes. This fishery shows marked seasonal variability and primarily occurs between June and August. The quantity of mullet caught, or the variability in the total catch between years, is likely to reflect variation in market demand more so than annual variability in fish numbers. The final fishery on Te Waihora is for whitebait, but because this fishery is not administered by MPI there are no reliable catch data available (and whitebaiters are notoriously cagey about providing catch data). In some parts of New Zealand the whitebait catch may be composed of five Galaxias species, but recent recruitment work undertaken by NIWA as part of the Whakaora Te Waihora
programme indicates the whitebait catch from around the mouth of the lake is almost entirely composed of inanga, which is the dominant species in whitebait catches throughout New Zealand and is typically the most abundant species along much of the East Coast of the South Island.
There are two major prey fish species in the lake and these are common bully and common smelt. These fish were by far the most numerous during recent recruitment monitoring by NIWA at locations close to the lake opening site. However, their numbers can vary substantially at different sites around the lake and common smelt in particular are usually most abundant along the western shoreline. The determinants of spatial variability in common bully abundance is a focus of current research.
PressureThere are a range of pressures that influence fish communities in the lake aside from human harvests. The timing and duration of lake openings is perhaps the largest pressure on fish communities because this process affects the abundance of subsequent cohorts, particularly for short-lived, fast growing fish such as flounder. This has been the focus of a recent NIWA research project that has focussed on refining the timing of recruitment for the most common fish species. Whilst opening the lake at the right times of year is critical for fishes, if the outlet does not close before the hottest summer months there is the potential for a range of negative effects to occur as a result of low summer lake levels, although this is yet to be quantified. The effects of extended low summer lake levels would likely include: (1) the loss of lake margin habitat and feeding areas for fish, (2) high water temperatures in the shallower parts of the lake which can result in decreased water quality and increased likelihood of algal blooms, which can potentially be toxic, (3) access to potential spawning habitat around lake margins is reduced for prey species; (4) the lake is shallower, which reduces the water depth for pelagic feeding fishes; and (5) access issues for commercial, cultural and recreational fishers. The extent of habitat change through time and whether or not there has been significant habitat degradation because of historical land-use change has never been quantified. Te Waihora will always be a shallow lake with the potential for extreme wind-fetch effects to rapidly alter habitat conditions for fish.
In the face of all these pressures, most native species appear to be well adapted to cope compared to introduced fishes. Introduced and pest fish species may be less tolerant of some of the extreme conditions that can occur in Te Waihora. For example, goldfish have been observed in large numbers in selected tributaries seeking salinity refuge after extended periods when the lake has remained open. Fish species whose abundance in the lake is closely aligned with appropriately timed lake openings are more vulnerable to inter-annual variability in recruitment (e.g., flounder), but for longer-lived species such as eels, populations appear to be relatively stable based on commercial and customary data from recent years. Recent analyses on data collected by NIWA (and its predecessor organisation) at various times since the 1970s has found that there has been no significant change over time in the length of shortfin eels and whilst shortfin eel condition showed some variation between years, there was no increasing or decreasing trend over decadal time scales.
Figure 7.3: Percentage of the shortfin eels capture for each length category from 1970 – 2016. The number of eels caught in each decade is shown with the “n=” symbol, while the average length (mm) of shortfins for each decade is shown with “x- =” symbol.
30
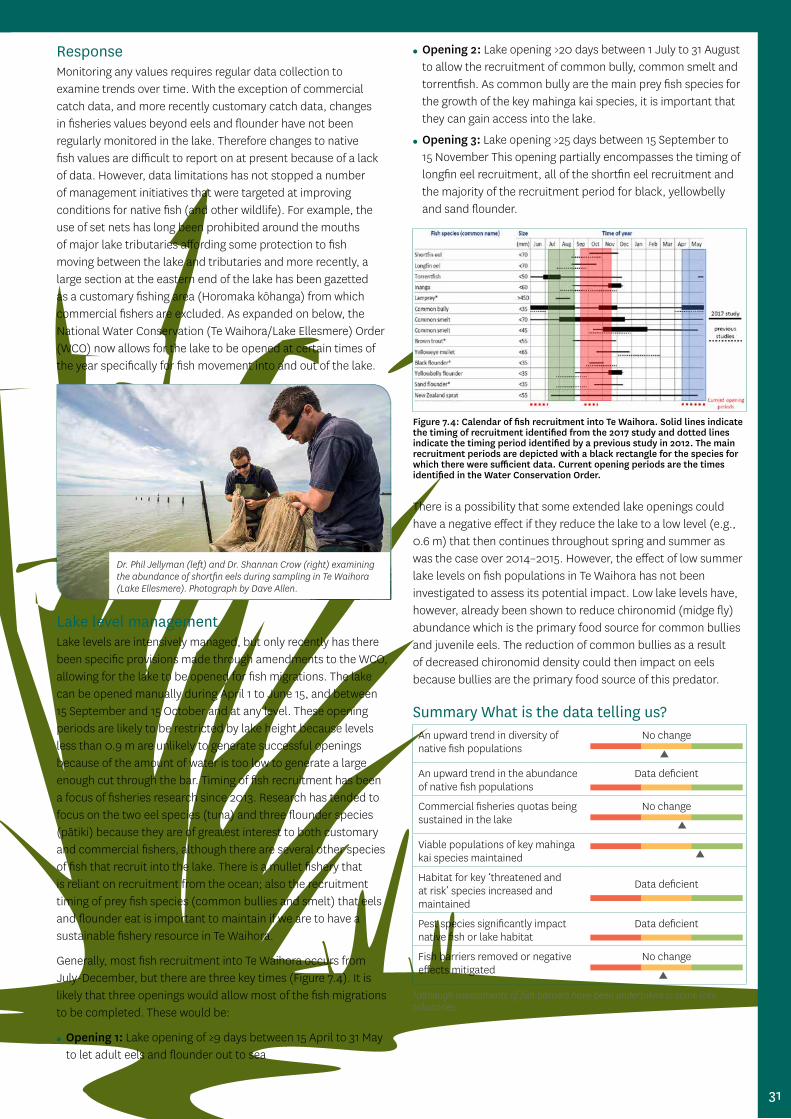
ResponseMonitoring any values requires regular data collection to examine trends over time. With the exception of commercial catch data, and more recently customary catch data, changes in fisheries values beyond eels and flounder have not been regularly monitored in the lake. Therefore changes to native fish values are difficult to report on at present because of a lack of data. However, data limitations has not stopped a number of management initiatives that were targeted at improving conditions for native fish (and other wildlife). For example, the use of set nets has long been prohibited around the mouths of major lake tributaries affording some protection to fish moving between the lake and tributaries and more recently, a large section at the eastern end of the lake has been gazetted as a customary fishing area (Horomaka kōhanga) from which commercial fishers are excluded. As expanded on below, the National Water Conservation (Te Waihora/Lake Ellesmere) Order (WCO) now allows for the lake to be opened at certain times of the year specifically for fish movement into and out of the lake.
Lake level management Lake levels are intensively managed, but only recently has there been specific provisions made through amendments to the WCO, allowing for the lake to be opened for fish migrations. The lake can be opened manually during April 1 to June 15, and between 15 September and 15 October and at any level. These opening periods are likely to be restricted by lake height because levels less than 0.9 m are unlikely to generate successful openings because of the amount of water is too low to generate a large enough cut through the bar. Timing of fish recruitment has been a focus of fisheries research since 2013. Research has tended to focus on the two eel species (tuna) and three flounder species (pātiki) because they are of greatest interest to both customary and commercial fishers, although there are several other species of fish that recruit into the lake. There is a mullet fishery that is reliant on recruitment from the ocean; also the recruitment timing of prey fish species (common bullies and smelt) that eels and flounder eat is important to maintain if we are to have a sustainable fishery resource in Te Waihora.
Generally, most fish recruitment into Te Waihora occurs from July-December, but there are three key times (Figure 7.4). It is likely that three openings would allow most of the fish migrations to be completed. These would be:
● Opening 1: Lake opening of ≥9 days between 15 April to 31 May to let adult eels and flounder out to sea
● Opening 2: Lake opening >20 days between 1 July to 31 August to allow the recruitment of common bully, common smelt and torrentfish. As common bully are the main prey fish species for the growth of the key mahinga kai species, it is important that they can gain access into the lake.
● Opening 3: Lake opening >25 days between 15 September to 15 November This opening partially encompasses the timing of longfin eel recruitment, all of the shortfin eel recruitment and the majority of the recruitment period for black, yellowbelly and sand flounder.
There is a possibility that some extended lake openings could have a negative effect if they reduce the lake to a low level (e.g., 0.6 m) that then continues throughout spring and summer as was the case over 2014–2015. However, the effect of low summer lake levels on fish populations in Te Waihora has not been investigated to assess its potential impact. Low lake levels have, however, already been shown to reduce chironomid (midge fly) abundance which is the primary food source for common bullies and juvenile eels. The reduction of common bullies as a result of decreased chironomid density could then impact on eels because bullies are the primary food source of this predator.
Summary What is the data telling us? An upward trend in diversity of native fish populations
No change
An upward trend in the abundance of native fish populations
Data deficient
Commercial fisheries quotas being sustained in the lake
No change
Viable populations of key mahinga kai species maintained
Habitat for key ‘threatened and at risk’ species increased and maintained
Data deficient
Pest species significantly impact native fish or lake habitat
Data deficient
Fish barriers removed or negative effects mitigated
No change
*although assessments of fish barriers have been undertaken in some lake tributaries.
Figure 7.4: Calendar of fish recruitment into Te Waihora. Solid lines indicate the timing of recruitment identified from the 2017 study and dotted lines indicate the timing period identified by a previous study in 2012. The main recruitment periods are depicted with a black rectangle for the species for which there were sufficient data. Current opening periods are the times identified in the Water Conservation Order.
Dr. Phil Jellyman (left) and Dr. Shannan Crow (right) examining the abundance of shortfin eels during sampling in Te Waihora (Lake Ellesmere). Photograph by Dave Allen.
31

Recommendations for future workWhile fishes occupying the lake have been the focus of recent research there are many tributaries that flow into the lake and the importance of these areas as habitat and for fish migrations are poorly understood. It is likely that tributaries provide key functions for different species and life stages of fish although the role that tributaries play may vary markedly depending on environmental conditions. For example, tributaries may be the key spawning grounds for species that cannot find adequate spawning habitat in the lake (although many of the species will spawn at sea), may provide temperature refuge at times when the lake temperature is particularly high and are critical habitat for longfin eels. At present we do not know the extent of spawning in tributaries for key prey fish species such as common bully or whether fish species that spawn in the lake are limited by the availability of spawning habitat. With an improved understanding of how to manage lake openings for key cultural and commercial species, and the option to open the lake specifically to enhance fish recruitment during certain times of the year (15 September to 15 October), there is the potential for increased numbers of small fish to be in the lake – regardless of whether they are sourced from tributaries or the sea. However, for additional recruits to result in the enhancement of eel and flounder fisheries in the lake there also needs to be of sufficient resources to support more of these fish (e.g., habitat and food). It is not currently known whether recruitment is limiting these fish populations or whether there are sufficient prey resources available to increase the abundance of eel and flounder species. Future work could also examine the effects of extended low summer lake levels on fish communities. Specifically work could focus on the loss of lake margin habitat and high water temperatures.
References/useful linksBeentjes M.P., Dunn A. (2014) Catch per unit effort (CPUE) analyses and characterisation of Te Waihora commercial freshwater eel fishery, 1990-21 to 2011-12. New Zealand Fisheries Assessment Report 2014/17 50 p.
Crow, S.K., Bonnett, M.L. (2013) Te Waihora Mahinga Kai: a compilation of data and summary of existing research on freshwater fishes in Te Waihora. NIWA Client Report, CHC2013-097. 61 p.
Crow S.K., Jellyman P.G. 2017. Variation in mahinga kai growth rates and catch from Te Waihora. NIWA Client Report CHC2017 98 p.
Jellyman, D.J. (2012) Fish recruitment into Te Waihora/Lake Ellesmere. A consideration of the requirements of key species. NIWA Client Report, CHC2011-094. 75 p.
Jellyman, D.J., Smith, C. (2008) Native Fish and Fisheries of Te Waihora. In: K.F.D. Hughey, K.J.W. Taylor (Eds.). Te Waihora/Lake Ellesmere – the 2007 State of the Lake and Management Futures Report. 41-48.
Jellyman, P.G., Crow, S.K. (2015) Identifying the factors limiting mahinga kai recruitment. NIWA Client Report, CHC2015-078. 84 p.
Jellyman P.G., Crow S.K., Dines L. 2017. Managing mahinga kai prey: variation in common bully abundance and spawning habitat availability in Te Waihora. NIWA Client Report CHC2017-089 32 p.
Jellyman P.G., Crow S.K., Sinton A.M.R. 2017. Examining the abundance and movement of tuna (Anguilla australis) in the Horomaka kohanga, Te Waihora (Lake Ellesmere). NIWA Client Report CHC2017-095 59 p.
Kelly, D.J., Jellyman, D.J. (2007) Changes in trophic linkages to shortfin eels (Anguilla australis) since collapse of submerged macrophytes in Lake Ellesmere, New Zealand. Hydrobiologia 579: 161-173.
Singleton, G. (2007) Ellesmere. The jewel in the Canterbury Crown. Selwyn District Council. 498 p.
Whakaora Te Waihora website http://tewaihora.org/
Fish RecruitmentFish recruitment monitoring work by NIWA from 2013-2015 has shown that fish recruitment can occur during periods of lake-outlet closure confirming the observations of Ngāi Tahu fishers about mahinga kai species entering the lake by moving over the gravel bar during southerly/south-westerly storms. Overtopping events require limited energy to be expended by fish to get into the lake since they are transported passively by wave energy and results suggest that this method is highly likely to be facilitating the recruitment of longfin eel, shortfin eel, torrentfish, yellowbelly flounder and sand flounder into the lake. Common smelt and common bullies may also enter the lake during overtopping events although this could not be confirmed by the NIWA study because these species are likely to contain both lake-reared recruits and ocean recruits and they cannot be told apart from simple observations. It should be noted that the contribution of overtopping events to recruitment will largely be dependent on barrier height. For example, south-westerly storms that occur within a couple of weeks of lake closure while the outlet is low, should result in much larger seawater inflows (and thus fish recruitment) into the lake, compared to when the beach barrier has built to a sufficient height to keep most south-west storm waves out. Given the multiple overtopping events that occurred during the NIWA study, it was estimated that these events may have contributed between 5-12% of the fish recruitment during their study.
Significant amounts of sea water overtop the gravel bar at the closed outlet of Te Waihora (16 September 2013).
32

How will we know when we have achieved success?
Sustainable water use supports economic development and lake/water related tourism opportunities increase.
EconomyTe Waihora/Lake Ellesmere – State of the Lake 2017Lead author: Murray Washington – Selwyn District Council
Eco
nom
y
Section 8
Econ
omy
ContextA large proportion of the Selwyn District, including all of the more intensively farmed and urban residential areas, lies within the catchment of Te Waihora / Lake Ellesmere. Economic activity remains buoyant, but whilst a growing economy brings significant benefits, it also increases pressure on the environment including on the state of the Lake.
The 2013 State of the Lake report introduced a number of economic indicators, to gauge changes to the Selwyn District economy that may effect in some way changes to the state of the lake. Some of these indicators are proxy measures of pressures on the lake from economic activity (eg population, total cow numbers, irrigated area). Others measure economic benefits derived from the lake and environs (eg recreation, fishing). For this report, proxy measures for economic pressures and benefits are reported. From the 2013 report indicator data, supporting information provides a fuller picture of the Selwyn District Council economic state.
Over time, tracking and reporting on water use will be used to enable water quantity and water quality indicators to be prepared for both ground water and surface water use. In time a clear picture will emerge as to whether legislation changes (Selwyn Waihora variation to Land and Water plan, Clean Waters,
NPS Freshwater Management) have impacted on economic development. In future GDP for Selwyn District compared to environment expenditure on the lake and tributaries (public and private) could be used to report restoration efforts as a proportion of economic development.
State of the EconomyThe economic indicators (Table 8.1) confirm continuing economic activity in Selwyn District. Different factors contributing to this include population increase and continued building activity which was initially related to residential relocation (from 2011 Canterbury Earthquakes) but is now sustained by industrial and commercial shift to the South/West sector of Greater Christchurch. This is complemented by a steady increase in farming productivity, including dairying, which will be maintained by ongoing irrigation investment.
Building construction has been maintained at historically high levels in both residential and non-residential building sectors.
The median house price value in Selwyn has increased approximately 15% since 2013.
Retail spending in Selwyn has also increased to $7.5m (up 7%) over the year to March 2017, affirming the economic strength of the district.
UNEMPLOYMENT
NEW ZEALAND 5%CANTERBURY REGION 3.9%SELWYN DISTRICT 2.3%
year to June 2017
2015:
52,7202017:
59,300
POPULATION STATISTICS FOR SELWYN
Selwyn’s population is projected to reach 80,000 by 2031
Jobseeker Support recipients to June 2017 increased by 14% compared to previous year.
ARRIVALS
International net migration
gain of
845
since 2015
Non-residential consents
2014 296
2016 260
$114,938, 581
$132,663,999
HOUSE PRICES
2015
$519,950 2017
$544,099
TOTAL COWS2014/15
160,9952015/16
167,718
GUEST NIGHTS
2015 87,282 guests
2017 82,994 guests
Residential consents
2014 2516
2016 2348
$530,946,839
$468,551,700
CONSENTS
GDPGDP in Selwyn was up 7.6% for the year to June 2017 compared to 4.2% in the previous year.
New Zealand had a 2.8% growth.2017
$1,957 M
2015
$1,745 M
33

Table 8.2: Selwyn District irrigated area (ha) estimates 2012 and 2015
Surface Spray Drip/micro Total
2012 6,913 79,237 995 87,256
2015 1,286 97,676 316 99,278Source: Statistics NZ 2012; Environment Canterbury 2017
The difference between 2012 and 2015 will be mainly due to new irrigation that has occured since June 2012.
The provisional GDP estimates show that Selwyn economy grew by 3.6% to March 2016 year, whilst New Zealand’s economy grew by 2.5% over the same period. Projections by Statistics New Zealand suggest that there will be approximately 16,157 more people in Selwyn by 2025 which is likely to create 6,231 households in the district.
Selwyn’s annual population growth has been the highest in the country over the past decade and at 6.6% in 2016/17 was second only to Queenstown Lakes.
With the ongoing increase in business activity, the district’s unemployment rate was steady at 2.3% to June 2017. This is effectively close to full employment. Selwyn District information reveals a significant increase in the population of Selwyn residents working within the District, as opposed to commuting to Christchurch.
Manufacturing was the top employer in 2015 followed by Construction, Agriculture, Health and Education. MBIE 2017 results have not been published for the 2017 quarter. With the increase in personnel at Burnham Army Camp, there will be an increase in Central Government, Defence and Safety sector.
Stage 1 of the Central Plains Water (CPW) Scheme was commissioned in late 2015 and is irrigating approximately 23,565ha. Stage 2 and the Sheffield Scheme Construction is underway and will likely be completed in 2018.
When the Central Plains Water Limited Scheme is fully operational (48,000ha), there will be significant ongoing economic benefits to Canterbury’s annual direct and indirect regional agricultural output with an expected increase of $264m per annum. Direct plus indirect employment from the scheme is estimated to increase by 849 jobs, including expansion in farm output and further jobs will come from processing, transport and related off-farm activity.
The construction phase alone is expected to generate 700 jobs and 1777 indirect jobs and generate $325m in direct benefits and $368m in indirect benefits.
The number of dairy cows in Selwyn has plateaued. However, the completion of CPW and a strengthening of dairy prices in 2017 could result in an increase in overall dairy numbers. This may be off-set by the ability of farms to live within the new nitrogen limits.
Tourism has a moderate role within Selwyn District and is based around travelers through the district to more recognized tourist areas and the “Sensational Six” Selwyn ski areas. Total guest nights have decreased by 5% since 2015 and the reasons are unclear. However, it could be people staying in non-traditional accommodation such as Airbnb. The Regional Tourism Index for both international and domestic travellers for Selwyn has continued to improve since 2015.
PressuresSelwyn’s sustained population increase as noted is the fastest in New Zealand and is matched by being one of the strongest economies. It continues to be unlikely that pressure on the lake and environs from economic activity has lessened since 2013.
The population increase, industrial and commercial activity and irrigable land increases, indicate ongoing land use intensification (urban and rural) will mean greater demand for efficient use of water and increased waste water and stormwater discharges.
Table 8.1: Economic indicators for Selwyn District
Economic indicators 2015 2016 2017 % change between years noted
Source
Population Statistics for Selwyn 52,720 56,200 59,300 + 12.5% from 2015 + 5.5% from 2016 Statistics
Arrivals 208 367 478 Infometics
GDP $1,745m $1,819m $1,957m +1.1% Infometrics
House prices $519,950 $533,546 $544,099 + 4.6% from 2015+ 2% from 2016 Quotable Value
No. Dwellings 23,882 SDC
Unemployment (Canterbury) 2.0% 2.0% 2.3% Infometics
Employment by Industry:ManufacturingConstruction ServicesAgriculture, Forestry, FishingEducation & TrainingHealth Care & Social Assistance
36623536293223162437
MBIEMBIEMBIEMBIEMBIE
Guest Nights 87,282 94,616 82,994 - 5% from 2015- 12% from 2016 Infometrics
Retail Spend (2013/2014)160,955
(2015/2016) $6.9m $7.5m + 7% from 2016 Infometrics
Total cows 160,955 167,718 + average 4.5% LIC NZ Dairy Statistics
Dairy payout $291m $270m decrease LIC NZ Dairy Statistics
SDC Operating Expenditure $85.1m $86.9m + 2.1% from 2015 SDC
34
ResponsesThe Canterbury Land and Water Regional Plan (now operative) sets regional wide environmental limits with an aim help deliver community aspirations for water quality in both urban and rural areas.
This is supplemented by Plan Change 1 – Selwyn Waihora which included Farm Environment Plan requirements, and established the Cultural Land Values Management Area (adjacent to Te Waihora). Further changes have been instigated through Omnibus Plan 4: Mahinga Kai habitats, braided river protection, stormwater quality and drinking water supplies and the proposed variation 5 nutrient Management.
The combination of these plan changes is to ensure better management of farming practices and improve all discharges into the catchment. There is ongoing monitoring of both CPW and Council discharges to assess impacts on water quality and nutrient levels in the catchment. Farm Environment Plans (FEP) are now steadily being prepared and approved.
FEPs will help reduce pressure on the lake from primary production by addressing environmental pressures on farm and assuring good management practices are put in place.
Selwyn District Council (SDC) through its 2031 Strategy aims to promote tourism and recreation. The Selwyn District Council’s “Newcomers and Migrants” Strategy will provide some information to promote recreation opportunities around the lake.
Increased urban development requires provision for stormwater and waste water. SDC have completed the Lincoln stormwater wetland to service new developments in that area and are actively gaining global stormwater consents to improve all aspects of stormwater management. This is often represented by use of swales, wetlands and native planting. This is supplemented by similar work on its land drainage schemes that discharge into the lake.
The Eastern Selwyn Sewerage Scheme became operational in 2013 and is currently being upgraded due to increased demand. It services all of the major growth areas (West Melton, Rolleston, Lincoln and Prebbleton). This and a proposed upgrade to the Ellesmere Sewerage Treatment Plant at Leeston will ensure effluent is well managed.
SDC have implemented a Water Demand Management Plan which incorporates aggressive strategies to reduce peak demand. All Selwyn community supplies will be fully metered (and volumetric usage charged) by mid 2018.
Lake Level ManagementWith two exceptions, there has been little influence from the Lake level management regime on economic activities which may affect the state of the lake. Effects of lake level on land use as a result of flooding are separate and the result of extreme weather events rather than lake level management itself. Despite adverse conditions, the lake opening to relieve the July 2017 Selwyn River flood event was carried out in exemplary fashion.
The two exceptions are commercial fisheries and aquatic recreation. The lake openings are beneficial for commercial fisheries as they facilitate fish passage and contribute to recruitment and healthy fish stocks.
The impact of prolonged, summer low lake levels is likely to be negative as it impacts on water sports and general recreation. There are no data to quantify aquatic recreation impacts.
SummaryWhilst the economic indicators point to increased pressures on the lake, it is too early to measure the effect of intensification in land use, balanced by new land and water regional plan rules, on the state of the lake. Similarly, there are no direct measures on what effect the continued urban – residential expansion is having on the tributaries to the lake and the lake itself, or the state of the environment in the wider catchment.
Given the current state of the lake, it may be prudent to suggest that current activities are relatively neutral and that improvements to lake quality will take ongoing aggressive actions.
RecommendationsIn the future, reporting on farm environment plans and reporting on overall water use will allow calculation of composite economic indicators such as expenditure on environmental protection, associated with the lake, GDP compared to water use and water quality changes.
Those indicators may more clearly show whether human induced pressures from production and consumption have lessened.
Consistent with the integrated monitoring strategy, economic indicators focused on the pressures from, and benefits of economic activity, should be measured at a sub district scale.
Economic development is decoupled from water quality – the health of the lake and its tributaries have improved and economic activity in Selwyn is buoyant.
35

ContextBoth historically (from at least the 1880s), and in contemporary times, Te Waihora/Lake Ellesmere has provided for a wide range of water-based recreation activities, e.g., trout angling, waterfowl hunting, whitebaiting, powerboating, windsurfing, rowing, kayaking and swimming. Land based activities within the lake’s environs include cycling, picnicking, bird watching and walking. Apart from waterfowl hunting and trout angling, and more recently biking on the Little River Rail Trail, there are little data on numbers of recreational users on or around the lake, or on the quality of their experiences. The most recent and ‘definitive’ work on recreation has been undertaken by Espiner et al. (2017), although a lot of their ‘hard’ use data is sourced from previous Living Lake Symposium findings (i.e., they did not generate their own survey data). Their report, however, is extremely valuable in terms of identifying details of current site characteristics including facilities, and identifying opportunities for future growth of recreation.
Other than for the Rail Trail and trout fishing, there were no post 2013 data available to report on the state of recreation at the lake. Data from Fish and Game North Canterbury about waterfowl hunter numbers were unavailable. The lack of data in general makes reporting on the types and levels of recreation and quality of experience difficult. Consequently, much of what is presented here is based on the limited published material and anecdotal information used for reporting in 2013, complemented by similar work reported in Espiner et al. (2017).
State of recreation activitiesThere are two major indicators of the state of recreation – level of use and quality of experience. Quantitative data are lacking for both indicators. The information in Table 9.1 is based on that reported in 2013 and 2015 with acknowledged updates where available. In relation to angling Espiner et al. (2017: 33) note: “Angling days were recorded at the Halswell River (65% decrease since 2007/8), the Selwyn River (692% increase from 2007/8), Harts Creek (half of 2007/8) and on Lake Ellesmere (up by 217 % since 2007/8). Overall this is an average increase from 2,100 angler days in 2007/8 for these rivers to 7,000 angler days in 2014/15. Why this increase has occurred is unknown.
Table 9.1: Estimated levels of use for recreational activities at Te Waihora/Lake Ellesmere
ActivityHighest historic levels of use
– recreation user days per annum
Estimated level of use 20171 – recreation
use days (range)
Trout angling2 100,000 – probably in the 1960s
70003
Cycling on Rail Trail
6000-7000 – contemporary activity
7000 (2016 data)
Waterfowl hunting 5000-10000 – probably much more activity before habitat loss
4000-6000
Boating, including windsurfing
10000-20000 – huge regattas held in 20s through to 40s
1500-3000
Bird watching 1000 – 1980s onward 500-1500
Other – whitebaiting, walking, picnickingother (e.g., eeling, floundering, photography, 4WDriving camping at Lakeside and geocaching)
10000-20000 – likely to have been very large numbers in 1920s through to early 1960s, especially picnickers
0-20001000-50001000-50001000-2000
Total Lower range Mid range Upper range
132,000145,000158,000
23,00030,75038,500
Source: Based on: Recreation: A Background Paper Contributing to the Te Waihora/Lake Ellesmere: State of the Lake 2013 Technical Report No. 1. Kenneth F. D. Hughey, (Lincoln University/Waihora Ellesmere Trust)
How will we know when we have achieved success?Compatible recreation needs are provided for, including a high quality environment, good access, and water quality and habitat in which wildlife,
including sports fisheries, can thrive.
RecreationTe Waihora/Lake Ellesmere – State of the Lake 2017Lead author: Kenneth FD Hughey, Waihora Ellesmere Trust/Lincoln University
Section 9
1 Apart from cycling and trout angling, the data are the same as for 2013 – there is no reason to change any of these estimates.
2 Data includes all tributaries, e.g., Hororata and upper Selwyn rivers.
3 Espiner, S., Stewart, E., and Lizamore, C. (2017). Recreation demand study: Te Waihora/Lake Ellesmere. Lincoln University, New Zealand.
Recr
eatio
n
Lakeside Domain
36

Pressures (and driving forces) on recreation activities and management responsesThere are a range of pressures which affect the quality of recreational activities in and around the lake which, in turn, impact on the numbers of people using the lake. Most pressures on recreation therefore relate to quality parameters for an activity – management responses relate to the quality of experience. Table 9.2 outlines this relationship between pressure and response for recreational activities at the lake.
Lake level managementThe spring openings may benefit the whitebait fishery. However a long time whitebaiter observed that an early opening did not bring large numbers of whitebait. Numbers increased with warmer temperatures later in the session – late October to early November (Terry Lasson, pers. Comm 2017).
In terms of boating, the prolonged summer openings will have been detrimental but there are no ‘hard’ data to support this; more likely boaters go to other locations (e.g., Lake Crichton) (Espiner et al. 2017). From a waterfowl hunting perspective, Fish and Game North Canterbury report that it is the weather that determines hunting activity on the lake more so than lake levels - hunters prefer rough weather that causes wave action and keeps the birds off the water and airborne (Steve Terry, pers. comm. 2016, cited in Espiner et al. 2017).
Table 9.2: Pressures and responses for recreational activities at Te Waihora/Lake Ellesmere
Activity Pressures (and Driving Forces, where identifiable) Responses
Trout angling • Decline in fish numbers (bycatch, reduction in spawning trout numbers, lack of good spawning habitat)
• Poor water quality (agricultural intensification)
• Managed access points – available for angling around the lake • Advocacy programmes – Fish and Game advocate for improved
quality and quantity of water in the tributaries of the lake to support improved angling experience
• LWRP and Canterbury Water Management Strategy efforts to improve water quantity and quality (see Land and Water sections)
Cycling on the Christchurch to Little River Rail Trail
• Access/facilities: There is now a defined ‘route’ for cyclists all the way from Christchurch to Little River (see: http://www.littlerivertrail.kiwi.nz/gallery/little%20river%20cycle%20trail-mobile.pdf) – albeit that some of it is still on roads. Wind and lake flies can be annoying to cyclists (natural events, poor water quality)
• The trail is progressively being linked to others so that there is a continuous largely off-road connection to Christchurch
Waterfowl hunting • Conflicting values: Bird watching (Government change to status of Canada goose meaning year round hunting allowed); 4-wheel drive access to hunting sites (vehicle impacts on native vegetation)
• Water quality - Toxic algae presence: Perceived very seriously by duck hunters especially those using dogs
• Access points/visitor facilities: Some duck hunters concerned about lack of access to some parts of the lake sure (impact on native vegetation); Signage in poor condition (Resources) - causes confusion
• None, from a hunters’ perspective • From other perspectives: plan rules restricting off road driving;
DOC signage, management of maimai and the funding from the maimai fees is used for work around the lake margin; lake opening protocol group that may consider timing in relation to duck shooting season (if there is a F&G comment)
• LWRP and CWMS efforts to improve water quality
Boating, including windsurfing
• Water levels: Conditions for boating are least favourable when the lake is open to the sea for an extended period of time and the lake ‘bottoms out’ (management regime)
• Water quality: Algal blooms (especially since 2014 potentially toxic cyanobacteria), occasional bad smell, poor water clarity (agricultural intensification)
• Access/facilities: Lack of launching sites for kayakers and rowers on rivers like the LII (Lack of planning)
• LWRP and CWMS efforts to improve water quality • Public health warning for the lake ongoing since February 2014
Bird watching • Conflicting values: Hunting scares birds and bird watchers (Government change of status for Canada goose means hunting year-round); Off road driving
• Lake level: not being managed in a way that is always appropriate for migratory wading birds (management regime)
• Lake level management: WCO seeks to manage lake levels in a way that meets native bird habitat needs, but also has to manage for fish and native vegetation
Whitebaiting • Timing of lake opening: When lake openings do not occur at the right time there is effectively no whitebait run - it appears October-November is the best time (management regime)
• Management action: A spring lake opening provided for (WCO) and so lake likely to be open more often during the whitebait season
Land-based informal recreation including walking, dog walking, picnicking
• Access: Limited lake access points with car parking • Information: Limited information available for visitors, particularly
on site
• Interpretation panels: A set of information panels was installed in late 2014 at key access points around the lake (Ngāi Tahu/DOC)
• Lake Access Brochure: produced by WET and reprinted in 2014, provides information about access points and permitted activities
37

Conclusions and RecommendationsTe Waihora/Lake Ellesmere remains an important recreational resource for Canterbury and, for bird watching, the lake is of national significance. However, most recreational activities declined in use through to the 1970s/80s and have remained roughly static since – the main exception being the increase in cycling on the Rail Trail, and more recently trout angling.
Because there is so little information about trends in numbers of recreational users and the quality of their experience, the following data should be collected to provide an evidence base for more effective management:
● User days per annum statistics for the main activities – trout angling, waterfowl hunting, whitebaiting, cycling, bird watching, walking and picnicking, perhaps undertaken on a bi- or triennial basis
● Quality of experience measures – size and number of trout, number of waterfowl, access and other visitor-related facilities and provisions (including improved signage, walkways, boat ramps), water level and quality. Perceptions of quality can be gauged during the user days surveys
The formation of an ‘expert panel’ of lake recreationists to help monitor, report and advise on both the quality of experience and on user levels should also be considered as a way of helping progress these ideas.
With lake management interventions underway (e.g., to improve water quality, increase environmental flows in some rivers, enhance riparian management, and restore macrophyte beds) it will be important to understand what influence these interventions have on the quality of recreation activity experience and the levels of use, i.e., how the state of the lake affects recreation at the lake. In this context the opportunities and recommendations made by Espiner et al. (2017) warrant full consideration. They made two main recommendations in this context, noting they remain unresolved since 2013, namely (see page 95):
1. “A detailed user survey or qualitative study of Te Waihora/Lake Ellesmere recreationists in order to comprehensively document use, attitudes, motivations and existing recreation setting substitutes.
2. A comprehensive community recreation survey assessing latent (or unrealised) recreation demand in the areas surrounding Te Waihora/Lake Ellesmere”.
Other issues remaining unresolved since 2013 and 2015:
1. There are conflicts between some recreation groups, e.g., Canada goose hunters and the needs of bird watchers and of the birds themselves – a facilitated discussion forum is required to clarify and attempt to resolve these issues.
2. Vehicle access and associated damage to sensitive and important native plant communities is still an issue, especially in places like Greenpark Sands.
3. There is a general lack of information about recreational opportunities and how to manage them, including the need for a visitor/research centre – these issues are referred to, with suggestions and recommendations (see pp 80-94) in Espiner et al. (2017) and require resolution.
SummaryThe state of recreation is much reduced across almost all categories compared to the levels of use in the 1970s and earlier. The reasons for this reduction are varied and include water quality issues, which may have contributed to declining trout fishing opportunities and to a reduction in numbers participating in any activities involving contact with water. Ongoing pressures on recreational activities at Te Waihora/lake Ellesmere persist and responses to date have not fully addressed these.
Recreational user survey results show increased level of use
Recreational user survey results show increasing quality of experience*
*Quality includes measures of visitor facility provision, ease of access, signage/information availability, fish and game catch limits, water quality and lake level.
ReferencesEspiner, S., Stewart, E., and Lizamore, C. (2017). Recreation demand study: Te Waihora/Lake Ellesmere. Lincoln University, New Zealand.
38
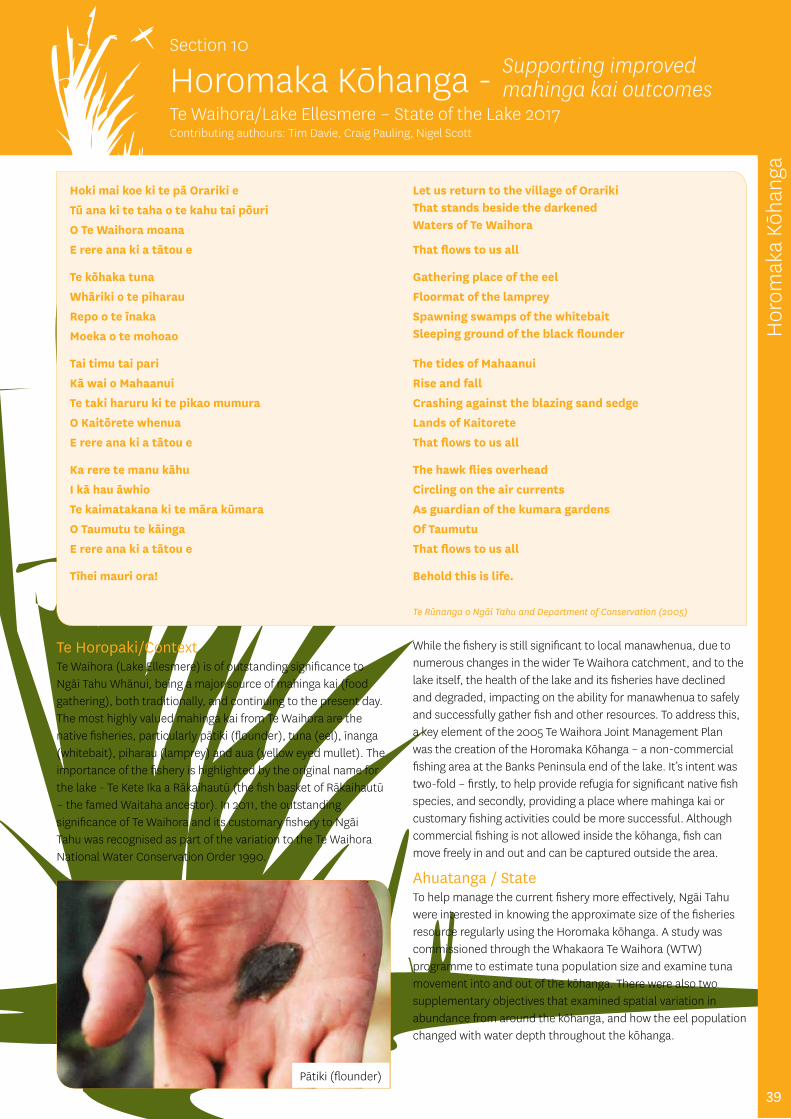
Horomaka Kōhanga -Te Waihora/Lake Ellesmere – State of the Lake 2017Contributing authours: Tim Davie, Craig Pauling, Nigel Scott
Hor
omak
a Kō
hang
a
Te Horopaki/ContextTe Waihora (Lake Ellesmere) is of outstanding significance to Ngāi Tahu Whānui, being a major source of mahinga kai (food gathering), both traditionally, and continuing to the present day. The most highly valued mahinga kai from Te Waihora are the native fisheries, particularly pātiki (flounder), tuna (eel), īnanga (whitebait), piharau (lamprey) and aua (yellow eyed mullet). The importance of the fishery is highlighted by the original name for the lake - Te Kete Ika a Rākaihautū (the fish basket of Rākaihautū – the famed Waitaha ancestor). In 2011, the outstanding significance of Te Waihora and its customary fishery to Ngāi Tahu was recognised as part of the variation to the Te Waihora National Water Conservation Order 1990.
While the fishery is still significant to local manawhenua, due to numerous changes in the wider Te Waihora catchment, and to the lake itself, the health of the lake and its fisheries have declined and degraded, impacting on the ability for manawhenua to safely and successfully gather fish and other resources. To address this, a key element of the 2005 Te Waihora Joint Management Plan was the creation of the Horomaka Kōhanga – a non-commercial fishing area at the Banks Peninsula end of the lake. It’s intent was two-fold – firstly, to help provide refugia for significant native fish species, and secondly, providing a place where mahinga kai or customary fishing activities could be more successful. Although commercial fishing is not allowed inside the kōhanga, fish can move freely in and out and can be captured outside the area.
Ahuatanga / StateTo help manage the current fishery more effectively, Ngāi Tahu were interested in knowing the approximate size of the fisheries resource regularly using the Horomaka kōhanga. A study was commissioned through the Whakaora Te Waihora (WTW) programme to estimate tuna population size and examine tuna movement into and out of the kōhanga. There were also two supplementary objectives that examined spatial variation in abundance from around the kōhanga, and how the eel population changed with water depth throughout the kōhanga.
Section 10Supporting improved mahinga kai outcomes
Hoki mai koe ki te pā Orariki e Let us return to the village of Orariki That stands beside the darkened Waters of Te Waihora
Tū ana ki te taha o te kahu tai pōuri
O Te Waihora moana
E rere ana ki a tātou e That flows to us all
Te kōhaka tuna Gathering place of the eel
Whāriki o te piharau Floormat of the lamprey
Repo o te īnaka Spawning swamps of the whitebait Sleeping ground of the black flounder Moeka o te mohoao
Tai timu tai pari The tides of Mahaanui
Kā wai o Mahaanui Rise and fall
Te taki haruru ki te pikao mumura Crashing against the blazing sand sedge
O Kaitōrete whenua Lands of Kaitorete
E rere ana ki a tātou e That flows to us all
Ka rere te manu kāhu The hawk flies overhead
I kā hau āwhio Circling on the air currents
Te kaimatakana ki te māra kūmara As guardian of the kumara gardens
O Taumutu te kāinga Of Taumutu
E rere ana ki a tātou e That flows to us all
Tīhei mauri ora! Behold this is life.
Pātiki (flounder)
Te Rūnanga o Ngāi Tahu and Department of Conservation (2005)
39

Whakautu / ResponseA mark-recapture study was used to examine shortfin eel movement and abundance in the eastern part of Te Waihora from October 2015 to April 2016, primarily focussed within the Horomaka kōhanga area. The study was conducted during a period of very stable lake levels (average lake level 0.75m), with no lake opening events. Fyke nets were used to catch eels and 4,071 eels sized ≥400mm were tagged from late October to mid-December.
Eel catches, measured as catch-per-unit-effort (CPUE), increased significantly over the seven-week tagging period as the water temperature became warmer; CPUE in December was more than double what it had been in late-October at the start of tagging work. Compared to a survey conducted by NIWA in 1995 before the Horomaka kōhanga was established, eel numbers and biomass have more than doubled which is consistent with the rest of the lake.
Within the Horomaka kōhanga large shortfin eels (>600mm) are most abundant in shallower waters (<1m depth) while smaller eels tended to dominate catches in the deeper water. A combination of declining CPUE abundance and eel length with increasing lake depth resulted in CPUE weight (kg/net/night) declining ten-fold over the range of depths sampled (0.4 to 2.2m).
Shortfin eel population size was estimated in mid-December 2015 based on a randomised recapture methodology using fyke nets set throughout the kōhanga. The population size (±S.E.) of shortfin eels ≥400mm in the Horomaka kōhanga was estimated to be 75,161 (± 9,501). Since shortfin eel tag retention was 99.5%, no adjustment for tag loss was made in the estimate of population size. Based on the population size estimate and length-frequency data, it is estimated that the weight of shortfin eels >400mm in the Horomaka kōhanga is 29.09 tonnes (± 3.67 tonnes).
Tuna movement was examined using data from the recapture of 207 tagged eels by NIWA and a further 211 tagged eels caught by commercial fishers (analysis of commercial recaptures was limited because recapture location could only be assigned to a general area).
Nearly 40% of eels recaptured by NIWA were caught within 11–20 days of tagging although there were eels caught in April 2016 that had been at large for 140 days. NIWA recapture data showed 63% of tagged eels were recorded within 2000m of their release location although extensive movements were possible as one tagged eel captured by a commercial fisher showed the eel had moved over 20km to the outlet of the lake within 16 days (i.e., 1269m per day).
Eel movement out of the kōhanga was examined in March/April 2016 with 60 fyke nets set up to 5km either side of the Horomaka kōhanga boundary. There were 52 tagged eels recaptured during the survey and 83% (43 tagged eels) of the recaptures were within the Horomaka kōhanga. Whilst sampling effort was standardised inside and outside the kōhanga, 1651 shortfin eels were caught inside the kōhanga compared to 1196 eels outside; regardless of whether inside or outside the kōhanga two-thirds of the eels caught were 400mm or larger.
Whakarāpopoto / SummaryThe establishment of the Horomaka kōhanga has had a positive influence on the abundance of shortfin eels available for customary and recreational fisheries (i.e., nearly 30 tonnes of shortfin eels ≥400mm). The largest tuna were most common in the shallower parts of the kōhanga, which is also where the highest catch rates (i.e., CPUE) were found. These shallow near-shore areas with high catch rates are valuable to customary and recreational fishers, particularly for those who use customary catch methods, and/or, do not have access to a boat. Whilst 17% of the eels were estimated to be moving out of the Horomaka kōhanga during the four months of the tagging study, the customary eel resource located within the kōhanga will only decline if a similar percentage of eels do not move back into the area. A number of initiatives including consideration of lake level management and habitat enhancement, as well as continuation and extension of kōhanga/refugia areas for native fish are recommended to continue to support improved outcomes for customary fisheries.
Lake level management Under different lake conditions than accounted in the study (e.g., lower lake levels and warmer water temperatures), there could be a substantial reduction in near-shore habitat area within the Horomaka kōhanga. The reduced habitat could force eels to move or forage over a wider area, increasing their susceptibility to capture by commercial fishers. Future work undertaken during a time of lower lake levels would be needed to assess this and determine if the results from the single season movement survey are reflective of other years.
Habitat enhancement and future work Future habitat enhancement work may help encourage tuna to remain within the Horomaka kōhanga. The present study suggests that 17% of the eels within the Horomaka move out of the protection of the reserve within four months. Installing some permanent habitat structures in the reserve may encourage tuna to stay around these structures because they offer some cover that is not available in other areas of the lake. These structures may then encourage tuna to form more localised resident populations and potentially reduce movement out of the reserve. Research would need to be done into what structures would be the most beneficial to install and in what areas and habitat types (i.e., depths, substrate types).
Tuna (eel)
40

The location of the Horomaka kōhanga (established in 2005 by Method 7.1h of the Te Waihora Joint Management Plan) - an area of Te Waihora that is reserved for customary and recreational use. The rectangle in the upper panel indicates the area which is shown in more detail in the lower panel.
A further aspiration of manawhenua relates to continued work to improve lake water quality, and in particular clarity of near shore areas that can enhance customary catch methods such as patu tuna. Current conditions do not provide for this and create a barrier to safe and successful mahinga kai. Continuing the current work within the catchment to improve urban stormwater, farm runoff and land drainage inputs, including sediment and nutrients, as well as tributary quality, via on farm solutions, riparian protection and wetland development is welcomed.Consideration of large scale wetland development and lake edge buffering, as well as further in-lake macrophyte restoration and wave barrier development is also important. A dedicated and collaborative programme of mahinga kai monitoring, including understanding food gathering quantity and quality is another key aspiration, which could also contribute to future environmental reporting, including the State of the Lake Report.
Tohutoro / ReferencesJellyman P.G., Crow S.K.,Sinton A.M.R 2017. Examining the abundance and movement of tuna (Anguilla australis) in the Horomaka kōhanga, Te Waihora (Lake Ellesmere), NIWA Client Report CHC2017-095 59 p.
Te Rūnanga o Ngāi Tahu/Te Papa Atawhai (2005). Te Waihora Joint Management Plan – Mahere Tukutahi o Te Waihora. http://www.doc.govt.nz/about-us/our-policies-and-plans/statutory-plans/statutory-plan-publications/conservation-management-plans/te-waihora-joint-management-plan/
41
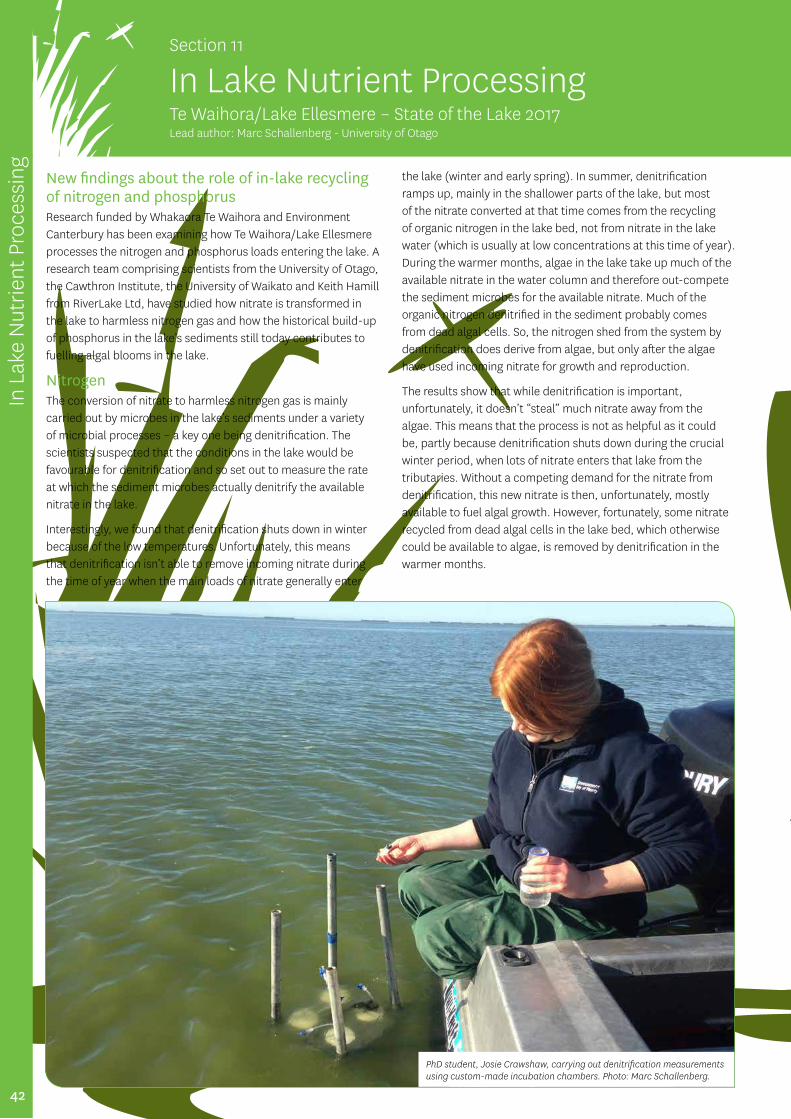
In Lake Nutrient ProcessingTe Waihora/Lake Ellesmere – State of the Lake 2017Lead author: Marc Schallenberg - University of Otago
Section 11
New findings about the role of in-lake recycling of nitrogen and phosphorusResearch funded by Whakaora Te Waihora and Environment Canterbury has been examining how Te Waihora/Lake Ellesmere processes the nitrogen and phosphorus loads entering the lake. A research team comprising scientists from the University of Otago, the Cawthron Institute, the University of Waikato and Keith Hamill from RiverLake Ltd, have studied how nitrate is transformed in the lake to harmless nitrogen gas and how the historical build-up of phosphorus in the lake’s sediments still today contributes to fuelling algal blooms in the lake.
Nitrogen The conversion of nitrate to harmless nitrogen gas is mainly carried out by microbes in the lake’s sediments under a variety of microbial processes – a key one being denitrification. The scientists suspected that the conditions in the lake would be favourable for denitrification and so set out to measure the rate at which the sediment microbes actually denitrify the available nitrate in the lake.
Interestingly, we found that denitrification shuts down in winter because of the low temperatures. Unfortunately, this means that denitrification isn’t able to remove incoming nitrate during the time of year when the main loads of nitrate generally enter
the lake (winter and early spring). In summer, denitrification ramps up, mainly in the shallower parts of the lake, but most of the nitrate converted at that time comes from the recycling of organic nitrogen in the lake bed, not from nitrate in the lake water (which is usually at low concentrations at this time of year). During the warmer months, algae in the lake take up much of the available nitrate in the water column and therefore out-compete the sediment microbes for the available nitrate. Much of the organic nitrogen denitrified in the sediment probably comes from dead algal cells. So, the nitrogen shed from the system by denitrification does derive from algae, but only after the algae have used incoming nitrate for growth and reproduction.
The results show that while denitrification is important, unfortunately, it doesn’t “steal” much nitrate away from the algae. This means that the process is not as helpful as it could be, partly because denitrification shuts down during the crucial winter period, when lots of nitrate enters that lake from the tributaries. Without a competing demand for the nitrate from denitrification, this new nitrate is then, unfortunately, mostly available to fuel algal growth. However, fortunately, some nitrate recycled from dead algal cells in the lake bed, which otherwise could be available to algae, is removed by denitrification in the warmer months.
In L
ake
Nut
rient
Pro
cess
ing
PhD student, Josie Crawshaw, carrying out denitrification measurements using custom-made incubation chambers. Photo: Marc Schallenberg.
42
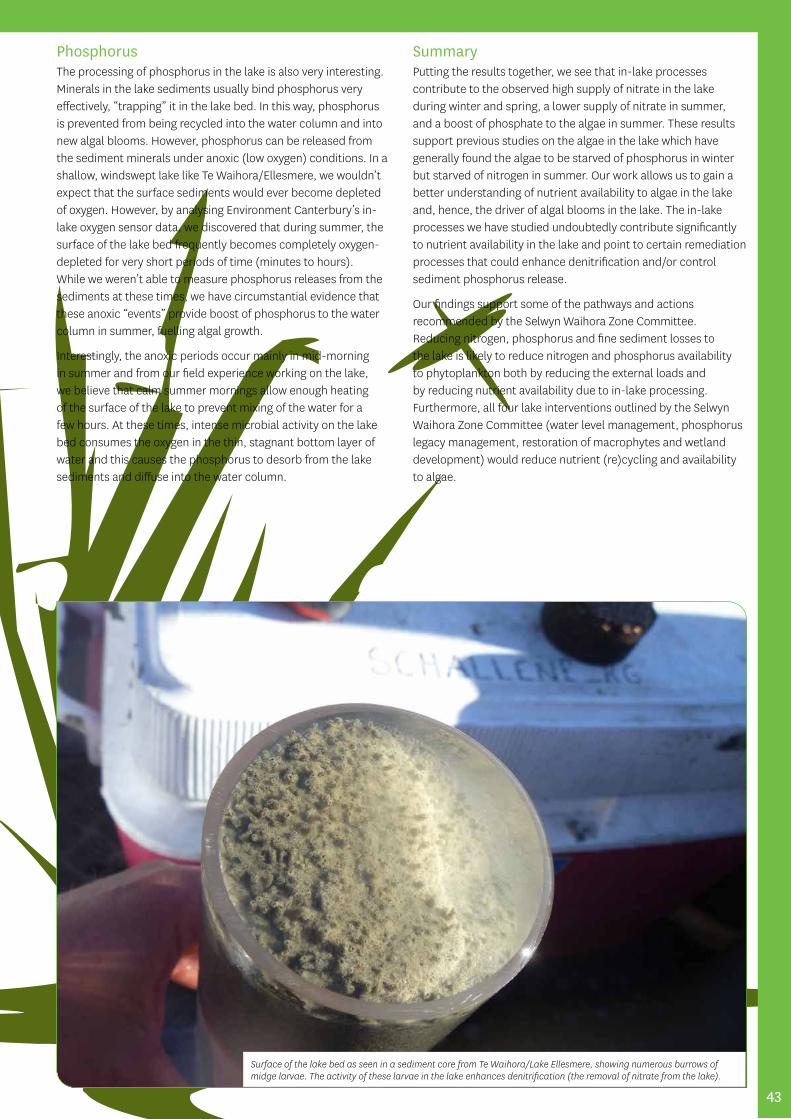
PhosphorusThe processing of phosphorus in the lake is also very interesting. Minerals in the lake sediments usually bind phosphorus very effectively, “trapping” it in the lake bed. In this way, phosphorus is prevented from being recycled into the water column and into new algal blooms. However, phosphorus can be released from the sediment minerals under anoxic (low oxygen) conditions. In a shallow, windswept lake like Te Waihora/Ellesmere, we wouldn’t expect that the surface sediments would ever become depleted of oxygen. However, by analysing Environment Canterbury’s in-lake oxygen sensor data, we discovered that during summer, the surface of the lake bed frequently becomes completely oxygen-depleted for very short periods of time (minutes to hours). While we weren’t able to measure phosphorus releases from the sediments at these times, we have circumstantial evidence that these anoxic “events” provide boost of phosphorus to the water column in summer, fuelling algal growth.
Interestingly, the anoxic periods occur mainly in mid-morning in summer and from our field experience working on the lake, we believe that calm summer mornings allow enough heating of the surface of the lake to prevent mixing of the water for a few hours. At these times, intense microbial activity on the lake bed consumes the oxygen in the thin, stagnant bottom layer of water and this causes the phosphorus to desorb from the lake sediments and diffuse into the water column.
SummaryPutting the results together, we see that in-lake processes contribute to the observed high supply of nitrate in the lake during winter and spring, a lower supply of nitrate in summer, and a boost of phosphate to the algae in summer. These results support previous studies on the algae in the lake which have generally found the algae to be starved of phosphorus in winter but starved of nitrogen in summer. Our work allows us to gain a better understanding of nutrient availability to algae in the lake and, hence, the driver of algal blooms in the lake. The in-lake processes we have studied undoubtedly contribute significantly to nutrient availability in the lake and point to certain remediation processes that could enhance denitrification and/or control sediment phosphorus release.
Our findings support some of the pathways and actions recommended by the Selwyn Waihora Zone Committee. Reducing nitrogen, phosphorus and fine sediment losses to the lake is likely to reduce nitrogen and phosphorus availability to phytoplankton both by reducing the external loads and by reducing nutrient availability due to in-lake processing. Furthermore, all four lake interventions outlined by the Selwyn Waihora Zone Committee (water level management, phosphorus legacy management, restoration of macrophytes and wetland development) would reduce nutrient (re)cycling and availability to algae.
Surface of the lake bed as seen in a sediment core from Te Waihora/Lake Ellesmere, showing numerous burrows of midge larvae. The activity of these larvae in the lake enhances denitrification (the removal of nitrate from the lake).
43
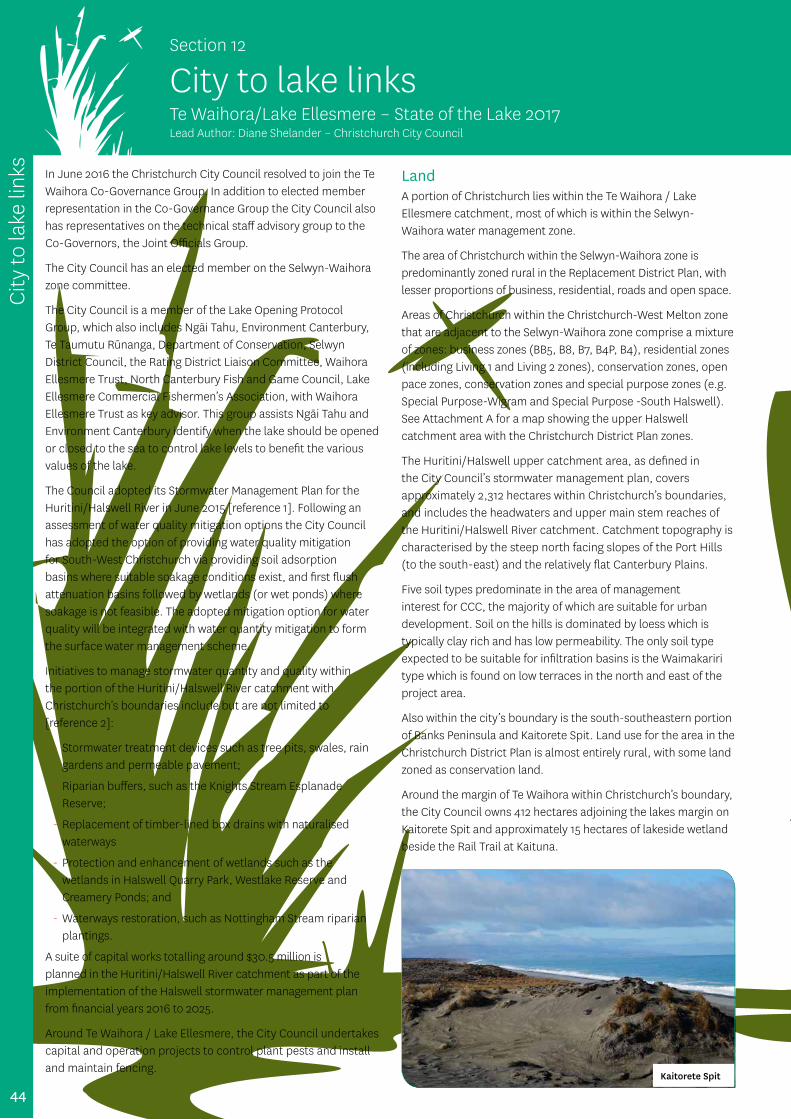
Gov
erna
nce
and
man
agem
ent
In June 2016 the Christchurch City Council resolved to join the Te Waihora Co-Governance Group. In addition to elected member representation in the Co-Governance Group the City Council also has representatives on the technical staff advisory group to the Co-Governors, the Joint Officials Group.
The City Council has an elected member on the Selwyn-Waihora zone committee.
The City Council is a member of the Lake Opening Protocol Group, which also includes Ngāi Tahu, Environment Canterbury, Te Taumutu Rūnanga, Department of Conservation, Selwyn District Council, the Rating District Liaison Committee, Waihora Ellesmere Trust, North Canterbury Fish and Game Council, Lake Ellesmere Commercial Fishermen’s Association, with Waihora Ellesmere Trust as key advisor. This group assists Ngāi Tahu and Environment Canterbury identify when the lake should be opened or closed to the sea to control lake levels to benefit the various values of the lake.
The Council adopted its Stormwater Management Plan for the Huritini/Halswell River in June 2015 [reference 1]. Following an assessment of water quality mitigation options the City Council has adopted the option of providing water quality mitigation for South-West Christchurch via providing soil adsorption basins where suitable soakage conditions exist, and first flush attenuation basins followed by wetlands (or wet ponds) where soakage is not feasible. The adopted mitigation option for water quality will be integrated with water quantity mitigation to form the surface water management scheme.
Initiatives to manage stormwater quantity and quality within the portion of the Huritini/Halswell River catchment with Christchurch’s boundaries include but are not limited to [reference 2]:
- Stormwater treatment devices such as tree pits, swales, rain gardens and permeable pavement;
- Riparian buffers, such as the Knights Stream Esplanade Reserve;
- Replacement of timber-lined box drains with naturalised waterways
- Protection and enhancement of wetlands such as the wetlands in Halswell Quarry Park, Westlake Reserve and Creamery Ponds; and
- Waterways restoration, such as Nottingham Stream riparian plantings.
A suite of capital works totalling around $30.5 million is planned in the Huritini/Halswell River catchment as part of the implementation of the Halswell stormwater management plan from financial years 2016 to 2025.
Around Te Waihora / Lake Ellesmere, the City Council undertakes capital and operation projects to control plant pests and install and maintain fencing.
LandA portion of Christchurch lies within the Te Waihora / Lake Ellesmere catchment, most of which is within the Selwyn-Waihora water management zone.
The area of Christchurch within the Selwyn-Waihora zone is predominantly zoned rural in the Replacement District Plan, with lesser proportions of business, residential, roads and open space.
Areas of Christchurch within the Christchurch-West Melton zone that are adjacent to the Selwyn-Waihora zone comprise a mixture of zones: business zones (BB5, B8, B7, B4P, B4), residential zones (including Living 1 and Living 2 zones), conservation zones, open pace zones, conservation zones and special purpose zones (e.g. Special Purpose-Wigram and Special Purpose -South Halswell). See Attachment A for a map showing the upper Halswell catchment area with the Christchurch District Plan zones.
The Huritini/Halswell upper catchment area, as defined in the City Council’s stormwater management plan, covers approximately 2,312 hectares within Christchurch’s boundaries, and includes the headwaters and upper main stem reaches of the Huritini/Halswell River catchment. Catchment topography is characterised by the steep north facing slopes of the Port Hills (to the south-east) and the relatively flat Canterbury Plains.
Five soil types predominate in the area of management interest for CCC, the majority of which are suitable for urban development. Soil on the hills is dominated by loess which is typically clay rich and has low permeability. The only soil type expected to be suitable for infiltration basins is the Waimakariri type which is found on low terraces in the north and east of the project area.
Also within the city’s boundary is the south-southeastern portion of Banks Peninsula and Kaitorete Spit. Land use for the area in the Christchurch District Plan is almost entirely rural, with some land zoned as conservation land.
Around the margin of Te Waihora within Christchurch’s boundary, the City Council owns 412 hectares adjoining the lakes margin on Kaitorete Spit and approximately 15 hectares of lakeside wetland beside the Rail Trail at Kaituna.
Key Author: Karen Banwell, Environment Canterbury
City to lake linksTe Waihora/Lake Ellesmere – State of the Lake 2017Lead Author: Diane Shelander – Christchurch City Council
City
to la
ke li
nks
Section 12
Kaitorete Spit
44

WaterThe upper portion of the Huritini / Halswell River is within Christchurch district boundaries. Attachment B shows the city boundary, the water management zone boundaries, and streams, drains and rivers.
The Huritini/Halswell River receives appreciable flow from Knights Stream, a largely spring-fed tributary fed from rural land around Prebbleton, and Templeton, but also from the suburb of Halswell. From the Knights Stream confluence downstream until the course re-curves back to SH 75 (Taitapu Road), the channel is quite uniform in profile. Land use varies between cropping, grazing, and road reserve land. Downstream of SH75 (Tai tapu Road) the channel becomes shallower and generally more heterogeneous. After the confluence with Knights Stream, the Huritini/Halswell River meanders south for approximately 5 km to Lansdowne Valley.
In the south-southeastern portion of Banks Peninsula streams such as Kaituna River, Prices Stream and Waikoko Stream drain towards Te Waihora/Lake Ellesmere.
VegetationVegetation in the developed residential suburban areas in the plains is predominantly non-native species. The City Council has undertaken a number of waterway plantings over the years for a variety of purposes: stormwater management, waterway quality improvement, sediment mitigation and improvement in indigenous biodiversity.
The City Council is undertaking riparian habitat and coastal bush revegetation work on the Council’s reserve at the Kaituna river mouth. In addition the Council has begun an experimental podocarp/coastal bush revegetation project on a headland at Hidden Bay on the Council’s Kaitorete Spit Reserve.
WildlifeFor around 10 years the City Council has undertaken wetland bird monitoring within the seven lake shore management areas that fall within Christchurch district. These surveys are done as part of the three lake-wide surveys (with Waihora Ellesmere Trust in February, and with Birds New Zealand – formerly called Ornithological Society of New Zealand – in June/July and November/December), and done opportunistically throughout the remainder of the year. In addition, the Council do bird monitoring on different sectors of the lake at times of the year outside of the three counts. The two Halswell Flats sectors get counted four to six times per year, and the Kaitorete Spit sites get counted eight or more times per year.
The City Council is carrying out the final year of four annual surveys of Kaitorete Spit for nesting Banded Dotterels this year. We GPS map locations of Banded Dotterel nests and territories at the last two breeding concentrations (at Kaitorete Spit tip and within the Council’s Kaitorete Spit Reserve) and have set up a predator control trap line. This season the Council will be doing magpie control and provide shelters for Banded Dotterel chicks.
The City Council have set up traplines to protect various species (Royal Spoonbills, Nesting banded Dotterels, waders and waterfowl, lizards) along the rail trail, within the Council’s Kaitorete Reserve and on the paper road/Environment Canterbury land at the Kaitorete Spit tip. These link to Department of Conservation traplines on Kaitorete Spit and the Kaituna River, which in turn link to a trapline the Council has around the southern and western sides of Wairewa/Lake Forsyth.
RecreationThe upper Huritini/Halswell River catchment within Christchurch’s boundaries has a range of recreation, sports and conservation parks including the 56 hectare Halswell Quarry Park, Halswell domain, Rhodes domain and Westlake reserve.
Cultural impact assessment of stormwater managementWhile a cultural health assessment (state of the takiwa) has not been undertaken in the City Council jurisdiction part of the river catchment, the overall cultural health is recognised as being poor.
The information below comes from a 2016 Cultural Impact Assessment Report [reference 3] on the City Council’s Huritini stormwater plan. That report recommended the following actions:
– The need to recognise the importance of Ngāi Tahu values, tikanga and the relationships that Ngāi Tahu have with the land and water, in all future catchment management and development initiatives.
– Cultural monitoring is undertaken on a 5-yearly basis.
– That the new stormwater management scheme for the Huritini recognises and provides for the exercise of rāhui and other relevant customary management tools designed to sustain the mauri / vitality of waterways and other mahinga kai (ideally to a standard fit for human use/consumption/benefit).
– That water quality monitoring parameters recognise the relationship of Ngāi Tahu to freshwater and allow Ngāi Tahu and the wider community to participate in mahinga kai/food gathering activities without risks to human health.
– That the City Council engages with Papatupu Rūnanga in the design process where, for example, wāhi tapu wāhi taonga and mahinga kai are likely to be effected. It is essential that mana-whenua are engaged to help ensure that cultural values are best recognized and provided for.
– Want to see a consistent progress on the identification and revitalisation of mahinga kai and natural spring and wetland sites throughout the catchment.
References(1) Stormwater Management Plan for the Huritini/Halswell River June 2015. Christchurch City Council. http://files.ecan.govt.nz/public/consent-projects/ccc-stormwater/06_CRC160056_Application_Stormwater_Management_Plan_Huritini_Halswell_River.PDF
(2) Huritini/Halswell River Catchment – Tauākī Wai Patāua / Vision and Values. Christchurch City Council, July 2016. https://www.ccc.govt.nz/assets/Documents/Environment/Water/Halswell-River-Catchment-Vision-Values.pdf
(3) Huritini/Halswell River Catchment Stormwater Management Plan June 2016, Cultural Impact Assessment Report December 2016.
45

Upper Halswell River catchment area with Christchurch District Plan zones.
Upper Halswell River catchment and City and Canterbury Water Management Strategy zone boundaries
South-southeast peninsula and Kaitorete Spit
46

DiscussionTe Waihora/Lake Ellesmere – State of the Lake 2017Kenneth J. W. Taylor - Our Land and Water National Science Challenge
Section 13
The 2017 version of this report contains two new sections. One of these is not, strictly speaking, an assessment of state and/or trend, but describes the results of research into the ways phosphorus and nitrogen entering Te Waihora are processed and transformed, and in turn influence the growth of the algae which proliferate in the lake. Algal blooms are a defining characteristic of Te Waihora, and have significant impacts on many of its values. Research of this kind is important in understanding algal dynamics and therefore in helping to explain why our measurements of indicators of those values shift in the way they do. Inclusion of short summaries of research relevant to the interpretation of monitoring information is, and should continue to be, a useful addition to the State of the Lake Report.
The other new section is a discussion of the connections between Christchurch City and Te Waihora/Lake Ellesmere. This reflects not only the fact that a substantial part of the city lies within the Te Waihora catchment, but also that the Christchurch City Council is now a part of the co-governance arrangements under which the physical resources of the lake and its catchment are managed. The section identifies a number of initiatives relating to storm water, riparian and wildlife management which should ultimately be reflected in improved environmental outcomes.Over time information on the effect of these interventions will be incorporated into the “State of the Lake” topic areas.
In 2015 we summarised all of the information presented in the report that described overall current state/progress towards measures of success, based on the “traffic light” assessments of the contributors to each section. Our conclusion was that there were no obvious indications of on-going deterioration in values or well-beings supported by the lake and its environs. However, we also noted that:
“…natural fluctuations in the distribution and abundance of species, or other measures of environmental quality, mean that it will take some time before the impact of pressures on some lake values are fully understood. Similarly the infrequency of measurement or observation in relation to some topic areas such as vegetation, even where good historical data exist, means that there is little new to report at a two-yearly time scale”
In recognising these limitations we also need to add the sometimes multi-decadal lags in the transport of contaminants throughout the catchment. In combination these factors mean that we must be cautious in drawing conclusions from qualitative assessments of trends over short time scales. For that reason we have not included a topic-by-topic overall evaluation, but will consider doing so again in 2019.
Assessments of state have been provided in each topic section. Comparison of these with 2015 results suggest that the conclusion then is still valid. However, while much has stayed the same, there are both positive and negative indications this year. Amongst the former are improvements in the water quality of tributary streams and groundwater, and in the state of lakeshore wetland vegetation.
In terms of water quality, though, we cannot yet determine the degree to which improvements have resulted from land use practice changes as opposed to short-term climate variability. On the negative side, the current critical state of lake populations of Australasian Crested Grebes and Australasian Bitterns, two of our key indicator species, is of particular concern. It is also disappointing to note that issues identified in 2015 concerning damage from vehicles to sensitive lakeshore vegetation in some locations are still to be resolved.
Two years ago, we identified a number of factors which we felt would contribute to improved breadth and quality of information about the state of the lake and catchment, and the effectiveness of management interventions. These included:
● The development of a new comprehensive lake monitoring strategy
● Availability of new technologies to enable communities to play a greater part in data gathering
● Large scale industry and partnership initiatives aimed at improving environmental outcomes
● Implementation of statutory and zone plans, and the need for effectiveness monitoring
● Plan and resource consent requirements on resource users to provide monitoring information about the impacts of their activities
Disappointingly, there is little evidence available to us to show that these initiatives and opportunities are bearing fruit in terms of providing a more inclusive body of information from which to make inferences about state and trend. That is not to say that such work is not occurring; what is clearly missing is a mechanism to ensure that all of the various components of the strategy are actually being undertaken by the appropriate agencies, and that the results are made available for interpretation in a fully integrated manner. For example, data from the Living Waters programme will, potentially, have much to tell us about the efficacy of farm and sub-catchment scale initiatives and mitigations that could have relevance well beyond the catchment. Monitoring information required from the Central Plains Water scheme will not only provide data about patterns of water resource use, but also about contaminant transport and water flows throughout the catchment.
The benefits from the implementation of the comprehensive monitoring strategy, which provides a coherent framework for the collection of wide-ranging information on the resources of the lake and catchment, are not being realised. Although the Waterways Centre has taken a lead role in the integration and synthesis of monitoring information, it cannot implement the strategy on its own. Success will require all of the agencies and organisations who have information-gathering responsibilities to provide leadership in their particular areas, and to commit to working together to ensure comprehensive data are collected and made available across all of the topic areas, including those for which poor or no data currently exist. Such a commitment will be enormously helpful in realising the community’s aspirations for Te Waihora/Lake Ellesmere and its catchment.
Disc
ussi
on
47

More informationAdditional information and links are available from the WET website www.wet.org.nz
48