state of the profession 2016 by cipr
TRANSCRIPT
STATEOFPR 2016
INSIGHT TO INFORM ____#StateOfPR
State of the Profession, now in its seventh year, remains the most comprehensive survey of people working in public relations. Once again, it provides evidence of common trends in practice anecdotally shared on a daily basis.
Among the key findings is a continued trend of convergence between public relations and other communications disciplines, including marketing. Also, for the first time, media relations is not reported as the most common demand on time in the working life of a practitioner. Content creation and curation, led by digital and social demands, is on the rise.
The survey also shows that despite a roughly 50/50 gender balance amongst those who define themselves as working in senior roles, significant pay inequalities exist for women who operate at the very highest level.
STATE OF PR 2016EXECUTIVE SUMMARY
2 #StateOfPR

ConvergenceAs recorded in surveys since 2009, the convergence of public relations and marketing, alongside other related disciplines, remains a clear trend that shows little sign of slowing.
76% of all respondents said compared to two years ago, they now work more closely with dedicated social and digital media teams, as well as the marketing, advertising and sales departments. This is an increase of 3% on #StateOfPR 2015 and is clearly led by the cross-management of digital and social media.
Convergence is least likely to occur around media relations and internal communications, indicating that these remain solid areas of specialism for public relations.
In line with previous years, traditional marketing led tasks increasingly found with PR teams include copywriting, branding, sponsorship and strategic partnerships – with a notable year-on-year increase of a third more PR professionals now seeing some responsibility for prize draws, competitions and promotions (28% in 2016 up from 21% in 2015).
The rise of “content”Further evidence of amalgamation between departments is highlighted when PR professionals are asked to indicate the amount of time they spend on a list of defined common operational tasks. The list of potential responsibilities was reviewed and expanded in this year’s survey, meaning that content creation, and curation, was included for the first time.
Content creation is the most common way practitioners spend their time at work, as identified by 81% of all respondents. Media relations (72%) is the second most common demand on their time and it is still the practice area that commands the majority of their budgets.
Grammar and proofreading follows as the third most common operational task, ranking just above content curation and the management of digital and social media. Digital and social media management also rank in the top three budget considerations.
For most practitioners, public relations is firmly a tactical role up to and including managerial level, whereas at senior levels, practitioners tend to dedicate themselves to other tasks – including pitching, account management and client handling, and budgeting and financial planning. Across the board, what could be considered as technical PR tasks again rank low in terms of amount of time spent. These include web design, video and photo editing, coding, and search engine marketing. When they are delivered, these tasks are more or less exclusively the remit of junior staff.
As the industry continues to evolve and the remit of PR continues to grow, an apparent gulf between the tasks and competencies of junior and senior staff raises the question as to whether PR bosses understand and could effectively deliver the increased day-to-day workload that is now demanded of their staff?
STATE OF PR 2016EXECUTIVE SUMMARY
3 #StateOfPR
SkillsTo review skills demand across the sector, respondents were asked about the competencies required of new recruits. Alongside leadership, interpersonal and strategic management skills, areas such as pitching, project management and budgeting/financial planning are all sought after by those looking for senior staff. Despite this, these commonly fail to rank high on the list of professionals’ own perceptions of their skills set – and remains unchanged from last year. For junior recruits, softer skills – such as interpersonal skills, attention to detail and creativity – are more apparently in demand.
Following this, and generally mirroring last year’s results, the strongest skills all respondents believe they possess are soft skills – the top three being traditional forms of written communication (35%), interpersonal skills (31%) and attention to detail (27%). However, content curation, which ranks as the joint fourth common PR operational task, is only believed to be the strongest skill of 3% of respondents. The weakest skills that all respondents believe they possess are again technical tasks, with HTML and coding (69%) and search engine optimisation (48%) clearly out in front, also concurrent with last year.
Interestingly, this year’s report shows that women are more than twice as likely as men to rank organisational skills as their strongest asset, whilst men in PR are twice as likely as women to rank identifying current affairs and industry trends as their strongest skill. Confidence in leadership and management skills is also far more prevalent amongst men than women. Yet interpersonal skills are perceived to be strongest amongst a third more women than men.
Pay and rewardFor the first time, data relating to pay and reward combine figures for all in-house, consultancy and independent practitioners into average annual earnings figures.
The average annual earning figure for PR professionals is £48,196. In line with previous years, analysis reveals that London based professionals earn on average 31% more (£13,616) than those based in the rest of the UK. Those working in-house in the private-sector command the highest average salary of all employees at £51,075, whilst public sector commands the lowest (£39,966).
Interestingly, a non-graduate PR professional is found to earn on average 24% more (£12,348) than a graduate. Whilst it is the case that graduates dominate the working population (only 15% of respondents were non-graduates), non-graduate respondents are relatively balanced by seniority and by organisation type. Additionally, even though the size of the overall graduate pay gap between is primarily down to high earnings reported by non-graduate independent practitioners vs. graduates – it also the case that when comparing in-house and consultancy PR professionals, non-graduates earn a higher average annual salary.
STATE OF PR 2016EXECUTIVE SUMMARY
4 #StateOfPR
❰ CONTENTS#StateOfPR
Gender balance and equal payThe public relations workforce has long been more or less two-thirds female. In this year’s survey, women make up 66% of respondents, an increase of 2% on last year’s figure and 6% higher in comparison to the first #StateOfPR survey, conducted in 2009.
In ‘Non-Manager’ and ‘Manager’ roles women make up 73% and 70% of the respective populations. This decreases for ‘Head of Comms / Associate Directors’ to 60%, and at ‘Director / Partner / MD / Owners’ level to 48%, the same proportion as recorded in 2015. The fact that at the most senior level gender balance remains more or less unchanged, when compared to all previous surveys, and despite the fact that the number of women in PR has proportionally increased, is possible evidence of an employment ceiling affecting the opportunities available to women.
Building on previous findings, this survey continues to evidence a large gender pay gap in public relations – recording an average disparity of £15,040 between male and female earnings. This apparent 19% year-on-year increase on 2015’s figure is primarily due to the inclusion of independent practitioners in the overall results. An employee-only figure however shows a gap of £11,698, a 7% year-on-year decrease.
Conducted for the second year in a row, regression analysis of the salaries of those employed in PR roles (excluding independent practitioners) records that gender is the third most influential factor on PR practitioners’ pay packets, which is consistent with the findings in 2015. The influence of gender amounts to a £6,004 disadvantage for women, a decrease of £2,479 on 2015’s figure.
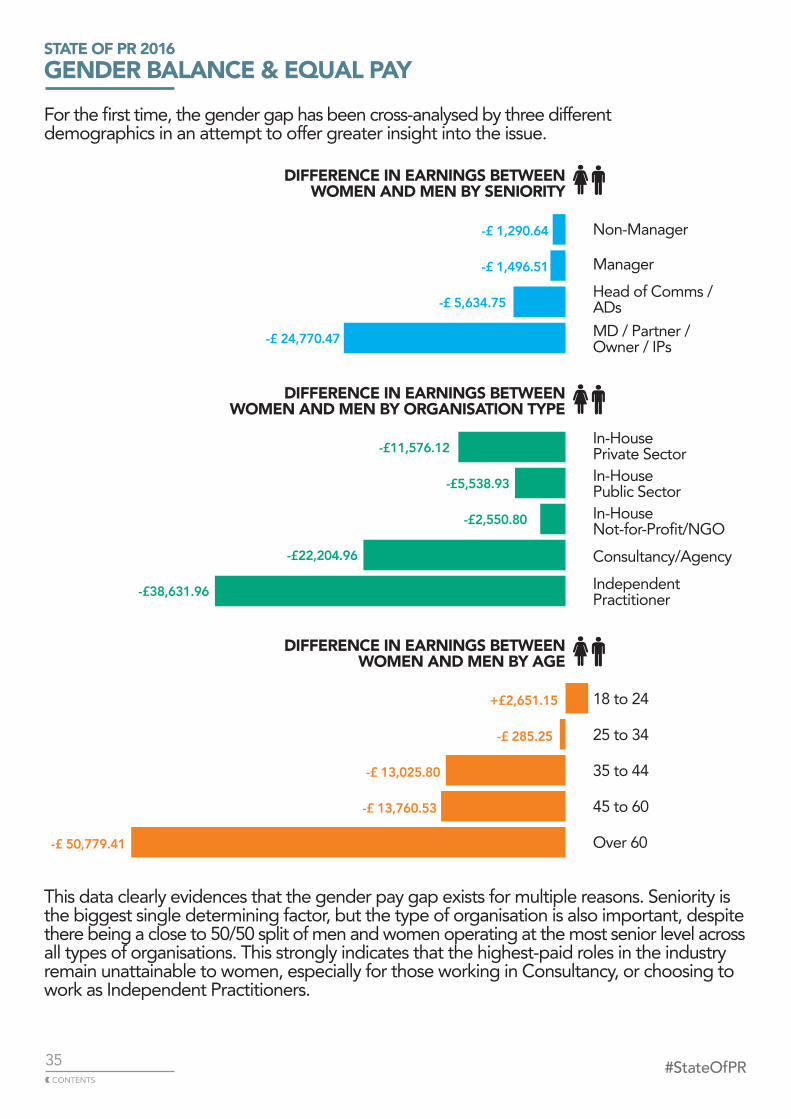
For the first time, the gender gap has been cross-analysed by different industry demographics in an attempt to offer greater insight into the issue.
When looking at seniority, the gender pay gap stands at £1,500 in relatively junior roles, yet widens significantly further up the career ladder. Comparing the earnings of men and women who define themselves as ‘Head of Comms / Associate Directors’ reveals a gender pay gap of £5,635. Above that, for ‘Director / Partner / MD / Owners / Independent Practitioners’ the gender pay gap is nearly four and half times greater, rising to £24,770 (excluding independent practitioners would be £19,221).
At an organisational level, there is a significantly higher pay gap between men and women working in agencies and consultancies (£22,205), than there is for those working in-house (£6,555). The most striking disparity is for Independent Practitioners, where the difference between the annual turnover of men and women is £38,632.
These findings provide further evidence that woman are disadvantaged at all levels in terms of earnings in an industry which they are numerically dominant. The gender pay gap becomes more acute at senior levels, where the numerical advantage decreases or balances out, an employment ‘ceiling’ exists. With this evidence, the question should now be put to the professions leading practitioners, employers and thought leaders: are the highest paid jobs in public relations open to women?
STATE OF PR 2016EXECUTIVE SUMMARY
#StateOfPR

STATE OF PR 2016CONTENTS
1 METHODOLOGY & DATA TABLES
2 DEMOGRAPHIC PROFILE DEMOGRAPHIC ORGANISATION TYPE DEMOGRAPHIC SENIORITY DEMOGRAPHIC LOCALITY
3 OPERATIONAL TASKS & BUDGET SPEND4 COMPETENCIES & SKILLS DEMAND5 PAY & REWARD6 GENDER BALANCE AND EQUAL PAY7 DIVERSITY
8 FURTHER ISSUES & CURRENT DEBATES
6❰ CONTENTS
#StateOfPR

STATE OF PR 2016METHODOLOGY
Survation interviewed 1,518 PR professionals between 4 November and 22 December 2015. Invitations to complete the survey were sent by email to the CIPR member and non-member database of PR professionals, as well as links made available directly by CIPR through emails and the website.
The first invitations were sent out on 4 November 2015 to a randomly selected batch of 4,600 email addresses in order to soft launch the project, with the remainder of the contacts receiving invites later that day.
Weekly scheduled reminders were created, with the first reminder sent out on 10 November 2015 and the final sent on 22 December 2015.
1
7❰ CONTENTS
#StateOfPR

STATE OF PR 2016METHODOLOGY
DATA TABLESThe full dataset from this study is available to download.
Unfortunately it is not possible to publish the raw data. As respondents participated in the survey on the basis that their responses would all be anonymous, it would be unethical to release publicly information which could lead to them being identified. This also would be a breach of Survation’s obligations under the Market Research Society code of conduct.
ABOUT CIPRFounded in 1948, the Chartered Institute of PR (CIPR) is the only Royal Chartered professional body for PR practitioners in the UK and overseas. The CIPR was granted its Royal Charter by the Privy Council in February 2005. With over 10,000 members involved in all aspects of PR, it is the largest body of its type in Europe. The CIPR advances professionalism in PR by making its members accountable to their employers and the public through a code of conduct and searchable public register, setting standards through training, qualifications, awards and the production of best practice and skills guidance, facilitating Continuing Professional Development (CPD), and awarding Chartered PR Practitioner status (Chart.PR).
ABOUT SURVATIONSurvation is an innovative and creative market research agency and leading UK opinion pollster, working with big brands and key campaigns. Survation carry out telephone, online and face-to-face research, with a major focus on social and political research Survation is a member of the British Polling Council and abides by its rules.
8❰ CONTENTS
#StateOfPR

DEMOGRAPHIC 2
PROFILE
#StateOfPR❰ CONTENTS

STATE OF PR 2016DEMOGRAPHIC PROFILE
AGE
18 to 24 7% 25 to 34 32% 35 to 44 29% 45 to 60 27% Over 60 4%
SEX
Female 66%Male 34%
UNIVERSITY EDUCATION
Graduate 85%Non-graduate 15%
The following charts break down the basic demographic profile of all survey respondents. Respondents were asked a series of simple profiling questions about age, sex, type of university eduction and their location. Industry specific questions were also asked to establish the type of organisation they work in, their level of seniority and how many years they’ve worked in PR.
10❰ CONTENTS
#StateOfPR

STATE OF PR 2016DEMOGRAPHIC PROFILE
LOCATION
Channel Islands 1% East of England 6% East Midlands 4% London 27% North East 3% Northern Ireland 3% North West 8% Scotland 8% South East 12% South West 8% Wales 4% West Midlands 4% Yorkshire & Humber 5% Outside the UK 8%
11❰ CONTENTS
#StateOfPR

STATE OF PR 2016DEMOGRAPHIC / PROFILE
ORGANISATION TYPE
In-House Private Sector 22%In-House Public Sector 24%In-House Not-for- Profit/NGO 16%Consultancy/Agency 25%Independent Practitioner 13%
SENIORITY
Intern/Trainee <1%Assistant/Executive 9%Officer 20%Manager 35%Head of Comms/Associate Director 19%Director/Partner/MD 12%Owner 5%Other (please specify) 1%
YEARS IN PR
0 to 2 years 12%3 to 5 18%6 to 10 22%11 to 15 16%16 to 20 14%21+ 17%
12❰ CONTENTS
#StateOfPR
DEMOGRAPHIC 2
ORGANISATION TYPE
#StateOfPR❰ CONTENTS

LOCATION
London
Midlands & East England
North England
South England (inc. C.I.)
Northern Ireland
Scotland
Wales
SEX
Female
Male
67%
62%
33%
38%
28%
25% 13%
15% 14%
17%
21%
23%
2%
3%
9%
8%
5% 2%
AGE
18 to 24
25 to 34
35 to 44
45 to 60
Over 60
4%
9%
37%
25% 33%
26%
24%
33%
2%
7%
STATE OF PR 2016DEMOGRAPHIC / ORGANISATION TYPE
In-house ConsultancyKey
In-house ConsultancyKey
In-house ConsultancyKey
This section breaks down the demographic profiling of respondents into all of those who identified working In-house and those working in Consultancy or as an Independent Practitioner.
14❰ CONTENTS
#StateOfPR

UNIVERSITYEDUCATION
Graduate
Non-graduate
YEARS IN PR
0 to 5
6 to 10
11 to 20
21+
SENIORITY
Non-manager
Manager
Head of Comms/Associate Director
MD/Partner/Owner
87%
84%
12%
15%
33%
25% 26%
17%
30%
31%
11%
28%
33%
20%
39%
24%
21%
12%
5% 43%
STATE OF PR 2016DEMOGRAPHIC / ORGANISATION TYPE
In-house ConsultancyKey
In-house ConsultancyKey
In-house ConsultancyKey
15❰ CONTENTS
#StateOfPR

DEMOGRAPHIC 2
SENIORITY
❰ CONTENTS#StateOfPR
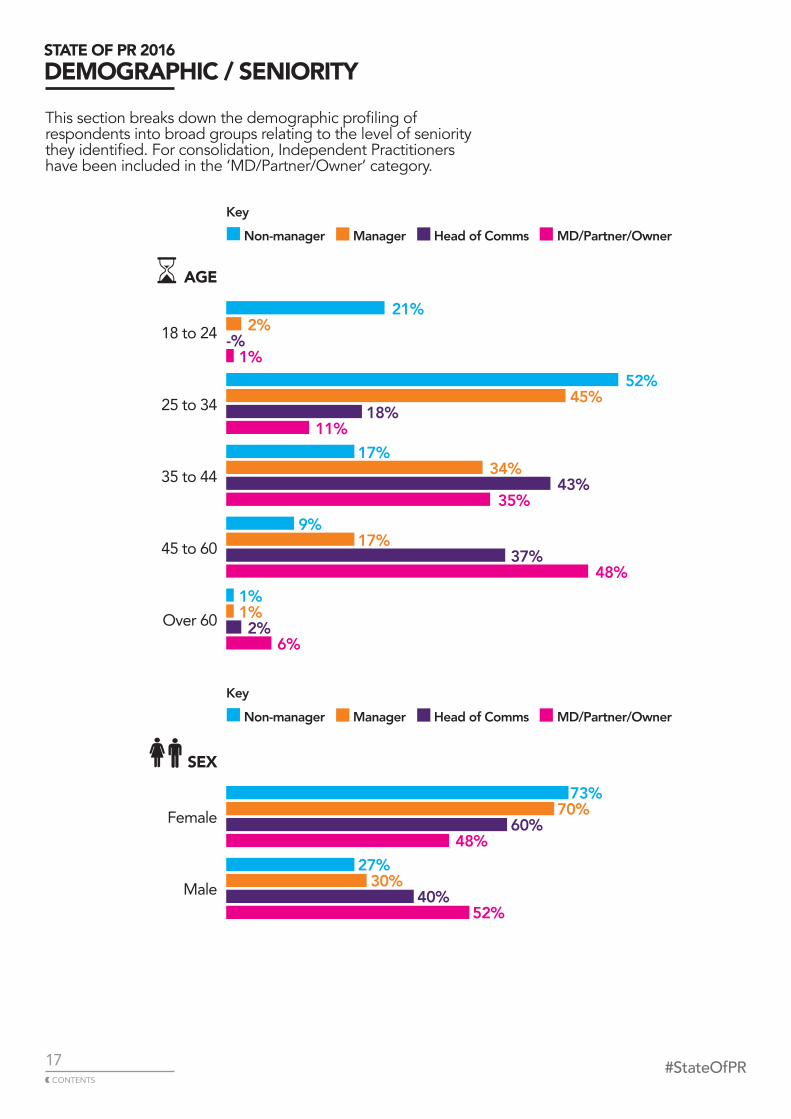
21%
2%
-% 1%
52% 45% 18%
11%
17%
34%
43%
35% 9%
17%
37%
48%
1%
1%
2%
6%
AGE
18 to 24
25 to 34
35 to 44
45 to 60
Over 60
SEX
Female
Male
STATE OF PR 2016DEMOGRAPHIC / SENIORITY
73%
70%
60%
48%
27%
30%
40%
52%
Non-manager Manager Head of Comms MD/Partner/OwnerKey
Non-manager Manager Head of Comms MD/Partner/OwnerKey
This section breaks down the demographic profiling of respondents into broad groups relating to the level of seniority they identified. For consolidation, Independent Practitioners have been included in the ‘MD/Partner/Owner’ category.
17❰ CONTENTS
#StateOfPR
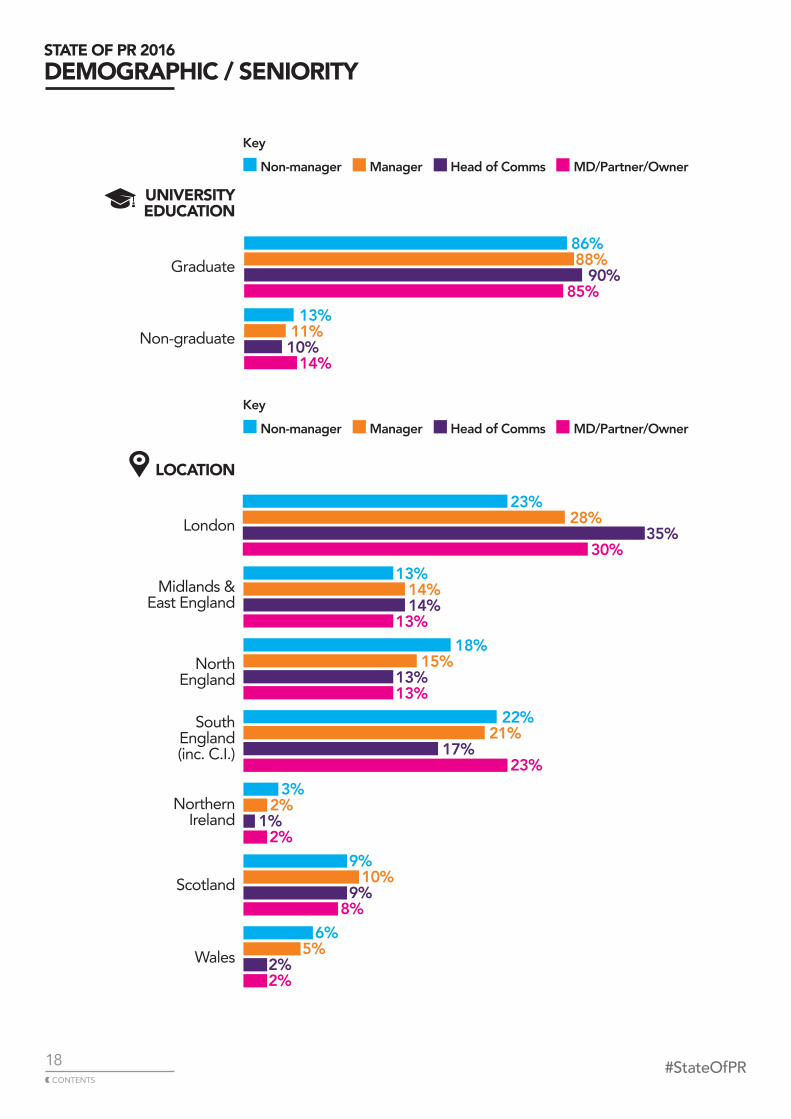
23%
28%
35% 30%
13%
14%
14%
13%
18%
15% 13%
13%
22%
21%
17%
23%
3%
2%
1%
2%
9%
10%
9%
8%
6%
5% 2%
2%
LOCATION
London
Midlands &East England
NorthEngland
SouthEngland(inc. C.I.)
NorthernIreland
Scotland
Wales
STATE OF PR 2016DEMOGRAPHIC / SENIORITY
86%
88%
90%
85% 13%
11%
10%
14%
UNIVERSITY EDUCATION
Graduate
Non-graduate
Non-manager Manager Head of Comms MD/Partner/OwnerKey
Non-manager Manager Head of Comms MD/Partner/OwnerKey
18❰ CONTENTS
#StateOfPR

YEARS IN PR
0 to 5
6 to 10
11 to 20
21+
STATE OF PR 2016DEMOGRAPHIC / SENIORITY
70%
31%
9%
4%
18%
34%
24%
15% 9%
28%
50% 42%
4%
7%
16%
39%
Non-manager Manager Head of Comms MD/Partner/OwnerKey
19❰ CONTENTS
#StateOfPR

DEMOGRAPHIC 2
LOCALITY
❰ CONTENTS#StateOfPR
STATE OF PR 2016DEMOGRAPHIC / LOCALITY
AGE
London Midlands & North South Northern Scotland Wales East England England England Ireland
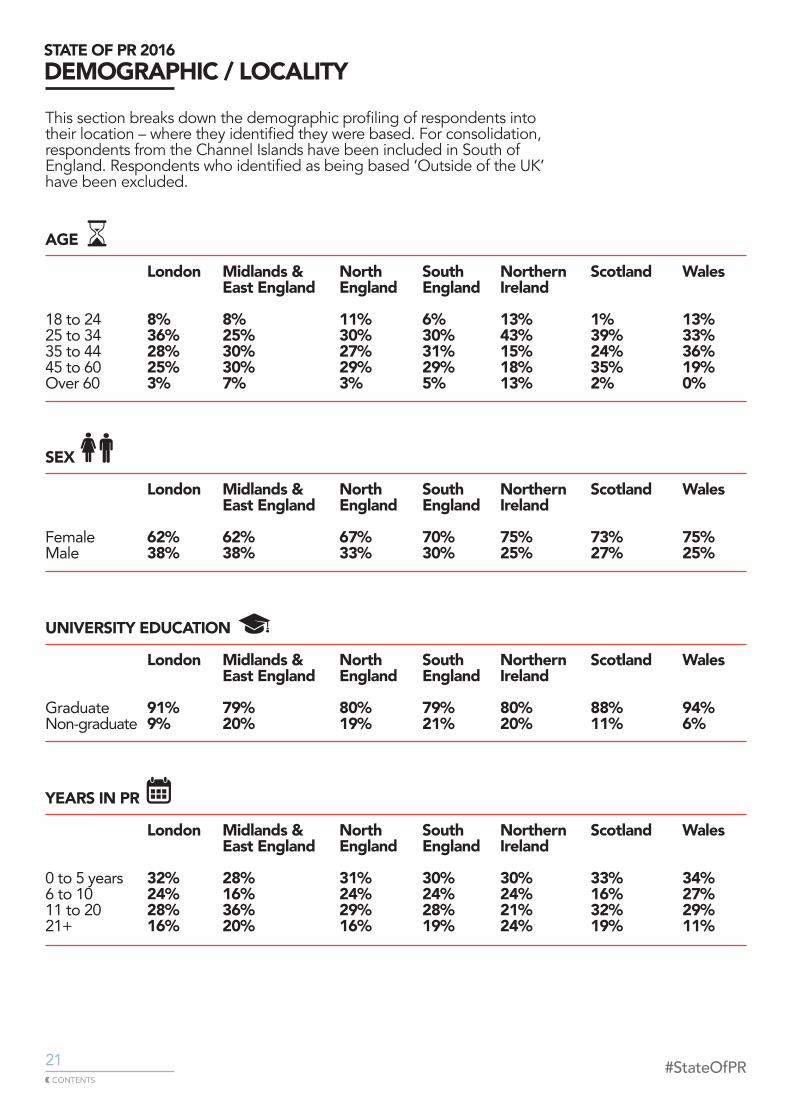
18 to 24 8% 8% 11% 6% 13% 1% 13%25 to 34 36% 25% 30% 30% 43% 39% 33%35 to 44 28% 30% 27% 31% 15% 24% 36%45 to 60 25% 30% 29% 29% 18% 35% 19%Over 60 3% 7% 3% 5% 13% 2% 0%
SEX
London Midlands & North South Northern Scotland Wales East England England England Ireland
Female 62% 62% 67% 70% 75% 73% 75%Male 38% 38% 33% 30% 25% 27% 25%
UNIVERSITY EDUCATION
London Midlands & North South Northern Scotland Wales East England England England Ireland
Graduate 91% 79% 80% 79% 80% 88% 94%Non-graduate 9% 20% 19% 21% 20% 11% 6%
YEARS IN PR
London Midlands & North South Northern Scotland Wales East England England England Ireland
0 to 5 years 32% 28% 31% 30% 30% 33% 34%6 to 10 24% 16% 24% 24% 24% 16% 27%11 to 20 28% 36% 29% 28% 21% 32% 29%21+ 16% 20% 16% 19% 24% 19% 11%
This section breaks down the demographic profiling of respondents into their location – where they identified they were based. For consolidation, respondents from the Channel Islands have been included in South of England. Respondents who identified as being based ‘Outside of the UK’ have been excluded.
❰ CONTENTS#StateOfPR21
STATE OF PR 2016 3
OPERATIONAL TASKS & BUDGET SPEND
In line with the growing remit of PR, and continued alignment with marketing, content creation is now the primary way a majority of professionals spend most, or at least some, of their time.
❰ CONTENTS#StateOfPR
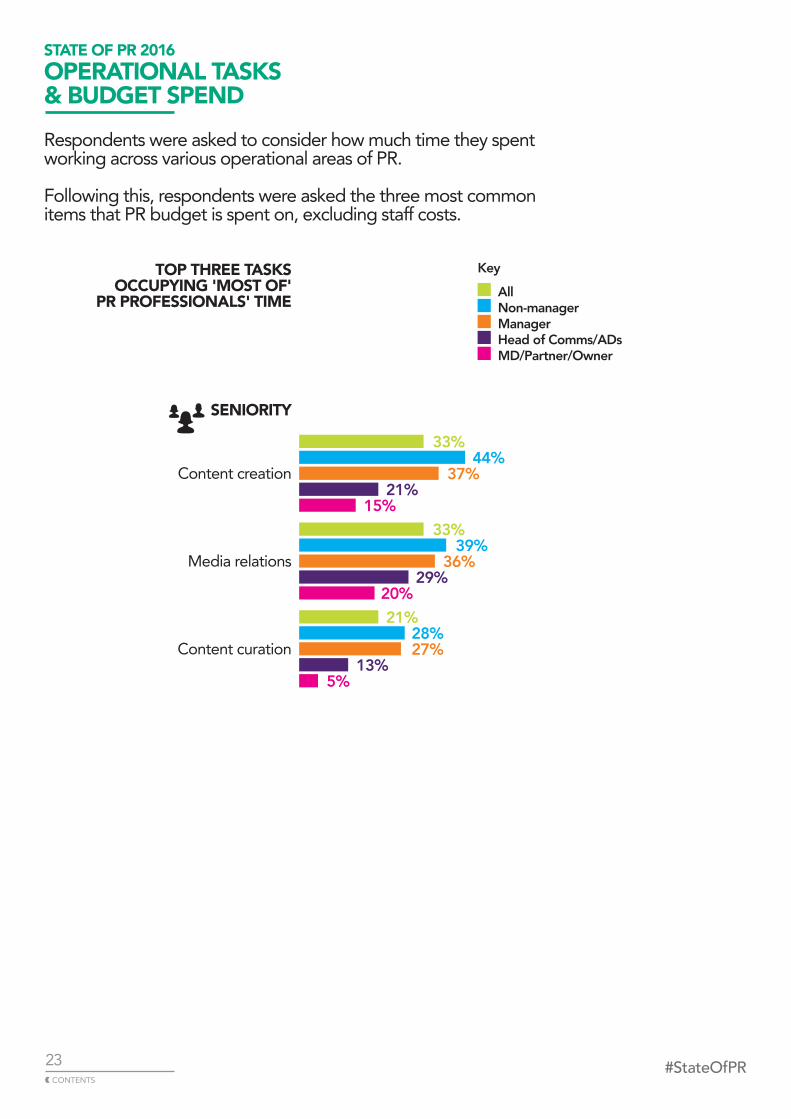
STATE OF PR 2016OPERATIONAL TASKS& BUDGET SPENDRespondents were asked to consider how much time they spent working across various operational areas of PR.
Following this, respondents were asked the three most common items that PR budget is spent on, excluding staff costs.
SENIORITY
Content creation
Media relations
Content curation
TOP THREE TASKS OCCUPYING 'MOST OF'
PR PROFESSIONALS' TIME
33%
44%
37%
21%
15% 33%
39%
36%
29%
20%
21%
28%
27%
13%
5%
All Non-manager Manager Head of Comms/ADs MD/Partner/Owner
Key
23❰ CONTENTS
#StateOfPR
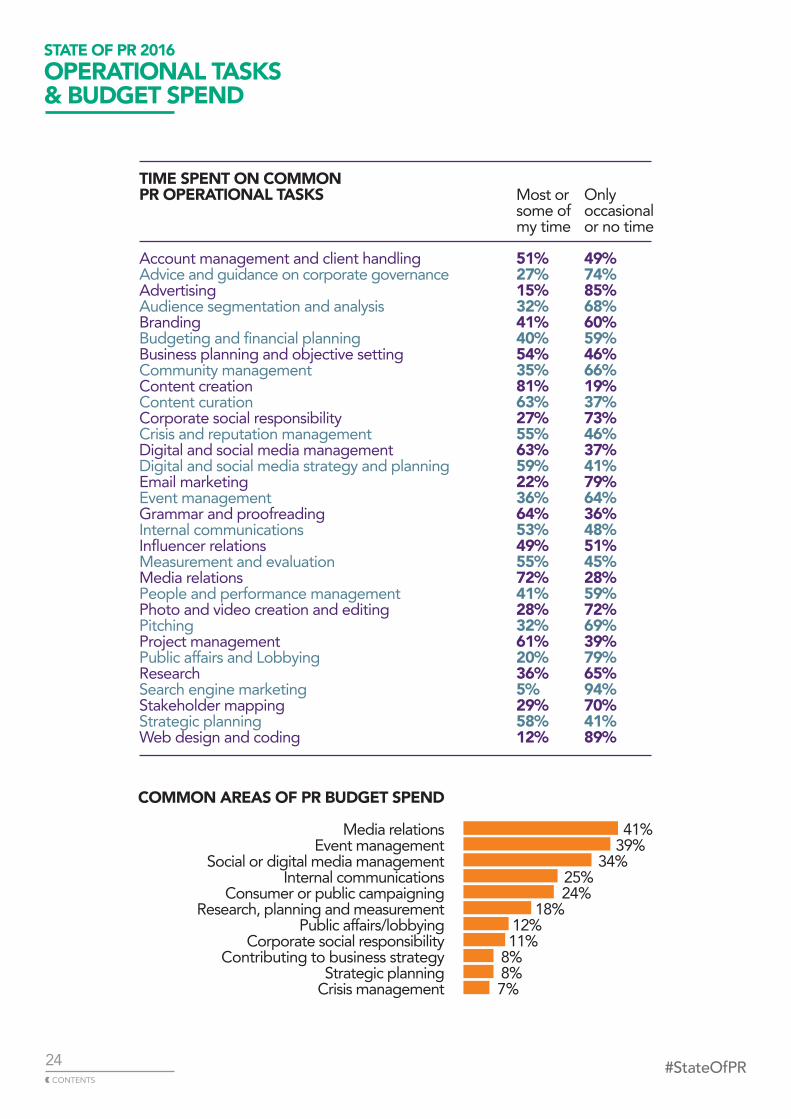
STATE OF PR 2016OPERATIONAL TASKS & BUDGET SPEND
TIME SPENT ON COMMONPR OPERATIONAL TASKS Most or Only some of occasional my time or no time
Account management and client handling 51% 49%Advice and guidance on corporate governance 27% 74%Advertising 15% 85%Audience segmentation and analysis 32% 68%Branding 41% 60%Budgeting and financial planning 40% 59%Business planning and objective setting 54% 46%Community management 35% 66%Content creation 81% 19%Content curation 63% 37%Corporate social responsibility 27% 73%Crisis and reputation management 55% 46%Digital and social media management 63% 37%Digital and social media strategy and planning 59% 41%Email marketing 22% 79%Event management 36% 64%Grammar and proofreading 64% 36%Internal communications 53% 48%Influencer relations 49% 51%Measurement and evaluation 55% 45%Media relations 72% 28%People and performance management 41% 59%Photo and video creation and editing 28% 72%Pitching 32% 69%Project management 61% 39%Public affairs and Lobbying 20% 79%Research 36% 65%Search engine marketing 5% 94%Stakeholder mapping 29% 70%Strategic planning 58% 41%Web design and coding 12% 89%
COMMON AREAS OF PR BUDGET SPEND
Media relations Event management
Social or digital media managementInternal communications
Consumer or public campaigning Research, planning and measurement
Public affairs/lobbying Corporate social responsibility
Contributing to business strategyStrategic planning
Crisis management
41% 39% 34% 25% 24% 18% 12% 11% 8% 8% 7%
24❰ CONTENTS
#StateOfPR

STATE OF PR 2016 4
COMPETENCIES & SKILLS DEMAND
PR pros continue to believe their strongest skills are soft ones –
with writing remaining top of the pile. From HTML to SEO, new technical competencies remain
the weakest – with little or no increase in demand of these skills from potential employers.
#StateOfPR❰ CONTENTS
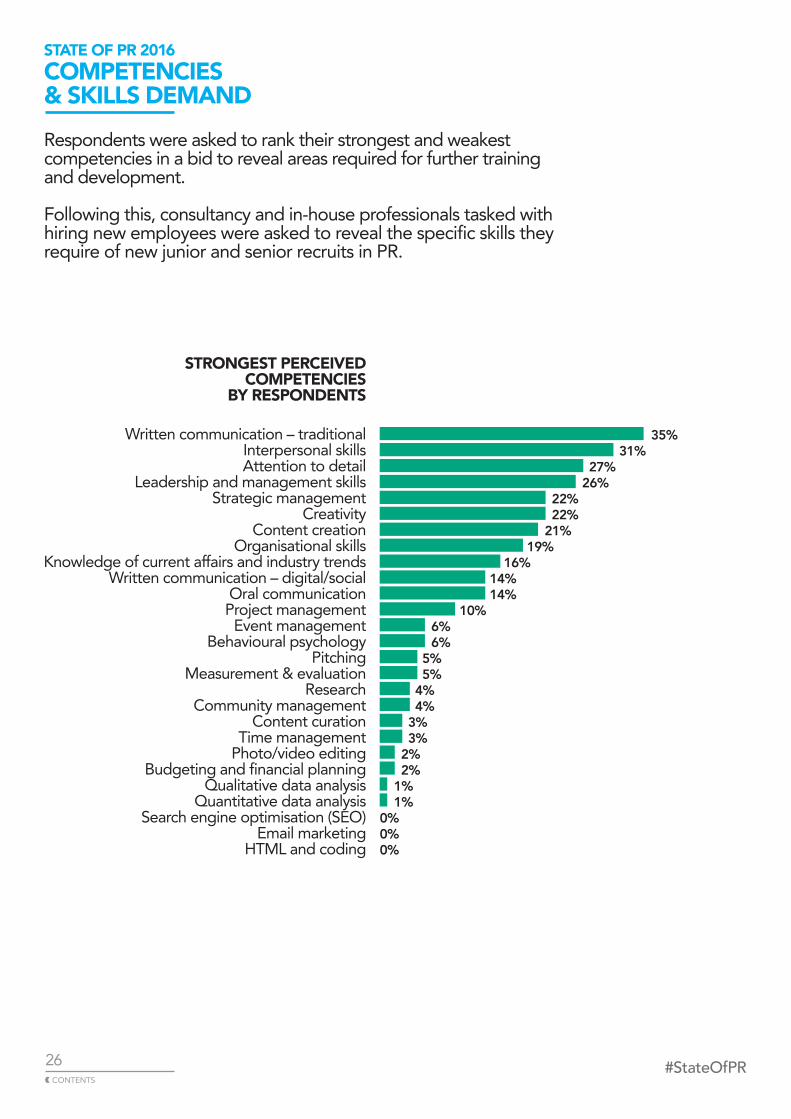
STATE OF PR 2016COMPETENCIES& SKILLS DEMANDRespondents were asked to rank their strongest and weakest competencies in a bid to reveal areas required for further training and development.
Following this, consultancy and in-house professionals tasked with hiring new employees were asked to reveal the specific skills they require of new junior and senior recruits in PR.
Written communication – traditional Interpersonal skills Attention to detail
Leadership and management skills Strategic management
CreativityContent creation
Organisational skills Knowledge of current affairs and industry trends
Written communication – digital/socialOral communicationProject managementEvent management
Behavioural psychologyPitching
Measurement & evaluation Research
Community managementContent curation
Time management Photo/video editing
Budgeting and financial planningQualitative data analysis
Quantitative data analysisSearch engine optimisation (SEO)
Email marketingHTML and coding
35% 31%
27%
26%
22%
22%
21%
19%
16%
14%
14%
10%
6%
6%
5% 5% 4%
4%
3%
3%
2%
2%
1%
1%
0%
0%
0%
STRONGEST PERCEIVED COMPETENCIES
BY RESPONDENTS
26❰ CONTENTS
#StateOfPR

STATE OF PR 2016COMPETENCIES& SKILLS DEMAND
TOP TENSKILLS IN DEMAND OFJUNIOR HIRES IN PR
Written communication - traditional 87%Attention to detail 82%Interpersonal skills 79%Written communication – digital/social 77%Oral communication skills 74%Creativity 69%Time management 61%Knowledge of current affairsand industry trends 50%Content creation 49%Research 22%
TOP TENSKILLS IN DEMAND OFSENIOR HIRES IN PR
Leadership and management skills 82%Strategic management 77%Interpersonal skills 75%Knowledge of current affairsand industry trends 75%Project management 71%Written communication – traditional 71%Organisational skills 71%Budgeting and financial planning 68%Attention to detail 68%Oral communication 65%
TOP FIVESTRONGEST PERCEIVED COMPETENCIESBY MEN
Written communication – traditional 38% Leadership and management skills 32% Strategic management 25% Interpersonal skills 25% Attention to detail 24%
TOP FIVESTRONGEST PERCEIVED COMPETENCIESBY WOMEN
Interpersonal skills 34% Written communication 34% Attention to details 29% Leadership and management skills 23% Organisational skills 23%
27❰ CONTENTS
#StateOfPR

STATE OF PR 2016 5
PAY & REWARD
The average annual earnings for a PR professional is £48,196. Despite this relatively high figure, a PR pro in London earns on average 31% more than a PR pro based elsewhere in the UK.
❰ CONTENTS#StateOfPR

STATE OF PR 2016PAY & REWARDFor all In-house and consultancy/agency professionals all data relates to the average annual gross basic salaries. For independent practitioners they were asked to record their annual business turnover at the end of the last financial year. For the first time, key findings combine figures for the two types into an average annual earnings figure. Data shared is the mean1.
1The mean instead of the median is the preferred method used by Survation. Within this mean calculation, all outlier values have been removed.
£24,570
N/A
£24,570 £34,069
£59,000
£34,069 £52,566
£62,121
£53,264 £60,530
£71,597
£62,536 £47,126
£103,943
£74,874
AGE
18 to 24
25 to 34
35 to 44
45 to 60
Over 60
In-house/Consultancy IPs CombinedKey
29❰ CONTENTS
#StateOfPR

In-house/Consultancy IPs CombinedKey
In-house/Consultancy IPs CombinedKey
STATE OF PR 2016PAY & REWARD
£53,393
£119,632
£56,938 £41,953
£63,775
£44,391 £39,158
£49,570
£40,147 £42,138
£74,135
£46,555 £31,511
£100,000
£40,348 £41,616
£65,167
£42,856 £40,302
£24,000
£39,095
LOCATION
London
Midlands & East England
North England
South England (inc. C.I.)
Northern Ireland
Scotland
Wales
UNIVERSITY EDUCATION
Graduate
Non-graduate
£45,279
£63,220
£46,677 £48,716
£105,581
£59,025
30❰ CONTENTS
#StateOfPR
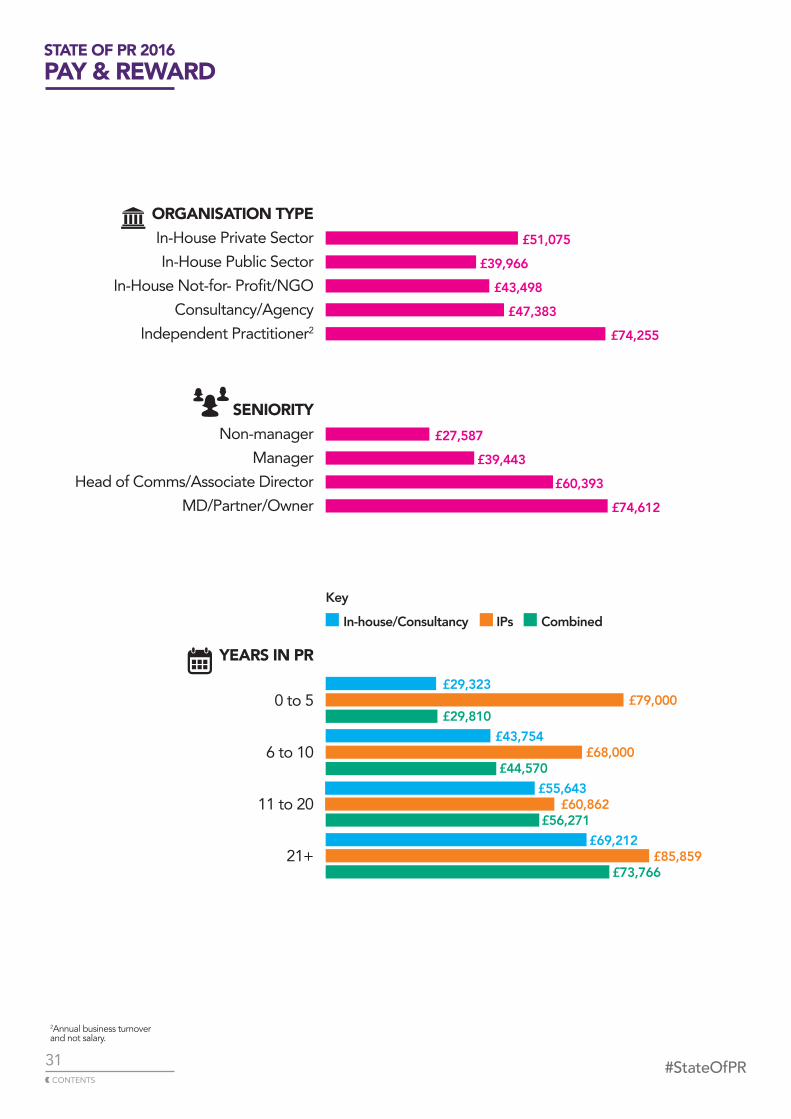
ORGANISATION TYPE In-House Private SectorIn-House Public Sector
In-House Not-for- Profit/NGOConsultancy/Agency
Independent Practitioner2
£51,075 £39,966 £43,498 £47,383 £74,255
SENIORITY Non-manager
ManagerHead of Comms/Associate Director
MD/Partner/Owner
£27,587 £39,443 £60,393 £74,612
YEARS IN PR
0 to 5
6 to 10
11 to 20
21+
£29,323
£79,000
£29,810 £43,754
£68,000
£44,570 £55,643
£60,862
£56,271 £69,212
£85,859
£73,766
2Annual business turnover and not salary.
STATE OF PR 2016PAY & REWARD
In-house/Consultancy IPs Combined Key
31❰ CONTENTS
#StateOfPR
STATE OF PR 2016 6
GENDER BALANCE & EQUAL PAY
The gender pay gap in PR is £15,040. This is despite a close-to 50/50 gender balance across the most senior roles.
❰ CONTENTS#StateOfPR
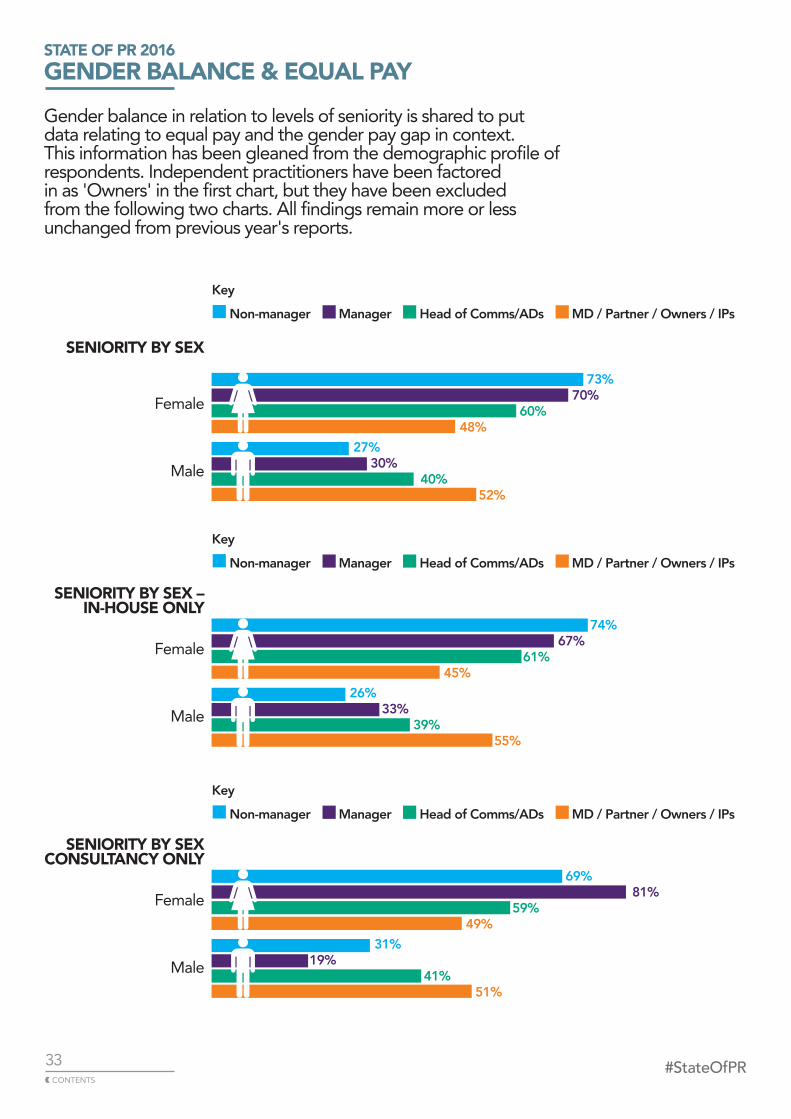
STATE OF PR 2016GENDER BALANCE & EQUAL PAYGender balance in relation to levels of seniority is shared to put data relating to equal pay and the gender pay gap in context. This information has been gleaned from the demographic profile of respondents. Independent practitioners have been factored in as 'Owners' in the first chart, but they have been excluded from the following two charts. All findings remain more or less unchanged from previous year's reports.
73%
70%
60%
48%
27%
30%
40%
52%
Non-manager Manager Head of Comms/ADs MD / Partner / Owners / IPsKey
Non-manager Manager Head of Comms/ADs MD / Partner / Owners / IPsKey
Non-manager Manager Head of Comms/ADs MD / Partner / Owners / IPsKey
SENIORITY BY SEX
Female
Male
SENIORITY BY SEX – IN-HOUSE ONLY
Female
Male
SENIORITY BY SEX CONSULTANCY ONLY
Female
Male
74%
67%
61%
45% 26%
33%
39%
55%
69%
81%
59%
49%
31%
19%
41%
51%
33❰ CONTENTS
#StateOfPR
STATE OF PR 2016GENDER BALANCE & EQUAL PAY
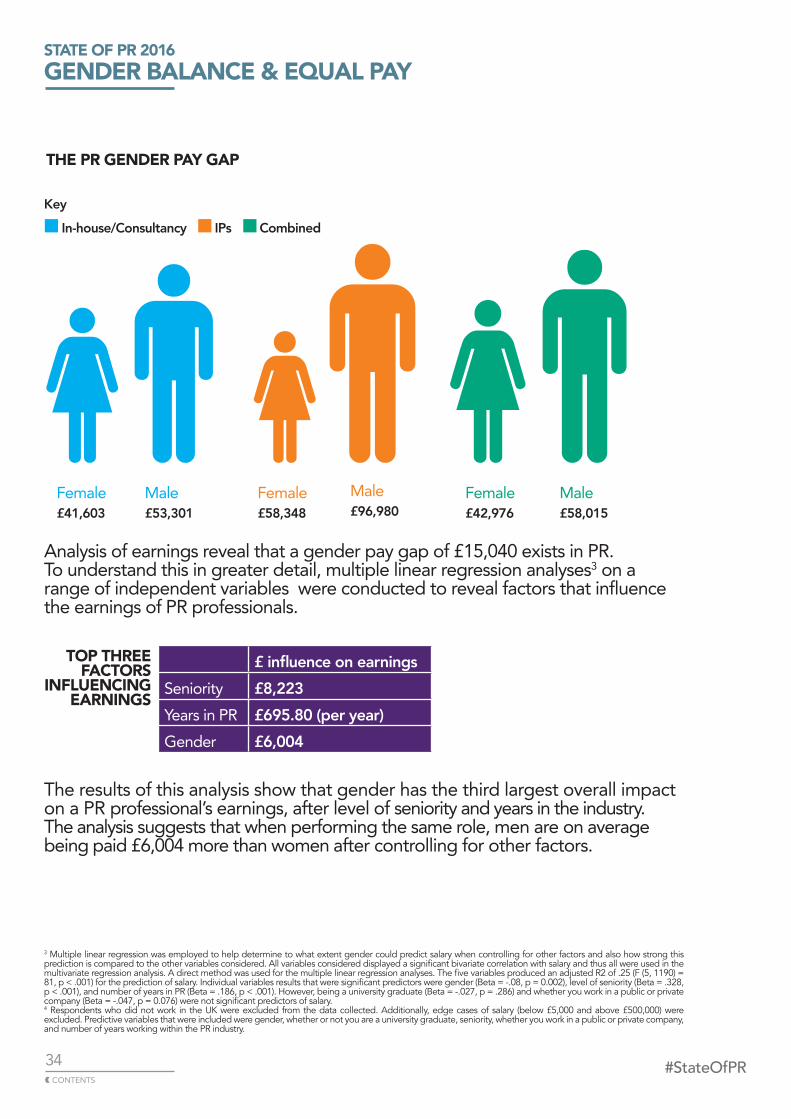
£41,603 £53,301 £58,348 £42,976£96,980 £58,015Female Female FemaleMale Male Male
Analysis of earnings reveal that a gender pay gap of £15,040 exists in PR. To understand this in greater detail, multiple linear regression analyses3 on a range of independent variables were conducted to reveal factors that influence the earnings of PR professionals.
3 Multiple linear regression was employed to help determine to what extent gender could predict salary when controlling for other factors and also how strong this prediction is compared to the other variables considered. All variables considered displayed a significant bivariate correlation with salary and thus all were used in the multivariate regression analysis. A direct method was used for the multiple linear regression analyses. The five variables produced an adjusted R2 of .25 (F (5, 1190) = 81, p < .001) for the prediction of salary. Individual variables results that were significant predictors were gender (Beta = -.08, p = 0.002), level of seniority (Beta = .328, p < .001), and number of years in PR (Beta = .186, p < .001). However, being a university graduate (Beta = -.027, p = .286) and whether you work in a public or private company (Beta = -.047, p = 0.076) were not significant predictors of salary.4 Respondents who did not work in the UK were excluded from the data collected. Additionally, edge cases of salary (below £5,000 and above £500,000) were excluded. Predictive variables that were included were gender, whether or not you are a university graduate, seniority, whether you work in a public or private company, and number of years working within the PR industry.
In-house/Consultancy IPs CombinedKey
The results of this analysis show that gender has the third largest overall impact on a PR professional’s earnings, after level of seniority and years in the industry. The analysis suggests that when performing the same role, men are on average being paid £6,004 more than women after controlling for other factors.
TOP THREE FACTORS
INFLUENCING EARNINGS
£ influence on earningsSeniority £8,223Years in PR £695.80 (per year)Gender £6,004
THE PR GENDER PAY GAP
34❰ CONTENTS
#StateOfPR
-£ 1,290.64
-£ 1,496.51
-£ 5,634.75
-£ 24,770.47
-£11,576.12
-£5,538.93
-£2,550.80
-£22,204.96
-£38,631.96
STATE OF PR 2016GENDER BALANCE & EQUAL PAYFor the first time, the gender gap has been cross-analysed by three different demographics in an attempt to offer greater insight into the issue.
DIFFERENCE IN EARNINGS BETWEEN WOMEN AND MEN BY SENIORITY
DIFFERENCE IN EARNINGS BETWEEN WOMEN AND MEN BY ORGANISATION TYPE
Non-Manager
ManagerHead of Comms / ADsMD / Partner / Owner / IPs
In-House Private SectorIn-House Public SectorIn-House Not-for-Profit/NGOConsultancy/AgencyIndependent Practitioner
+£2,651.15
-£ 285.25
-£ 13,025.80
-£ 13,760.53
-£ 50,779.41
DIFFERENCE IN EARNINGS BETWEEN WOMEN AND MEN BY AGE
18 to 24
25 to 34
35 to 44
45 to 60
Over 60
This data clearly evidences that the gender pay gap exists for multiple reasons. Seniority is the biggest single determining factor, but the type of organisation is also important, despite there being a close to 50/50 split of men and women operating at the most senior level across all types of organisations. This strongly indicates that the highest-paid roles in the industry remain unattainable to women, especially for those working in Consultancy, or choosing to work as Independent Practitioners.
35❰ CONTENTS
#StateOfPR
STATE OF PR 2016 7
DIVERSITY
BAME PR pros make up 10% of practitioners across the profession. Despite this, in all but one area of diversity, a majority of PR pros now agree that campaigns carried out by diverse teams are more effective.
❰ CONTENTS#StateOfPR
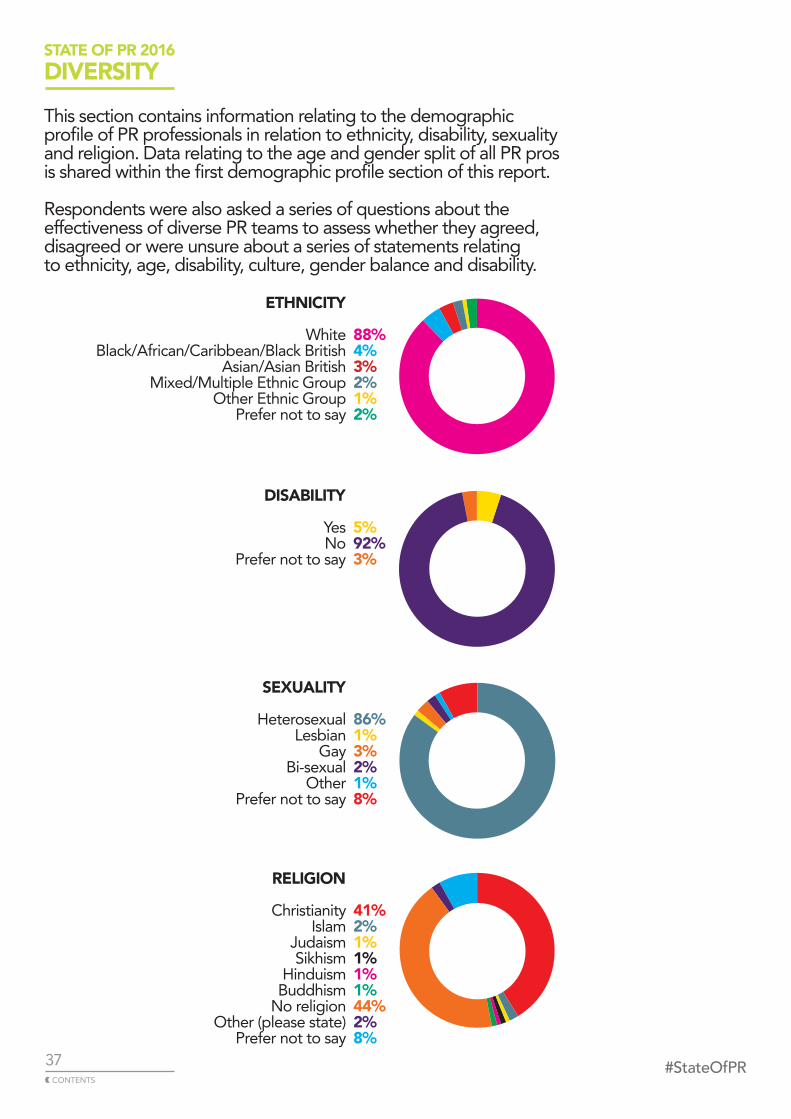
STATE OF PR 2016DIVERSITYThis section contains information relating to the demographic profile of PR professionals in relation to ethnicity, disability, sexuality and religion. Data relating to the age and gender split of all PR pros is shared within the first demographic profile section of this report.
Respondents were also asked a series of questions about the effectiveness of diverse PR teams to assess whether they agreed, disagreed or were unsure about a series of statements relating to ethnicity, age, disability, culture, gender balance and disability.
ETHNICITY
White 88% Black/African/Caribbean/Black British 4% Asian/Asian British 3% Mixed/Multiple Ethnic Group 2% Other Ethnic Group 1% Prefer not to say 2%
DISABILITY
Yes 5% No 92% Prefer not to say 3%
SEXUALITY
Heterosexual 86% Lesbian 1% Gay 3% Bi-sexual 2% Other 1% Prefer not to say 8%
RELIGION Christianity 41% Islam 2% Judaism 1% Sikhism 1% Hinduism 1% Buddhism 1% No religion 44% Other (please state) 2% Prefer not to say 8%
37❰ CONTENTS
#StateOfPR

Ethnically diverse
Socially diverse
Of all ages
Representative of the audience(s) they are communicating with
Culturally diverse
Made up of a proportionate number of men and women
Made up of a proportionate number of people with and
without disabilities
ATTITUDES TO DIVERSITYAre PR campaigns more effectivewhen delivered by teams who are...?
51% 27%
22%
68%
18%
14%
65% 21%
14%
62%
27%
11%
64%
20%
15% 52% 30%
17%
27%
39%
35%
Agree Disagree Don’t knowKey
STATE OF PR 2016DIVERSITY
The only statement that the majority of respondents disagreed with related to disability. Just over a quarter (26%) of professionals agreed that public relations campaigns are more effective if practiced by teams comprising of a proportionate number of people with and without disabilities, whilst 39% disagreed. Interestingly, consultancy professionals were far more likely to disagree with all of the statements relating to diversity.
Data relating to attitudes to diversity is broadly consistent with last year’s survey results.
38❰ CONTENTS
#StateOfPR

STATE OF PR 2016 8
FURTHER ISSUES & CURRENT DEBATES
PR pros judge themselves to a different standard than when compared to other professions; convergence across the marketing mix shows little sign of slowing down, and the under-representation of PR at board level is cited as the biggest future challenge.
❰ CONTENTS#StateOfPR
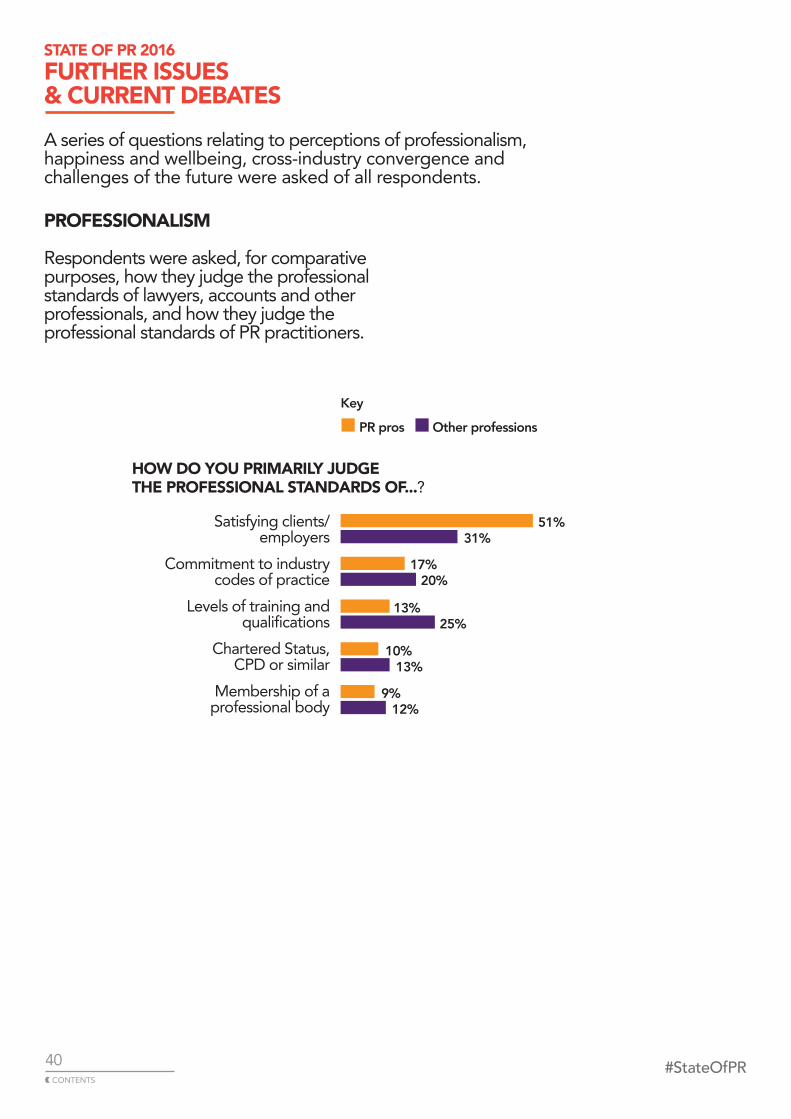
STATE OF PR 2016FURTHER ISSUES& CURRENT DEBATESA series of questions relating to perceptions of professionalism, happiness and wellbeing, cross-industry convergence and challenges of the future were asked of all respondents.
Satisfying clients/employers
Commitment to industry codes of practice
Levels of training and qualifications
Chartered Status, CPD or similar
Membership of a professional body
51% 31%
17%
20%
13%
25%
10%
13%
9%
12%
HOW DO YOU PRIMARILY JUDGETHE PROFESSIONAL STANDARDS OF...?
PROFESSIONALISM
Respondents were asked, for comparative purposes, how they judge the professional standards of lawyers, accounts and other professionals, and how they judge the professional standards of PR practitioners.
PR pros Other professionsKey
40❰ CONTENTS
#StateOfPR

40%
47%
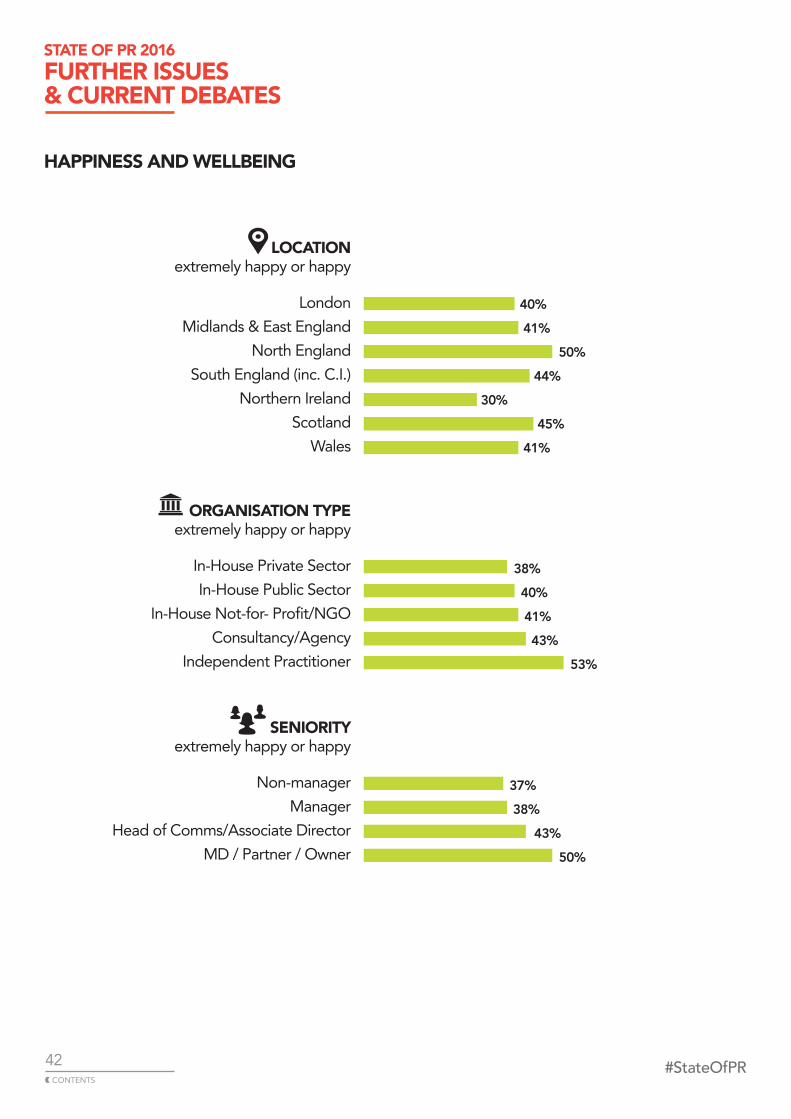
HAPPINESS AND WELLBEING
Respondents were asked to rate their current level of happiness and wellbeing in the workplace, on a scale where 1 is extremely happy and 5 is not happy at all.
HAPPINESSAND WELLBEING
42% are extremely happy or happy in the workplace
30% are somewhat unhappy or not at all happy
in the workplace
18 to 2425 to 3435 to 4445 to 60Over 60
40%
37%
43%
46%
55%
42%
30%
AGE extremely happy or happy
FemaleMale
SEX extremely happy or happy
STATE OF PR 2016FURTHER ISSUES& CURRENT DEBATES
41❰ CONTENTS
#StateOfPR
LondonMidlands & East England
North EnglandSouth England (inc. C.I.)
Northern IrelandScotland
Wales
40%
41%
50% 44%
30%
45% 41%
LOCATION extremely happy or happy
In-House Private SectorIn-House Public Sector
In-House Not-for- Profit/NGOConsultancy/Agency
Independent Practitioner
38%
40%
41%
43%
53%
ORGANISATION TYPE extremely happy or happy
Non-managerManager
Head of Comms/Associate DirectorMD / Partner / Owner
37%
38%
43%
50%
SENIORITY extremely happy or happy
HAPPINESS AND WELLBEING
STATE OF PR 2016FURTHER ISSUES& CURRENT DEBATES
42❰ CONTENTS
#StateOfPR
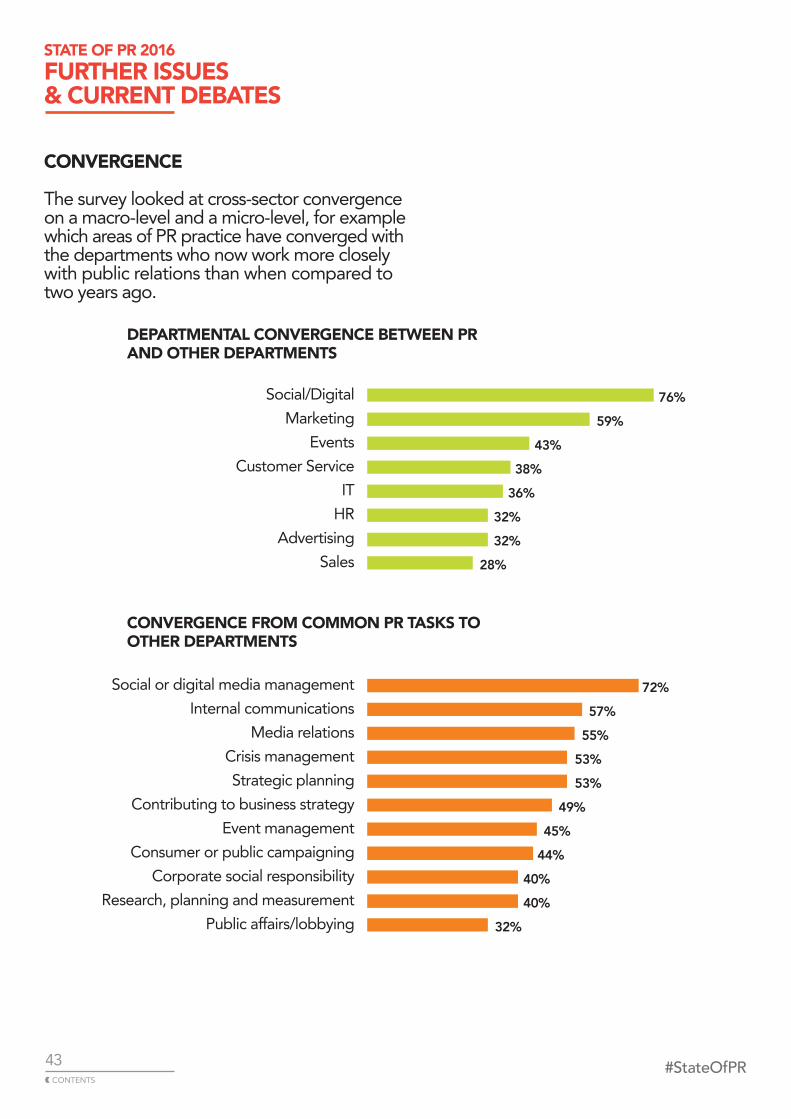
Social/Digital Marketing
Events Customer Service
ITHR
AdvertisingSales
76%
59% 43%
38%
36%
32%
32%
28%
DEPARTMENTAL CONVERGENCE BETWEEN PR AND OTHER DEPARTMENTS
Social or digital media managementInternal communications
Media relationsCrisis managementStrategic planning
Contributing to business strategy Event management
Consumer or public campaigningCorporate social responsibility
Research, planning and measurementPublic affairs/lobbying
72%
57% 55% 53% 53% 49%
45% 44%
40%
40%
32%
CONVERGENCE FROM COMMON PR TASKS TO OTHER DEPARTMENTS
CONVERGENCE
The survey looked at cross-sector convergence on a macro-level and a micro-level, for example which areas of PR practice have converged with the departments who now work more closely with public relations than when compared to two years ago.
STATE OF PR 2016FURTHER ISSUES& CURRENT DEBATES
43❰ CONTENTS
#StateOfPR
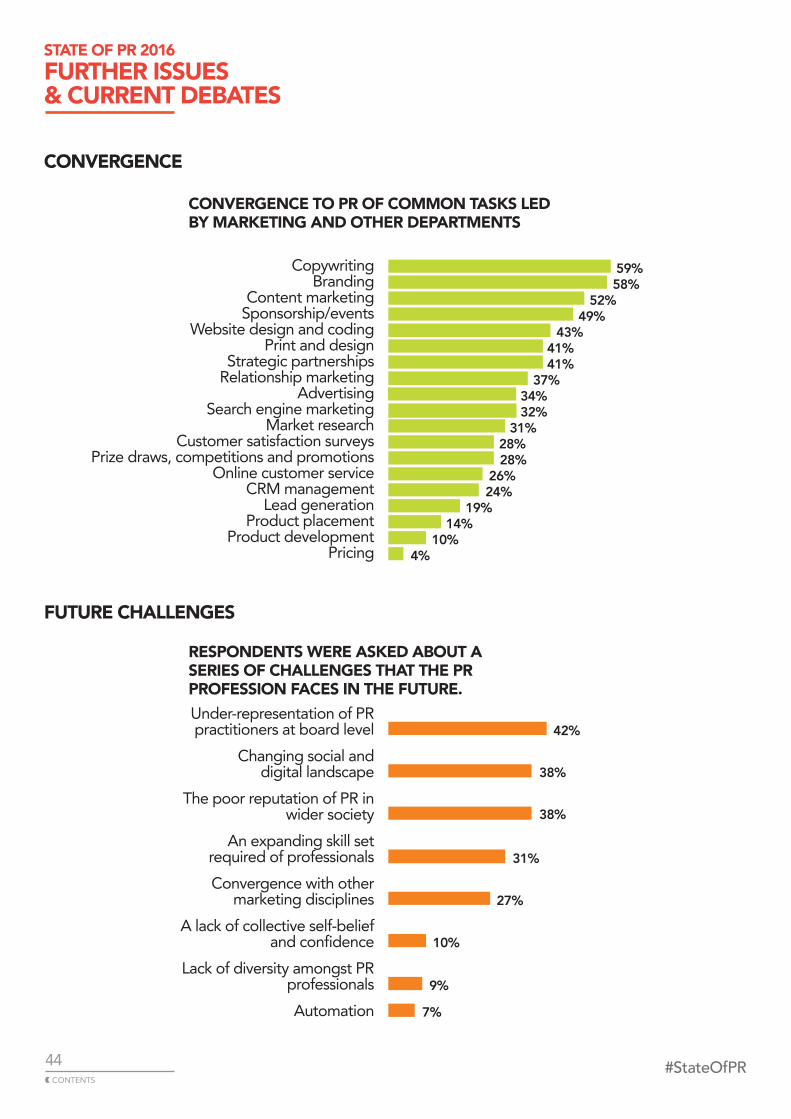
CopywritingBranding
Content marketing Sponsorship/events
Website design and coding Print and design
Strategic partnerships Relationship marketing
Advertising Search engine marketing
Market researchCustomer satisfaction surveys
Prize draws, competitions and promotionsOnline customer service
CRM managementLead generation
Product placement Product development
Pricing
59% 58% 52% 49%
43%
41%
41%
37%
34%
32%
31%
28%
28%
26%
24%
19%
14%
10%
4%
CONVERGENCE TO PR OF COMMON TASKS LED BY MARKETING AND OTHER DEPARTMENTS
STATE OF PR 2016FURTHER ISSUES& CURRENT DEBATES
CONVERGENCE
FUTURE CHALLENGES
Under-representation of PR practitioners at board level
Changing social and digital landscape
The poor reputation of PR in wider society
An expanding skill set required of professionals Convergence with other
marketing disciplines A lack of collective self-belief
and confidence Lack of diversity amongst PR
professionals Automation
42%
38%
38%
31%
27%
10%
9%
7%
RESPONDENTS WERE ASKED ABOUT A SERIES OF CHALLENGES THAT THE PR PROFESSION FACES IN THE FUTURE.
44❰ CONTENTS
#StateOfPR

INSIGHT TO INFORM ____#StateOfPR
Chartered Institute of Public Relations52–53 Russell SquareLondon WC1B 4HP
+44 (0)20 7631 [email protected]
dark
hors
edes
ign.
co.u
k