state of the vitiviniculture world market … · state of the vitiviniculture world market ......
TRANSCRIPT
1
STATE OF THE VITIVINICULTURE WORLD MARKET
April 2016

2
Table of contents
1. VITIVINICULTURAL PRODUCTION POTENTIAL 3
2. WINE PRODUCTION 6
3. WINE CONSUMPTION 8
4. INTERNATIONAL TRADE 10
Abbreviations:
kha: thousands of hectares
mha: millions of hectares
khl: thousands of hectolitres
mhl: millions of hectolitres
bn: billion
m: millions
EUR: euros
3
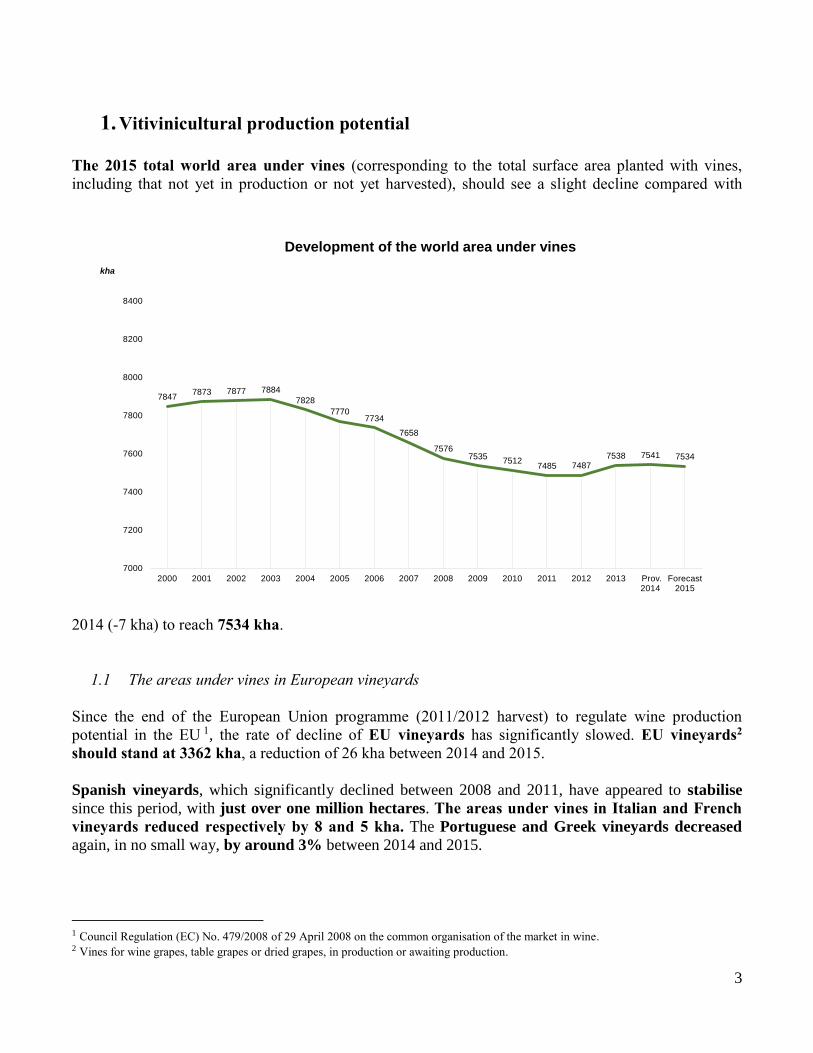
1. Vitivinicultural production potential
The 2015 total world area under vines (corresponding to the total surface area planted with vines,
including that not yet in production or not yet harvested), should see a slight decline compared with
2014 (-7 kha) to reach 7534 kha.
1.1 The areas under vines in European vineyards
Since the end of the European Union programme (2011/2012 harvest) to regulate wine production
potential in the EU 1, the rate of decline of EU vineyards has significantly slowed. EU vineyards2
should stand at 3362 kha, a reduction of 26 kha between 2014 and 2015.
Spanish vineyards, which significantly declined between 2008 and 2011, have appeared to stabilise
since this period, with just over one million hectares. The areas under vines in Italian and French
vineyards reduced respectively by 8 and 5 kha. The Portuguese and Greek vineyards decreased
again, in no small way, by around 3% between 2014 and 2015.
1 Council Regulation (EC) No. 479/2008 of 29 April 2008 on the common organisation of the market in wine. 2 Vines for wine grapes, table grapes or dried grapes, in production or awaiting production.
78477873 7877 7884
7828
77707734
7658
75767535
75127485 7487
7538 7541 7534
7000
7200
7400
7600
7800
8000
8200
8400
2000 2001 2002 2003 2004 2005 2006 2007 2008 2009 2010 2011 2012 2013 Prov. 2014
Forecast 2015
kha
Development of the world area under vines
4
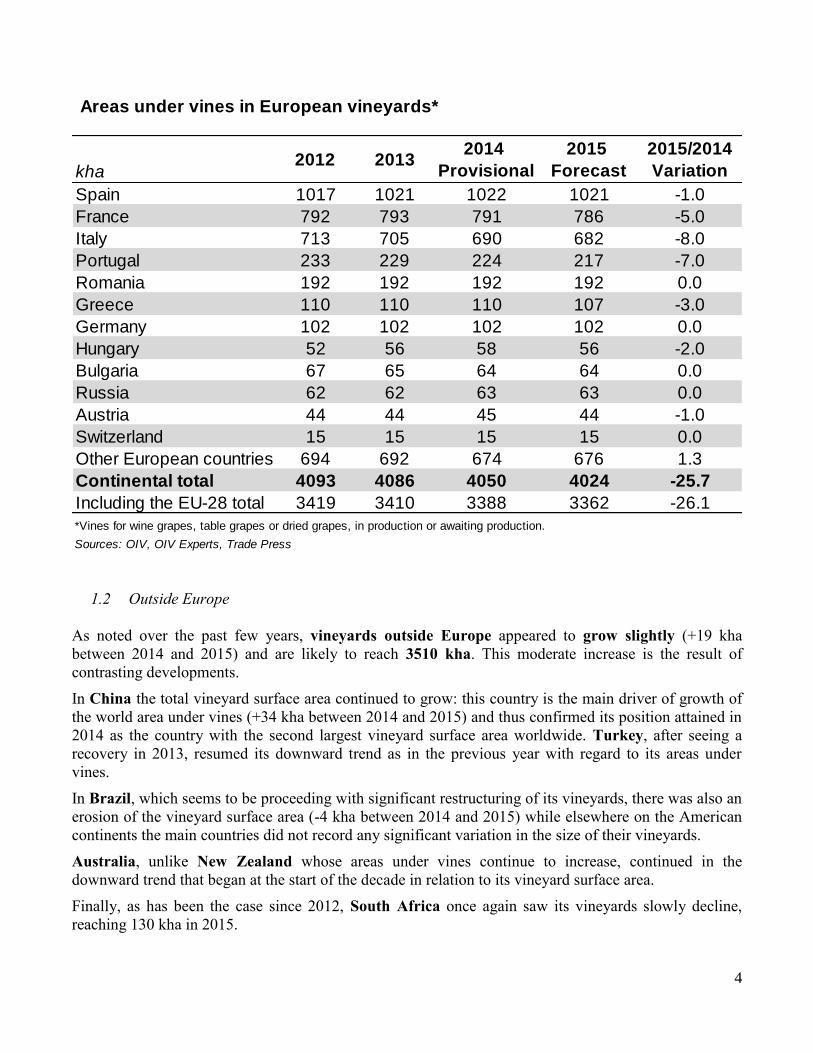
Areas under vines in European vineyards*
Spain 1017 1021 1022 1021 -1.0
France 792 793 791 786 -5.0
Italy 713 705 690 682 -8.0
Portugal 233 229 224 217 -7.0
Romania 192 192 192 192 0.0
Greece 110 110 110 107 -3.0
Germany 102 102 102 102 0.0
Hungary 52 56 58 56 -2.0
Bulgaria 67 65 64 64 0.0
Russia 62 62 63 63 0.0
Austria 44 44 45 44 -1.0
Switzerland 15 15 15 15 0.0
Other European countries 694 692 674 676 1.3
Continental total 4093 4086 4050 4024 -25.7
Including the EU-28 total 3419 3410 3388 3362 -26.1
Sources: OIV, OIV Experts, Trade Press
2015/2014
Variation
2015
Forecast
2014
Provisional
*Vines for wine grapes, table grapes or dried grapes, in production or awaiting production.
kha2012 2013
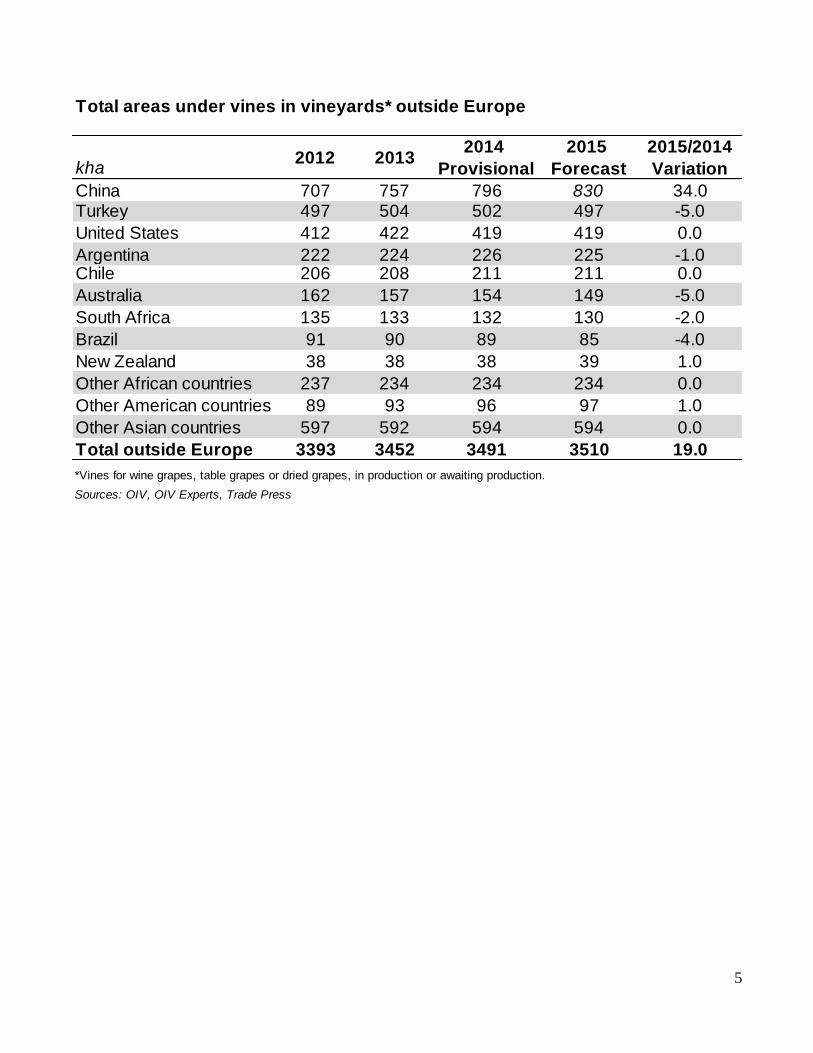
1.2 Outside Europe
As noted over the past few years, vineyards outside Europe appeared to grow slightly (+19 kha
between 2014 and 2015) and are likely to reach 3510 kha. This moderate increase is the result of
contrasting developments.
In China the total vineyard surface area continued to grow: this country is the main driver of growth of
the world area under vines (+34 kha between 2014 and 2015) and thus confirmed its position attained in
2014 as the country with the second largest vineyard surface area worldwide. Turkey, after seeing a
recovery in 2013, resumed its downward trend as in the previous year with regard to its areas under
vines.
In Brazil, which seems to be proceeding with significant restructuring of its vineyards, there was also an
erosion of the vineyard surface area (-4 kha between 2014 and 2015) while elsewhere on the American
continents the main countries did not record any significant variation in the size of their vineyards.
Australia, unlike New Zealand whose areas under vines continue to increase, continued in the
downward trend that began at the start of the decade in relation to its vineyard surface area.
Finally, as has been the case since 2012, South Africa once again saw its vineyards slowly decline,
reaching 130 kha in 2015.
5
China 707 757 796 830 34.0Turkey 497 504 502 497 -5.0
United States 412 422 419 419 0.0
Argentina 222 224 226 225 -1.0Chile 206 208 211 211 0.0
Australia 162 157 154 149 -5.0
South Africa 135 133 132 130 -2.0
Brazil 91 90 89 85 -4.0
New Zealand 38 38 38 39 1.0
Other African countries 237 234 234 234 0.0
Other American countries 89 93 96 97 1.0
Other Asian countries 597 592 594 594 0.0
Total outside Europe 3393 3452 3491 3510 19.0
*Vines for wine grapes, table grapes or dried grapes, in production or awaiting production.
Sources: OIV, OIV Experts, Trade Press
2015/2014
Variation kha2012 2013
2014
Provisional
2015
Forecast
Total areas under vines in vineyards* outside Europe

6
2. Wine production3
World wine production4 (excluding juice & must) was relatively high in 2015. It reached 274.4 mhl,
equating to +5.8 mhl compared with 2014 production.
280
266 257
264
296
278 283
268 269 272 264 267
258
289
269 274
100
150
200
250
300
350
mhl
World wine production(excluding juice & must)
2.1 Within the European Union
2015 EU vinified production is likely to reach 165.8 mhl, which may be described as over average.
Wine production indeed stands at a higher level than that of 2014 by almost 6 mhl.
In relation to the average production levels of the main producers in 2014, significant growth was
recorded in Italian production with 49.5 mhl (+5.3 mhl/2014) while Spanish production levels
slightly declined to 37.2 mhl (-2.3 mhl/2014). With 47.6 and 8.9 mhl respectively, France and
Germany were relatively stable (+1 and -0.3 mhl/2014). Production in Portugal and Bulgaria increased
(+0.5 and +0.8 mhl/2014 respectively), although Bulgarian production was very low in 2014.
3 This is the wine production resulting from grapes harvested in autumn 2015 in the northern hemisphere and in spring of the
same year in the southern hemisphere. 4 2015 Wine production is valued at a mid-range estimate of between 271.3 and 277.5 mhl, which is between +1.0% and
+3.3% compared with 2014.

7
Wine production (excluding juice and must) (1)
mhl 2011 2012 2013
2014
Provisional
2015
Forecast
2015/2014
Variation
in volume
2015/2014
Variation
in %
Ranking
Italy 42,8 45,6 54,0 44,2 49,5 5,3 12% 1
France 50,8 41,5 42,1 46,5 47,5 1,0 2% 2
Spain 33,4 31,1 45,3 39,5 37,2 -2,3 -6% 3
United States (2) 19,1 21,7 23,6 22,0 22,1 0,1 1% 4
Argentina 15,5 11,8 15,0 15,2 13,4 -1,8 -12% 5
Chile 10,5 12,6 12,8 10,0 12,9 2,8 28% 6
Australia 11,2 12,3 12,3 11,9 11,9 0,0 0% 7
South Africa 9,7 10,6 11,0 11,5 11,2 -0,2 -2% 8
China 13,2 13,5 11,8 11,6 11,0 -0,6 -5% 9
Germany 9,1 9,0 8,4 9,2 8,9 -0,3 -4% 10
Portugal 5,6 6,3 6,2 6,2 6,7 0,5 8% 11
Russian Federation 7,0 6,2 5,3 4,9 4,9 0,0 0% 12
Romania 4,1 3,3 5,1 3,7 3,5 -0,2 -6% 13
Hungary 2,8 1,8 2,6 2,6 2,9 0,3 12% 14
Brazil 3,5 3,0 2,7 2,7 2,8 0,1 2% 15
Greece 2,8 3,1 3,3 2,8 2,7 -0,2 -5% 16
New Zealand 2,4 1,9 2,5 3,2 2,3 -0,9 -27% 17
Serbia 2,2 2,2 2,3 2,3 2,3 0,0 0% 18
Austria 2,8 2,1 2,4 2,0 2,3 0,3 13% 19
Georgia 1,1 0,8 1,0 1,1 1,7 0,6 0% 20
Moldova 1,5 1,5 2,6 1,6 1,7 0,0 0% 21
Ukraine 3,2 2,4 2,8 1,5 1,5 0,3 13% 22
Bulgaria 1,2 1,4 1,8 0,7 1,3 0,5 0% 23
OIV World Total (3) 267,8 258,2 288,9 268,6 274,4 5,8 2%Sources: OIV, OIV Experts, Trade Press
(1): Countries for which information has been provided with a wine production of more than 1 mhl
(2): OIV estimate (USDA basis)
(3): Mid-range estimate: 271.3 to 277.5 mhl
2.2 Outside the European Union
There were contrasting developments in these regions:
With 22.1 mhl (excluding juice and must), the United States should record a wine production
almost as high as that of 2014 (22 mhl) – however, both years represent a decline considering the
very high production levels in 2013 (23.6 mhl).
In South America, Argentine wine production declined by 12.1% in 2015 to 13.4 mhl (with juice
& must production decreasing by only 0.3 mhl), while Chile – which recorded a drop in its wine
production in 2014 to 10 mhl – returned to a level of production close to or perhaps even slightly
higher than its all-time record in 2013 with 12.9 mhl. As for Brazil, its production stayed stable
for the second year running, with nearly 2.8 mhl vinified.
In South Africa, vinified production reached a high level for the third year running in 2015 with
11.2 mhl – although this constitutes a small drop compared with that of 2014 (11.5 mhl).
Australian production re-established itself at 12 mhl vinified in 2015 – despite the continued
decline of its vineyard surface area – while New Zealand production (2.3 mhl) returned to a level
close to that of 2013, thus recording a downturn compared with the record harvest of 2014 (3.2 mhl).

8
3. Wine consumption
2015 World wine consumption is estimated at 240 mhl5 – a moderate increase of 0.9 mhl compared
with 2014 – which, given the margin of error in relation to global consumption, should be considered
with caution.
Since the beginning of the economic and financial crisis of 2008, global consumption seems to have
stabilised overall at around 240 mhl.
226228
230
237 237 237
245
250 250
242241
243 244 243
239 240
200
210
220
230
240
250
260
270
2000 2001 2002 2003 2004 2005 2006 2007 2008 2009 2010 2011 2012 2013 Prov. 2014
Forecast 2015
mhlTrends in world wine consumption
The United States, whose consumption is estimated at 31 mhl, has now broadly established itself as the
largest domestic market in the world, with an almost stable level compared with the previous year's
consumption (+1%).
The reduction in the consumption of traditional producer and consumer countries in Europe experienced
a pause: there was a slight fall in France (27.2 mhl), very modest growth in Italy (20.5 mhl, +0.1
mhl/2014) and in Portugal (4.8 mhl), and stabilisation in Spain (10 mhl).
A drop in consumption should be recorded in Austria and the Netherlands, together with an absence
of recovery in the Greek domestic market after a relatively substantial decline between 2013 and
2014.
In Northern Europe, Germany (20.5 mhl) and the United Kingdom (12.9 mhl) saw a growth in their
domestic markets of nearly 300 khl compared with 2014 (even though in the United Kingdom, this
result does little more than to compensate for the fall recorded between 2013 and 2014), while overall
the Scandinavian market remained stable. Domestic consumption levels in Germany and Italy are now
very similar.
5 Using the same analysis method as for wine production, the 2015 world wine consumption level is estimated at between
235.6 and 244.3 mhl, which corresponds to a mid-range estimate of 240.0 mhl.

9
In China, 2015 consumption, established by means of a balance sheet-based report 6, should approach
16 mhl (an upward trend of 3% compared with 15.5 mhl in 2014, a year which marked a halt to the
rapid growth in Chinese demand that started at the beginning of the 2000s).
In Oceania, considering as a whole based on the Australian and New Zealand markets, consumption
seems to have remained stable at 6.3 mhl for three years (with a slight decline in Australia and
resumption of growth in New Zealand).
Consumption in South Africa should once again see a significant rise between 2014 and 2015 to reach
4.2 mhl (+7%/2014, after an increase of the same magnitude as the previous year).
In South America, domestic consumption in 2015 was higher than in 2014, especially in Argentina
(although in relation to a low level in 2014, meaning the level of consumption neared that of 2013 with
10.3 mhl) but also in Chile (whose overall consumption nevertheless appears to have stabilised at just
under 3 mhl) and in Brazil (3.6 mhl, +2%/2014).
In Hungary and especially in Romania (with a decline estimated at 17%/2014), domestic consumption
decreased; however, it is difficult to monitor Romanian consumption at home, which accounts for close
to 50% of the domestic market share.
Main wine-consuming countries Provisional Forecast % variation
2014 2015 2015/2014
United States 28.3 29.2 30.3 30.7 31.0 1.0%
France 28.3 28.0 27.8 27.5 27.2 -1.2%
Italy 23.1 22.6 21.8 20.4 20.5 0.3%
Germany 19.7 20.3 20.4 20.3 20.5 1.1%
China 16.3 17.1 16.5 15.5 16.0 3.2%
United Kingdom 12.9 12.8 12.7 12.6 12.9 2.4%
Argentina 9.8 10.1 10.4 9.9 10.3 3.2%
Spain 10.0 9.9 9.8 9.9 10.0 1.3%
Russia 12.2 11.3 10.4 9.6 8.9 -7.0%
Australia 5.3 5.4 5.4 5.4 5.4 -1.0%
Portugal 4.7 5.0 4.8 4.7 4.8 1.6%
South Africa 3.5 3.6 3.7 4.0 4.2 7.5%
Romania 4.1 4.3 4.6 4.7 3.9 -17.3%
Netherlands 3.4 3.5 3.5 3.4 3.3 -3.3%
Greece 2.9 3.1 3.0 2.6 2.6 -1.7%
Sweden 2.3 2.3 2.4 2.5 2.6 2.0%
Austria 2.6 2.5 2.5 2.5 2.4 -6.5%
Hungary 2.1 2.0 1.9 2.2 2.1 -2.8%
Denmark 1.9 1.5 1.6 1.6 1.6 -2.9%
Rest of the World 49.5 49.1 49.5 49.0 49.9 1.9%
WORLD (1) 242.8 243.6 243.0 239.1 240.0 0.4%Sources: OIV, OIV Experts, Trade Press
(1) Mid-range estimate: 235.5 to 244.4 mhl
mhl2011 2012 2013
6 The development in consumption between year n-1 and year n is considered here to be half determined by the apparent
consumption for the current year (calculated by "Production + Imports - Exports") and half by the consumption for the
previous year.
10
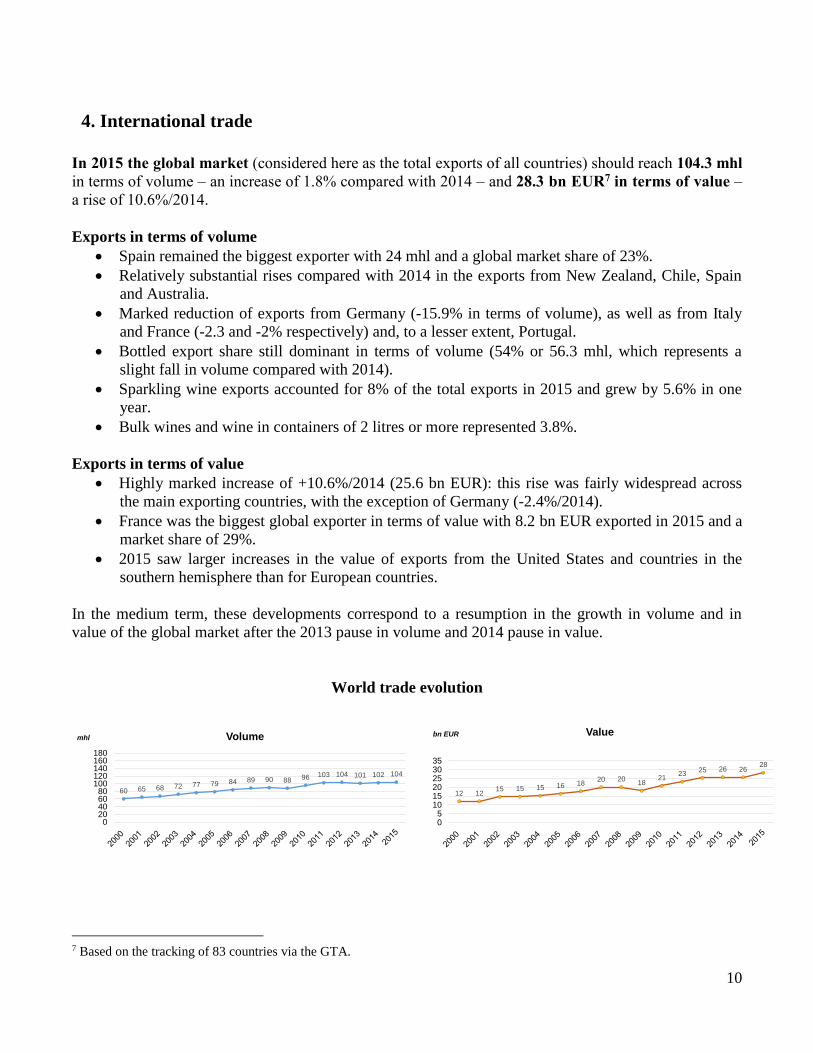
60 65 68 72 77 79 84 89 90 88 96 103 104 101 102 104
020406080
100120140160180
mhl Volume
12 1215 15 15 16 18
20 2018
2123
25 26 2628
05
101520253035
bn EUR Value
4. International trade
In 2015 the global market (considered here as the total exports of all countries) should reach 104.3 mhl
in terms of volume – an increase of 1.8% compared with 2014 – and 28.3 bn EUR7 in terms of value –
a rise of 10.6%/2014.
Exports in terms of volume
Spain remained the biggest exporter with 24 mhl and a global market share of 23%.
Relatively substantial rises compared with 2014 in the exports from New Zealand, Chile, Spain
and Australia.
Marked reduction of exports from Germany (-15.9% in terms of volume), as well as from Italy
and France (-2.3 and -2% respectively) and, to a lesser extent, Portugal.
Bottled export share still dominant in terms of volume (54% or 56.3 mhl, which represents a
slight fall in volume compared with 2014).
Sparkling wine exports accounted for 8% of the total exports in 2015 and grew by 5.6% in one
year.
Bulk wines and wine in containers of 2 litres or more represented 3.8%.
Exports in terms of value
Highly marked increase of +10.6%/2014 (25.6 bn EUR): this rise was fairly widespread across
the main exporting countries, with the exception of Germany (-2.4%/2014).
France was the biggest global exporter in terms of value with 8.2 bn EUR exported in 2015 and a
market share of 29%.
2015 saw larger increases in the value of exports from the United States and countries in the
southern hemisphere than for European countries.
In the medium term, these developments correspond to a resumption in the growth in volume and in
value of the global market after the 2013 pause in volume and 2014 pause in value.
World trade evolution
7 Based on the tracking of 83 countries via the GTA.
11
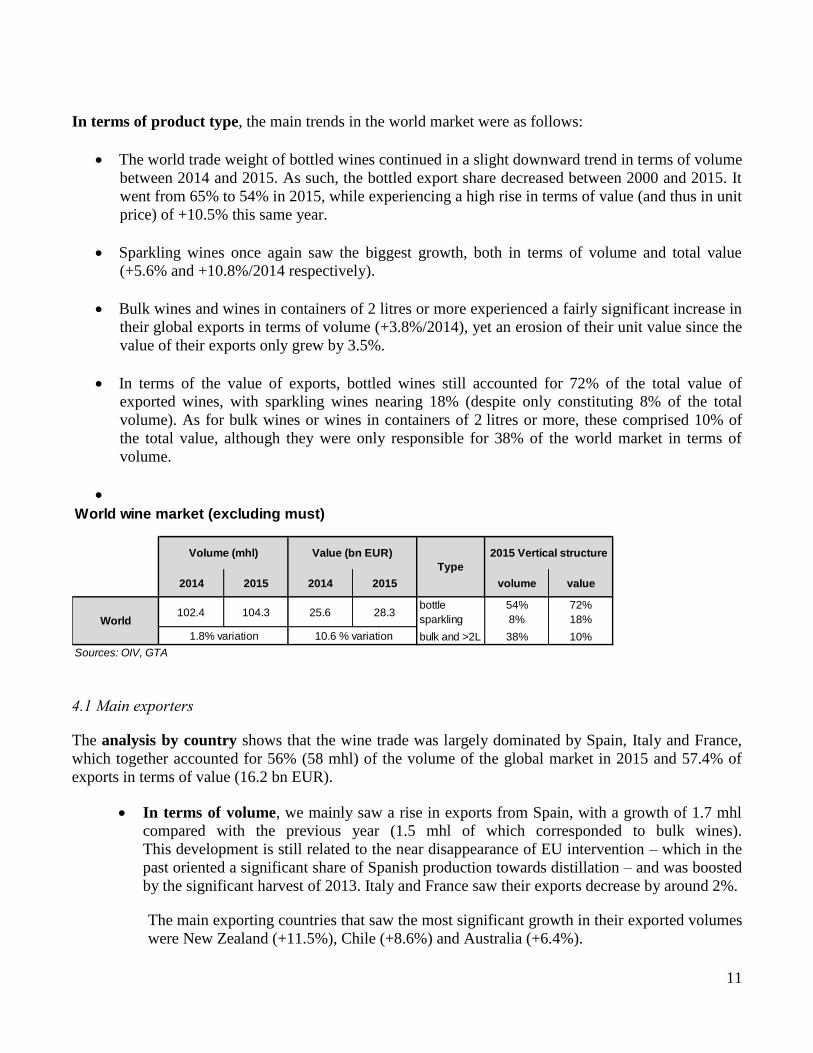
In terms of product type, the main trends in the world market were as follows:
The world trade weight of bottled wines continued in a slight downward trend in terms of volume
between 2014 and 2015. As such, the bottled export share decreased between 2000 and 2015. It
went from 65% to 54% in 2015, while experiencing a high rise in terms of value (and thus in unit
price) of +10.5% this same year.
Sparkling wines once again saw the biggest growth, both in terms of volume and total value
(+5.6% and +10.8%/2014 respectively).
Bulk wines and wines in containers of 2 litres or more experienced a fairly significant increase in
their global exports in terms of volume (+3.8%/2014), yet an erosion of their unit value since the
value of their exports only grew by 3.5%.
In terms of the value of exports, bottled wines still accounted for 72% of the total value of
exported wines, with sparkling wines nearing 18% (despite only constituting 8% of the total
volume). As for bulk wines or wines in containers of 2 litres or more, these comprised 10% of
the total value, although they were only responsible for 38% of the world market in terms of
volume.
2014 2015 2014 2015 volume value
bottle 54% 72%
sparkling 8% 18%
bulk and >2L 38% 10%
Sources: OIV, GTA
World102.4 104.3 25.6 28.3
1.8% variation 10.6 % variation
Volume (mhl) Value (bn EUR)
Type
2015 Vertical structure
World wine market (excluding must)
4.1 Main exporters
The analysis by country shows that the wine trade was largely dominated by Spain, Italy and France,
which together accounted for 56% (58 mhl) of the volume of the global market in 2015 and 57.4% of
exports in terms of value (16.2 bn EUR).
In terms of volume, we mainly saw a rise in exports from Spain, with a growth of 1.7 mhl
compared with the previous year (1.5 mhl of which corresponded to bulk wines).
This development is still related to the near disappearance of EU intervention – which in the
past oriented a significant share of Spanish production towards distillation – and was boosted
by the significant harvest of 2013. Italy and France saw their exports decrease by around 2%.
The main exporting countries that saw the most significant growth in their exported volumes
were New Zealand (+11.5%), Chile (+8.6%) and Australia (+6.4%).

12
In terms of value, Italy and France continued to dominate the market with shares of 19%
and 29% respectively.
Despite the high volume of Spanish exports, the significant market share of bulk wines (62%
in 2015) resulted in a lower average price for its overall exports than that which was observed
in Italy and France (where the bulk share is 25 and 16% respectively), meaning that Spain
only laid claim to 9% of the world trade value (and 23% of the volume, as mentioned above).
Conversely, for all of the other main exporting countries, the annual development in terms of
value were greater than the development in terms of volume in 2015.
In terms of product type, outside Spain (62%) and South Africa (88%), the countries
exporting a higher bulk share than the global average (38%, as mentioned above) were
Australia (56%), Chile and the United States (44%).
2014 2015 2014 2015
Sources: OIV, GTA
New Zealand 1.9 2.1 845 963
Argentina 2.6 2.7 631 737
Portugal 2.8 2.8 725 738
Germany 3.9 3.6 976 953
United States 4.0 4.2 1,103 1,395
South Africa 4.2 4.2 594 629
Australia 7.0 7.4 1,262 1,459
Chile 8.1 8.8 1,388 1,650
France 14.3 14.0 7,720 8,244
Italy, 20.4 20.0 5,081 5,353
Main wine exporters (excluding must)
Volume (mhl) Value (bn EUR)
Spain 22.3 24.0 2,529 2,641

13
4.2 The main importers
In 2015, wine imports rose to 102.6 mhl8: an increase of 1.3 mhl compared with 2014.
The 10 main importing countries, which represented 70% of world imports in terms of volume, saw a
growth of their imports of 3% in terms of volume and 9.4% in terms of value compared with 2014.
2014 2015 2014 2015
Sources: OIV, GTA
Japan 2.7 2.8 1,210 1,319
Belgium 3.1 3.2 997 930
Netherlands 3.8 3.5 954 867
Russia 4.7 4.0 865 625
Canada 3.8 4.1 1,465 1,618
China 3.9 5.6 1,145 1,840
France 6.9 7.8 621 669
United States 10.7 11.0 4,038 4,855
United Kingdom 13.6 13.6 3,602 3,915
Main wine importers (excluding must)
Volume (mhl) Value (bn EUR)
Germany 15.4 15.1 2,557 2,466
Germany was indeed still the top country in terms of volume, since it remained stable at just
over 15 mhl since 2012, however it recorded another decrease in the value of its imports in 2015
with less than 2.5 bn EUR, which is a reduction of 3.6% compared with the previous year.
The United States, after having seen a reduction in its imports in 2014, once again experienced
an increase in its imported volumes, reaching 11 mhl (+2.6%). However, the growth in terms of
the value of its imports – which was not interrupted in 2014 – was remarkable: +20.2%.
Therefore, with 4.9 bn EUR imported in 2015, the United States remained the biggest importer in
terms of value, while coming in third in terms of volume after Germany and the United
Kingdom.
As in 2014, the United Kingdom imported 13.6 mhl, yet at a significantly higher value: 3.9 bn
EUR (+8.7%/2014).
8 The difference between the total imports of all of the countries in the world and the world market is related in particular to
the inward-processing arrangements.

14
France saw significant growth in its imported volume with 7.7 mhl (relative nevertheless to a
notable year in 2014: +12%). This was a sign of its structural deficit in relation to entry-level
wines, which were unable to make up for a series of harvests that, in quantitative terms, were
average at best. It was the demand for bulk wines at low prices, especially from Spain, that led to
lower growth in the value of its imports (669 m EUR: +7.7%/2014).
China saw a very significant rise in its imports in 2015 with 5.5 mhl (+44%), particularly in
bulk, yet this was accompanied by an even higher increase in their value given the substantial
rise (although lower in relative terms than that of the bulk market) of bottled imports (1.8 bn
EUR: +64.5%/2014). The Chinese domestic demand was the biggest contributory factor, in
terms of volume, to trade growth in 2015.
Canada once again saw its import volume increase between 2014 and 2015 by 0.3 mhl (+7.4%),
thus surpassing 4 mhl. The overall value of its imports also rose by 10.4% to reach 1.6 bn EUR.
As for the previous year, the biggest reduction with regard to import volume and value was in
Russia, where the drop reached -14.5%/2014 in terms of volume (4 compared with 4.6 mhl in
2014) and -27.7% in terms of value (625 m EUR compared with 865 m EUR in 2014) – a
consequence of the embargo and the economic difficulties induced.
67%
57%
81%
68%
71%
44%
14%
66%
56%
37%
12%
13%
2%
3%
2%
6%
2%
9%
10%
4%
21%
27%
17%
28%
26%
50%
75%
25%
34%
59%
Japan
Belgium
Netherlands
Canada
China
Russia
France
UnitedStates
UnitedKingdom
Germany
Import share of types of wine in terms of volume
Bottled Sparkling Bulk >2L
Sources: OIV, GTA