state of utah department of natural resources
TRANSCRIPT


STATE OF UTAHDEPARTMENT OF NATURAL RESOURCES
Technical Publication No. 47
HYDROLOGIC RECONNAISSANCE OF THE WAH WAH VALLEY DRAINAGE BASIN,MILLARD AND BEAVER COUNTIES, UTAH
by
Jerry C. Stephens, HydrologistU.S. Geological Survey
Prepared bythe United States Geological Survey
in cooperation withthe Utah Department of Natural Resources
Division of Water Rights
1974


CONTENTS
Abstract.Introduction.General hydrologic environment.
PhysiographyClimate.Vegetation •Geology.
Hydrology and water-resource development.Surface water.Ground water
Quaternary and Tertiary sedimentary rocksStream-channel alluvium.Spring deposits.Older alluvium •
Tertiary igneous rocks.Extrusive rocks.Intrusive rocks.
Paleozoic and Precambrian rocksCarbonate rocks.
Wah Wah SpringsQuartzite and metasedimentary rocks.
Summary of ground-water recharge and discharge.Chemical quality and temperature of the water.
Summary and needs for future study.Selected referencesAppendix.
Numbering system for hydrologic-data sitesUse of metric units.
Basic data.Publications of the Utah Department of Natural Resources,
Division of Water Rights.
iii
Page
122555799
1113131414191920212121252627293235363639
47

ILLUSTRATIONS
Page
Plate 1. Generalized hydrogeologic and geologic maps andsections of the Wah Wah Valley drainage basin. In pocket
Figure 1. Map showing location of the Wah Wah Valley drainagebasin and areas described in previously publishedreports in this series • • • • • • • • • • • • 3
2. Photographs of Wah Wah Valley. 4
3. Map showing normal annual precipitation and locationof sites for which runoff was estimated. • • • • • 6
4. Photographs of the Wah Wah Springs discharge area. • 15
5. Photographs of tufa terrace at Wah Wah Spring No.1,(C-27-l5)11aba-Sl. • • • • • • • • • • • • • • • • 16
6. Geophysical and temperature logs of well (C-28-l4)llabb-l. • • • • • • • • • • • • • • • 17
7. Diagrammatic sketches showing inferredground-water movement in the Wah Wahcharge area. • • • • • • • • •
paths ofSprings dis-. . . . . . . 24
8. Diagram showing numbering system for hydrologic-datasi tes. . . . . . . . • . . . .
iv
. . . . . . . . 37

TABLES
Page
Table 1. Selected climatologic data for Wah Wah Ranch • 7
2. Lithology and water-bearing characteristics ofhydrogeologic units. • • • • • • • • • • 8
3. Estimated mean annual runoff from selected streamsin southern Wah Wah Valley •••••••••• 10
4. Estimated average annual volumes of precipitationand ground-water recharge 12
5. Ground-water recharge and discharge in the Wah WahValley drainage basin. • • • • • • • • • 27
6. Records of selected wells and mine drains. 40
7. Drillers' logs of wells•••
8. Records of selected springs. . . .41
44
9. Chemical analyses of ground water •. 45
10. Minor chemical constituents in ground water fromselected sources • • • • • • • • • • • • • • •
v
45


HYDROLOGIC RECONNAISSANCE OF THE WAH WAH VALLEY DRAINAGE BASIN,
MILLARD AND BEAVER COUNTIES, UTAH
by
Jerry C. Stephens, HydrologistU.S. Geological Survey
ABSTRACT
The Wah Wah Valley drainage basin is an area of about 600 squaremiles (1,550 km2 ) in Millard and Beaver Counties in southwestern Utah.Surface-water supplies of the area are negligible--total runoff averagesabout 7,800 acre-feet (9.62 hm 3
) annually, all streams are ephemeral orintermittent, and surface storage is negligible. Evaporation and transpiration within the basin consume more than 97 percent of total annualprecpitation. There is no surface outflow.
Ground water is present in most of the rock units in the drainagebasin, but they are tapped by few wells and springs because the top ofthe saturated zone for the most part is deep below the land surface.Total annual recharge to the ground-water system is estimated to averageabout 10,000 acre-feet (12.3 hm 3 )--7,000 acre-feet (8.63 hm 3
) from precipitation in the basin and 3,000 acre-feet (3.70 hm 3
) from subsurfaceinflow. Estimates and measurements of discharge from the ground-watersystem total about 1,500 acre-feet (1.85 hm 3
). A few springs, wells,mine drains, and prospect pits, most of which yield less than 10 gallonsper minute (0.63 l/s) , discharge about 100 acre-feet (0.123 hm 3
) ofground water annually from stream-channel alluvium, igneous rocks, andquartzite. The older alluvium in the valley fill discharges 1 to 2 acrefeet (1,230-2,470 m3
) annually to a single well.
Wah Wah Springs discharge about 800 acre-feet (0.987 hm 3) annual
ly from at least 10 individual spring openings, and an additional 600acre-feet (0.740 hm 3
) of ground water is discharged annually by evapotranspiration in the immediate vicinity of the springs. The springs issue from fractures and solution channels in Paleozoic carbonate rocksand from tufa deposits in an area where the land surface transects astructurally controlled fracture zone with relatively high permeability.
Recharge to and discharge from the ground-water system areassumed to be equal over a long period of time because there are noknown changes of storage in the system. Thus, the difference betweenthe totals for recharge and discharge represents subsurface outflow fromthe drainage basin.
Most known ground-water sources in the basin yield fresh, veryhard water. In general, the highest concentrations of dissolved solids(maximum 4,550 milligrams per litre) are found in ground water from igneous rocks, and the lowest (minimum 99 milligrams per litre) are foundin water from quartzite and carbonate rocks.
1

INTRODUCTION
This report is the fourteenth in a series by the U.S. GeologicalSurvey in cooperation with the Utah Department of Natural Resources, Division of Water Rights, which describes the water resources of the western basins of Utah (fig. 1). The purpose of the report is to presenthydrologic data for the Wah Wah Valley drainage basin, to provide anevaluation of present and potential water-resources development in thearea, and to identify needed studies that would improve understanding ofthe area's water supply.
The investigation on which the report is based consisted largelyof a study of available data for geology, streams, wells, springs, climate, water quality, and water use. These data were supplemented withdata on landforms, vegetation, geology, and water sources collected during brief field reconnaissances in September and October 1972 and June1973.
Several published reports listed in the selected references contain information on the geology and water resources of the Wah Wah Valley area. Principal sources of basic hydrologic data are the files ofthe U.S. Geological Survey and of the Utah State Engineer. The geologicmap of Utah (Stokes, 1964) is the main source for the geology shown onplate 1.
Most of the numbers given in this report are in English unitsfollowed by metric units in parentheses. Chemical concentrations aregiven only in metric units. A list of metric units, abbreviations, andconversion factors is included in the appendix.
Hydrologic-data sites referred to in the report are assigned anumber that serves both to identify and to specifically locate the site.This numbering system is described in detail in the appendix.
GENERAL HYDROLOGIC ENVIRONMENT
The area described in this report includes Wah Wah Valley and itstributary drainage area, a total of about 600 square miles (1,550 km2)in Millard and Beaver Counties in southwestern Utah (fig. 1). Plate 1shows the topographic and geologic setting of the area, and figure 2shows representative views of the area.
Except for a small tract of irrigated land at Wah Wah Ranch, theland in the drainage basin is used mainly for livestock grazing. Morethan 87 percent--about 332,000 acres (1,340 km2)-~of the land is in Federal ownership, about 11 percent--43,000 acres (174 km2)--is owned bythe State of Utah, and the remainder--about 9,000 acres (36 km2)--isprivately owned.
2

Area of this report
). I
I
40"
60 MI LESI
- - - - -
--~-138"
MonUcetl2.,.0,r\:l ( J
'vi I, (/ I
I
40I
I60 KILOMETRES
EXPLANATION
II I I.
_----L-..J-'Ill" 110·
BLUECREEK
VALLEY112 "
37 0
114 0
Figure I.-Location of the Wah Wah Valley drainage basin and areasdescribed in previously pUbl ished reports in this series.
3

A. Southern end of Wah Wah Valley Hardpan; lookingnorthwestward from near Crystal Springs.
B. Central part of valley, Frisco Peak, andWah Wah Ranch; looking eastward from near
Wah Wah Springs.
Figure 2.-Wah Wah Valley.
4

Physiography
The Wah Wah Valley drainage basin is a closed basin bounded bydrainage divides in the Wah Wah Mountains on the west and southwest, theConfusion and House Ranges on the north, and the San Francisco Mountainson the east. The northeastern boundary of the basin is a broad, lowridge, which connects the northern end of the San Francisco Mountainswith the southern end of the House Range. The ridge rises about 25 feet(7.6 m) above the floor of the Wah Wah Valley Hardpan and divides thesurface drainage of the Wah Wah Valley basin from that of the SevierLake basin.
Climate
The climate of Wah Wah Valley is arid--annual precipitation overthe entire basin is estimated to average about 9 inches (229 rom). Figure 3 shows the general distribution of precipitation over the area, andtable 1 lists selected climatologic data for Wah Wah Ranch. As indicated in table 1, about one-half of the annual precipitation at Wah WahRanch falls during May-September. Precipitation (mostly snowfall) during December-March accounts for less than one-fourth of the annual precipitation on the lowlands and probably not more than one-third of theannual precipitation on the uplands.
Vegetation
Because of the general aridity, native vegetation in Wah Wah Valley consists primarily of "salt-desert" shrubs that are typical of millions of acres in the Great Basin. Vegetation is absent on the playa(Wah Wah Valley Hardpan, pl. 1 and fig. 2). On the gravelly soils surrounding the playa and covering most of the remaining valley floor, amixed association of shadscale (Atriplex confertifolia) and bunchgrassespredominates. This vegetative cover is sparse, generally covering lessthan 10 percent of the ground.
On the alluvial slopes adjacent to the valley floor, sagebrush(Artemisia sp.) is the dominant plant below an altitude of about 6,000feet (1,830 m) above mean sea level. Above that altitude, juniper(Juniperus sp.) and pinyon (Pinus sp.) woodlands predominate on both alluvial and residual soils. Several types of deciduous shrubs grow inthe uplands, especially on north-facing slopes.
Rabbitbrush (Chrysothamnus sp.) and greasewood (Sarcobatus vermiculatus) grow locally in and along stream channels in the alluvium andin places on the valley floor. These shrubs are limited primarily toareas of sandy soils that absorb precipitation and runoff readily andtemporarily store it as soil moisture for subsequent plant use. Wheremoisture is perennially available, as in the vicinity of Wah WahSprings (figs. 4 and 5) saltgrass (Distich lis spicata var. stricta),greasewood, rabbitbrush, and other phreatophytes are common. Cattail(Typha sp.), watercress (Rorippa nasturtium-aquaticum) , and other hydrophytes grow locally in areas of spring discharge.
5

1.12 W.
CHANNEL-GEOMETRY MEASUREMENT SITE:
_ .. - Surface-drainage divide
----- Stream-drainage divide
Cubichec tometres
0.10.30.61.21.82.~
Acrefeet
100250500
100015002000
EXPLANATI ON
Inches0.10.30.50.7I2~
68
10121620
CONVERSION UNITSMi 11 imetres
2.57.5
12.517.52550
100150200250300~OO
500
-31...."
______ Site number5.~---Estimated mean annual runoffo.27~volume, in acre-feet
Estimated runoff rate fromdrainage area above site, ininches per year
Line of equal normal annual-8- prec ip itat ion, 1931-60.
Interval 2 and ~ inches(51 and 102 mm)
-3'°15'
•. 13 W.1.14 W.I. U w. 113DJO'
I1.16 W.
T.255.
T.265.
T.215.
T.235.
T.h5.
T.215.
T.195.
I113°30'
Base from U.S. Geological Survey 1:250,000series. Richfield (1953)
CI imatologic data from U.S. Weather Bureau(no date). Hydrology by Jerry C. Stephens,1973
Figure 3.- Normal annual precipitation and location of sitesfor which runoff was estimated.
6

Table l.--Selected climatologic data for Wah Wah Ranch
(Based on U.S. National Oceanographic and Atmospheric Administration,U.S. Environmental Science Services Adminstration, and
U.S. Weather Bureau publications listed in selected references)
Altitude: 4,960 feet above mean sea level.Period of record: September 1955-December 1972
Temperature PrecipitationAverage monthly: CF) (in. )
January 28.7 0.26February 34.6 .40March 40.5 .52April 47.8 .65May 58.0 .58June 67.7 .48July 76.2 .60August 74.0 1.08September 63.7 .61October 51.8 .67November 38.3 .50December 29.6 .34
Average annual 50.9 6.69 1
Maximum/minimum:Period of record 106/-27Annual 10.11/3.55Monthly 2.31/0.00
1 Sum of monthly averages. Average annual precipitation for 17 complete years of record (January 1956-December 1972) is 6.80 inches.
Geology
Rocks ranging in age from Precambrian to Holocene crop out in theWah Wah Valley drainage basin. On the basis of lithologic andhydrologic similarities, these rocks are grouped into generalized hydrogeologic units, each of which has a significant effect on the hydrologicsystem of the basin. Table 2 gives a generalized description of thelithology and water-bearing characteristics of these units, andplate 1 shows their distribution.
Wah Wah Valley is part of an eastward-tilted fault block that isbounded on the west by a fault along the western side of the Wah WahMountains and on the east by a series of faults along the western sideof the San Francisco Mountains (pl. 1). =n addition to the major structural features, minor folding and extensive faulting, fracturing, andbrecciation have accompanied the emplacement of igneous intrusives, especially in the San Francisco Mountains (Butler, 1913, p. 70-74). The
7

Tahle 2 --Lithology and ....ater-hearing characteristics of hydrugeologic llni!s
EraSysumSeries
Hydrogeologic unitand symbol on plate 1
Lithology, thickness, and extent \.'at,.'r bearing charactl;"ristics
Stream-channel alluvium(Qay)
Mainly sand and gravel, but includes some clay and silt. Prespntas channel fill along laq,;er streams at south end of valley.Maximum thickness probably less than 20 feet (6.1 m).
Generi'lily moderatLely Most deposits an' satllr<lt(,dto or within a few uf land surface d\lrin.>; ilnd r"rshurl periods ft1l1owLng runuff, hut watl~r ll"vel.s may hr'several f,~et hl,low land surface and thinner sect ions may IH'
dry during milch o[ the summer
Alluvium:(Qos) Mainly sandy, gravelly clay. Occurs as thin veneer overlying Rnd
adjacent to lakehed clays near center of valley; thickens laterally and grades into coarser alluvium on gently sloping landalong valley margin. Maximum thickness unknown.
Permeahility generally low. Deposits generally ah()v(' saturated zon(~.
(Qag) Mainly sand, gravel, and boulders, hut includes some intermixedand interbedded clay and silt. Forms steeply sloping alluvialapron at base of mOlmtains; grades laterally into finer grainlldalluvium toward valley axis. Includes colluvial materials ad-jacent to bedrock outcrops Maximum thickness unknown.
Slightly to highly penneabll.' Din~ct precipitation and Tl1I1-
off from highl~r a]titlloPs infiltrates thl'se deposits annmoves downward and later-illy into underlying aqllif<~rs. Ih'posits are gent-rally ahovi' thl' saturatt\d ZOl1t'.
Lacustrine depos! ts:(Qlc) Lakebed clay and silt, including surficial playa deposits on Wah
Wah valley hardpan. Probably underlie most of gently slopingalluvial deposits (Qas). Maximum known thickness anout 230 feet(70 m) at ....ells (C-24-13)33daa-1 and 34ccb-l (table 7); thinlaterally from axis of valley and toward south end of valley.
Permeability generally low Most precipitation and rUlloflreaching the Wah Wah Valley Hardpan remains ponded untilit evaporates. At such time, the thin plays deposits mayhe saturated for sbort p(~riods. Locally may confine waterin underlying aquirl~r.
(Qlt) Lacustrine beach ridges, hay-mouth bars, or near-shore bars,mainly sand but cont.sining considerable amounts of fine gravel,silt, and clay. Present as broad, low ridges on valley floor,oriented approximately at right angles to axis of valley. ~Iaxi
mum thickness probably less than 20 feet (6.1 m).
Slightly to moderately permeahle. Deposits ahsorh much ofthe pH'cipitatinn falling on them and retain it as soilmoisture, thlls supporting a denser vegetative cover thanadjacent areas. Deposits are g(merally unsatllrated.
Spring depos i ts(QTs)
older alluvium(QTa)
Calcareous tufa deposited by precipitation from spring discharge;generally contain some clay and silt. Form prominent terracesat several levels downslope from Wah Wah Springs, and occurlocally in and near other spring areas. Maximunl thickness probably about 120 feet (37 m) at Wah Wah Springs; elsewhere depositsare small and only a few feet thick.
Materials ranging in size from clay through boulders, intennixedand interbedded, unconsolidated to well cemented. Probably include some lacustrine deposits and colluvium, but consist primarily of alluvium. Well-cemented gravel beds crop out locallyalong valley margins, but exposures are too small to show atscale of map (pI. 1). Underlie younger depos its throughout mas tof area; grades upward into younger alluvium and lacustrine deposits along valley margins. Reportedly interbedded with extrusive igneous rocks at well (C-28-l4)l1abb-l. Maximum thicknessunknown; probable thickness at well (C-24-13)33daa-1 is 1,252feet (382 m) (table 7).
Slightly to highly permeable, depending on degree to whichclay and silt have plugged primary openings. Containsabundant cavities and tabular openings resulting from n~
solution and from decomposition of vegetat ive material incorporated during deposition. C(~nerally saturated to orwithin a few feet of land sllr[aCl' by discharging springflowupslope.
Slightly to highly p8rml~ahlt" depending on sb:e and degrt!eof sorting of materials and degree of cementation in individual strsta. 'vJell (C-24-l3)34cch-l is t·eported to yieldwater from sand and gr<lve: beds in this unit from 2)0 to290 feet (70-88 m) :),dow land surface. This unit: forms thebulk of thQ valley fill, which is the major ground-waterreservoir in Wah \,Jah Valley.
Extrusive igneous rocks(To)
Primarily ignimbrites and lava flows ranging in composition frommafic to felsic. May include some tuffs, breccias, and othervolcanic rocks. Crop out extensively in the southern part ofthe area and in isolated patches in the northern part. Maximumthickness unknown. Reportedly occur in subsurface. interbeddedwith older alluvium, at well (C-28-14)llabb-l below 1,193 feet(364 m).
Primary permeahility gl'nerallv lnw except locally in somehreccias and interflow zones. Where fractured and hrokenhy faulting, secondary permeability may hp high A f,'wsprings, seeps, and ahandoned mine workings di schargl' watl,rfrom these rocks in the southern part of the area S\lrficial weathered zones, especially on the ignimbritl, sheetsat the SOllthern (~nd of the area, may readily absorh prl'cipitalian and runoff and Lransmit- watl'r downgradient to aquifers he\1l;~ad) I-he' val1l'v fh'or
Intrusive igneous rocks(Ti)
Mainly porphyritic qlJartz monzonite. The outcrop in the San Francisco Mountains is an eroded stock; the small outcrop in the central Wah Wah Mountains may be part of a similar, but less exposed, intrusive. Thickness and subsurface extent unknown.
Primary permeahility low Surficial weathered zones andfractured zonl~S may be moderately to highly permeable Sl'V-eral mine workings that p('netrat~' these rocks vil:'ld smallquantities of water
Primary pennf!ahil j ty generally low; .'h'condarv p,-,rmeabi 1 i tymoderate to high where solution openings an' present, especially along hedding planes, fractures, and faults. Mostground-water rechsrgl;" in the area is ahsorhed hy th('81:'rocks where they crop out in the mountains and moves downgradient along hedding planes and fractures to dischargeareas. Wah Wah Springs discharge an estimated 800 acrefeet (0.987 run3) annually from these rocks. The carhonatl~
rocks probahly serve as the principal conduit for grollndwater movement in th(~ bas in.
Mainly limestone llnd dolomite, with Bome beds of shale, siltstone.and sandstone. Altered by contact metamorphism adjacent to intrusive rocks in San Francisco Mountains; some parts of the contact zone are highly mineralized and have been mined extensi.vely.Form bulk of mountain ranges bordering valley. Locally overlainby extrusive igneous rocks on mountain flanks. Probably underliemost of area at depth. Thickness and subsurface extent unknown.
Sed intentary and metasedimentary carbonaterocks(Pzc)z
"~~~ E.0 _
~ ~ p.
~;It--t--t:-;-:-----:----t--:-:--:----:---:----:--:----:-~--.,_.,_.,_-_:_--+_-----------------------
Sedimentary and meta- Mainly Quartzites, but include some phyllite and phyllitic shale. Primary pf>rmeability low. Hecause of the df>.ns(', l"plativelvsedimentary quartzitic Generally resistant, cliff-forming strata exposed in the sO\lth- impermeahle nature of the"'le rocks, most precipitation runsrocks ern part of the area in the Wah Wah Mountains and near the off. Several sma] 1 ephemeral springs discharge from lalus(pzq) eastern edge in the San Francisco Mountains. Thickness and below qllartzite outcrops; some spri.ngs may discharge
subsurface extent unknown, but may underlie l~ost of the area at din~cLly from fractllTed quartzit,'depth.
Metaiedimentary rocksundifferentiated(P")
Mainly quartzite an': 8,gillite. ;;::-,Jsi~,:\--rf';:-"::ant, c1iff-fo~'Tning
strata exposed at northern end of San Franc -~,,;co i"Lollntains.Thickness and subsurface e,.;[e:11 unknnwn
Gen:;n.llv simi-1ar t,·. Pl.q
8

(similar to the area upstream from site 11, table 3) for the approximately 116,000 acres (469 km2
) of exposed Tertiary igneous and preTertiary sedimentary and metamorphic rocks; and (2) 0.2 inch (5 mm)(similar to the area above site 2, table 3) for the approximately 30,000acres (121 km2
) underlain by Quaternary and Tertiary sedimentary rocks.Runoff from the uplands is thus estimated to average about 0.6 inch (15rum) or 7,300 acre-feet (9.00 hm 3
) annually. Much of this runoff neverreaches the valley floor because it is lost by evaporation and infiltration on the lower slopes. This loss is graphically illustrated by comparing the estimated mean annual discharge at sites 1-4 in figure 3.From site 4 to site 1, discharge decreases by about 85 percent whereasdrainage area increases by more than 1,000 percent (table 3).
Table 3.--Estimated mean annual runoff from selected streams in southern Wah Wah Valley
Drainage area Runoff Dominant hydro-Site Location Altitude above site Volume Rate geologic units inNo. (see fig. 3) (f eet) (square miles) (acre-feet) (inches) drainage
(see pI. 1)
Wah Wah Wash south of State Highway 21
1 (C-27-l4)14acd 4,930 121 100 0.015 Te,Qag2 (C-28-l4)2ddc 5,170 57.2 520 .17 Te,Qag3 26caa 5,400 36.0 580 .30 Te,Qag
Grover Wash
4 (C-28-13)3lcdc 5,690 11.4 620 1.0 Te
Willow Creek
5 (C-28-l4 )l6aab 5,380 30.1 440 .27 Te,Qag6 (C-29-l5)2dad 6,140 14.8 1,890 2.4 Pzc,Te
Frisco Wash
7 (C-27-13) 28aba 5,540 6.4 790 2.3 Pzc,Te,Ti,Qag8 26cab 5,950 4.8 1,430 5.6 pZC,Te,Ti
Unnamed tributaries
9 (C-26-l5)34bc 5,980 2.6 240 1.7 PZC10 (C-28-l5)13aad 5,680 9.6 460 .90 Te
Quartz Creek
11 (C-28-l5)35aad 6,060 6.4 250 .73 Te
As shown in figure 3, most areas receiving less than 10 inches(254 rum) of precipitation annually are at altitudes below about 5,600feet (1,700 m). Air temperatures and soil-moisture requirements inthese areas are generally high, and surficial deposits are generallyunconsolidated; as a consequence, runoff is slight. Total annual runofffrom Wah Wah Valley below an altitude of 5,600 feet (1,700 m) is estimated to average less than 500 acre-feet (0.617 hm 3 ) although one-half
10

of the total precipitation falls there. The corresponding annual rateof runoff would average about 0.02 inch (0.5 rum), which is comparable tothe rate calculated for the total drainage area above site 1 (table 3).
Several small reservoirs have been constructed in Wah Wah Valleyto intercept local runoff. These reservoirs store small quantities ofwater for livestock at times during the fall and spring, but during muchof the summer they are dry. A reservoir at Wah Wah Ranch, which reportedly has a surface area of about 60 acres (24 hm2
) and storage capacityof about 200 acre-feet (0.247 hm 3
), stores water diverted by pipelinefrom Wah Wah Springs. Both Dutchman and Newhouse Reservoirs (pl. 1)also store some water diverted from the springs.
There is no surface outflow from the Wah Wah Valley drainage basin; thus, the long-term average consumptive use of surface water byevaporation and transpiration must equal the difference between totalprecipitation and ground-water recharge within the basin (table 4). Theestimated consumptive use of surface water (excluding springflow),therefore, averages more than 97 percent of the total precipitation.
Ground water
Ground water is present in most of the rock units in the Wah WahValley drainage basin. At only a few locations are these rocks known toyield water to wells or springs, however, because the top of the saturated zone generally is well below the land surface.
Meinzer (1911, p. 119) concluded that "Conditions are not favorable for finding ground water in this [Wah Wah Valley] region. Beneaththe broad slopes that flank the valley water is almost certainly at agreat depth, and may be entirely absent. Even along the axis of thevalley the gradient is in most places so steep and the altitude so muchhigher than that of Sevier Lake that it is not likely that water wouldbe found near the surface."
Meinzer's assessment of the ground-water potential of Wah WahValley has been verified by exploratory drilling and attempted well developments since 1911. The well records (table 6) indicate the generallack of success of efforts to develop ground-water supplies from shallowwells in the valley.
Figure 3 and table 1 show, respectively, the areal variations inannual precipitation and the average monthly precipitation in Wah WahValley. Estimated average annual precipitation over the entire basin isabout 9 inches (229 mm), or 290,000 acre-feet (358 hm 3
). An estimated7,000 acre-feet (8.63 hm 3
), or about 2~ percent of the total precipitation, recharges the ground-water reservoir. Table 4 gives the derivation of these estimates, based on a method described by Eakin andothers (1951, p. 79-81) and modified for use in western Utah by Hood andWaddell (1968, p. 22-23).
11

Table 4.--Estimated average annual vo1u~es of precipitationand ground-water recharge
(Areas of precipitation zones measured from pl. 1 and fig. 3)
Precipitationzone
(inches)
Area inzone
(acres)
Estimatedannual precipitation
Feet Acre-feet
Estimated annual rechargePercent of
precipitation Acre-feet
Area where Quaternary and Tertiary sedimentary rocks are exposed
Less than 8 134,800 0.54 72,800 0 08-10 55,200 .75 41,400 0 0
10-12 27,800 .92 25,600 3 77012-16 2,200 1.17 2,600 6 160
More than 16 100 1.38 140 20 30
Subtotal 220,100 142,540 960
Area where Tertiary igneous rocks, Paleozoic sedimentary rocks, andPrecambrian metamorphic rocks are exposed
Less than 8 19,300 0.54 10,400 0 08-10 27,700 .75 20,800 0 0
10-12 71,900 .92 66,100 3 1,98012-16 36,900 1.17 43,200 6 2,590
More than 16 6,900 1.38 9,500 20 1,900
Subtotal 162,700 150,000 6,470
Total(rounded) 380,000 290,000 7,000
In addition to recharge from precipitation in the drainage basin,the ground-water reservoir in Wah Wah Valley probably receives rechargeby subsurface flow from the Pine Valley drainage basin, which is on thewest side of the Wah Wah Mountains. The quartzite and carbonate rockstrata underlying the central and southern Wah Wah Mountains, exceptnear the intrusive rocks in T. 26 S., are inclined toward Wah Wah Valley, and recharge on the outcrops west of the surface-drainage dividepresumably moves downdip toward the east under the divide. The inferredlocation of the ground-water divide in this area is shown on plate 1.The Wah Wah Valley ground-water basin thus encompasses about 28,000acres (113 km2
) of Pine Valley; estimated recharge from west of thesurface divide is about 3,000 acre-feet (3.70 hm 3
) annually. Thus, thetotal ground-water recharge to Wah Wah Valley is estimated to averageabout 10,000 acre-feet (12.3 hm 3
) annually.
The following sections describe briefly the significant featuresof the hydrogeologic units that yield water in the drainage basin andassess the present and potential ground-water development in each.
12

Quaternary and Tertiary sedimentary rocks
Stream-channel alluvium
Thin deposits of alluvium in and along the channels of Quartz andWillow Creeks and Wah Wah and Grover Washes (Qay, pl. 1) contain groundwater. These unconsolidated deposits probably are less than 20 feet(6 m) thick. They are at least partly saturated much of the time, however, because infiltration of runoff from upslope areas suppliesintermittent recharge, and locally seepage from adjacent volcanic rocksmay supply relatively constant recharge.
and Willow Creeks on June 21, 1973, were obinto the stream-channel deposits within athe volcanic rocks. Channel losses were
The flows of Quartzserved to disappear entirelyshort distance after leavingcalculated as follows:
Discharge
Quartz Creek at (C-28-IS)36bba 0.71 ft 3 /s (0.020 m3 /s)Quartz Creek at (C-28-14)19ddb 0
Loss .71 ft 3 /s (0.020 m3 /s)Approximate length of reach 2.1 mi (3.4 km)
Average loss .34 ft 3 /s/mi (0.00S9 m3 /s/km)
Willow Creek at (C-28-14)21bbc 1.26 ft 3 /s (0.036 m3 /s)Willow Creek at (C-28-l4)l6acc 0
Loss 1.26 ft3/ S (0.036 m3 /s)Approximate length of reach 1.0 mi (1. 6 km)
Average loss 1.26 ft 3 /s/mi (0.022Som 3 /s/km)
At the time of these observations, the flow of both creeks consistedprimarily of discharge from the Tertiary igneous rocks of watertemporarily stored during the melting of the abnormally large snowpackof the preceding winter.
Much of the ground water moving downgradient through the streamchannel alluvium is consumed by evapotranspiration before it reaches thevalley floor. Seveys Well, (C-28-l3)28ddc-l, and Willow Spring,(C-29-l5)2dad-Sl, are the only known sources yielding ground water fromstream-channel alluvium in the drainage basin; together they dischargean estimated 40 acre-feet (0.049 hm 3
) of water annually. (See tables 6and 8.) Both of these sources are developed in areas of natural discharge. The structures installed at the two sites capture a part of thedischarge that would otherwise be consumed by evapotranspiration and divert it elsewhere for livestock use. Evapotranspiration probably accounts for an additional 30-50 acre-feet (0.037-0.061 hm 3
) of groundwater annually from the channel deposits. Ground water moving through
13

the stream-channel alluvium in excess of that discharged by springflowand evapotranspiration is discharged into the valley-fill deposits underthe valley floor.
Because the channel deposits are thin and of small extent, andbecause at most locations there is no significant source of sustainedrecharge, the potential for development of dependable ground-water supplies from stream-channel alluvium is severely restricted. In some locations, additional small supplies for livestock probably could be obtained by installation of a perforated-pipe collector system similar tothat at Willow Spring. The most promising locations for such development are on Quartz and Willow Creeks and in Grover Wash.
Spring deposits
The calcareous tufa deposits (QTs, pl. 1) forming the conspicuousterraces at Wah Wah Springs (figs. 4 and 5) yield water to numeroussmall springs and seeps. As indicated in table 8, at least 8 of the 10major outlets of Wah Wah Springs discharge from spring deposits. Thespring deposits are recharged by inflow from the adjacent and underlyingPaleozoic carbonate rocks. A more detailed discussion of this part ofthe ground-water system is given in the section on Wah Wah Springs.
Small outcrops of calcareous tufa are present near Antelope andKiln Springs, (C-28-l3)18abd-Sl and (C-28-l5)10aad-Sl, respectively. Atboth of these locations, however, the exposed spring deposits cover onlya few square feet and are of no consequence as potential sources of water. The springs actually discharge water that is moving through igneous rocks.
Older alluvium
The largest ground-water reservoir in the Wah Wah Valley drainagebasin is in the valley fill. The bulk of the valley fill consists ofolder alluvium (QTa, table 2) that underlies the lacustrine sedimentsand surficial alluvium. Similar deposits in adjacent areas of westernUtah yield large quantities of water to wells. See for example, Hoodand Rush (1965), Sandberg (1966), and Mower and Cordova (1974).
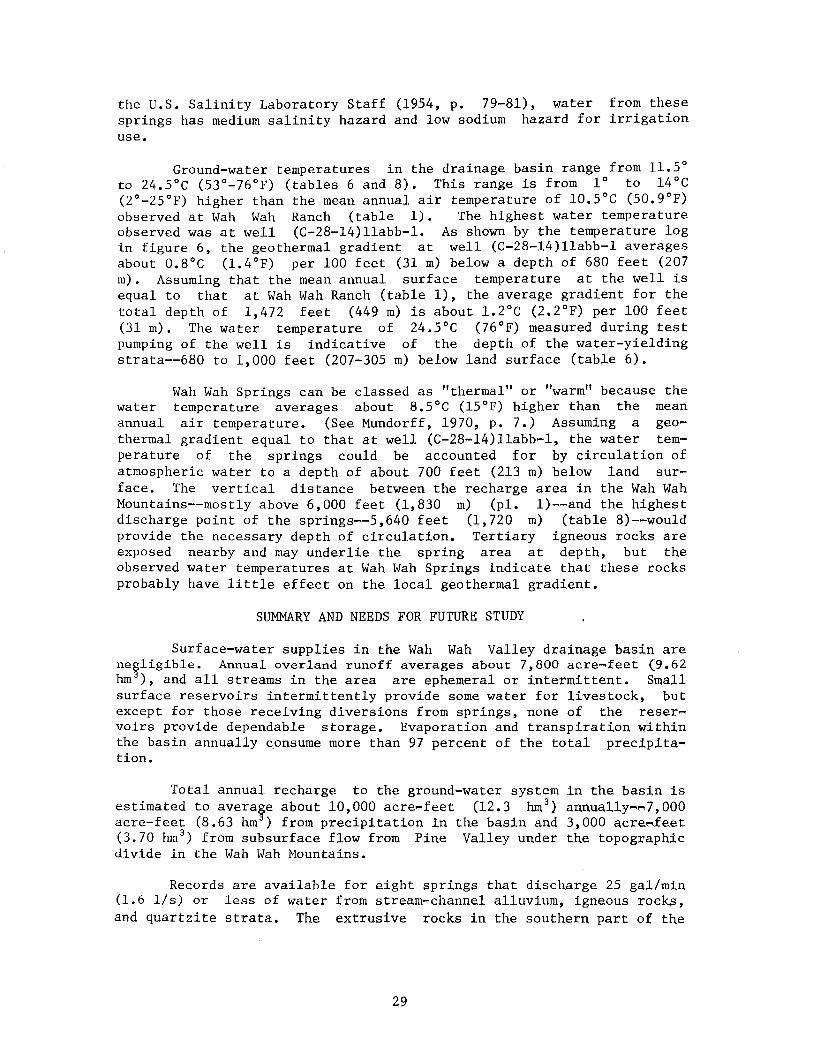
At present (1973) only one well, (C-24-l3)34ccb-l, yields waterfrom the older alluvium in Wah Wah Valley; but two other wells havepenetrated water-bearing beds in this unit. An oil-test hole, (C-24-l3)33daa-l, drilled within half a mile (0.8 km) of the producing well, reportedly penetrated water-bearing strata in the valley fill at intervalsfrom 233 to 1,140 feet (71-347 m) below land surface. A third well,(C-28-l4)llabb-1, which was under construction at the end of 1973, reportedly penetrated water-bearing strata in the interval from 680 to1,000 feet (207-305 m) below land surface. Drillers' logs of thesethree wells are given in table 7, together with logs of several unsuc~
cessful wells drilled into the valley fill. Borehole geophysical logsof well (C-28-l4)11abb-l are shown in figure 6.
14

B. Spring No.2,(C-27-15) II aad-S I.Spr ing issuesimmediately to leftof mound of rocksfrom tufa terracein background.
A. Spring No. I,{C-27-15)llaba-SI.Spring issues fromI imestone and gravelin cattail-filledexcavation at lowerleft.
C. Rese rvo irat head ofpipe1 ine to Wah WahRanch. Inflow atright from Spring No.I; i n f 1ow atIe ftfrom Spring Nos. 2,3, 5, and 6, locatedalong base of tufaterrace to left oftrees.
Figure 4-.-Wah Wah Springs discharge area.
15

B. View toward northeast from point Ain photograph above.
A. View toward southwest from point Bin photograph below.Spr ing No. I issuesin patch of cattailsvisible in center ofphotograph.
Close-up view oftufa deposits atpoint C in photograph above. Notelow rim aroundouter edge ofterrace.
Figure 5.-Tufa terrace at Wah Wah Spring No. I, (C-27-15)llaba-SI.
16

LOGSGEOPHYSICAL TEMPERATURE• INCREASE
Spontaneous Degrees Ce lsi us METRESFEE T potent ial Resistivity 22 23 24 25 26 27 28 29 2DD
660 660
-r"'" ":[-9-28-73
700 - 7 0 0
~=
~ ~~800 ~ ~ 800
\ 1~-3
~--
s;5''0'::""~JJ
~:>900 .;,,/: 900
~oi f:r' '?~ ~~ g:'j 00
1000
cl1 000
11 1 00 ~ 11 00
~ :t1200 ) 1 200
.;=--f('
~'
1300 ~ - 130 D
:?~ 400Cc-
1400
~<]\~ 1 400
:z-------- ~
7 i-1480 -~-~---
I 1 48 DDATUM IS LANO SURFACE
Figure 6. - Geophys i cal and temperature logs of well (C-28-14)llabb-l.
17

The older alluvium receives little direct recharge from precipitation on the drainage basin. Much of the precipitation falls on igneous and sedimentary rocks above altitudes of about 5,600 feet (1,700m) where precipitation exceeds 10 inches (254 mm) annually. The watermoves downgradient toward the floor of the valley, where it is discharged by evapotranspiration, springflow, or mine and prospect pitdrainage, or eventually recharges the valley fill.
Schmoker (1972, p. 11-23), from his interpretation of gravitydata for the area, estimated the maximum thickness of fill--Quaternaryand Tertiary clastic material--in Wah Wah Valley to be about 3,600 feet(1,100 m). On the basis of the log of test hole (C-24-l3)33daa-l, wherethe probable base of the valley fill is at a depth of 1,485 feet (453m), and correlation with gravity analyses and well-log data in theMilford area (Mower and Cordova, 1974, p. 11), it is believed that theactual thickness of fill is only about two-thirds that estimated bySchmoker. (See pl. 1.) Thus, the maximum total thickness of Quaternaryand Tertiary sedimentary rocks in Wah Wah Valley is estimated to beabout 2,400 feet (730 m).
Because few wells drilled in the Wah Wah Valley drainage basinhave found water, little is known concerning the conditions under whichground water occurs or the configuration of the potentiometric surfaceof water in the valley fill. The assumed potentiometric surface isshown in the geologic sections on plate 1; its position is based onwater-level records at wells (C-24-l3)34ccb-l and (C-28-l4)11abb-l andan inferred relationship between land-surface and potentiometric-surfaceconfigurations. The sections are not intended to be precise referencesfor ground-water exploration or well drilling. They are intended onlyas a general picture of the inferred subsurface relations in Wah WahValley.
Ground-water discharge from the valley fill is by subsurface outflow, except for an estimated 1 to 2 acre-feet (1,230-2,470 m3
) pumpedannually from well (C-24-l3)34ccb-l. The water-bearing beds are coveredby unsaturated materials more than 200 feet (61 m) thick; thus, they donot lose water by direct evaporation or transpiration by phreatophytes.Total annual subsurface outflow, therefore, is approximately equal tototal annual recharge.
Although details of the gradient and configuration of the potentiometric surface are not definable from observed data, it is inferredthat ground water moves toward the axis of the valley from the borderingmountains and in a general northerly direction under the axis of thevalley. Meinzer (1911, p. 119) assumed that Wah Wah Valley drained inthe subsurface into the Sevier Lake basin, and the topographic and surficial geologic relations in the area tend to support this assumption.However, more recent data indicate that ground water may not move towardSevier Lake from Wah Wah Valley. Well (C-24-l3)34ccb-l is near the lowest part of the valley. The surface altitude at the well is about 4,645feet (1,416 m), and the measured depth to water in October 1972 was 212feet (65 m) (table 6). Thus, the altitude of the water surface wasabout 4,433 feet (1,351 m). The altitude of the surface of Sevier Lakeis 4,519 feet (1,377 m), nearly 90 feet (27 m) higher than the groundwater level at the nearest well in Wah Wah Valley.
18

These considerations, together with a reported water level at analtitude of about 4,365 feet (1,330 m) in a well in southernmost Tule(White) Valley to the north, suggest that ground water from Wah Wah Valley may discharge northward rather than northeastward to the Sevier Lakebasin. Further investigations in the area north of the Wah Wah Valleydrainage basin are required to define the subsurface drainage patternmore accurately.
The ground-water reservoir in the valley fill underlies an estimated 115,000 acres (465 km2 ) in Wah Wah Valley. The total volume ofwater stored in the reservoir undoubtedly is large, but the lack of dataconcerning aquifer characteristics precludes a reliable estimate of thequantity of water that might be recoverable from storage. Recovery ofan appreciable quantity of water from storage by pumping from wellswould entail the lowering of the potentiometric surface of the reservoir, resulting in increased pumping lifts.
Tertiary igneous rocks
Extrusive rocks
Where they are unweathered and unfractured, the lavas and ignimbrites that make up the bulk of the extrusive igneous rocks (Te, pl.1) in the Wah Wah Valley drainage basin are relatively impermeable.However, the ignimbrites exposed over large areas at the southern end ofthe basin are extensively weathered and locally fractured and broken byfaulting. Secondary permeability may be relatively high in theseweathered and fractured zones.
Recharge to the extrusive rocks is primarily from precipitationon areas of outcrop. Where a surficial weathered zone is present, as itgenerally is on the ignimbrites near the southern end of the area, precipitation is absorbed readily. Recharge from infiltrating precipitation is transmitted downgradient toward the valley floor through thepermeable zones.
Some ground water moves through the weathered zone near the surface and is discharged by evapotranspiration before it reaches the valley floor. Near the base of the upland slopes, some ground water isdischarged by flow from springs, mine workings, and prospect pits. Asindicated in the section on ground water in stream-channel alluvium,discharge from the extrusive igneous rocks may be a relatively constantsource of recharge to the channel deposits along several of the creeksin the southern part of the basin. All the ground water that reachesthe level of the valley floor in the extrusive rocks discharges in thesubsurface into the adjacent valley-fill deposits.
Antelope and Kiln Springs, (C-28-13)18abd-Sl and (C-28-l5)10aad-Sl, respectively, each discharge an estimated 5 gal/min (0.32 lis)of water from extrusive rocks. (See table 8.) The flow from Squaw"Spring," (C-27-13)26caa, which apparently is not natural springflow but
19

drainage from an abandoned mine adit or prospect, apparently dischargesfrom extrusive rocks, as does water piped from a prospect pit at(C-28-l5)11abd. Neither of these latter sources yields more than 2gal/min (0.13 l/s) of water. (See table 6.) Butler (1913, p. 20)listed several other small springs that issued from extrusive rocks inthe San Francisco mining district and formerly supplied water for miningand milling operations and livestock. Total discharge by springs,mines, and prospects from the extrusive rocks is estimated to averageabout 24 acre-feet (0.030 hm 3
) per year.
Additional small ground-water supplies probably could be obtainedfrom the extrusive rocks, particularly from the weathered ignimbrites inthe southern part of Wah Wah Valley. The most promising locations fordevelopment would be in areas where the surficial weathered zone is relatively thick and where the rocks are fractured or include brecciatedzones.
Intrusive rocks
The quartz monzonite porphyry intrusive in the central San Francisco Mountains northwest of Frisco (pl. 1) is the only intrusive rockunit in Wah Wah Valley that is known to yield ground water. The wateris stored in and transmitted through fractures and fault zones.Recharge is by infiltration of precipitation on the outcrop, and discharge is by drainage from mines and subsurface outflow to the adjacentvalley-fill deposits. Total discharge by mine drainage (table 6) probably averages no more than about 24 acre-feet (0.030 hm 3
) per year.
The movement of water through fractures results in dissimilaryields from different parts of the intrusive rock mass. According toButler (1913, p. 137), "In the Cactus Mine [(C-27-l3)3d] there was butlittle water on the lowest (ninth) level in the summer of 1909, thoughthis level has been idle for months and no pumping was being done.Later, however, considerable water was encountered on the seventh level." Butler indicated that the approximate upper limit of ground waterin the Cactus Mine was at an altitude of about 5,440 feet (1,658 m).The Cactus Mine presently (1973) is drained, at least in part, by apipeline installed in a 6,000-foot (1,830 m) tunnel. The altitude ofthe discharge point of the pipeline (see (C-27-l3)9aba, table 6) isabout 5,780 feet (1,762 m).
Additional water sources might be developed in the intrusiverocks, but only where water-bearing fractures are present. A wellintersecting such a fracture or set of fractures might yield a largevolume of water for a short time, but individual fractures might drainrapidly. A dependable water supply could be developed only where anextensive, interconnected fracture system is encountered, creating ineffect a large storage reservoir. Most wells developed in these rocksprobably would yield only a few gallons of water per minute with sustained pumping.
20

Paleozoic and Precambrian rocks
Carbonate rocks
Limestones and dolomites of Paleozoic age (Pzc, pl. 1) crop outextensively in the Wah Wah Mountains and locally in the San FranciscoMountains and the northern half of Wah Wah Valley. Although the primarypermeability of these strata is low, they have moderate to high secondary permeability as a result of solution, fracturing, and faulting.
Recharge to the Paleozoic carbonate rocks is from precipitationon the drainage basin and subsurface inflow from Pine Valley. The Paleozoic rocks in the Wah Wah Mountains dip eastward or northeastward atangles of 5°_15°. Locally, especially along major faults, the attitudeof the strata reflects movement along the fault; the beds may be verticalor inclined in any direction. Although detailed subsurface information is lacking, field observations of geologic structure and hydrologic relationships near Wah Wah Springs suggest that movement of groundwater through the carbonate rocks is primarily in solution channelsalong and parallel to bedding planes. Thus, as a consequence of thegeneral eastward to northeastward dip of the rocks, ground water movesgenerally eastward or northeastward from recharge areas in the Wah WahMountains toward the axis of Wah Wah Valley.
Wah Wah Springs discharge an estimated 800 acre-feet (0.987 hm 3)
of ground water annually from Paleozoic carbonate rocks; an additionalestimated 600 acre-feet (0.740 hm 3
) is discharged by evapotranspirationin the spring area. (See following section on Wah Wah Springs for a detailed discussion of this part of the ground-water system.) The rest ofthe ground water moving through these strata is discharged in the subsurface to the valley fill or leaves the basin as subsurface outflow.
Additional water sources probably could be developed in the Paleozoic carbonate rocks, particularly in the area southwest of Wah WahSprings. Wells penetrating these rocks could be expected to interceptground water moving downgradient along solution channels; and if an extensive network of interconnected openings is found, wells yielding several hundreds of gallons of water per minute might be developed.
Because ground water in the carbonate rocks moves in fractures,solution channels, and other secondary openings, it is not possible topredict the success of a well drilled at any particular location. Basedon surficial evidence alone, it is probable that the secondary openingsare extensively developed in many of the rock strata at depth. Thus theprobability of finding subsurface conditions favorable for the sustainedwithdrawal of ground water from the carbonate rocks is thought to berelatively high.
Wah Wah Springs.--The following descriptions were written morethan 60 years ago:
21

"Wah Wah Valley is entirely destitute of an irrigation supply andcontains very few watering places for man or beast. Wah Wah Spring-the only spring of consequence in the region--is situated in BeaverCounty, on the west side of the valley, and its water is led by gravitythrough a pipe line to Newhouse, a mining town on the east side."(Meinzer, 1911, p. 119.)
"Water is scarce in the region, and much of it is of inferiorquality. * * * the supply for Newhouse and the Cactus Mill is obtainedfrom the Wa Wa [Wah Wah] Springs on the opposite side of the Preuss [WahWah] Valley. This group of springs has a flow of about 1,200 gallons aminute and is the largest water supply in the region. The flow fromsixteen springs is gathered into a collecting reservoir, from which itis conveyed through a pipe 44,000 feet long to a reservoir situatedabove the mill and town of Newhouse." (Butler, 1913, p. 20.)
The water situation in Wah Wah Valley has changed little in theyears since the above descriptions were written. Although Newhouse andthe Cactus Mill no longer exist, and much of the springflow is now diverted to Wah Wah Ranch, Wah Wah Springs (figs. 4 and 5) are still theonly major water source in the drainage basin. Records of 10 of thesprings are given in table 8. Additional springs and seeps that werediverted in the past have become dry or, in some cases, the collectionpipes have deteriorated and have been abandoned.
Ground water discharged by Wah Wah Springs originates as precipitation on the Wah Wah Mountains. Recharge is absorbed by the exposed consolidated rocks and is transmitted downward and laterallytoward the axis of Wah Wah Valley in accordance with the general inclination of the rock strata.
Although detailed information on the geologic structure in thevicinity of Wah Wah Springs is unavailable, field reconnaissance and examination of aerial photographs indicate that the location of thesprings may be determined by geologic structure. The springs appear toissue on the northeast-trending axis of a flexure in the Paleozoic carbonate rocks.
Plate 1 includes a generalized map of the gross geologic structure of a part of the Wah Wah Mountains, based primarily on geologicrelationships depicted by Stokes (1964) and supplemented by a few widelyspaced field measurements near Wah Wah Springs. Near the west end ofthe spring-discharge area, the limestone beds strike about N. 40° W. anddip toward the northeast. At the east end of the spring area, the bedsstrike about N. 10° W. and dip eastward. The change in attitude of thebeds between these two points is believed to reflect folding of therocks along an axis that extends through the spring area and plungestoward the northeast.
Fracturing of the hard, brittle limestone along the crest of thefold is believed to have created a linear zone of relatively high permeability. The springs issue where the potentiometric surface of water inthis zone intersects the land surface.
22

The inferred recharge area of water discharged by Wah Wah Springsis outlined on plate 1. The volume of recharge available from this areawas estimated as follows, using the method described for the estimatesin table 4:
Precipitationzone
(inches)
Area inzone
(acres)
Estimatedannual precipitation
Feet Acre-feet
Estimated annual rechargePercent of
precipitation Acre-feet
Less than 1010-12
(Wah WahValley)10-12
(Pine Valley)12-16
More than 16
Total(rounded)
500 0.80 4001,700 .92 1,560
1,700 .96 1,630
10,600 1.17 12,4002,100 1.38 2,900
17,000 19,000
o3
3
620
o50
50
740580
1,400
The combination of structure and topographyWah Wah Springs has not been observed elsewhere inThe springs appear to be unique in manner of origin,"the only spring of consequence in the region."
that gives rise tothe drainage basin.as well as in being
The largest of the Wah Wah Springs, (C-27-15)llaba-SI (table 8),discharges an estimated 450 gal/min (28 l/s) of water directly fromlimestone strata or from a thin veneer of coarse alluvial gravel immediately overlying the limestone. Most of the other springs apparentlyissue from tufa deposits adjacent to and downslope from the limestoneoutcrop. Figure 4 shows the relationship between the tufa terraces andthe points of issue of several of the small springs. Figure 5 shows therelationship between spring (C-27-15)llaba-SI and the tufa deposits thatform a conspicuous terrace below its point of issue.
Discharge from the uppermost springs, together with the directsubsurface discharge from the limestone, keeps the tufa deposits perennially saturated nearly to the land surface. Ground water drains bygravity from the tufa and issues as springflow and seepage near the baseof the terrace, where part of the water again infiltrates and rechargesthe next lower terrace. Figure 7 shows the inferred paths of groundwater movement through the terraces.
Total estimated discharge of Wah Wah Springs is about 500 gal/min(32 lis), or 800 acre-feet (0.987 hm 3
) annually. (See table 8.) About380 gal/min (24 lis) or 600 acre-feet (0.740 hm 3
) is diverted by pipelines to other parts of the valley. The remaining 200 acre-feet (0.247hm 3
) is consumed by evapotranspiration near the point of discharge.
23

N
/
..
PLAN VIEW
FEE T5700
EXPLANATION
•Approximate ground-waterflow path
Approximate potentiometricsurface
----Spring
FEE T5700
5600
METRES1725
5600
5500
Limestone
SECTIONAL VIEW
Alluvium"-. "--- "---"---
5500
1 700
1 675
1 6505 4 0 0 '---------- --------'>-----~---"~5 4 0 0
I IY, 1 KI LOMETRE
VERTICAL EXAGGERATION X 1 BOATUM IS MEAN SEA LEVEL
1 MILE-----i
Figure 7.-Diagrammatic sketches showing inferred paths of ground-watermovement in the Wah Wah Springs discharge area.
24

covering an estithe springs suprabbitbrush andto sustain thisspringflow, and
Spring deposits and associated alluvial soilsmated 400 acres (162 hm 2 ) in the immediate vicinity ofport a relatively dense growth of grass and in places,greasewood (see figs. 2, 4, and 5). The water requiredvegetation comes from precipitation, from undiverteddirectly from the saturated zone.
Annual consumptive use of water by vegetation in the dischargearea is assumed to average about 2 feet per acre (1.5 m/hm2
). Totalconsumptive use is therefore about 800 acre-feet (0.987 hm
3). During
the growing season (April-September), precipitation and undivertedspringflow together may provide as much as 200 acre-feet (0.247 hm 3
) ofwater to the vegetation. The remaining 600 acre-feet (0.740 hm 3
) isobtained directly from the saturated zone.
Total annual ground-water discharge in the immediate vicinity ofWah Wah Springs thus is estimated to average about 1,400 acre-feet (1.73hm 3 )--800 acre-feet (0.987 hm 3 ) by springflow and 600 acre-feet (0.740hm 3 ) by evapotranspiration. This estimated volume of discharge is equalto the estimated average annual recharge available to the spring area(see p. 23).
Quartzite and metasedimentary rocks
Quartzite and slightly to highly metamorphosed shale and siltstone beds underlie much of the Wah Wah Valley drainage basin. Themaj or exposed rocks of this group (pzq and P-€, pI. 1) are the quartzitesthat form prominent cliffs at the extreme southwestern corner of thearea in the Wah Wah Mountains and in the San Francisco Mountains northof Frisco Peak.
These quartzites and associated rocks are relatively impermeableoverall. The exposed rocks exhibit local zones of moderate to high secondary permeability that have resulted from fractures and faults, however, and such open fissures may occur also in the subsurface. Therocks crop out over about 12,000 acres (49 km 2 ) of the drainage basin,mostly above an altitude of about 7,000 feet (2,130 m) where annual precipitation averages 12 inches (305 mm) to slightly more than 16 inches(406 mm). Most of the precipitation on the outcrops runs off because ofthe dense surface and the precipitous slopes, especially in the SanFrancisco Mountains. Where the exposed rocks are fractured, somerecharge occurs.
The only known water sources in the drainage basin that yield water from quartzite or associated rocks are Pitchfork and CrystalSprings, (C-25-13)36cba-Sl and (C-26-l3) 22acc-Sl, respectively (table8). Crystal Spring, which was dry when visited in October 1972, issuesnear the base of a large talus cone of quartzite blocks below a massivequartzite cliff. Several similar dry spring or seep areas were observedat the base of quartzite talus slopes at the southern end of the Wah WahMountains. It is probable that the talus directly absorbs much of therunoff from the steep slopes and also receives ground-water discharge
25

from the fractured quartzite. The water is released over a period of afew weeks or months to springs and seeps at the foot of the talus slope.Thus, most, if not all, of the springs discharging from quartzite talusare small and ephemeral. Some springs may discharge directly from fractured quartzite, although none were observed in the field.
Total discharge of all springs issuing from quartzites and associated rocks, or from talus at the base of outcrops of these rocks, isestimated to average no more than 10 acre-feet (0.012 hm 3
) annually.Some water is discharged by evapotranspiration near the base of the talus slopes, and the remaining ground water moving through these rocks isdischarged in the subsurface to adjacent aquifers. Total natural discharge is equal to total recharge.
The potential for development of perennial water supplies fromthese rocks probably is slight. Some natural discharge areas might bedeveloped to salvage water now being lost by evapotranspiration, butareas susceptible to such development are isolated and in extremelyrough terrain, and yields would be small and ephemeral.
Summary of ground-water recharge and discharge
Recharge to the ground-water system in the Wah Wah Valley drainage basin is estimated to average about 10,000 acre-feet (12.3 hm 3
) annually (table 5). Estimates and measurements of discharge from theground-water reservoir in the basin total about 1,500 acre-feet (1.85hrn 3
) annually. Because recharge and discharge must be equal over a longperiod of time, the difference between the two totals must representsubsurface outflow, which it was not possible to measure or estimate directly with any assurance of accuracy.
As pointed out by Snyder (1963, p. 499), the area between theConfusion Range and the Wah Wah Mountains (Tps. 23-24 S., Rs. 14-15 W.)appears to be underlain by a pediment with only a veneer of alluvial material covering the bedrock. The logs of wells (C-23-l4)27bcb-1 and(C-24-14)7cac-l (table 7), however, indicate that there may be 450 feet(137 m) or more of valley fill at those locations. No other well records are available for this part of the drainage basin. The paucity ofdata on both subsurface lithology and water levels precludes a reliableestimate of volume or direction of ground-water flow.
Until additional data are available to define better the groundwater conditions in adjacent areas, especially to the north and northwest, no better definition of the ground-water budget for the Wah WahValley drainage basin is possible. Although it was not possible to prepare a balanced budget by direct measurement or estimate, the quantitiesgiven in table 5 are believed to indicate the correct order of magnitudeof the various budget items.
26

Table 5.--Ground-water recharge and discharge in theWah Wah Valley drainage basin
Estimated quantity(acre-feet/year)
Recharge:From precipitation in drainage basin (table 4)Subsurface inflow from Pine Valley (p. 12)
Total
Discharge:Evapotranspiration from:
Stream-channel alluvium (p. 13)Wah Wah Springs discharge area (p. 25)
Flow and pumpage 1 from wells and springs from:Stream-channel alluvium (p. 13)Older alluvium (p. 18)Extrusive rocks (p. 20)Intrusive rocks (p. 20)Quartzite and metasedimentary rocks (p. 26)Wah Wah Springs (carbonate rocks and springdeposits) (p. 23)
Total (rounded)
7,0003,000
10,000
40600
502
242410
800
1,500
lQuantities are estimated total discharge. Includes an estimated300 acre-feet used for irrigation, stock watering, and wildlife; therest ultimately is consumed by evapotranspiration not included above.
Chemical quality and temperature of the water
Exclusive of springflow, the only information available for thechemical quality of surface water in the Wah Wah Valley drainage basinconsists of five field measurements of specific conductance. The specific conductance of water impounded in Lawson Cove Reservoir on October13, 1972, was 270 micromhos per centimetre at 25°C, from which the concentration of dissolved solids was estimated to be about 160 mg/l (milligrams per litre). The water temperature was 10°C (50°F). Waterimpounded in the reservoir at the time of measurement was runoff fromrainfall during the previous week. The specific conductance and concentration of dissolved solids could be expected to increase rapidlywith prolonged storage and concomitant evaporation, especially duringthe summer months.
27

Specific conductance and temperature measurements of streamflowin Quartz and Willow Creeks were made on June 21, 1973, as follows:
DischargeSpecific
conductance(micromhos/cm at 25°C)
Estimateddissolvedsolids(mg/l)
Watertemperature
(OC)
Quartz Creek at(C-28-l5)35acd 0.29 0.008 2,000
Willow Creek at(C-29-l5)2dad 2.05 .058 770
Willow Creek at(C-28-l4) 2lbbc 1.26 .036 1,000
Willow Creek at(C-28-l4)16acc (1) 1,000
1,200
460
600
600
23
17
27
29
1Sample collected near point where streamflow was completelydepleted by streambed infiltration and evaporation.
Tables 9 and 10 give the results of chemical analyses of groundwater samples from the Wah Wah Valley drainage basin. Plate 1 shows thelocations of sampling sites, the general ranges of concentrations ofdissolved solids inferred for ground water in parts of the area, and thechemical characteristics of selected water samples.
Concentrations of dissolved solids in 20 samples of ground waterfrom the drainage basin ranged from 99 to 4,550 mg/l (table 9). Nearlyall the sources sampled yielded very hard water. As shown on plate 1,water from consolidated rocks generally contained calcium as the predominant cation, whereas in water samples from the valley fill, sodiumpredominated. Predominant anions in most samples were bicarbonate orchloride, although sulfate was predominant in a sample from the CactusMine tunnel, (C-27-13)9aba. Most water sources in the basin yield freshwater (less than 1,000 mg/l of dissolved solids). In general, the highest concentrations of dissolved solids were found in water from igneousrocks, and the lowest concentrations were found in water from quartziteand carbonate rocks.
All the sources sampled apparently yield water of satisfactorychemical quality for livestock use. Several samples contained concentrations of dissolved solids or individual constituents that might makethe water undesirable for domestic use. Table 9 lists the u.S. PublicHealth Service (1962, p. 6-8) standards recommended for drinking watersupplies for comparison with analyses of samples from the Wah Wah Valleydrainage basin.
Water from Wah Wah Springs, the only source regularly used fordomestic supply, meets the recommended standards for all constituentslisted in table 9. According to the classification system developed by
28
the U.S. Salinity Laboratory Staff (1954, p. 79-81), water from thesesprings has medium salinity hazard and low sodium hazard for irrigationuse.
Ground-water temperatures in the drainage basin range from 11.5°to 24.5°C (53°-76°F) (tables 6 and 8). This range is from 1° to 14°C(2°-25°F) higher than the mean annual air temperature of 10.5°C (50.9°F)observed at Wah Wah Ranch (table 1). The highest water temperatureobserved was at well (C-28-14)11abb-l. As shown by the temperature login figure 6, the geothermal gradient at well (C-28-14)11abb-l averagesabout 0.8°C (1.4°F) per 100 feet (31 m) below a depth of 680 feet (207m). Assuming that the mean annual surface temperature at the well isequal to that at Wah Wah Ranch (table 1), the average gradient for thetotal depth of 1,472 feet (449 m) is about 1.2°C (2.2°F) per 100 feet(31 m). The water temperature of 24.5°C (76°F) measured during testpumping of the well is indicative of the depth of the water-yieldingstrata--680 to 1,000 feet (207-305 m) below land surface (table 6).
Wah Wah Springs can be classed as "thermal" or "warm" because thewater temperature averages about 8.5°C (15°F) higher than the meanannual air temperature. (See Mundorff, 1970, p. 7.) Assuming a geothermal gradient equal to that at well (C-28-14)11abb-l, the water temperature of the springs could be accounted for by circulation ofatmospheric water to a depth of about 700 feet (213 m) below land surface. The vertical distance between the recharge area in the Wah WahMountains--mostly above 6,000 feet (1,830 m) (pl. l)--and the highestdischarge point of the springs--5,640 feet (1,720 m) (table 8)--wouldprovide the necessary depth of circulation. Tertiary igneous rocks areexposed nearby and may underlie the spring area at depth, but theobserved water temperatures at Wah Wah Springs indicate that these rocksprobably have little effect on the local geothermal gradient.
SUMMARY AND NEEDS FOR FUTURE STUDY
Surface-water supplies in the Wah Wah Valley drainage basin arenegligible. Annual overland runoff averages about 7,800 acre-feet (9.62hm 3
), and all streams in the area are ephemeral or intermittent. Smallsurface reservoirs intermittently provide some water for livestock, butexcept for those receiving diversions from springs, none of the reservoirs provide dependable storage. Evaporation and transpiration withinthe basin annually consume more than 97 percent of the total precipitation.
Total annual recharge to the ground-water system in the basin isestimated to avera~e about 10,000 acre-feet (12.3 hm 3
) annually--7,000acre-feet (8.63 hm ) from precipitation in the basin and 3,000 acre_£eet(3.70 hm 3
) from subsurface flow from Pine Valley under the topographicdivide in the Wah Wah Mountains.
Records are available for eight springs that discharge 25 gal/min(1.6 lis) or less of water from stream-channel alluvium, igneous rocks,and quartzite strata. The extrusive rocks in the southern part of the
29

valley and the intrusive igneous rocks in the San Francisco Mountainsyield small quantities of ground water from fractures and faults bydrainage from several mines and prospect pits. The valley-fill depositsunderlying about 115,000 acres (465 km 2 ) of the floor of Wah Wah Valleyappear to have some potential as a ground-water source; but only onesuccessful well, which discharges 1 to 2 acre-feet (1,230-2,470 m3
)
annually, has been completed in these deposits to date (1973).
The most productive aquifer in the basin is the carbonate rocksof Paleozoic age that crop out in the Wah Wah Mountains and probably extend under most of the drainage basin in the subsurface. The only knownground-water discharge from these rocks is by flow from Wah Wah Springs,the discharge of which originates as precipitation on the Wah Wah Mountains. The estimated total annual discharge of the springs is about 800acre-feet (0.987 hm 3 ), of which an estimated 600 acre-feet (0.740 hm 3
)
is diverted for irrigation, livestock, and domestic use at Wah Wah Ranchand livestock and wildlife use elsewhere in the valley. About 200 acrefeet (0.247 hm 3 ) of springflow is consumed annually in the dischargearea by evapotranspiration, and an additional 600 acre-feet (0.740 hm )is discharged directly from the saturated zone by this same mechanism.
Ground water originating in the Wah Wah Valley drainagethat is not discharged locally--an estimated 8,500 acre-feet (10.5annually--probably moves northward out of the basin as subsurfaceflow.
Few data are available from which to estimate the volume ofground water in storage. The total amount of water in storage in thevalley fill undoubtedly is large, but the amount that is potentially recoverable from storage cannot be reliably estimated from available data.The volume of water in transient storage in the carbonate rocks of theWah Wah Mountains probably is large, but storage in the other knownwater-yielding rocks is minor.
Most known ground-water sources in the Wah Wah Valley drainagebasin yield fresh, very hard water. The quartzite and carbonate rocksand the valley fill in the southern part of the basin yield water containing less than 1,000 mg/l of dissolved solids. The igneous rocks andthe valley fill in the northern part of the basin generally yield watercontaining 1,000-5,000 mg/l of dissolved solids. Nothing is known aboutwater quality in the northwestern part of the basin or in possible aquifers below the valley fill.
The valley fill and carbonate rocks are believed to have some po~
tential for additional ground-water development. To verify and furtherevaluate the estimates and conclusions made in this reconnaissance, thefollowing kinds of information are needed:
1. Exploratory drilling in the valley fill to depths of 800-2,000 feet(244-610 m), especially in the area south of the Wah Wah Valley Hardpan.Most prior attempts to obtain ground water from the valley fill havebeen unsuccessful, but the conclusions from the reconnaissance indicate
30

that the valley fill probably is saturated at greater depths than havegenerally been drilled.
2. Exploratory drilling in the carbonate rocks that underlie the valleyfill and that are exposed on the eastern flank of the Wah Wah Mountainssouthwest of Wah Wah Springs to evaluate ground-water conditions.
3. Detailed mapping of geologic structure on the eastern flank of theWah Wah Mountains southwest of Wah Wah Springs.
4. Geophysical surveys or exploratory drilling in the areas of extrusiv~ rocks in the southern part of the basin to location and evaluateareas potentially favorable for ground-water development.
5. Detailed investigation of water-quality variations, laterally andwith depth, in conjunction with test drilling. The carbonate rocks below the valley fill might be expected to contain water comparable inquality to that discharging from Wah Wah Springs, and the valley fillthroughout the southern part of the area should contain water comparablein quality to that discharged by well (C-28-14)11abb-l.
31

SELECTED REFERENCES
Butler, B. S., 1913, Geology and ore deposits of the San Francisco andadjacent districts, Utah: U.S. Geol. Survey Prof. Paper 80.
Eakin, T. E., and others, 1951, Contributions to the hydrology of eastern Nevada: Nevada State Engineer Water Resources Bull. 12.
Gilbert, G. K., 1890, Lake Bonneville: U.S. Geol. Survey Mon. 1.
Hood, J. W., and Rush, F. E.,Snake Valley area, Utah andPub. 14.
1965, Water-resources appraisal of theNevada: Utah State Engineer Tech.
Hood, J.SkullTech.
W., and Waddell, K. M., 1968, Hydrologic reconnaissance ofValley, Tooele County, Utah: Utah Dept. Nat. ResourcesPub. 18.
Meinzer, O. E., 1911, Ground water in Juab, Millard, and Iron Counties,Utah: U.S. Geol. Survey Water-Supply Paper 277.
Moore, D. 0., 1968, Estimating mean runoff in ungaged semiarid areas:Nevada Dept. Conserve and Nat. Resources Water Resources Bull. 36.
Mower, R. W., and Cordova, R. M., 1974, Water resources of the Milfordarea, Utah, with emphasis on ground water: Utah Dept. Nat. Resources Tech. Pub. 43.
Mundorff, J. C., 1970, Major thermal springs of Utah: Utah Geol. andMineralog. Survey Water-Resources Bull. 13.
Peterson, D. L., 1972, Complete Bouguer anomaly map of parts of Beaver,Iron, and Millard Counties, southwestern Utah: U.S. Geol. Surveyopen-file map.
Sandberg, G. W., 1966, Ground-water resources of selected basins insouthwestern Utah: Utah State Engineer Tech. Pub. 13.
Schmoker, J. W., 1972, Analysis of gravity and aeromagnetic data, SanFrancisco Mountains and vicinity, southwestern Utah: Utah Geol.and Mineralog. Survey Bull. 98.
Snyder, C. T., 1963, Hydrology of stock-water development on the publicdomain of western Utah: U.S. Geol. Survey Water-Supply Paperl475-N.
Stiff, H. A.,by meansp. 15-17.
Jr., 1951, The interpretation of chemical water analysisof patterns: Jour. Petroleum Technology, v. 3, no. la,
Stokes, W. L., ed., 1964, Geologic map of Utah, scale 1:250,000: UtahUniv.
32

u.s. Environmental Science Services Administration, Environmental DataService, 1967-70, Climatologic data, Utah, 1966-69: v. 68-71, no.13.
U.S. National OceanicData Service,
172-74, no. 13.
and Atmospheric Administration,1971-73, Climatologic data, Utah,
Environmental1970-72: v.
U.S. Public Health Service, 1962, Public Health Service drinking waterstandards: U.S. Public Health Service Pub. 956.
U.S. Salinity Laboratory Staff, 1954, Diagnosis and improvement of saline and alkali soils: U.S. Dept. Agriculture Handb. 60.
U.S. Weather Bureau, 1937, Climatic summary of the United States, climatic data from the establishment of stations to 1930, inclusive;section 20, western Utah.
_____1957, Climatic summary of the United States - Supplement for 1931through 1952, Utah: Climatography of the United States No. 11-37.
____~1962-66, Climatologic data, Utah, 1961-65: v. 63-67, no. 13. 2
_____1965, Climatic summary of the United States - Supplement for 1951through 1960, Utah: Climatography of the United States No. 86-37.
(no date), Normal annual and May-September precipitation (1931-60)-----for the State of Utah: Map of Utah, scale 1:500,000.
ISee references to U.S. Weather Bureau for data publ~shed pxiorto 1967.
2 See references to U.S. Environmental Science Services Admin!....stration and U.S. National Oceanic and Atmospheric Administration fordata published after 1966.
33


APPENDIX
35

Numbering system for hydrologic-data sites
The system of numbering hydrologic-data sites in Utah is based onthe cadastral land-survey system of the U.s. Government. The number, inaddition to designating the well or spring, describes its position inthe land net. By the land-survey system, the State is divided into fourquadrants by the Salt Lake base line and meridian, and these quadrantsare designated by the uppercase letters A, B, C, and D, indicating thenortheast, northwest, southwest, and southeast quadrants, respectively.Numbers designating the township and range (in that order) follow thequadrant letter, and all three are enclosed in parentheses. The numberafter the parentheses indicates the section, and is followed by threeletters indicating the quarter section, the quarter-quarter section
land
the quarter-quarter-quarter section--generally 10 acres (4 hm2); the
letters a, b, c, and d indicate, respectively, the northeast, northwest,southwest, and southeast quarters of each subdivision. The number afterthe letters is the serial number of the well or spring within the10-acre (4 hm 2
) tract; the letter "s" preceding the serial numberdenotes a spring. If a well or spring cannot be located within a10-acre (4 hm 2 ) tract, one or two location letters are used and theserial number is omitted. Thus, (C-24-l3)34ccb-l designates the firstwell constructed or visited in the NW~SW~Sw~ sec. 34, T. 24 S., R. 13w. Other sites where hydrologic data were collected are numbered in thesame manner, but no serial number is used. The numbering system isillustrated in figure 8.
Use of metric units
Most numbers are given in this report in English units followed bymetric units in parentheses. The conversion factors used are:
English MetricUnits Abbreviation Units Abbreviation
(Multiply) (by) (To obtain)
Acres acres 0.4047 Square hectometres hm 2
.004047 Square kilometres km2
Acre-feet acre-ft .0012335 Cubic hectometres hm 3
1233. Cubic metres 3mCubic feet ft .02832 Cubic metres 3mFeet ft .3048 Metres mFeet per Metres per square
acre ft/acre .7532 hectometre m/hm 2
Gallons gal 3.785 Litres 1Gallons perminute gal/min .06309 Litres per second lis
Inches in. 25.4 Millimetres mmMiles mi 1.609 Kilometres kmSquare miles mi 2 2.59 Square kilometres km z,
lAlthough the basic land unit, the section, is theoretically aI-mile (1.6 km) square, many sections are irregular. Such sections aresubdivided into 10-acre (4 hm Z) tracts, generally beginning at thesoutheast corner, and the surplus or shortage is taken up in the tractsalong the north and west sides of the section.
36

Chemical concentration and water temperature are given only inmetric units. Chemical concentration is given in milligrams per litre(mg/l). For concentrations less than 7,000 mg/l, the numerical value isabout the same as for concentrations in the English unit, parts permillion.
ionic interacting values isMeq/l is numerically equal
Chemical concentration in terms ofgiven in milliequivalents per litre (meq/l).to the English unit, equivalents per million.
Water temperature is given in degrees Celsius (OC), which can beconverted to degrees Fahrenheit by the following equation: of = 1.8(OC)+ 32.
Sections within a township Tracts within a sectioo
R. 13 W. Sec 34
b a
Ib
I aI
Well I d
~~r---- c- I dc , d I
I1.1 / I mil e -----------4'[I
(C-24-13)34ccb-1
6 5 4 I~ 2 I
7 8 9 I~ II 12
18 17 16 15f\\4
13
~~
21 22 2~ 24
30 29 ~~
26 :~5Well
~ f\ 3~31 32 33 /34,• K
~------6 mi les ~
"\~
T.24S.
II
A L _BASE LINE I
II ~r-----1 ~
I"
MILLARD CD ._--1___ C )
I .---r'T. 24 S., R. 13 Wr 'J §
BEAVER CO~---II
I------
"-Sail LakeC,ly I
II
_____ J
Figure 8.- Numbering system for hydrologic-data sites.
37


BASIC DATA
39

Tahle 6. --Records of selected wells and mine drains
Owner or user and local name: Local name or description in parentheses; BLM, U.S. Bureau of Land Management.Geologic source of water: Sell tahlll 2 for explanation of symhols and description of lithologic units; N, no water-yielding formation reported.Altitudr" of land-surfacll datulll: Tn leet above mean sea It~vel, interpolated from U.S. Geological Survey topographic maps.Water level below land-surface datlnn: n, reported dry by driller; R, reported; all others measured by U.S. Geological Survey personnel.Method of lift: F N, none; T, turbine p\lmp.Yield rate: M, m,,,aslln,,d U.S. Cp.ologiclll Survey personnel; all others reported; ,less than.lise of w:1.ter· .'1, liv,~st(lck.
Renlarks and other data 8vai.lable: C, chl'luicaJ Hnalysis of water in tahle 9; t, driller's log in table 7; Z, plugged and abandoned or otherwise destroyed.
.'f IlSCf dllli1,H'd 1 name
(l-n-14)27 11 ('11-1 1111'1 (Wil]ln .Jam{·s
h't' 11)
Ye21r lkptl, "t r;p"logitwe 11 S()'lfee "f
st rllct"d (!""l)
44')
\1 til udl· uj
land-surface
dat IIlII
J,lbO
Below land- Date "fslJrface dat'lInl measlln·m(·nl
')-28-41
Yie ldMethod Rate Date of Use uf
uf (f4all measurement water1 ift min) repllrt
Watertemperatllrp(0<:)
Remarks and otherdata avai lable
L,
«( -24-1 '5) ]]t.1aa -1 (\"'11 C lall11 NI'.I"'c\"rill)
J!Hch-l !\1.:'-\ (',,'All ~rah Well)
19')j
1914
1,9/'l
294
Q'l'a
QTa 4,64') 222R220R212.1
12-28-34( ?)1963('?)
10 - 13 ~ 12
30 12-28-34 15.5
OJ I test; L, Z
Cased to 236 It with8-in and 6- ill.
casing, upen hole(?)
below 236 It; C, L.
(l -24 II.) KLi't (Cfass',' (live We tl) 1936 656 'i ,300
It -2/-13)9ill"J U:actlls Mi.ne tllnne I) 1905('1) '),780
lldhd Min!:') IS79( ') Ti 6,50014ded Ti 70026 ...:<1'" Tl'
3-1236
10 1919\ 7- 7-363M 10-12-72
30 1879( ?),6 9- 9-63
1913,2\ 19.15
1 5- -70<.lM 10-10-721. 5M 6-21-73
15.0
13.0
12.0
c, Z.
Water is piped frommine tunnel to storage tank and truughnear tunnel entrance; C.
C,
Water piped fromilbandoned mi.ne work-ings prospectpit; C.
(C-27-14)11aiJd-l IlI.M ')00 5,020 9- -51 Drilled to 282 it in1948; deepened to500 ft in 1951; L,2,
(C-28-13):.!8ddc-1 IILM (St>veys Well)
(C-28-14) llabh-l (Edrtll Sciences,
Inc.)
(C ~2H - I 'i) led!> 1111'1
.l'Jilad-1 (tliludin(ll{anch
Well)
,2)197]
1932(':)
1,472
[2(')
Qay
QTa
T.
S,995
'>, J 90
5,660
6,050
672 9-28-73
y,35M 6-21-73
2/2- 13-74
1M 1O-11-"l2
13.5
2/ 24 ,5
14,0
Shallow·{!xcavation instream-channel alluvium; runoff andground water arecollected i.n 8 ft x
8 ft open-end concrete box; dischargesto pipeline outletslight ly he low landsurface; gravityflow through pipeline tu storage tankClnd troughs in S~
sec. 32, T. 28 S.,R.13W.;C.
Test well. Drilledto 660 ft in 1972;reported dry. Deepened to 1,472 it in1973; wster-beari.ngstata reported 6801,000 ft. Construction and developmentincomplete Dec. 1973.GeophysicRI and temperature logs infig. 6; C, L.
Specific conductance1,500 micromhos/cmilt 25°C; '.-i-ft diaml'ter poul; water~eeping frum buriedpipe dischargingfrom abandool':'d pruspect pit .
4-ft diameter rockcribbed dug wl':'11 instream channel nearabandoned ranchhpuse; caved andpartly filled
1/ See Remarks and other data available.2/ Measured at tank in S) sec. 32, 1'. 28 S., R. 13 W.
}/ Pump temporarily installed for pumping test. Average yield during 24-hour test on February 12-13, 1974. was about 950 gal/min; maximum pumping rate during testahollt 1,350 gal/min. l'emperatllre of water varied from 24.0 cc to 24.<)cC duri.ng test.
40

Table 7.--Dri11ers' logs of wells
Altitudes are for the land surface at well, in feet above mean sea level.Thickness, in feet.Depth to bottom of unit, in feet below land surface.
(C-23-14)27bcb-l. Log by W. T. Chealey.Alt. 5,160 ft.
Clay, sandy. • •••Boulders (lime) • • •• • •Sandstone, brown. • • • • •Boulders (lime) • •Gravel. . . . . . . . . . .Sandstone, broken • • • • •Boulders (hard lime) ••
(C-24-13)33daa-l. Log by J. S. Lee and Sons.Al t. 4 , 650 f t.
Thickness
3109
18126
435
150
Depth
3112130256260295445
Clay, white · · · · · · · · · · · · 233 233Sand and gravel; water bearing. 3 236Clay, white · · · · · · · · · 9 245Conglomerate. · · · 21 266Clay, white; caving · · · · · · · · · 44 310Conglomerate. · · · · 54 364Clay, red, and conglomerate · 126 490Sand; water bearing · · · · 9 499Clay and conglomerate; caving. · 181 680Clay, sticky. · · · · 85 765Silt and sand · · · · · · · · 45 810Silt; caving. · · · · · · · · · · 18 828Clay and lime mixture · · · · 104 932Shale, blue, hard · · 32 964Shale, gray · · · 20 984Lime and shale. · · 81 1,065Shale . . . · · · · · · · · · · · · 60 1,125Sand; water bearing 15 1,140Shale, sticky · · · · · · · · 35 1,175Shale, hard · · · · 31 1,206Shale, soft; caving 9 1,215Shale and "shells". · · · · · · · · 30 1,245Shale, gray · · 80 1,325Lime and shale. · 160 1,485Lime, hard. · · · · · · 260 1,745Lime, sandy · · · · · · · 25 1,770Lime, hard. · · · 55 1,825Shale, gray, very sticky. · 146 1,971
41

Table 7.--Drillers' logs of wells - continued
Thickness Depth
(C-24-l3)34ccb-l.Robinson. Alt.
Log by H. L. Hall and H. M.4,645 ft.
Clay, light-colored ••Clay, light brown.Clay, brown ••••Clay, gray, with gypsum.Clay, brown • • • • • • • •Sand, fine; water bearing •••••Gravel, hard, porphyritic (conglomerate ?) ••Gravel; water bearing •••••••Unreported. • • ••••••••
(C-24-l4)7cac-l. Log by B. M. Jones.Alt. 5,300 ft.
Topsoil, clay, and gravel ••••Shale, gravelly • • • • • • •Clay, gravel, rock, and "shell"Limestone • • • • • • •Conglomerate, white porphyry ••
(C-27-l4)27abd-l. Log by J. S. Lee (0 to282 ft) and B. B. Gardner. Alt. 5,020 ft.
356541
980
43620
4
84132264136
40
35100141150230234270290294
84216480616656
Soil.Clay.Conglomerate. • • • • • •Silt, sand, and gravel. . . . . . . . . .
46
272218
410
282500
(C-28-l4)11abb-l. Summary log by H. A. Perry,Earth Sciences, Inc., project geologist(written commun., 1974) from driller's reportsby J. S. Lee and Sons Drilling Co.Al t. 5 , 190 ft.
Unreported. • •Conglomerate.Sand and gravel •Conglomerate, containing lavaConglomerate. • • • • • • •Conglomerate and boulders • •Conglomerate. • • • • . • •Conglomerate and boulders •Conglomerate. • • •Conglomerate, light gray.
and quartz.
42
4720
31080193938
46917
47677080
160179218256725742

Table 7.--Drillers' logs of wells - continued
Thickness
(C-28-l4)11abb-l. - continued
Depth
Conglomerate, light gray; more tightlycemented. · · · · · · 20 762
Conglomerate, gray. · · · · · · · · · · · · · 38 800Conglomerate. · · · · 40 840Conglomerate and boulders · 28 868Conglomerate. · · · · · · · · · · · · · 52 920Conglomerate; hard streaks as much as 3 feet
thick . . · · · · · · · · · · · 25 945Conglomerate. · · · · · · · · · · · · · · 15 960Conglomerate, hard. · · • · · • · · · · · 4 964Conglomerate. · · · · · · · · 29 993Conglomerate and sticky clay streaks. · · · · 27 1,020Conglomerate and clay streaks · · · · 20 1,040Conglomerate and sticky clay streaks. 20 1,060Conglomerate and clay streaks · · · · · · 23 1,083Conglomerate and sticky clay streaks (90 per-
cent clay and gravel) · · · · 25 1,108Clay and gravel · · · · · · · · 20 1,128Clay, sand, and gravel, sticky. · · · · · · · 21 1,149Clay and gravel · · · · · · · · · 24 1,173Clay, sticky, with little gravel. 20 1,193No data . . · · · · · · · · · · · · · · · 279 1,472
43

Table 8. --Records of selected springs
Owner ur user and local name: [,ocal name or number in parentheses; BLM, l.'.S. Bureau of Land Management.(;eologic source of water: See tablp 2 for explanation of symbols and description of lithologic units.Altitude at source: In feet ahove mean sea level, interpolated from U.S. (;eu10gic81 Survey topographic maps.Yield: E, esti.mated hy U. S. Ceo1012;ical Survey personnel; seep, less than 0.1 gal/min.\'s<' of wau'r: H, domestic; I, irrigatir'n; S, livestock; lI, \Inused.Hf'TImrks and ~lthl'r data availabll~: C, chemical analysis of water in tahle 9.
L.'ologic Yil'lJ WaterLucatiul1 ()wnt'f <Inri Ipel! 1l,lfilP Al t i tlJdt, (gal! Date oJ L;::;e of temperaturl' Remarks and other
uf wiltpr ,1t ,sourcl' min) measu femt' n t water ("e) data available
(c:-/ CJ_I]) '36c],:I-S 1 SUlt"l' '" lltdh pf: 6,2nO(Pi tchf()rk Spr Ing)
(C- 211-1)) n<\cc-:> I illJl (Cry~.; r d I Spr i Ilg) Pzq 6,92U Dry when visited 10-12- 72;c.
1.\ )i+dlllJ-S I (ClIllk Sprill!';) l'i('.') r),180 31.' 1963 Dry when visited 10-12-72.
h'AJI SJ'}{INC~t.; I,,
'J)I( ",·-s 1 \~ah Wall IZ,llWII 7) qrs .51: 10-12-72W,lh Wah I~C\n,-, !I Il) In's Seep 10-12-72 15.0 c:onductance
micrQmhos/cm at 25°C.:dil("-S 1 \4.lh J",1:lIl 1,;11H:1I 10) Pzc (?) ')10 Dry 10-12-72~'dda~S 1 \,l,lh ',hLil I{un('h YJ I)'l's Seep 10-12-72 12.0 conductance
micromhof>/cm at 25°C.11;1:1(1-.'11 \.'<.dl \Jah 1{,llWIi C'". :') liTe; 'J, ';,40 IOE 10-12-72 H,I,S 19.0 Piped to Wah Wah Ranch; C.
I LICld-SJ \~cl h i{,U1<"h J) LiTe; 5, rJ40 'JI: 10-12-72 H, I ,S 19.0 Do.
II :liJil-S 1 I,lah Ranch I) pzc 5,640 4S0E 10-12-72 II, r ,S 19.5 Do.
Ilhb<l-S 1 I·hlll W"ll [{/lnCll Il) qT~; 11,1,.'1 18.0 Do.
l1.bk-:-;1 \~ah Io!dh [{anch ',) 10E 10-12-72 H, I ,S 18.0 Do.12b,'d-Sl wah \~;lil Ranch 4) ZOE 10-12-72 S 16.5 Piped to stock tanks On valley
floor to southeast .J)
(C-2n-1 » 18,11)(I-S 1 blJl (.\ntl-,ll1p(' Spr Lng) ), ')30 'jE 8-31-63 14.5 Flow co llec ted in excavation atbase of hi 11, drained bynatural channel toward valleyfloor; C.
(C-/.H-1'i) 1(bbiJ-S 1 ])I:M (Ki 1n Spri ng) l't' S,850 ')1:: 10-11- 72 ]l1.O Flow channeled to shallow pondabout one-tenth of an acre inextent; c.
L')ccc-S 1 Tt, 6,040 LUI.' 6-21-73 11. S C.
(l-L9-1'i)Ldad-SI SLltl' of l)tall qny (l,150 251 6-21-73 13.0 Part of flow piped to stoek(\~ill()lv Spring) tanks on "alley floor to
northeast.l/ C.
(C-2Y-1fi)2Jcd-Sl BLM (Arrowhl';,d Spring) l't- 8,050 14.0 Part of flow piped acrossdivide to stock troughs inEscalante drainage basinto southeast .f"!..! c.
III ;ldJitiun lo the divl~rsion to Wah \~ilh Itanch, clbout 14 gal/min of water is diverted from Wah \</a!l Springs collection system to stock tanks,t and ponds in Sl'CS. Il, 20, and 31, T. 26 S., R. 14 IL by a 6.7-mile pipeline (U.S. Bureau of Land Management, written conunuo., 196fi). Totaldischarge of \~ah \~ah Sprinf,s,illcluding diversions, l~stin1ilted to bE' at least SOO gal/min in October 1972.
CulLE'ctlun system UlIlsist;; of iI-inch drain tile buried in 3pring area and running to concrete headbox. A 5-mile pipeline conveys about 8<11 w;iler frulll tIll' IWddlJux to st-ot:k [u)uglls in secs. 24 and 25, 1'. 27 S., IL 15 \~., dnd sec. 29, T. 27 S., H.. 14 W. (U.S. Bureau of Land Manage-
IIwnt, writtl'l1 cummun., 1960).
l/ C<lIJection svstl'm c011si ...,(s of 200 fl>£'t of 4-incll drain tile buried in spring area clOd running to a concrete headbox. A 4-mile pipeline conveysdbo\lt IU t_',ill/min ()f wall'r fr')111 the Iteadbux to d :.l,OOO-gallon stur<lge tank and stock troughs in ;>cc. 29, T. 28 S., R. 14 w. (u.s. Bureau of Land Management,writt.en ("{)jlllllun., 1954).
4/ C<llll'ctionc'unvevs watler t rom
('Un,;IS(S uf ~-inch drain tile buried in spring area and running to corrugated-steel headbox. A total of J8 miles of pipelineheadbux to stock in sees. 26 and 3.5, T. 28 S., !e 15 W., and secs. 4, 14, 20, 22, and 35, 1'. 29 S., R. 15 W. (U.S.
!lure,lll uf L;;nd ~L'nagt·,m.. nt. written commull.,
44

['able 9.--Chemica1 analyses of ground wateJZ
[Analyses by If. S. ecological Surv<,y unless otherwise noted l
Cl;'olo,gic source:Dissolved solid!';:Additional data:
Local i (m
See tahle 2 for explanation uf symbols and d~scriptinn of lithologic units.c, calculated from slim o[ determined const,itllents; H11 others are residlH~ on ~'vaporatinn at 180"e.
M, data for certain minor chemical constituents gi.v~n in table 10.
Milligrams per litre
pH
l'lIhlil' He,lIth Service stClndardsl. i
(C-24-13) J4cch-1
9-2'>-,)]
0.1 O,()')
h4 l')
l() 47 4 r)6
\ I () Il. n ,D(J 77 2'1 \IlhIH1\
IH
l'!M160
186
[.2
\!6 1'1(,11
IYY b7i:lt;') ')8'1 O. S ') J
biO .4 4 9
SOU
2,640
o 11 I, hlO.!() I, 'ISO
I J 70(() .60 I (J I
I,
liOJI2
14b
20H 72 10I HI It
I 'J"j 72 10
2, no .32,]1:\0 . J
2., /10 7.2
(( -111-1 J)1Lacc-SI P/.q 9- H-h'l II I b .00 I H 4.'J I I ',(I I h 11, .3 1.0 OJ 9')
9Yc15 26 .6 158 7.3
(C 27-
2bcaa
«(;-27-15) llaha-Sl
12hcd-S 1ComhiJl{'J
I'il'i
(~Ts
IIJ-l;I-12 1').0 24'J- 9-63 II. U 11
10-10-',1 11... n 14') ~ 'J ~ IJ Jib. ()
21-61::\ 1\
12
OJ
.n: b')I)
I"
l48.O() 14'i
b;
6 j
.00 h4
19U !OU:01 tL'
I.h '~/bb
42 - II
29 n
20
) I 21
Ii J lJ26 I /~u
,6
110
1.4 J 11:\
(I I(I
hOD420
II, HJ 176 2ye)
14 Ii
t4 42
l,) 38
1.1 J/.04,6 II
.2 I H
.J II
.1 ') 7
.2 b,9
.2 _l/ 1,4
121.0
1,0
.0'1
. LO
.2111
.02
02
l. ,400 2, JOO l:II 89') 7flO 171,2hOc
799( ')58 l76 20l,eJOo 'd6 J4b 22
78Ic140 286 27 14l44(JJI::\ 2 1::\ tJ J2 1]
'J44c'148c 2YO l. 7 14
9 4,020 8.01.2 2, LOO 8.2
1,420 8.0I.] 1,410 8.0
.6 624 7,9
. ') 600 7.8
h 17 8.1
16 ,1 ,9
ll.:JiJd-S t;S2 121108-SI;
I
(C-18-1)) lbadb-Sl
2t\ddc-l
QTs 9-14-bJ
H-ll-Id
H-'ll-Ill
19.0
14.
1\ ';
II
12 b b
b{)
0')
10
II
I'i
20
1.1
/.11
291)
J 4 144
'j.l JIY b.O
1] b .3 III
!.o .7 ;> 'i
. 'ih
I.'i
.02
1(1
.06
)24
l26c446400c149146c
274
216
99
JO 14
91::\ 32
14
I 4
.J
')92 7.9
6h8 7.9
220 7.4
M
(C-28 ]4) I \;lbo-1 QTd Y-27-71 S8 21 h.4 flh II 169 82 32 1.0 1./ .8') .bl .2 J J85c 79 o 67 t+ ,2 535 8.3
(C-28-1 5) IOClhb-s I
2Sccc-SITe
Te
10-11- /2 \96-21-7'\ 1 . S tj 6
02 .0 I 120 \9 I J2(1 .3U blO 200
.8 Hl9I 21::\6
lY 110 .2 3/2.flII (] 2, JDO 1. 3 - .68
.tB 12 58bc 460 140 IJ .7 98') 7.5122.]0 4,S50c 2,500 2,200 18 6.11,4907.6
(C-29-15)2dad-SI 6-21-73 13.0 2H 10 .20 190 fJ4 130 17 ]39 no ]60 .J l/ .Il .03 .28 1,170(" 740 460 28 2 1 I, '::140 1.7
«( -29- J b) 2JccJ-S I it' 10-11-12 14.0 96 OJ .00 100 III b I 141 .1 if ./4 .06 290 II .2 ')50 8.1
1/ RecOImnended maximum limits for puhlic drinking Wiltl'r II S. Puhlic Jlealth Stervicc'. 10h2. p. 7-1::\). Limit fnr fluoride based on annual average of maximumdaily-tempe.ratllre at \.Jah l.Jah Ranch, 196R-72 (L'.S. f~nvironmenta1 ScienCl' Services Administration, 1969-70; u.s. t<lltional Oceanic and Atmospheric Administration,1971-71) .
2/ Analysis reported hv II.S. I',\lrl~a\l of Land !'lanagemt!nt1/ Nitrite (N02) + nit~atl~ (N01) rf·portl·d as nitrog(·n (n4/ Sodimn (Na) + pot.assium (K) derermined and reported as sodi\m1.
5/ SurfacE' runoff from rainfall contaminau·d thp water sO\lrc!' prior to diHl' nf co1l,'clio]} "t- silmple; analysis probahly does not truly represent water fromQay at this location.
(Set· tablt' 9 fur additi()llilJ e]\l'llIicilJ dilld)
(;pologic source: table 2 fur expLlniltion of symhols and dl,!;criptioll of lithologic units,
I.r>Cilt ion C('o]ogic Dat,' ofcollection
Copper(ell)
Dissolved constituents, in milligramsI,l'dd i'. i [1, -lJ-r(;'l,i~f(-;-- -r-(,XC(l\-,-· .(l'b) (1,11) (llr) (1) (I, i)
(C-24- j 3) J4cc b-l(C-26-l3) 22i1cc-S 1(C-27-L"J) 14dcd
26eaa(C-28-1')) 18adb-Sl
28ddc-l
'1-2')-639- !}-(,'3
9- ')-li]
9- 9-6]H-H-id8-31-()j
(j.O:1,0]
.17,Oil
,Ol,U
0.00.on
.Oll
.00
.02
O,O'j. l'j
,'J5
, JU
0.0,11
.0
.11
.0,11
.UI,IJI
.Il!,01
,00
I).!
,I
.1
,J
1).7
.11').(J
I,".11
.0
lSllrface runoff froln rainfall contaminated till' watt'r SUllrCt,' priur Lu datE' uf 1'011('ctiol\ uf ~;:llIlpl('; i1r1,lly"is pr()bilbly dOl'S
not truly represent waLer from Qay at thLs locatLull.
45


PUBLICATIONS OF THE UTAH DEPARTMENT OF NATURAL RESOURCES,DIVISION OF WATER RIGHTS
(*)-Out of Print
TECHNICAL PUBLICATIONS
No. 1. Underground leakage from artesian wellsFillmore, Utah, by Penn LivingstonGeological Survey, 1944.
in the Flowell area, nearand G. B. Maxey, U.S.
No.2. The Ogden Valley artesian reservoir, Weber County, Utah, by H. E.Thomas, U.S. Geological Survey, 1945.
*No. 3. Ground water in Pavant Valley, Millard County, Utah, by P. E.Dennis, G. B. Maxey and H. E. Thomas, U.S. Geological Survey, 1946.
*No. 4. Ground water in Tooele Valley, TooeleThomas, U.S. Geological Survey, in UtahRept., p. 91-238, pIs. 1-6, 1946.
County,State
Utah, byEng. 25th
H. E.Bienn.
*No. 5. Ground water inDistrict, DavisU.S. Geological53-206, pIs. 1-2,
the East Shore area, Utah: Part I, BountifulCounty, Utah, by H. E. Thomas and W. B. Nelson,Survey, in Utah State Eng. 26th Bienn. Rept., p.1948.
*No. 6. Ground water in the Escalante Valley, Beaver, Iron, and WashingtonCounties, Utah, by p. F. Fix, W. B. Nelson, B. E. Lofgren, andR. G. Butler, U.S. Geological Survey, in Utah State Eng. 27thBienn. Rept., p. 107-210, pIs. 1-10, 1950.
No.7. Status of development of selected ground-water basins in Utah, byH. E. Thomas, W. B. Nelson, B. E. Lofgren, and R. G. Butler, U.S.Geological Survey, 1952.
*No. 8. Consumptive use of water and irrigation requirements of crops inUtah, by C. o. Roskelly and Wayne D. Criddle, 1952.
No.8. (Revised) Consumptive use and water requirements for Utah, by W. D.Criddle, K. Harris, and L. S. Willardson, 1962.
No.9. Progress report on selected ground-water basins in Utah, by H. A.Waite, W. B. Nelson, and others, U.S. Geological Survey, 1954.
*No. 10. A compilation of chemical quality data for ground and surfacewaters in Utah, by J. G. Connor, C. G. Mitchell, and others, U.S.Geological Survey, 1958.
''<No. 11. Ground water in northernthe period 1948-63, by R.Geological Survey, 1965.
UtahM.
47
Valley, Utah: A progress report forCordova and Seymour Subitzky, U.S.

No. 12. Reevaluation of the ground-water resources of Tooele Valley, Utah,by Joseph S. Gates, U.S. Geological Survey, 1965.
*No. 13. Ground-water resources of selected basins in southwestern Utah, byG. W. Sandberg, U.S. Geological Survey, 1966.
*No. 14. Water-resources appraisal of the Snake Valley area, Utah andNevada, by J. W. Hood and F. E. Rush, U.S. Geological Survey, 1965.
*No. 15. Water from bedrock in the Colorado Plateau of Utah, by R. D.Feltis, U.S. Geological Survey, 1966.
No. 16. Ground-water conditions in Cedar Valley, Utah County, Utah, byR. D. Feltis, U.S. Geological Survey, 1967.
*No. 17. Ground-water resources of northern Juab Valley, Utah, by L. J.Bjorklund, U.S. Geological Survey, 1968.
No. 18. Hydrologic reconnaissance of Skull Valley, Tooele County, Utah, byJ. W. Hood and K. M. Waddell, U.S. Geological Survey, 1968.
No. 19. An appraisal ofbasin, Utah, bySurvey, 1968.
the qualityD. C. Hahl
of surface water in the Sevier Lakeand J. C. Mundorff, U.S. Geological
No. 20. Extensions of streamflow records in Utah, by J. K. Reid, L. E.Carroon, and G. E. Pyper, U.S. Geological Survey, 1969.
No. 21. Summary of maximum discharges in Utah streams, by G. L. Whitaker,U.S. Geological Survey, 1969.
No. 22. Reconnaissance of the ground-water resources ofmont River valley, Wayne County, Utah, by L. J.Geological Survey, 1969.
the upper FreBjorklund, U.S.
No. 23. Hydrologic reconnaissance of Rush Valley, Tooele County, Utah, byJ. W. Hood, Don Price, and K. M. Waddell, U.S. Geological Survey,1969.
No. 24. Hydrologic reconnaissance of Deep Creek valley, Tooele and JuabCounties, Utah, and Elko and White Pine Counties, Nevada, by J. W.Hood and K. M. Waddell, U.S. Geological Survey, 1969.
No. 25. Hydrologic reconnaissance of Curlew Valley, Utah and rdaho, byE. L. Balke and Don Price, U.S. Geological Survey, 1969.
No. 26. Hydrologic reconnaissance of the Sink ValleyElder Counties, Utah, by Don Price andGeological Survey, 1969.
area, Tooele and BoxE. L. Balke, U.S.
No. 27. Water resources of the Heber-Kamas-Park City area, north~central
Utah, by C. H. Baker, Jr., U.S. Geological Survey, 1970.
48

No. 28. Ground-water conditions in southern Utah Valley and Goshen Valley,Utah, by R. M. Cordova, U.S. Geological Survey, 1970.
No. 29. Hydrologic reconnaissance of Grouse Creek valley, Box Elder County,Utah, by J. W. Hood and Don Price, U.S. Geological Survey, 1970.
No. 30. Hydrologic reconnaissance of the Park Valley area, Box ElderCounty, Utah, by J. W. Hood, U.S. Geological Survey, 1971.
No. 31. Water resources of Salt Lake County, Utah, by Allen G. Hely, R. W.Mower, and C. Albert Harr, U.S. Geological Survey, 1971.
No. 32. Geology and water resources of the Spanish Valley area, Grand andSan Juan Counties, Utah, by C. T. Sumsion, U.S. Geological Survey,1971.
No. 33. Hydrologic reconnaissance of Hansel Valley and northern Rozel Flat,Box Elder County, Utah, by J. W. Hood, U.S. Geological Survey,1971.
No. 34. Summary of water resources of Salt Lake County, Utah, by Allen G.Hely, R. W. Mower, and C. Albert Harr, U.S. Geological Survey,1971.
No. 35. Ground-water conditions in the East Shoreand Weber Counties, Utah, 1960-69, by E.Waddell, U.S. Geological Survey, 1972.
area, Box Elder, Davis,L. BoIke and K. M.
No. 36. Ground-water resources of Cache Valley, Utah and Idaho, by L. J.Bjorklund and L. J. McGreevy, U.S. Geological Survey, 1971.
No. 37. Hydrologic reconnaissance of the Blue Creek Valley area, Box ElderCounty, Utah, by E. L. BoIke and Don Price, U.S. Geological Survey,1972.
No. 38. Hydrologic reconnaissance of the Promontory Mountains area, BoxElder County, Utah, by J. W. Hood, U.S. Geological Survey, 1972.
No. 39. Reconnaissance of chemical qualitysediment in the Price River Basin,Geological Survey, 1972.
of surface water and fluvialUtah, by J. C. Mundorff, U.S.
No. 40. Ground-water conditions in the central Virgin River basin, Utah, byR. M. Cordova, G. W. Sandberg, and Wilson McConkie, U.S.Geological Survey, 1972.
No. 41. Hydrologic reconnaissance of Pilot Valley, Utah and Nevada, byJerry C. Stephens and J. W. Hood, U.S. Geological Survey, 1973.
DesertUtah, by
No. 42. Hydrologic reconnaissance of the northern Great Salt Lakeand summary hydrologic reconnaissance of northwesternJerry C. Stephens, U.S. Geological Survey, 1973.
49

No. 43. Water resources of the Milford area, Utah, with emphasis on groundwater, by R. W. Mower and R. M. Cordova, U.S. Geological Survey,1974.
No. 44. Ground-water resources of the lower Bear River drainage basin, BoxElder County, Utah, by L. J. Bjorkland and L. J. McGreevy, U.S.Geological Survey, 1974.
No. 45. Water resources of the Curlew Valley drainage basin, Utah andIdaho, by Claud H. Baker, Jr., U.S. Geological Survey, 1974.
No. 46. Water-quality reconnaissance of surface inflow to Utah Lake, byJ. C. Mundorff, U.S. Geological Survey, 1974.
WATER CIRCULARS
No.1. Ground water in the Jordan Valley, Salt Lake County, Utah, by TedArnow, U.S. Geological Survey, 1965.
No.2. Ground water in Tooele Valley, Utah, by J. S. Gates and O. A.Keller, U.S. Geological Survey, 1970.
BASIC-DATA REPORTS
*No.
*No.
*No.
*No.
1. Records and water-level measurements of selected wells and chemicalanalyses of ground water, East Shore area, Davis, Weber, and BoxElder Counties, Utah, by R. E. Smith, U.S. Geological Survey, 1961.
2. Records of selected wells and springs, selected drillers' logs ofwells, and chemical analyses of ground and surface waters, northernUtah Valley, Utah County, Utah, by Seymour Subitzky, U.S.Geological Survey, 1962.
3. Ground-water data, central Sevier Valley, parts of Sanpete, Sevier,and Piute Counties, Utah, by C. H. Carpenter and R. A. Young, U.S.Geological Survey, 1963.
4. Selected hydrologic data, Jordan Valley, Salt Lake County, Utah, byI. W. Marine and Don Price, U.S. Geological Survey, 1963.
*No. 5. Selected hydrologic data, Pavant Valley, Millard County, Utah, byR. W. Mower, U.S. Geological Survey, 1963.
*No. 6. Ground-water data, parts of Washington, Iron, Beaver, and MillardCounties, Utah, by G. W. Sandberg, U.S. Geological Survey, 1963.
No.7. Selected hydrologic data, Tooele Valley, Tooele County, Utah, byJ. S. Gates, U.S. Geological Survey, 1963.
No. 8. Selected hydrologic data, upperCarpenter, G. B. Robinson,Geological Survey, 1964.
50
Sevier River basin, Utah, by C. H.Jr., and L. J. Bjorklund, U.S.

No.9. Ground-water data, Sevier Desert, Utah, by R. W. Mower and R. D.Feltis, U.S. Geological Survey, 1964.
*No. 10. Quality of surface water in the Sevier Lake basin, Utah, by D. C.Hahl and R. E. Cabell, U.S. Geological Survey, 1965.
*No. 11. Hydrologic and climatologic data, collected through 1964, Salt LakeCounty, Utah, by W. V. lorns, R. W. Mower, and C. A. Horr, U.S.Geological Survey, 1966.
No. 12. Hydrologic and climatologic data, 1965, Salt Lake County, Utah, byW. V. lorns, R. W. Mower, and C. A. Horr, U.S. Geological Survey,1966.
No. 13. Hydrologic and climatologic data, 1966, Salt Lake County, Utah, byA. G. Hely, R. W. Mower, and C. A. Horr, U.S. Geological Survey,1967.
No. 14. Selected hydrologic data, San Pitch River drainage basin, Utah, byG. B. Robinson, Jr., U.S. Geological Survey, 1968.
No. 15. Hydrologic andA. G. Hely, R.1968.
climatologic data, 1967, Salt Lake County, Utah, byW. Mower, and C. A. Horr, U.S. Geological Survey,
No. 16. Selected hydrologic data, southern Utah and Goshen Valleys, Utah,by R. M. Cordova, U.S. Geological Survey, 1969.
No. 17. Hydrologic and climatologic data, 1968, Salt Lake County, Utah, byA. G. Hely, R. W. Mower, and C. A. Horr, U.S. Geological Survey,1969.
No. 18. Quality of surface water in the Bear River basin, Utah, Wyoming,and Idaho, by K. M. Waddell, U.S. Geological Survey, 1970.
No. 19. Daily water-temperature records for Utah streams, 1944-68, by G. L.Whitaker, U. S. Geological Survey, 1970.
No. 20. Water-quality data for the Flaming Gorge area, Utah and Wyoming, byR. J. Madison, U.S. Geological Survey, 1970.
No. 21. Selected hydrologic data, Cache Valley, Utah and Idaho, by L.J.McGreevy and L. J. Bjorklund, U.S. Geological Survey, 1970.
No. 22. Periodic water- and air-temperature records for Utah streams,1966-70, by G. L. Whitaker, U.S. Geological Survey, 1971.
No. 23. Selected hydrologic data, lower Bear River drainage basin, BoxElder County, Utah, by L. J. Bjorklund and L. J. McGreevy, U.S.Geological Survey, 1973.
51

No. 24. Water-quality data for the Flaming Gorge ReservoirWyoming, 1969-72, by E. L. BoIke and K. M.Geological Survey, 1972.
INFORMATION BULLETINS
area, Utah andWaddell, U.S.
*No. 1. Plan of work for the Sevier River Basin (Sec. 6, P. L. 566), U.S.Department of Agriculture, 1960.
*No. 2. Water production from oil wells in Utah, by Jerry Tuttle, UtahState Engineer's Office, 1960.
*No. 3. Ground-water areas and well logs, central Sevier Valley, Utah, byR. A. Young, U.S. Geological Survey, 1960.
*No. 4. Ground-water investigations in Utah in 1960 and reports publishedby the U.S. Geological Surveyor the Utah State Engineer prior to1960, by H. D. Goode, U.S. Geological Survey, 1960.
*No. 5. Developing ground water in the central Sevier Valley, Utah, byR. A. Young and C. H. Carpenter, U.S. Geological Survey, 1961.
*No. 6. Work outline and report outline for Sevier River basin survey,(Sec. 6, P.L. 566), U.S. Department of Agriculture, 1961.
No.7. Relation of the deep and shallow artesian aquifers near Lynndyl,Utah, by R. W. Mower, U.S. Geological Survey, 1961.
*No. 8. Projected 1975 municipal water-use requirements, Davis County,Utah, by Utah State Engineer's Office, 1962.
No.9. Projected 1975 municipal water-use requirements, Weber County,Utah, by Utah State Engineer's Office, 1962.
*No. 10. Effects on the shallow artesian aquifer of withdrawing water fromthe deep artesian aquifer near Sugarville, Millard County, Utah, byR. W. Mower, U.S. Geological Survey, 1963.
No. 11. Amendments to plan of work and work outline for the Sevier Riverbasin (Sec. 6, P.L. 566), U.S. Department of Agriculture, 1964.
*No. 12. Test drilling in the upper Sevier River drainage basin, Garfieldand Piute Counties, Utah, by R. D. Feltis and G. B. Robinson, Jr.,U.S. Geological Survey, 1963.
*No. 13. Water requirements of lower Jordan River, Utah, by Karl Harris,Irrigation Engineer, Agricultural Research Service, Phoenix,Arizona, prepared under informal cooperation approved by Mr.William W. Donnan, Chief, Southwest Branch (Riverside, California)Soil and Water Conservation Research Division, AgriculturalResearch Service, U.S.D.A., and by Wayne D. Criddle, StateEngineer, State of Utah, Salt Lake City, Utah, 1964.
52

*No. 14. Consumptive use of water by native vegetation and irrigated cropsin the Virgin River area of Utah, by Wayne D. Criddle, Jay M.Bagley, R. Keith Higginson, and David W. Hendricks, throughcooperation of Utah Agricultural Experiment Station, AgriculturalResearch Service, Soil and Water Conservation Branch, Western Soiland Water Management Section, Utah Water and Power Board, and UtahState Engineer, Salt Lake City, Utah, 1964.
*No. 15. Ground-water conditions and related water-administration problemsin Cedar City Valley, Iron County, Utah, February, 1966, by Jack A.Barnett and Francis T. Mayo, Utah State Engineer's Office.
*No. 16. Summary of water well drilling activities in Utah, 1960 through1965, compiled by Utah State Engineer's Office, 1966.
*No. 17. Bibliography of U.S. Geological Survey water-resources reports forUtah, compiled by Olive A. Keller, U.S. Geological Survey, 1966.
ground-waterby R. M.
*No. 18. The effect of pumping large-discharge wells on thereservoir in southern Utah Valley, Utah County, Utah,Cordova and R. W. Mower, U.S. Geological Survey, 1967.
No. 19. Ground-water hydrology of southern Cache Valley, Utah, by L. P.Beer, 1967.
No. 20. Fluvial sediment in Utah, 1905-65, A data compilation by J. C.Mundorff, U.S. Geological Survey, 1968.
No. 21. Hydrogeology of the eastern portion of the southUinta Mountains, Utah, by L. G. Moore and D.Bureau of Reclamation, and James D. Maxwell andSoil Conservation Service, 1971.
slopes of theA. Barker, U.S.Bob L. Bridges,
No. 22. Bibliography of U.S. Geological Survey water-resources reports forUtah, compiled by Barbara A. LaPray, U.S. Geological Survey, 1972.
53
