state transient lodging tax statistical summary – … history some brief background information is...
TRANSCRIPT
Oregon’s State Lodging Tax
Program Description, Revenue, and Characteristics of Taxpayers
Calendar Years 2005-2015
150-604-005 (Rev. 4-16)

Prepared by
Research Section Principal analyst: Colleen Chrisinger
Oregon Department of Revenue
Salem OR 97301-2555 [email protected]
April 2016
Statistical publications are available on our website: http://www.oregon.gov/DOR/
Please cite this publication when using information derived from it.
Have Questions?
General tax information.............. www.oregon.gov/DOR
Salem......................................................... 503-378-4988
Toll-free from an Oregon prefix .............. 1-800-356-4222
Asistencia en español:
En Salem o fuera de Oregon ..................... 503-378-4988
Gratis de prefijo de Oregon.................... 1-800-356-4222
TTY (hearing or speech impaired; machine only):
Salem area or outside Oregon ................... 503-945-8617
Toll-free from an Oregon prefix ............ 1-800-886-7204
Americans with Disabilities Act (ADA): Call one of the help numbers for information in
alternative formats.
Oregon Department of Revenue, Research Section 1
Oregon’s State Lodging Tax
Introduction
Lawmakers created Oregon’s state transient lodging tax program in 2003 to provide core funding
to Travel Oregon, the statewide tourism promotion agency. Travel Oregon works to improve
state economic conditions through tourism.
This annual report from the Oregon Department of Revenue, the agency responsible for
collecting the state lodging tax, describes Oregon’s state transient lodging tax program. The
report describes the history of the statewide lodging tax, how the program operates, and the tax
receipts collected under the program. Information in this report is typically used by the travel and
hospitality industry, regional and state economic advisors, Travel Oregon, and lawmakers.
An important clarification is that this report only describes the statewide lodging tax program.
Many cities and counties in Oregon charge separate lodging taxes at the local level. This report
does not include information about those local lodging taxes. If readers are interested in local tax
information, one source to consult is the Oregon Travel Impacts report prepared by Dean Runyan
Associates on behalf of Travel Oregon.
Legislative History
Some brief background information is useful for understanding tourism promotion and the state
lodging tax in Oregon. In the 1930s, Oregon’s then new state tourism bureau was part of an
agency called the State Highway Commission. Later, in 1983, the tourism office joined the
Oregon Economic Development Department. In 2003, the Legislative Assembly (HB 2267)
decided to designate the Oregon Tourism Commission a stand-alone agency, giving it more
independence than in the past. Also in 2003, the same legislative action established a statewide
one percent transient lodging tax to fund the tourism commission. The Oregon Tourism
Commission, also known as Travel Oregon, is governed by nine Governor-appointed
commissioners.
Under the 2003 law that created the lodging tax, the Legislature defined transient lodging as
“hotel, motel and inn dwelling units that are designed for temporary overnight human occupancy,
and [which] includes spaces designed for parking recreational vehicles during periods of human
occupancy of those vehicles.” The law required the Oregon Tourism Commission to spend at
least 80 percent of lodging tax net receipts on state tourism marketing programs and no more
than 15 percent of net receipts on regional tourism marketing programs. Travel Oregon also uses
a portion of lodging tax revenue to pay for operations.
Beyond the state lodging tax, the 2003 law also addressed new or increased local government
lodging taxes imposed by cities or counties. Many city and county lodging tax programs predated
the state program, and were not affected by this law. However, for new or increased local taxes,
the 2003 state law required 70 percent of net revenue to be spent to fund tourism promotion or
tourism-related facilities. The law also required that new or increased local lodging taxes allow

Oregon Department of Revenue, Research Section 2
for at least five percent of tax revenues to be retained by lodging providers to cover the costs of
tax collection.
The state lodging tax took effect on January 1, 2004. To administer the tax, the Department of
Revenue (DOR) established a program to manage the collection and tracking of lodging tax
receipts, and the transfer of net receipts to the Oregon Tourism Commission. DOR requires
lodging providers to register, file quarterly lodging tax returns, and remit tax payments to satisfy
the requirements of the law.
In 2004, Oregon’s Attorney General determined that the lodging tax law at the time did not apply
to certain types of lodging that lawmakers may have intended. Specifically, the law did not
appear to apply to vacation homes or similar dwelling units rented for transient lodging because
the law applied to “hotel, motel and inn dwelling units that are designed for temporary overnight
human occupancy.” In response, the 2005 Legislative Assembly (HB 2197) subsequently
expanded the definition of transient lodging to include dwelling units used for temporary human
occupancy. Temporary is defined here as fewer than 30 days at a time. The 2005 law also
explicitly exempted certain other temporary overnight dwelling units, such as hospitals and
nonprofit summer camps, as described in the Exemptions section of this report.
In 2013, the Legislative Assembly (HB 2656) clarified circumstances under which a transient
lodging intermediary rather than a lodging provider would be the entity responsible for collecting
and remitting transient lodging taxes. A transient lodging intermediary is defined as “a person
other than a transient lodging provider that facilitates the retail sale of transient lodging and
charges for occupancy of the transient lodging.” Transient lodging intermediaries include online
travel companies, travel agents, and tour outfitter companies, among others. The Legislature
determined that the entity collecting the payment from the customer is the entity required to
collect and remit the tax. Further, the law emphasized that the tax is computed on the total retail
price paid by the final customer, regardless of whether an intermediary has first paid a lower
wholesale price to the provider. These legislative changes became effective on October 7, 2013.
Most recently, the 2016 Legislative Assembly approved HB 4146, which increases the state
lodging tax rate from 1 to 1.8 percent for four years and then sets the rate as 1.5 percent
thereafter. The increase applies to payments made on or after July 1, 2016 for taxable lodging
transactions. The new law also changes how Travel Oregon is required to spend lodging tax
proceeds. The required amount to be spent on state tourism programs decreases from 80 to 65
percent of net lodging tax revenue, while the amount to be spent on regional tourism programs
goes to exactly 20 percent from a previous maximum of 15 percent. Also, ten percent is to be
spent on a competitive grant program “to help develop and improve the economies of
communities throughout Oregon by means of the improvement, expansion, and promotion of the
visitor industry.” The law specifies that the grants may be spent on “tourism-related facilities and
tourism-generating events, including sporting events.” See ORS 320.300 to 320.350 for statutes
relating to transient lodging taxes and ORS 284.101 to 284.146 for statutes relating to the Oregon
Tourism Commission.

Oregon Department of Revenue, Research Section 3
Lodging Tax Program
The Oregon state lodging tax applies to “any consideration rendered for the sale, service or
furnishing of transient lodging.” Transient lodging is defined as:
Hotel, motel and inn dwelling units used for temporary overnight human occupancy
Spaces used for parking recreational vehicles or erecting tents during periods of human
occupancy
Houses, cabins, condominiums, apartment units or other dwelling units, or portions of
any of these dwelling units that are used for temporary human occupancy.
Dwelling units that provide lodging for fewer than 30 days in a calendar year and lodgers who
spend 30 consecutive days or more at the same facility are exempt from the state transient
lodging tax. The tax applies only to lodging sales, and is not imposed upon optional services such
as room service or in room entertainment.
Lodging taxes are collected from customers by lodging providers and intermediaries. Providers
and intermediaries may retain five percent of the tax as reimbursement for the administrative
burden of collection and record keeping. Providers and intermediaries then remit the remainder
to DOR on a quarterly basis. DOR retains two percent of that amount to cover DOR’s costs of
administering the program. Finally, DOR transfers the balance of lodging tax receipts to the
Oregon Tourism Commission.
The Tourism Commission established 10 lodging tax tourism regions covering the state. The
Department of Revenue asks lodging providers to identify their establishments as being in one of
these areas, according to the physical location of the individual establishment (regardless of any
central ownership). DOR provides financial reports of net lodging tax receipts by region to the
commission each month. The commission distributes revenue to regions in proportion to the
amount of tax receipts collected in each region. Hence, recordkeeping and filing by the providers
must be done at the level of the physical establishment (i.e., location-based as opposed to
ownership-based) so that tax receipts can be attributed to the correct region.

Oregon Department of Revenue, Research Section 4
Registration and Filing Requirements
The Department of Revenue requires lodging providers and intermediaries to submit a one-time
registration form to the department. The registration form requests information on the physical
location of the provider's facility or facilities, to determine regional assignment(s). For
intermediaries, the form indicates the region(s) in which they facilitate the retail sale of transient
lodging. If an intermediary or provider serves multiple regions, the department assigns separate
identification numbers to each entity-region combination, and counts those as distinct
registrations.
To remit the lodging tax they have collected, providers and intermediaries are required to file a
quarterly tax return reporting gross receipts and non-taxable receipts (exemptions) for lodging
sales. The taxpayer then calculates the one percent tax on net taxable receipts. The tax is reduced
by five percent (administrative fee retained by providers) to arrive at net tax due. Lodging tax
returns and payments are due to DOR by the last day of the month following the end of each
calendar quarter (April 30, July 31, October 31, and January 31). Failure to file and pay in a
timely manner may result in penalty and interest. Separate returns are required for each region in
cases where the same lodging provider or intermediary covers multiple regions.
Exemptions
Certain types of lodging situations are exempt from the lodging tax and not required to register
with DOR. These exemptions are also discussed in the Department of Revenue’s Tax
Expenditure Report. Exemptions include providers operating facilities which are not generally
associated with tourism as well as lodgers occupying a facility in a manner not generally
associated with tourism.
Health care facilities, hospitals, long-term care facilities, and residential care facilities
licensed, registered, or certified by Oregon Department of Human Services or the Oregon
Health Authority
Drug or alcohol abuse treatment facilities and mental health treatment facilities
Dwelling units that are used as lodging by the public for fewer than 30 days in a calendar
year (example: a hunting lodge that is only open for a season shorter than 30 days)
Emergency temporary shelter funded by a government agency
Nonprofit youth camps, nonprofit conference centers, or other nonprofit facilities
Dwelling units leased or occupied by the same person for 30 consecutive days or more
Dwelling units occupied by a federal employee on federal business who pays for the
lodging with a credit card billed directly to the government agency.

Oregon Department of Revenue, Research Section 5
Descriptive Statistics
This section provides descriptive statistics on the statewide transient lodging tax program. Dollar
amounts are not adjusted for inflation. Overall, Oregon has collected a total of approximately
$145 million in statewide lodging tax since the program began on January 1, 2004.
Roughly 3,000 entities are registered as lodging providers that provided lodging during at least
one quarter in 2015. The number of returns filed each quarter in 2015 varied between 2,750 and
3,000, depending on the season.
As shown in Figure 1, lodging receipts grew steadily through 2007, but dropped in 2009.
Beginning in 2010, growth in receipts returned with 2015 receipts representing the highest year
on record since inception of the tax in 2004. A portion of the increase in 2006 can be attributed to
the 2005 legislative changes which expanded the definition of “transient lodging” to include
vacation homes. Total net lodging tax receipts for stays in calendar year 2015 were $17.8
million, a 14.8 percent increase from $15.5 million in 2014.
Within a given calendar year, lodging receipts follow a seasonal pattern. Tax receipts reach their
peak in July through September, shown as quarter three (Q3) in Figure 2. Tax receipts can be up
to twice as much during this quarter compared to the lowest quarter of each year.
0
2
4
6
8
10
12
14
16
18
20
2005 2006 2007 2008 2009 2010 2011 2012 2013 2014 2015
Tax
Re
ceip
ts (
$ in
Mill
ion
s)
Calendar Year
Figure 1 - State Lodging Tax Receipts by Year

Oregon Department of Revenue, Research Section 6
Focusing on accommodation types, hotels and motels collected approximately $13.4 million in
tax in 2015, which was 75 percent of total receipts. Figure 3 shows the relative shares of net
lodging tax receipts by accommodation type. Compared to the previous year, there has been an
increase in the share of revenue paid by lodging intermediaries and a decrease in the share paid
by hotels and motels.
0
1
2
3
4
5
6
2005 2006 2007 2008 2009 2010 2011 2012 2013 2014 2015
Tax
Re
ceip
ts (
$ in
Mill
ion
s)
Calendar Year
Figure 2 - State Lodging Tax Receipts by Quarter
Q1
Q2
Q3
Q4
1.7%
2.9%
4.9%
2.6%
9.5%
24.9%
53.5%
1.6%
2.8%
4.3%
6.5%
9.4%
22.7%
52.8%
0% 10% 20% 30% 40% 50% 60%
Bed & Breakfast
Campgrounds & RV Sites
Multiple & Other
Lodging Intermediary
Vacation Home
Motel
Hotel
Figure 3 - Share of Tax Receipts by Accommodation Type
2015 2014

Oregon Department of Revenue, Research Section 7
Turning to regional information, Figure 4 shows that the Portland Metro region was the source of
$7.4 million (42 percent) of the net lodging tax receipts in 2015, followed by the Willamette
Valley region at $2.1 million (12 percent). The three coast regions combined made up $3.8
million (21 percent) of net lodging receipts. The relative shares of net lodging tax receipts by
region have remained relatively steady since the program’s inception.
To summarize, overall tax receipts from the state transient lodging tax are at an all-time high.
Since the program began in 2004, annual tax receipts have increased by 112 percent. In 2015, the
state lodging tax brought in $17.8 million, compared to $8.4 million in 2004.
Within the state lodging tax program, highest tax receipts are associated with the third (summer)
quarter of each calendar year, the hotel and motel categories, and the Portland metropolitan area.
The remainder of this report presents tables that provide greater detail for understanding patterns
within the state transient lodging tax program. Historical numbers may vary from previous
reports because of amended or audited returns, new returns not yet processed at the time of press,
or other corrections.
0 2 4 6 8 10 12 14
0
1
2
3
4
5
6
7
8
Tax
Re
ceip
ts (
$ in
Mill
ion
s)
Figure 4 - State Lodging Tax Receipts by Region
2014
2015
Oregon Department of Revenue, Research Section 8
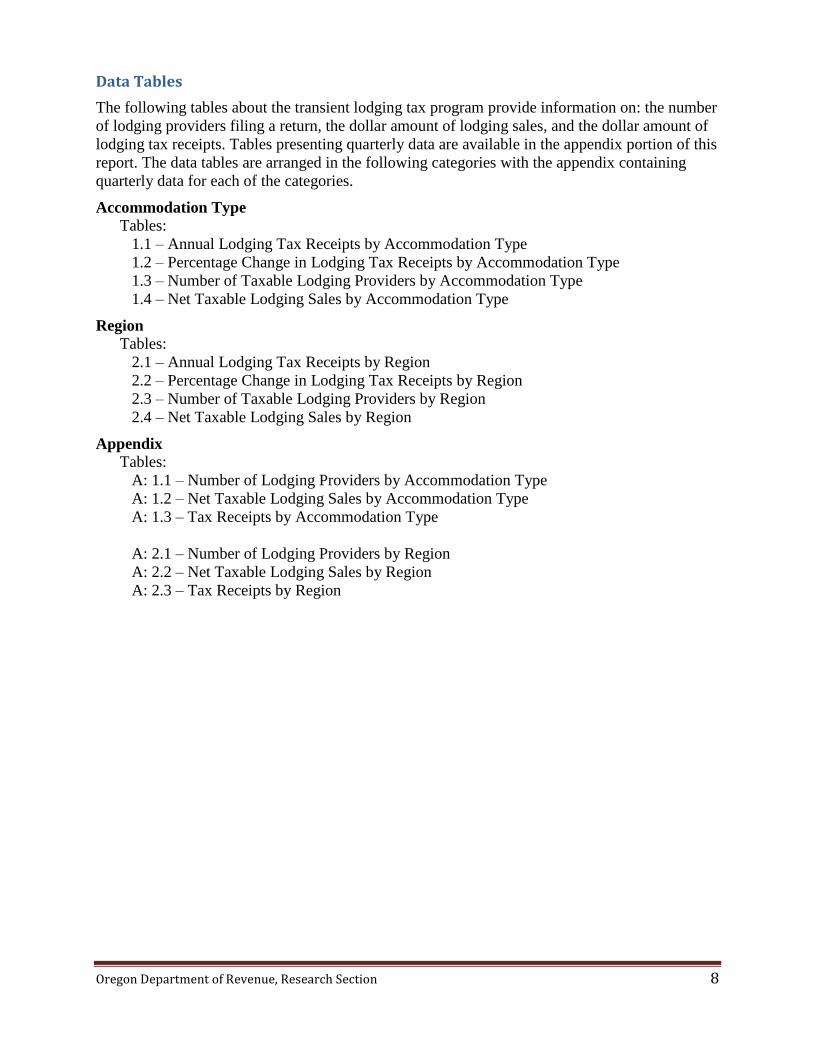
Data Tables
The following tables about the transient lodging tax program provide information on: the number
of lodging providers filing a return, the dollar amount of lodging sales, and the dollar amount of
lodging tax receipts. Tables presenting quarterly data are available in the appendix portion of this
report. The data tables are arranged in the following categories with the appendix containing
quarterly data for each of the categories.
Accommodation Type
Tables:
1.1 – Annual Lodging Tax Receipts by Accommodation Type
1.2 – Percentage Change in Lodging Tax Receipts by Accommodation Type
1.3 – Number of Taxable Lodging Providers by Accommodation Type
1.4 – Net Taxable Lodging Sales by Accommodation Type
Region
Tables:
2.1 – Annual Lodging Tax Receipts by Region
2.2 – Percentage Change in Lodging Tax Receipts by Region
2.3 – Number of Taxable Lodging Providers by Region
2.4 – Net Taxable Lodging Sales by Region
Appendix
Tables:
A: 1.1 – Number of Lodging Providers by Accommodation Type
A: 1.2 – Net Taxable Lodging Sales by Accommodation Type
A: 1.3 – Tax Receipts by Accommodation Type
A: 2.1 – Number of Lodging Providers by Region
A: 2.2 – Net Taxable Lodging Sales by Region
A: 2.3 – Tax Receipts by Region

Oregon Department of Revenue, Research Section 9
Oregon Statewide Lodging Summary Statistics
by Accommodation Type

Lodging Statistics by Accommodation Type
Oregon Department of Revenue, Research Section 10
Table 1.1 - Annual Lodging Tax Receipts by Accommodation Type (Dollars)
Calendar Year
Bed & Breakfast
Campgrounds & RV Sites Hotel Motel Vacation Home
Lodging Intermediary Multiple1 & Other Total
2005 165,577 266,056 4,722,575 3,054,408 268,347 N/A 612,573 9,089,536
2006 185,931 335,455 5,180,700 3,417,539 797,932 N/A 813,491 10,731,048
2007 206,764 349,773 5,703,323 3,671,511 904,703 N/A 870,570 11,706,644
2008 217,132 326,391 5,935,295 3,450,981 999,525 N/A 802,464 11,731,788
2009 191,207 333,024 5,262,565 3,089,753 963,954 N/A 693,885 10,534,389
2010 200,669 387,310 5,742,810 3,205,390 1,048,333 N/A 581,948 11,166,460
2011 200,859 361,438 6,237,208 3,277,140 1,131,626 N/A 607,507 11,815,778
2012 237,287 380,415 6,762,564 3,363,655 1,274,219 N/A 653,086 12,671,227
2013 252,920 432,088 7,456,848 3,584,728 1,283,448 64,592 704,972 13,779,597
2014 257,757 452,411 8,296,419 3,863,329 1,474,344 410,578 754,089 15,508,927
2015 276,343 491,958 9,403,850 4,039,527 1,669,100 1,153,382 763,642 17,797,802
Table 1.2 – Percentage Change (Year-Over-Year) in Lodging Tax Receipts by Accommodation Type
Calendar Years Bed &
Breakfast Campgrounds
& RV Sites Hotel Motel Vacation
Home Lodging
Intermediary Multiple1 &
Other Total
2005 to 2006 12.3% 26.1% 9.7% 11.9% 197.4% N/A 32.8% 18.1%
2006 to 2007 11.2% 4.3% 10.1% 7.4% 13.4% N/A 7.0% 9.1%
2007 to 2008 5.0% -6.7% 4.1% -6.0% 10.5% N/A -7.8% 0.2%
2008 to 2009 -11.9% 2.0% -11.3% -10.5% -3.6% N/A -13.5% -10.2%
2009 to 2010 4.9% 16.3% 9.1% 3.7% 8.8% N/A -16.1% 6.0%
2010 to 2011 0.1% -6.7% 8.6% 2.2% 7.9% N/A 4.4% 5.8%
2011 to 2012 18.1% 5.3% 8.4% 2.6% 12.6% N/A 7.5% 7.2%
2012 to 2013 6.6% 13.6% 10.3% 6.6% 0.7% N/A 7.9% 8.7%
2013 to 2014 1.9% 4.7% 11.3% 7.8% 14.9% 535.6% 7.0% 12.5%
2014 to 2015 7.2% 8.7% 13.3% 4.6% 13.2% 180.9% 1.3% 14.8%
Note: Classification of accommodation types changed in 2013. The tables presented here reflect the new accommodation type categorization. 1 "Multiple" represents approximately 350 lodging providers that reported more than one accommodation type when they registered. Table 1.3 provides counts for every accommodation type listed on these registration forms. However, because lodging providers are asked to report sales and tax receipts in total, it is not possible to break out the sales or tax by accommodation type for providers registered with more than one type of accommodation. Tables 1.1, 1.2, and 1.4 provide sales and tax receipts for these lodging providers in a “multiple” accommodation type category.

Lodging Statistics by Accommodation Type
Oregon Department of Revenue, Research Section 11
Table 1.3 - Number of Taxable Lodging Providers by Accommodation Type (Calendar Year Average)
Calendar Year Bed and
Breakfast Campgrounds
& RV Sites Hotel Motel Vacation Home Lodging
Intermediary Other
2005 274 530 305 865 130 N/A 107
2006 287 452 299 865 673 N/A 118
2007 303 440 307 860 776 N/A 128
2008 307 437 311 846 867 N/A 117
2009 294 421 319 835 931 N/A 106
2010 276 409 320 837 1,008 N/A 87
2011 278 409 327 835 1,104 N/A 68
2012 279 406 330 828 1,205 N/A 48
2013 270 407 340 817 1,291 57 61
2014 251 411 364 787 1,358 67 91
2015 226 388 361 757 1,291 65 95
Note: Classification of accommodation types changed in 2013. The tables presented here reflect the new accommodation type categorization.
Note: Approximately 350 lodging providers reported more than one accommodation type when they registered. Counts for every accommodation type indicated on registrations are included in this table. For that reason, totals are not provided as it would overstate the number of lodging providers in Oregon.

Lodging Statistics by Accommodation Type
Oregon Department of Revenue, Research Section 12
Table 1.4 - Net Taxable Lodging Sales by Accommodation Type (thousands of dollars)
Calendar Year Bed &
Breakfast Campgrounds
& RV Sites Hotel Motel Vacation Home Lodging
Intermediary Multiple1 &
Other Total
2005 17,159 27,552 495,597 315,135 28,031 N/A 63,001 946,475
2006 19,290 34,561 547,430 350,859 82,479 N/A 84,043 1,118,662
2007 21,230 35,735 599,740 381,030 93,671 N/A 89,698 1,221,105
2008 22,438 33,685 623,363 360,053 103,706 N/A 83,681 1,226,926
2009 19,960 34,837 551,377 320,958 100,014 N/A 72,487 1,099,632
2010 20,461 40,167 601,583 331,349 108,318 N/A 60,290 1,162,168
2011 20,380 37,315 649,772 340,640 117,427 N/A 61,517 1,227,051
2012 23,622 39,716 708,679 349,601 132,040 N/A 67,368 1,321,025
2013 25,801 44,938 781,606 374,685 133,113 5,511 73,460 1,439,114
2014 26,733 46,952 869,097 403,489 154,388 35,515 78,976 1,615,149
2015 28,914 51,492 980,392 423,401 174,741 119,961 80,179 1,859,080
Note: Classification of accommodation types changed in 2013. The tables presented here reflect the new accommodation type categorization.
1 "Multiple" represents approximately 350 lodging providers that reported more than one accommodation type when they registered. Table 1.3 provides counts for every accommodation type listed on these registration forms. However, because lodging providers are asked to report sales and tax receipts in total, it is not possible to break out the sales or tax by accommodation type for providers registered with more than one type of accommodation. Tables 1.1, 1.2, and 1.4 provide sales and tax receipts for these lodging providers in a “multiple” accommodation type category.

Oregon Department of Revenue, Research Section 13
Oregon Statewide Lodging Summary Statistics
by Region

Lodging Statistics by Region
Oregon Department of Revenue, Research Section 14
Table 2.1 - Annual Lodging Tax Receipts by Region (dollars)
Calendar Year Central
Central Coast
Mt Hood / Gorge
North Coast Northeastern
Portland Metro
South Coast Southeastern Southern
Willamette Valley Total
2005 694,483 889,260 307,808 759,971 316,600 3,348,373 436,561 107,264 1,049,645 1,179,572 9,089,536
2006 983,354 1,123,355 373,859 991,205 348,928 3,798,748 503,682 122,869 1,156,218 1,328,829 10,731,048
2007 1,066,055 1,209,919 423,044 1,074,514 391,853 4,235,847 541,376 133,513 1,191,666 1,438,856 11,706,644
2008 1,027,480 1,170,008 431,346 1,077,689 399,986 4,387,160 518,412 118,308 1,127,071 1,474,327 11,731,788
2009 910,609 1,128,794 401,398 1,038,546 388,114 3,747,894 450,568 113,923 1,069,597 1,284,946 10,534,389
2010 971,134 1,157,298 435,485 1,076,156 397,858 4,032,579 489,144 123,401 1,110,863 1,372,541 11,166,460
2011 1,021,624 1,142,631 458,176 1,079,131 410,692 4,476,969 506,170 127,461 1,135,904 1,457,020 11,815,778
2012 1,132,544 1,163,162 491,946 1,160,477 394,004 4,912,185 535,887 131,493 1,183,032 1,566,498 12,671,227
2013 1,287,639 1,218,578 516,611 1,257,081 422,105 5,465,722 553,131 131,797 1,228,787 1,698,145 13,779,597
2014 1,470,809 1,350,805 677,332 1,420,271 418,844 6,194,064 589,661 141,586 1,357,627 1,887,927 15,508,927
2015 1,669,100 1,510,977 748,937 1,600,985 448,462 7,406,375 664,144 154,488 1,472,757 2,121,577 17,797,802
Table 2.2 – Percentage Change (Year-Over-Year) in Lodging Tax Receipts by Region
Calendar Years Central Central
Coast Mt Hood / Gorge
North Coast Northeastern
Portland Metro
South Coast Southeastern Southern
Willamette Valley Total
2005 to 2006 41.6% 26.3% 21.5% 30.4% 10.2% 13.5% 15.4% 14.5% 10.2% 12.7% 18.1%
2006 to 2007 8.4% 7.7% 13.2% 8.4% 12.3% 11.5% 7.5% 8.7% 3.1% 8.3% 9.1%
2007 to 2008 -3.6% -3.3% 2.0% 0.3% 2.1% 3.6% -4.2% -11.4% -5.4% 2.5% 0.2%
2008 to 2009 -11.4% -3.5% -6.9% -3.6% -3.0% -14.6% -13.1% -3.7% -5.1% -12.8% -10.2%
2009 to 2010 6.6% 2.5% 8.5% 3.6% 2.5% 7.6% 8.6% 8.3% 3.9% 6.8% 6.0%
2010 to 2011 5.2% -1.3% 5.2% 0.3% 3.2% 11.0% 3.5% 3.3% 2.3% 6.2% 5.8%
2011 to 2012 10.9% 1.8% 7.4% 7.5% -4.1% 9.7% 5.9% 3.2% 4.1% 7.5% 7.2%
2012 to 2013 13.7% 4.8% 5.0% 8.3% 7.1% 11.3% 3.2% 0.2% 3.9% 8.4% 8.7%
2013 to 2014 14.2% 10.9% 31.1% 13.0% -0.8% 13.3% 6.6% 7.4% 10.5% 11.2% 12.5%
2014 to 2015 13.5% 11.9% 10.6% 12.7% 7.1% 19.6% 12.6% 9.1% 8.5% 12.4% 14.8%
Lodging Statistics by Region
Oregon Department of Revenue, Research Section 15
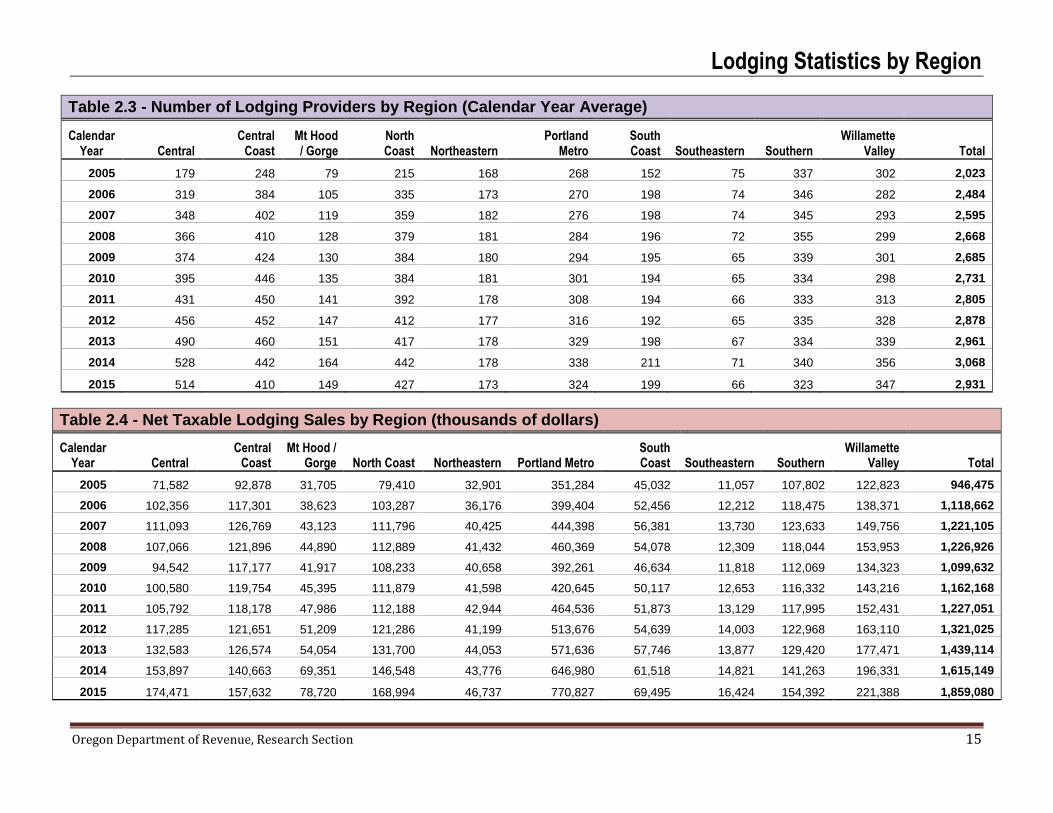
Table 2.3 - Number of Lodging Providers by Region (Calendar Year Average)
Calendar Year Central
Central Coast
Mt Hood / Gorge
North Coast Northeastern
Portland Metro
South Coast Southeastern Southern
Willamette Valley Total
2005 179 248 79 215 168 268 152 75 337 302 2,023
2006 319 384 105 335 173 270 198 74 346 282 2,484
2007 348 402 119 359 182 276 198 74 345 293 2,595
2008 366 410 128 379 181 284 196 72 355 299 2,668
2009 374 424 130 384 180 294 195 65 339 301 2,685
2010 395 446 135 384 181 301 194 65 334 298 2,731
2011 431 450 141 392 178 308 194 66 333 313 2,805
2012 456 452 147 412 177 316 192 65 335 328 2,878
2013 490 460 151 417 178 329 198 67 334 339 2,961
2014 528 442 164 442 178 338 211 71 340 356 3,068
2015 514 410 149 427 173 324 199 66 323 347 2,931
Table 2.4 - Net Taxable Lodging Sales by Region (thousands of dollars)
Calendar Year Central
Central Coast
Mt Hood / Gorge North Coast Northeastern Portland Metro
South Coast Southeastern Southern
Willamette Valley Total
2005 71,582 92,878 31,705 79,410 32,901 351,284 45,032 11,057 107,802 122,823 946,475
2006 102,356 117,301 38,623 103,287 36,176 399,404 52,456 12,212 118,475 138,371 1,118,662
2007 111,093 126,769 43,123 111,796 40,425 444,398 56,381 13,730 123,633 149,756 1,221,105
2008 107,066 121,896 44,890 112,889 41,432 460,369 54,078 12,309 118,044 153,953 1,226,926
2009 94,542 117,177 41,917 108,233 40,658 392,261 46,634 11,818 112,069 134,323 1,099,632
2010 100,580 119,754 45,395 111,879 41,598 420,645 50,117 12,653 116,332 143,216 1,162,168
2011 105,792 118,178 47,986 112,188 42,944 464,536 51,873 13,129 117,995 152,431 1,227,051
2012 117,285 121,651 51,209 121,286 41,199 513,676 54,639 14,003 122,968 163,110 1,321,025
2013 132,583 126,574 54,054 131,700 44,053 571,636 57,746 13,877 129,420 177,471 1,439,114
2014 153,897 140,663 69,351 146,548 43,776 646,980 61,518 14,821 141,263 196,331 1,615,149
2015 174,471 157,632 78,720 168,994 46,737 770,827 69,495 16,424 154,392 221,388 1,859,080

Appendix – Quarterly Data by Accommodation Type
Oregon Department of Revenue, Research Section 16
The appendix shows calendar year 2005 – 2015 quarterly data by accommodation type and region.
Note: The number of accommodation types available changed beginning in 2013. The tables presented here reflect the new accommodation type categorization.
Note: Approximately 350 lodging providers reported more than one accommodation type when they registered. Counts for every accommodation type indicated on registrations are included in this table. For that reason, totals are not provided as it would overstate the number of lodging providers in Oregon.
Table A: 1.1 - Number of Lodging Providers by Accommodation Type
Quarter Bed and
Breakfast Campgrounds
& RV Sites Hotel Motel Vacation
Home Lodging
Intermediary Other
2005 Q1 264 440 303 854 115 N/A 105
2005 Q2 279 590 308 870 131 N/A 118
2005 Q3 284 588 302 878 138 N/A 107
2005 Q4 269 500 306 856 136 N/A 98
2005 Avg. 274 530 305 865 130 N/A 107
2006 Q1 268 417 301 861 584 N/A 103
2006 Q2 295 486 300 867 672 N/A 126
2006 Q3 302 474 299 870 725 N/A 126
2006 Q4 281 430 296 861 712 N/A 115
2006 Avg. 287 452 299 865 673 N/A 118
2007 Q1 278 401 297 856 701 N/A 113
2007 Q2 308 461 308 867 783 N/A 140
2007 Q3 319 467 308 863 836 N/A 139
2007 Q4 308 432 316 853 782 N/A 121
2007 Avg. 303 440 307 860 776 N/A 128
2008 Q1 291 403 300 831 790 N/A 101
2008 Q2 317 461 310 853 881 N/A 123
2008 Q3 325 458 318 857 938 N/A 136
2008 Q4 294 427 317 842 857 N/A 109
2008 Avg. 307 437 311 846 867 N/A 117
2009 Q1 277 392 311 824 862 N/A 103
2009 Q2 306 439 320 840 945 N/A 115
2009 Q3 309 443 324 843 996 N/A 111
2009 Q4 282 411 320 834 919 N/A 94
2009 Avg. 294 421 319 835 931 N/A 106

Appendix – Quarterly Data by Accommodation Type
Oregon Department of Revenue, Research Section 17
Table A: 1.1 - Number of Lodging Providers by Accommodation Type (cont.)
Quarter Bed and
Breakfast Campgrounds
& RV Sites Hotel Motel Vacation
Home Lodging
Intermediary Other
2010 Q1 259 379 314 817 924 N/A 76
2010 Q2 288 427 324 846 1011 N/A 92
2010 Q3 288 435 322 846 1087 N/A 100
2010 Q4 268 395 319 840 1011 N/A 78
2010 Avg. 276 409 320 837 1,008 N/A 87
2011 Q1 254 378 323 817 1002 N/A 64
2011 Q2 280 426 326 838 1115 N/A 73
2011 Q3 295 431 328 848 1188 N/A 77
2011 Q4 283 400 329 835 1109 N/A 58
2011 Avg. 278 409 327 835 1,104 N/A 68
2012 Q1 260 372 324 816 1073 N/A 40
2012 Q2 287 423 332 833 1232 N/A 56
2012 Q3 290 429 331 834 1312 N/A 56
2012 Q4 280 399 331 828 1204 N/A 38
2012 Avg. 279 406 330 828 1,205 N/A 48
2013 Q1 257 380 328 809 1188 N/A 43
2013 Q2 276 417 338 824 1303 N/A 74
2013 Q3 282 425 338 826 1394 N/A 66
2013 Q4 266 405 356 810 1279 57 60
2013 Avg. 270 407 340 817 1,291 57 61
2014 Q1 236 382 355 782 1237 59 56
2014 Q2 261 429 362 798 1386 62 108
2014 Q3 260 430 369 790 1469 76 113
2014 Q4 246 403 369 778 1339 69 87
2014 Avg. 251 411 364 787 1,358 67 91
2015 Q1 230 389 360 763 1239 62 89
2015 Q2 230 401 372 771 1357 64 94
2015 Q3 231 403 365 764 1361 72 98
2015 Q4 212 358 348 728 1207 63 100
2015 Avg. 226 388 361 757 1,291 65 95

Appendix – Quarterly Data by Accommodation Type
Oregon Department of Revenue, Research Section 18
Table A: 1.2 - Net Taxable Lodging Sales by Accommodation Type (thousands of dollars)
Quarter Bed &
Breakfast Campgrounds
& RV Sites Hotel Motel Vacation
Home Lodging
Intermediary Multiple1 &
Other Total
2005 Q1 2,470 3,197 93,577 53,479 4,854 N/A 8,662 166,239
2005 Q2 4,334 7,268 127,590 78,196 6,424 N/A 15,831 239,643
2005 Q3 7,186 13,453 165,042 119,664 11,077 N/A 27,324 343,747
2005 Q4 3,168 3,634 109,388 63,796 5,676 N/A 11,184 196,846
2005 Total 17,159 27,552 495,597 315,135 28,031 N/A 63,001 946,475
2006 Q1 2,505 3,435 105,047 60,194 11,447 N/A 11,909 194,536
2006 Q2 4,893 9,779 135,265 87,902 16,757 N/A 20,679 275,276
2006 Q3 8,321 16,785 186,994 132,146 39,515 N/A 36,925 420,686
2006 Q4 3,572 4,562 120,124 70,617 14,760 N/A 14,530 228,164
2006 Total 19,290 34,561 547,430 350,859 82,479 N/A 84,043 1,118,662
2007 Q1 2,802 3,687 113,540 65,796 13,661 N/A 13,166 212,653
2007 Q2 5,382 9,573 152,566 96,822 19,498 N/A 22,018 305,858
2007 Q3 9,160 17,849 201,768 143,653 44,668 N/A 39,799 456,897
2007 Q4 3,886 4,626 131,866 74,759 15,844 N/A 14,715 245,696
2007 Total 21,230 35,735 599,740 381,030 93,671 N/A 89,698 1,221,105
2008 Q1 2,999 3,681 123,771 65,626 15,888 N/A 13,003 224,967
2008 Q2 6,153 8,898 165,483 94,228 22,114 N/A 21,145 318,022
2008 Q3 9,711 17,083 210,120 136,252 50,698 N/A 37,853 461,717
2008 Q4 3,575 4,023 123,989 63,947 15,005 N/A 11,680 222,220
2008 Total 22,438 33,685 623,363 360,053 103,706 N/A 83,681 1,226,926
2009 Q1 1,991 3,813 107,617 55,831 14,067 N/A 10,543 193,862
2009 Q2 5,301 10,150 140,201 82,213 20,823 N/A 17,454 276,141
2009 Q3 9,057 17,876 184,233 123,323 49,860 N/A 33,232 417,581
2009 Q4 3,610 2,998 119,326 59,591 15,264 N/A 11,257 212,048
2009 Total 19,960 34,837 551,377 320,958 100,014 N/A 72,487 1,099,632
Note: The number of accommodation types available changed beginning in 2013. The tables presented here reflect the new accommodation type categorization. 1 "Multiple" represents approximately 350 lodging providers that reported more than one accommodation type when they registered. Table 1.3 provides counts for every accommodation type listed on these registration forms. However, because lodging providers are asked to report sales and tax receipts in total, it is not possible to break out the sales or tax by accommodation type for providers registered with more than one type of accommodation. Tables 1.1, 1.2, and 1.4 provide sales and tax receipts for these lodging providers in a “multiple” accommodation type category.

Appendix – Quarterly Data by Accommodation Type
Oregon Department of Revenue, Research Section 19
Table A: 1.2 - Net Taxable Lodging Sales by Accommodation Type (thousands of dollars) (cont.)
Quarter Bed &
Breakfast Campgrounds
& RV Sites Hotel Motel Vacation
Home Lodging
Intermediary Multiple1 &
Other Total
2010 Q1 2,478 4,218 116,069 55,708 15,895 N/A 7,605 201,974
2010 Q2 5,353 9,764 152,377 83,859 21,947 N/A 14,123 287,423
2010 Q3 8,960 22,133 203,098 128,475 52,968 N/A 29,801 445,435
2010 Q4 3,671 4,052 130,039 63,306 17,507 N/A 8,762 227,337
2010 Total 20,461 40,167 601,583 331,349 108,318 N/A 60,290 1,162,168
2011 Q1 2,414 2,714 121,772 57,148 16,645 N/A 7,557 208,250
2011 Q2 5,341 9,569 169,607 86,455 23,838 N/A 14,245 309,056
2011 Q3 9,190 21,042 220,252 132,490 58,436 N/A 30,462 471,873
2011 Q4 3,435 3,989 138,141 64,547 18,508 N/A 9,253 237,872
2011 Total 20,380 37,315 649,772 340,640 117,427 N/A 61,517 1,227,051
2012 Q1 2,652 2,860 132,443 57,678 18,062 N/A 8,078 221,773
2012 Q2 6,395 10,286 184,691 89,431 27,802 N/A 15,921 334,526
2012 Q3 10,414 22,378 240,787 136,378 65,387 N/A 33,613 508,957
2012 Q4 4,161 4,192 150,758 66,114 20,789 N/A 9,756 255,769
2012 Total 23,622 39,716 708,679 349,601 132,040 N/A 67,368 1,321,025
2013 Q1 3,183 3,414 143,071 60,788 18,391 N/A 9,061 237,909
2013 Q2 6,734 14,507 208,138 96,797 27,567 N/A 17,599 371,342
2013 Q3 11,270 22,552 266,610 145,583 66,180 N/A 35,784 547,979
2013 Q4 4,613 4,465 163,787 71,517 20,975 5,511 11,015 281,883
2013 Total 25,801 44,938 781,606 374,685 133,113 5,511 73,460 1,439,114
2014 Q1 3,476 3,806 156,496 66,739 21,504 4,551 9,804 266,374
2014 Q2 6,960 12,214 221,676 102,656 31,834 7,029 19,179 401,548
2014 Q3 11,371 25,490 301,348 156,748 77,068 12,819 38,250 623,095
2014 Q4 4,925 5,442 189,576 77,346 23,982 11,115 11,744 324,131
2014 Total 26,733 46,952 869,097 403,489 154,388 35,515 78,976 1,615,149
2015 Q1 3,591 4,956 185,497 74,760 24,785 15,213 10,072 318,873
2015 Q2 7,951 13,849 259,226 114,226 38,235 21,643 19,843 474,974
2015 Q3 11,886 26,600 337,572 157,955 84,028 52,975 37,434 708,450
2015 Q4 5,485 6,087 198,097 76,459 27,693 30,131 12,831 356,784
2015 Total 28,914 51,492 980,392 423,401 174,741 119,961 80,179 1,859,080

Appendix – Quarterly Data by Accommodation Type
Oregon Department of Revenue, Research Section 20
Table A: 1.3 - Lodging Tax Receipts by Accommodation Type (dollars)
Quarter Bed &
Breakfast Campgrounds
& RV Sites Hotel Motel Vacation
Home Lodging
Intermediary Multiple1 &
Other Total
2005 Q1 23,442 30,630 894,458 514,510 46,049 N/A 82,768 1,591,857
2005 Q2 42,068 70,295 1,215,907 763,432 61,325 N/A 154,927 2,307,954
2005 Q3 69,091 130,302 1,569,192 1,153,800 106,518 N/A 264,493 3,293,397
2005 Q4 30,976 34,829 1,043,018 622,666 54,455 N/A 110,385 1,896,328
2005 Total 165,577 266,056 4,722,575 3,054,408 268,347 N/A 612,573 9,089,536
2006 Q1 24,131 34,537 999,269 579,308 110,984 N/A 117,045 1,865,274
2006 Q2 47,302 95,785 1,287,776 877,838 162,611 N/A 198,627 2,669,939
2006 Q3 80,083 161,413 1,744,951 1,270,029 380,899 N/A 355,371 3,992,746
2006 Q4 34,415 43,720 1,148,704 690,364 143,438 N/A 142,448 2,203,089
2006 Total 185,931 335,455 5,180,700 3,417,539 797,932 N/A 813,491 10,731,048
2007 Q1 27,559 35,689 1,080,029 632,752 132,190 N/A 131,504 2,039,724
2007 Q2 52,787 92,226 1,450,440 932,738 188,892 N/A 210,080 2,927,162
2007 Q3 88,407 175,876 1,920,935 1,377,723 430,059 N/A 385,167 4,378,168
2007 Q4 38,011 45,982 1,251,918 728,298 153,562 N/A 143,819 2,361,589
2007 Total 206,764 349,773 5,703,323 3,671,511 904,703 N/A 870,570 11,706,644
2008 Q1 29,328 36,484 1,179,768 632,393 155,262 N/A 126,862 2,160,097
2008 Q2 58,779 85,672 1,574,169 905,855 211,836 N/A 202,776 3,039,086
2008 Q3 94,451 165,806 2,000,583 1,301,011 488,342 N/A 363,126 4,413,318
2008 Q4 34,574 38,429 1,180,776 611,723 144,084 N/A 109,700 2,119,286
2008 Total 217,132 326,391 5,935,295 3,450,981 999,525 N/A 802,464 11,731,788
2009 Q1 19,036 36,397 1,022,173 534,058 134,632 N/A 100,088 1,846,383
2009 Q2 50,855 97,174 1,333,472 790,657 200,416 N/A 168,357 2,640,931
2009 Q3 86,357 170,751 1,767,575 1,186,875 481,300 N/A 317,187 4,010,045
2009 Q4 34,959 28,702 1,139,345 578,163 147,607 N/A 108,253 2,037,030
2009 Total 191,207 333,024 5,262,565 3,089,753 963,954 N/A 693,885 10,534,389
Note: The number of accommodation types available changed in 2013. The tables presented here reflect the new accommodation type categorization. 1 "Multiple" represents approximately 350 lodging providers that reported more than one accommodation type when they registered. Table 1.3 provides counts for every accommodation type listed on these registration forms. However, because lodging providers are asked to report sales and tax receipts in total, it is not possible to break out the sales or tax by accommodation type for providers registered with more than one type of accommodation. Tables 1.1, 1.2, and 1.4 provide sales and tax receipts for these lodging providers in a “multiple” accommodation type category.

Appendix – Quarterly Data by Accommodation Type
Oregon Department of Revenue, Research Section 21
Table A: 1.3 - Lodging Tax Receipts by Accommodation Type (dollars) (cont.)
Quarter Bed &
Breakfast Campgrounds
& RV Sites Hotel Motel Vacation
Home Lodging
Intermediary Multiple1 &
Other Total
2010 Q1 24,275 41,527 1,103,998 541,221 153,710 N/A 73,997 1,938,727
2010 Q2 52,432 93,594 1,466,376 811,979 212,861 N/A 135,099 2,772,340
2010 Q3 87,860 213,366 1,927,277 1,243,268 512,716 N/A 287,745 4,272,232
2010 Q4 36,102 38,823 1,245,160 608,921 169,047 N/A 85,107 2,183,161
2010 Total 200,669 387,310 5,742,810 3,205,390 1,048,333 N/A 581,948 11,166,460
2011 Q1 24,425 25,973 1,158,222 543,449 160,396 N/A 73,426 1,985,891
2011 Q2 52,834 93,089 1,625,901 832,122 229,240 N/A 136,721 2,969,907
2011 Q3 89,987 203,709 2,135,341 1,281,642 564,459 N/A 300,829 4,575,967
2011 Q4 33,614 38,667 1,317,744 619,927 177,531 N/A 96,531 2,284,013
2011 Total 200,859 361,438 6,237,208 3,277,140 1,131,626 N/A 607,507 11,815,778
2012 Q1 30,648 27,242 1,261,111 557,472 173,716 N/A 78,283 2,128,472
2012 Q2 63,453 98,638 1,759,897 865,676 266,392 N/A 155,992 3,210,048
2012 Q3 101,370 214,401 2,296,101 1,306,610 633,715 N/A 324,785 4,876,981
2012 Q4 41,816 40,135 1,445,455 633,898 200,397 N/A 94,027 2,455,727
2012 Total 237,287 380,415 6,762,564 3,363,655 1,274,219 N/A 653,086 12,671,227
2013 Q1 32,095 33,937 1,370,606 595,142 177,312 N/A 86,839 2,295,931
2013 Q2 66,267 139,427 1,990,368 921,620 264,986 N/A 169,030 3,551,698
2013 Q3 109,208 215,802 2,534,667 1,387,446 639,657 N/A 343,952 5,230,731
2013 Q4 45,350 42,922 1,561,207 680,520 201,493 64,592 105,151 2,701,236
2013 Total 252,920 432,088 7,456,848 3,584,728 1,283,448 64,592 704,972 13,779,597
2014 Q1 33,464 36,559 1,492,372 638,608 202,775 55,969 94,444 2,554,192
2014 Q2 67,516 117,164 2,111,096 983,245 305,167 86,140 184,691 3,855,019
2014 Q3 109,828 246,207 2,888,811 1,491,185 736,941 148,178 363,543 5,984,691
2014 Q4 46,949 52,481 1,804,141 750,291 229,461 120,291 111,412 3,115,026
2014 Total 257,757 452,411 8,296,419 3,863,329 1,474,344 410,578 754,089 15,508,927
2015 Q1 34,593 47,711 1,771,677 712,869 239,994 157,904 96,061 3,060,809
2015 Q2 76,280 132,572 2,490,429 1,081,947 360,292 205,701 189,111 4,536,331
2015 Q3 113,874 251,860 3,229,316 1,516,601 804,131 503,475 355,398 6,774,655
2015 Q4 51,595 59,815 1,912,428 728,110 264,683 286,302 123,073 3,426,007
2015 Total 276,343 491,958 9,403,850 4,039,527 1,669,100 1,153,382 763,642 17,797,802

Appendix – Quarterly Data by Region
Oregon Department of Revenue, Research Section 22
Table A: 2.1- Number of Lodging Providers by Region
Quarter Central Central
Coast Mt Hood /
Gorge North Coast Northeastern Portland Metro South Coast Southeastern Southern
Willamette Valley Total
2005 Q1 157 247 73 216 154 267 149 70 308 276 1,917
2005 Q2 196 253 81 218 174 268 151 78 352 327 2,098
2005 Q3 193 252 80 215 178 267 159 79 354 321 2,098
2005 Q4 169 241 80 209 167 271 148 73 335 284 1,977
2005 Avg. 179 248 79 215 168 268 152 75 337 302 2,023
2006 Q1 288 364 96 309 161 275 189 69 322 275 2,348
2006 Q2 329 381 105 338 181 269 203 77 356 288 2,527
2006 Q3 344 400 107 350 179 269 199 78 365 286 2,577
2006 Q4 314 392 111 342 169 266 199 72 340 279 2,484
2006 Avg. 319 384 105 335 173 270 198 74 346 282 2,484
2007 Q1 323 384 110 338 170 273 192 69 320 277 2,456
2007 Q2 352 407 119 362 189 276 202 76 353 294 2,630
2007 Q3 374 415 122 379 192 275 203 77 360 302 2,699
2007 Q4 341 400 125 357 177 281 194 74 348 297 2,594
2007 Avg. 348 402 119 359 182 276 198 74 345 293 2,595
2008 Q1 343 394 123 353 170 276 185 64 326 286 2,520
2008 Q2 371 412 129 381 187 287 201 74 366 309 2,717
2008 Q3 403 427 134 399 191 287 200 77 374 309 2,801
2008 Q4 345 406 126 383 174 287 197 73 352 290 2,633
2008 Avg. 366 410 128 379 181 284 196 72 355 299 2,668
2009 Q1 343 406 127 374 164 290 192 60 317 291 2,564
2009 Q2 382 430 129 392 187 295 197 68 349 306 2,735
2009 Q3 413 435 130 399 194 294 198 67 354 310 2,794
2009 Q4 359 426 132 372 175 295 192 64 335 298 2,648
2009 Avg. 374 424 130 384 180 294 195 65 339 301 2,685

Appendix – Quarterly Data by Region
Oregon Department of Revenue, Research Section 23
Table A: 2.1 - Number of Lodging Providers by Region (cont.)
Quarter Central Central
Coast Mt Hood / Gorge
North Coast Northeastern
Portland Metro
South Coast Southeastern Southern
Willamette Valley Total
2010 Q1 358 428 130 371 162 296 186 60 311 285 2,587 2010 Q2 410 446 132 383 195 300 194 68 347 300 2,775 2010 Q3 428 462 138 407 190 304 202 67 348 308 2,854 2010 Q4 383 448 138 374 175 302 194 65 331 299 2,709
2010 Avg. 395 446 135 384 181 301 194 65 334 298 2,731
2011 Q1 382 450 134 361 163 305 186 62 301 302 2,646 2011 Q2 445 447 140 397 181 306 198 68 341 310 2,833 2011 Q3 472 458 147 412 193 307 201 68 355 323 2,936 2011 Q4 426 444 141 396 175 312 192 65 335 317 2,803
2011 Avg. 431 450 141 392 178 308 194 66 333 313 2,805
2012 Q1 408 431 139 389 155 308 186 61 310 313 2,700 2012 Q2 473 459 144 416 187 314 194 66 348 331 2,932 2012 Q3 502 466 154 437 187 319 199 66 351 337 3,018 2012 Q4 441 450 149 406 177 323 189 67 332 329 2,863
2012 Avg. 456 452 147 412 177 316 192 65 335 328 2,878
2013 Q1 445 451 143 396 158 319 189 61 308 326 2,796 2013 Q2 495 465 146 418 187 331 194 66 339 336 2,977 2013 Q3 543 468 157 435 190 331 203 66 344 346 3,083 2013 Q4 477 457 158 419 175 333 204 73 344 349 2,989
2013 Avg. 490 460 151 417 178 329 198 67 334 339 2,961
2014 Q1 472 430 156 411 161 329 204 66 309 349 2,887 2014 Q2 541 450 164 449 187 338 207 74 350 361 3,121 2014 Q3 581 455 174 469 189 345 222 73 359 357 3,224 2014 Q4 519 431 160 438 175 338 212 70 341 355 3,039
2014 Avg. 528 442 164 442 178 338 211 71 340 356 3,068
2015 Q1 488 420 146 415 164 330 197 66 314 346 2,886 2015 Q2 549 419 151 442 177 331 208 71 338 352 3,038 2015 Q3 546 416 154 446 186 326 199 67 336 357 3,033 2015 Q4 473 385 143 404 166 310 191 59 305 332 2,768
2015 Avg. 514 410 149 427 173 324 199 66 323 347 2,931

Appendix – Quarterly Data by Region
Oregon Department of Revenue, Research Section 24
Table A: 2.2 - Net Taxable Lodging Sales by Region (thousands of dollars)
Quarter Central Central
Coast Mt Hood / Gorge
North Coast Northeastern
Portland Metro
South Coast Southeastern Southern
Willamette Valley Total
2005 Q1 10,444 16,123 5,078 11,559 5,605 69,858 6,048 1,635 16,295 23,593 166,239
2005 Q2 18,221 21,772 7,987 18,752 9,019 90,364 10,696 3,137 28,149 31,546 239,643
2005 Q3 30,078 38,478 12,055 36,617 12,092 107,624 20,315 4,016 42,739 39,733 343,747
2005 Q4 12,838 16,506 6,585 12,483 6,186 83,438 7,974 2,268 20,620 27,950 196,846
2005 Total 71,582 92,878 31,705 79,410 32,901 351,284 45,032 11,057 107,802 122,823 946,475
2006 Q1 15,351 18,660 7,269 13,534 5,901 81,526 6,709 1,759 17,215 26,612 194,536
2006 Q2 24,942 27,404 9,324 24,430 9,926 95,418 13,257 3,492 31,496 35,585 275,276
2006 Q3 44,750 50,727 14,376 49,604 13,251 127,839 23,250 4,464 46,966 45,459 420,686
2006 Q4 17,314 20,511 7,654 15,719 7,098 94,621 9,239 2,496 22,797 30,715 228,164
2006 Total 102,356 117,301 38,623 103,287 36,176 399,404 52,456 12,212 118,475 138,371 1,118,662
2007 Q1 16,248 20,366 7,378 14,679 6,322 89,898 7,442 2,051 18,557 29,712 212,653
2007 Q2 25,428 29,810 10,635 26,718 11,110 111,301 14,596 3,983 33,299 38,978 305,858
2007 Q3 50,796 55,290 16,254 53,135 15,451 138,302 25,127 4,940 49,089 48,513 456,897
2007 Q4 18,621 21,304 8,856 17,263 7,543 104,896 9,217 2,756 22,687 32,553 245,696
2007 Total 111,093 126,769 43,123 111,796 40,425 444,398 56,381 13,730 123,633 149,756 1,221,105
2008 Q1 16,856 19,938 8,878 15,932 6,768 97,321 7,550 1,889 18,710 31,124 224,967
2008 Q2 25,793 29,394 11,027 27,715 11,359 121,666 14,222 3,600 31,574 41,672 318,022
2008 Q3 49,654 53,954 16,740 54,145 15,566 145,255 24,146 4,320 47,317 50,620 461,717
2008 Q4 14,763 18,610 8,245 15,097 7,739 96,128 8,159 2,499 20,443 30,537 222,220
2008 Total 107,066 121,896 44,890 112,889 41,432 460,369 54,078 12,309 118,044 153,953 1,226,926
2009 Q1 13,341 19,342 8,001 14,505 6,429 81,725 6,657 1,759 15,947 26,157 193,862
2009 Q2 21,827 27,464 10,277 25,576 11,717 96,981 11,400 3,620 30,808 36,471 276,141
2009 Q3 44,547 52,267 15,380 53,452 15,360 121,721 21,636 4,374 45,275 43,569 417,581
2009 Q4 14,828 18,105 8,259 14,700 7,152 91,834 6,941 2,066 20,039 28,126 212,048
2009 Total 94,542 117,177 41,917 108,233 40,658 392,261 46,634 11,818 112,069 134,323 1,099,632
Appendix – Quarterly Data by Region
Oregon Department of Revenue, Research Section 25
Table A: 2.2 - Net Taxable Lodging Sales by Region (thousands of dollars) (cont.)
Quarter Central Central
Coast Mt Hood / Gorge
North Coast Northeastern
Portland Metro
South Coast Southeastern Southern
Willamette Valley Total
2010 Q1 13,893 20,349 8,027 16,105 6,124 86,967 6,679 1,763 15,971 26,096 201,974
2010 Q2 22,680 26,909 10,718 25,714 11,237 104,655 11,602 3,536 31,932 38,440 287,423
2010 Q3 47,936 53,403 17,106 54,533 16,488 132,643 23,658 4,748 47,460 47,460 445,435
2010 Q4 16,071 19,093 9,543 15,527 7,749 96,380 8,178 2,606 20,968 31,221 227,337
2010 Total 100,580 119,754 45,395 111,879 41,598 420,645 50,117 12,653 116,332 143,216 1,162,168
2011 Q1 14,421 18,742 8,771 14,187 6,594 91,569 6,879 1,916 16,815 28,355 208,250
2011 Q2 23,640 27,144 11,795 25,643 11,938 119,304 12,287 3,993 31,438 41,873 309,056
2011 Q3 51,144 53,223 18,457 56,523 16,652 148,782 24,397 4,621 48,367 49,708 471,873
2011 Q4 16,586 19,068 8,963 15,835 7,759 104,880 8,311 2,599 21,375 32,495 237,872
2011 Total 105,792 118,178 47,986 112,188 42,944 464,536 51,873 13,129 117,995 152,431 1,227,051
2012 Q1 15,234 19,448 8,918 15,084 6,476 101,097 7,401 2,011 17,151 28,951 221,773
2012 Q2 27,000 29,078 12,124 28,130 11,354 131,042 13,027 3,926 32,961 45,884 334,526
2012 Q3 56,908 54,485 20,658 60,653 15,956 165,265 25,240 4,927 50,236 54,630 508,957
2012 Q4 18,143 18,641 9,509 17,418 7,413 116,271 8,971 3,139 22,620 33,645 255,769
2012 Total 117,285 121,651 51,209 121,286 41,199 513,676 54,639 14,003 122,968 163,110 1,321,025
2013 Q1 17,949 19,094 9,688 17,045 6,431 108,757 7,589 2,011 18,204 31,141 237,909
2013 Q2 30,563 30,068 12,868 31,386 12,138 151,506 14,528 4,125 35,299 48,861 371,342
2013 Q3 62,688 56,962 21,320 63,658 17,008 184,103 26,091 5,142 51,996 59,012 547,979
2013 Q4 21,384 20,450 10,178 19,611 8,476 127,270 9,538 2,599 23,921 38,457 281,883
2013 Total 132,583 126,574 54,054 131,700 44,053 571,636 57,746 13,877 129,420 177,471 1,439,114
2014 Q1 21,533 21,019 10,680 18,808 6,835 122,239 8,424 2,172 19,638 35,025 266,374
2014 Q2 35,556 32,301 14,728 34,333 11,980 163,383 15,069 4,322 37,268 52,609 401,548
2014 Q3 72,449 64,370 27,581 71,599 16,805 213,491 27,496 5,352 57,185 66,767 623,095
2014 Q4 24,359 22,973 16,362 21,808 8,156 147,867 10,529 2,976 27,172 41,930 324,131
2014 Avg. 153,897 140,663 69,351 146,548 43,776 646,980 61,518 14,821 141,263 196,331 1,615,149
2015 Q1 24,145 26,134 20,051 23,228 7,648 143,231 10,079 2,512 21,977 39,868 318,873
2015 Q2 41,849 37,737 17,517 41,705 12,763 196,433 17,524 4,641 42,923 61,881 474,974
2015 Q3 79,842 69,574 26,405 79,430 17,743 264,668 30,225 6,406 59,969 74,189 708,450
2015 Q4 28,636 24,187 14,746 24,632 8,582 166,495 11,667 2,865 29,522 45,451 356,784
2015 Avg. 174,471 157,632 78,720 168,994 46,737 770,827 69,495 16,424 154,392 221,388 1,859,080

Appendix – Quarterly Data by Region
Oregon Department of Revenue, Research Section 26
Table A: 2.3 - Lodging Tax Receipts by Region (dollars)
Quarter Central Central
Coast Mt Hood / Gorge
North Coast Northeastern
Portland Metro
South Coast Southeastern Southern
Willamette Valley Total
2005 Q1 100,893 154,581 48,955 109,346 53,549 667,355 60,331 15,665 156,417 224,766 1,591,857
2005 Q2 178,201 208,020 77,144 179,481 86,149 860,880 103,972 30,650 280,708 302,750 2,307,954
2005 Q3 290,460 367,822 117,559 350,378 116,588 1,023,760 194,890 38,702 411,872 381,366 3,293,397
2005 Q4 124,929 158,838 64,150 120,766 60,314 796,377 77,369 22,247 200,647 270,691 1,896,328
2005 Total 694,483 889,260 307,808 759,971 316,600 3,348,373 436,561 107,264 1,049,645 1,179,572 9,089,536
2006 Q1 147,776 179,336 70,594 131,135 56,632 776,261 64,503 17,044 167,557 254,437 1,865,274
2006 Q2 239,896 263,028 89,388 234,901 95,172 940,920 127,682 34,301 303,931 340,720 2,669,939
2006 Q3 428,653 484,500 139,196 473,515 127,733 1,180,301 221,902 44,066 454,013 438,868 3,992,746
2006 Q4 167,029 196,492 74,682 151,655 69,391 901,265 89,594 27,458 230,717 294,805 2,203,089
2006 Total 983,354 1,123,355 373,859 991,205 348,928 3,798,748 503,682 122,869 1,156,218 1,328,829 10,731,048
2007 Q1 156,190 194,204 75,155 140,632 61,131 855,991 71,091 19,862 179,787 285,682 2,039,724
2007 Q2 245,142 281,773 105,284 255,143 107,985 1,059,250 140,554 38,736 319,253 374,042 2,927,162
2007 Q3 488,103 528,544 157,308 511,040 148,254 1,317,631 241,474 47,992 472,091 465,732 4,378,168
2007 Q4 176,620 205,398 85,297 167,699 74,484 1,002,976 88,257 26,923 220,535 313,400 2,361,589
2007 Total 1,066,05
5 1,209,919 423,044 1,074,514 391,853 4,235,847 541,376 133,513 1,191,666 1,438,856 11,706,644
2008 Q1 163,445 194,870 85,191 152,616 67,408 927,709 72,701 18,156 179,882 298,120 2,160,097
2008 Q2 246,609 280,554 106,042 265,598 109,065 1,162,127 135,873 34,580 300,267 398,370 3,039,086
2008 Q3 476,429 516,497 161,378 514,811 148,902 1,382,429 231,920 41,363 452,761 486,828 4,413,318
2008 Q4 140,996 178,088 78,734 144,664 74,611 914,896 77,919 24,208 194,161 291,010 2,119,286
2008 Total 1,027,48
0 1,170,008 431,346 1,077,689 399,986 4,387,160 518,412 118,308 1,127,071 1,474,327 11,731,788
2009 Q1 127,259 184,542 76,462 138,330 61,394 777,339 63,115 16,738 152,774 248,429 1,846,383
2009 Q2 212,578 265,261 98,754 243,444 111,311 921,814 109,405 34,677 294,201 349,486 2,640,931
2009 Q3 427,854 503,470 146,841 513,758 146,885 1,171,378 208,420 42,227 431,136 418,076 4,010,045
2009 Q4 142,918 175,521 79,342 143,014 68,524 877,363 69,627 20,280 191,487 268,954 2,037,030
2009 Total 910,609 1,128,794 401,398 1,038,546 388,114 3,747,894 450,568 113,923 1,069,597 1,284,946 10,534,389

Appendix – Quarterly Data by Region
Oregon Department of Revenue, Research Section 27
Table A: 2.3 - Lodging Tax Receipts by Region (dollars) (cont.)
Quarter Central Central
Coast Mt Hood / Gorge
North Coast Northeastern
Portland Metro
South Coast Southeastern Southern
Willamette Valley Total
2010 Q1 133,672 196,822 76,663 155,920 58,640 831,292 67,049 17,240 152,537 248,894 1,938,727
2010 Q2 218,046 260,056 103,023 248,567 107,276 1,014,174 114,020 34,625 302,860 369,694 2,772,340
2010 Q3 465,233 515,601 163,961 521,637 157,760 1,262,049 228,892 45,968 454,841 456,289 4,272,232
2010 Q4 154,183 184,818 91,839 150,032 74,182 925,064 79,184 25,569 200,625 297,665 2,183,161
2010 Total 971,134 1,157,298 435,485 1,076,156 397,858 4,032,579 489,144 123,401 1,110,863 1,372,541 11,166,460
2011 Q1 138,613 179,560 83,738 138,669 63,427 867,320 66,172 19,007 161,898 267,487 1,985,891 2011 Q2 226,719 261,942 113,053 246,403 114,400 1,143,087 120,663 38,619 300,871 404,150 2,969,907
2011 Q3 494,028 518,926 175,934 542,056 158,621 1,467,165 237,441 44,485 463,467 473,844 4,575,967
2011 Q4 162,264 182,202 85,451 152,003 74,245 999,398 81,893 25,351 209,669 311,538 2,284,013
2011 Total 1,021,624 1,142,631 458,176 1,079,131 410,692 4,476,969 506,170 127,461 1,135,904 1,457,020 11,815,778
2012 Q1 147,870 186,372 85,901 144,921 62,247 963,900 74,349 19,937 163,865 279,110 2,128,472
2012 Q2 260,398 277,509 116,644 268,234 107,966 1,255,795 128,403 38,077 317,993 439,030 3,210,048
2012 Q3 549,963 521,256 197,749 579,838 152,510 1,573,255 244,958 47,630 484,856 524,966 4,876,981
2012 Q4 174,313 178,025 91,651 167,484 71,281 1,119,235 88,177 25,849 216,318 323,392 2,455,727
2012 Total 1,132,544 1,163,162 491,946 1,160,477 394,004 4,912,185 535,887 131,493 1,183,032 1,566,498 12,671,227
2013 Q1 182,735 188,946 92,661 163,022 61,385 1,041,986 74,943 18,953 173,359 297,941 2,295,931
2013 Q2 293,165 287,775 122,494 299,318 115,703 1,452,371 140,569 38,936 334,548 466,820 3,551,698 2013 Q3 606,052 545,884 203,125 606,828 163,247 1,751,714 247,083 48,821 493,961 564,016 5,230,731
2013 Q4 205,687 195,974 98,331 187,913 81,770 1,219,652 90,536 25,088 226,919 369,368 2,701,236
2013 Total 1,287,639 1,218,578 516,611 1,257,081 422,105 5,465,722 553,131 131,797 1,228,787 1,698,145 13,779,597
2014 Q1 204,223 202,668 101,797 180,293 66,009 1,172,755 80,877 21,061 186,761 337,747 2,554,192
2014 Q2 341,924 310,284 140,738 327,814 114,804 1,563,491 144,960 41,283 364,704 505,017 3,855,019
2014 Q3 690,865 617,657 265,506 703,800 160,167 2,042,503 263,183 51,038 547,216 642,757 5,984,691
2014 Q4 233,798 220,196 169,291 208,364 77,865 1,415,314 100,641 28,205 258,946 402,406 3,115,026
2014 Total 1,470,809 1,350,805 677,332 1,420,271 418,844 6,194,064 589,661 141,586 1,357,627 1,887,927 15,508,927
2015 Q1 231,386 251,293 191,259 223,546 73,446 1,370,759 96,959 24,095 212,592 385,473 3,060,809
2015 Q2 393,615 359,137 166,713 392,063 122,269 1,896,931 167,634 43,386 404,631 589,952 4,536,331
2015 Q3 770,990 669,282 251,448 756,637 171,104 2,516,954 287,627 60,312 576,509 713,793 6,774,655
2015 Q4 273,108 231,265 139,518 228,739 81,642 1,621,732 111,924 26,696 279,024 432,360 3,426,007
2015 Total 1,669,100 1,510,977 748,937 1,600,985 448,462 7,406,375 664,144 154,488 1,472,757 2,121,577 17,797,802