state trauma advisory oard 2021 annual report
TRANSCRIPT

This Report is Provided as Required by A.R.S. § 36-2222(E)(4)
Don Herrington, Interim Director
STATE TRAUMA ADVISORY BOARD
2021 ANNUAL REPORT
BUREAU OF EMERGENCY MEDICAL SERVICES AND TRAUMA SYSTEM

Page 2
Bureau of Emergency Medical Services and Trauma System
Rachel Zenuk Garcia, MPH, MCHES, Bureau Chief
Ithan Yanofsky, Deputy Chief
Gail Bradley, MD, FACEP, FAEMS, Medical Director
Vatsal Chikani, MPH, BHMS, Epidemiological Data and Quality Assurance Manager
Sri Vidya Mahankali, MS, Senior Epidemiologist
Carissa Wilson, Trauma Data Administrator
Anne Vossbrink, MS, EMS Data Administrator
Travis Connors, MPH, Program Coordinator - Public Health Initiatives
Julia Vinton, MPH, CHES, Time Sensitive Illness & Injury Manager
PREPARED BY

Page 3
The Arizona Department of Health Services’ Bureau of Emergency Medical Services and Trauma System (BEMSTS) wishes to acknowledge the continued hard work and dedication of all the individuals involved in working to understand, prevent, and treat traumatic injury.
Special thanks are extended to the members of the State Trauma Advisory Board, Trauma and EMS Performance Improvement Committee, participating trauma centers, medical directors, program managers, and registrars. Their dedication to continuously improving data collection makes it possible to fully evaluate and advance Arizona’s trauma system.
ACKNOWLEDGEMENTS

Page 4
STATE TRAUMA ADVISORY BOARD MEMBERSHIP
Listed below are the dedicated professionals and citizens who serve the State of Arizona as members of the State Trauma Advisory
Board and the Trauma and EMS Performance Improvement Standing Committee by giving their time, expertise, and invaluable
guidance to the Arizona trauma system. On behalf of the Arizona Department of Health Services and the citizens of Arizona, we
thank them for their many contributions.
Gail Bradley, MD, Chair ADHS BEMSTS Medical Director Phoenix, AZ
Debbie Johnston Statewide Hospital Association Representative
Phoenix, AZ
Shawn Bowker, RN , BSN Local Regional EMS Coordinating Council - Northern Region Representative Flagstaff, AZ
Tara Johnson, MSN, CCRN Urban Advanced Life Support Base Hospital that is not a Trauma Center Representative Chandler, AZ
Deputy Chief Sharon McDonough Fire Department in a County with a Population > 500,000 Representative Tucson, AZ
Neil Williamson, NRP Department of Public Safety Representative Phoenix, AZ
Judy Baum, PT, MSHA Statewide Rehabilitation Facility Representative Prescott Valley, AZ
David Notrica, MD, FACS, FAAP Statewide Pediatric Organization Representative Phoenix, AZ
Vicki Bennett, MSN Society of Trauma Nurses Representative Phoenix, AZ
Nirav Patel, MD, FACS Statewide Organization Representing a National College of Surgeons for Trauma Services Phoenix, AZ
Herman Butler Tribal Health Organization Representative Tuba City, AZ
Rodney A. Reed, NRP Local Regional EMS Coordinating Council - Western Region Representative Yuma, AZ
Franco Castro-Marin, MD National Organization of Emergency Physicians Representative (PMD Liaison) - Scottsdale, AZ
Sandra Nygaard, EMCT-P Local Regional Coordinating EMS Council – Central Region Representative Phoenix, AZ
Brent Burgett, NRP Statewide Ambulance Association Representative Mesa, AZ
Chris Salvino, MD, MS, FACS Trauma Center Representative Lake Havasu City, AZ
Andrew Tang, MD, FACS Trauma Center Representative / Vice Chair Tucson, AZ
Melissa Anderson, RN, MSN Local Regional EMS Coordinating Council - Southeastern Region Representative Tucson, AZ
Iman Feiz-Erfan, MD Statewide Neurosurgical Society Representative Phoenix, AZ
Clifford Jones, MD National Association of Orthopedic Trauma Representative Phoenix, AZ
Garth Gemar, MD National Association of Retired Persons Representative Phoenix, AZ
Anthony Griffay, MD,MPH Representative from Federal Indian Health Services Organization
Philip Johnson, MD Rural ALS Base Hospital that is not a Trauma Center Representative Show Low, AZ

Page 5
TRAUMA & EMS PERFORMANCE IMPROVEMENT STANDING COMMITTEE MEMBERSHIP
Josh Gaither, MD EMS Researcher (AEMRC)/Chair Tucson, AZ
Ralph Zane Kelly, DO State Designated Level II or Level III Trauma Center Program Manager Tuba City, AZ
Melissa Moyer, CSTR Representative of the Trauma Registry Users Group/Vice Chair Phoenix, AZ
Carey Lewis, CPNP-AC/PC Pediatric Representative (MD or RN) Phoenix, AZ
Amber Prince, RN Prehospital EMS Coordinator (AEMS) Tucson, AZ
Tom Flanagan, NRP Ground Ambulance or First Responder Premier EMS Agency – Quality Improvement Officer (NAEMS/WACEMS) Kingman, AZ
Alyson Welch, Prehospital EMS Coordinator (AEMS) Phoenix, AZ
Shawn Bowker, RN, State Trauma Advisory Board Liaison Flagstaff, AZ
Raymond Proa, NREMT-P EMS Registry Group Member Fort Mohave, AZ
James Cunningham, V, RN, NREMT - P Ground Ambulance or First Responder Premier EMS Agency, Quality Improvement Officer (SAEMS/AEMS) Mesa, AZ
Paul Dabrowski, MD Trauma Surgeon Phoenix, AZ
Heather Miller, BSN, RN, CEN, TCRN Western Arizona Council of Emergency Services Kingman, AZ
Candyce Williams, MD Rehabilitation Specialist Phoenix, AZ
Tiffiny Strever, RN State Designated Level I Trauma Center or Trauma Program Representative Phoenix, AZ
Dale Woolridge, MD Injury Researcher (AEMRC) Tucson, AZ
Pam Noland, RN State Designated Level IV Trauma Center Program Manager Willcox, AZ
Garth Gemar, MD EMS Medical Director of a Premier EMS Agency Phoenix, AZ
James Cesolini, CEP, EMT-T, DMT Law Enforcement Representative with Active Involvement in EMS Mesa, AZ
Jacqueline Kurth, Office Chief for Injry and Violence Prevention IPAC Representative Phoenix, AZ
Julie Augenstein, MD Medical Direction Commission Liaison Phoenix,AZ
Michelle Guadnola, RN State Designated Level I Trauma Center Trauma Program Representative Phoenix, AZ
Laura Smith, DNP, RN, CEN State Designated Level I Trauma Center Trauma Program Representative Glendale, AZ
Rebecca Haro, NREMT-P EMS Council Liaison Phoenix, AZ

Page 6
ANNUAL REPORT TO THE DIRECTOR
Arizona’s Trauma System has grown and improved remarkably since the first trauma center was designated in 2007. The state has also experienced significant population growth during the time period. Currently, there are forty-seven state designated trauma centers that have improved timely access to trauma care statewide, including thirteen level I trauma centers, one level I pediatric trauma center, six level III trauma centers, and twenty-seven level IV trauma centers. Over the last year, as the COVID-19 pandemic impacted the entire healthcare system, a level III and a level IV trauma center relinquished their designation. The Bureau will continue to strongly encourage hospitals to formally participate in the Arizona Trauma System and conduct ongoing trauma system evaluation to assure the highest level of care in Arizona.
The 2021 Annual Report illustrates how Arizona’s Trauma System has evolved since 2006 when facilities were self-designating and continued to remain resilient throughout the COVID-19 pandemic from January 1, 2020 to December 31, 2020. Over the course of 2020, there were significant changes in behavior observed due to the Stay-Home-Stay Healthy campaign and executive orders. Several pivotal actions early in the pandemic impacted how individuals accessed healthcare and the 911 system, and appeared to result in changes in health seeking behaviors and trauma rates overall. Despite these major events and behavior changes in 2020, traumatic injury remains a growing health concern and major economic impact.
To help prepare the hospitals to respond to the COVID-19 pandemic in early 2020, the Bureau recommended and the Director approved a number of rule waivers to allow trauma centers to operate with as few non-essential regulatory barriers as possible.
Rule waivers benefited trauma centers in several ways:
• Due to decreased emergency department and in-patient volumes, many facilities furloughed both clinical and support staff, which negatively impacted some trauma centers’ ability to submit data to the Arizona Trauma Registry. The Bureau was able to accommodate hospitals while patient volumes normalized and staff were brought back into service. All hospitals are compliant with 2020 data reporting requirements.
• The Stay-Home-Stay Healthy campaign resulted in a dramatic decrease in motor vehicle related trauma and subsequent trauma center case volumes. Normally, a reduction in patient volume would have resulted in the Bureau requiring corrective action plans, however, the rule waiver made it possible for the facility to focus on other pressing clinical issues.
• Eighteen of Arizona’s designated trauma centers use the services of the American College of Surgeons (ACS) to perform the trauma program verification that is accepted by the Department in lieu of a state designation facility inspection. Early in the course of the pandemic, the ACS canceled all scheduled verification site visits, and implemented a one-year COVID-19 verification extension and postponement of site surveys. The rule waivers were intended to allow hospitals to focus resources on clinical and operational matters while ensuring trauma center designation status and funding remained intact.

Page 7
BUREAU OF EMS AND TRAUMA SYSTEM REPORT
As the pandemic continues to impact the health care system in 2021, the Bureau will remain focused on supporting Arizona’s trauma centers to ensure that the population has access to timely, high quality trauma care. There are many talented and dedicated professionals that contribute to Arizona's Trauma System in addition to the multi-disciplinary leadership of the State Trauma Advisory Board and Trauma and EMS Performance Improvement Committee. Going forward, it will be important to continue to engage the trauma and EMS community to further evaluate trends and outcomes to develop recommendations to improve the trauma system. It will be critical to consider risk factors and protective measures to reduce trauma burden, as well as best practices for trauma centers to maintain a constant state of readiness during pandemic response and recovery. Sincerely, ___________________________________ ___________________________________ Gail Bradley, MD FACEP FAEMS, Medical Director Rachel Zenuk Garcia, MPH, MCHES Bureau Chief

Page 8
EXECUTIVE SUMMARY
The 2021 Annual Report demonstrates how Arizona’s Trauma System has evolved significantly and responded to
trends and challenges during the beginning of the COVID-19 pandemic from January 1, 2020 to December 31, 2020. From 2010 to 2020, Arizona’s population grew by almost one million and now exceeds seven million residents. The Arizona Trauma System formally began in 2007 with seven state designated trauma centers. Over the last decade, Arizona’s Trauma System increased from nineteen trauma centers in 2010 to forty-seven trauma centers in 2020 reporting to the Arizona State Trauma Registry (ASTR), including a notable increase in the number of state designated level III and level IV trauma centers that have improved timely access to trauma care in rural areas.
Traumatic injury represents a tremendous and growing health concern in Arizona, as the rate of trauma incidents
continues to increase. In 2020, Arizona’s trauma centers treated 58,041 people (796 per 100,000 Arizona population). In the same year, the Arizona Hospital Discharge Database (HDD) showed 473,446 injury-related discharges in Arizona (6,490 per 100,000 Arizona population). In the last decade, trauma deaths increased nationally by 22.8%,1 and are the leading cause of years of potential life lost.1,2 According to the Centers for Disease Control and Prevention, from 2009 to 2018, Arizona’s age-adjusted injury mortality rate has increased from 70 to 83 per 100,000 (18.5% increase), while the national rate has increased from 56 to 70 per 100,000 (24% increase)2. At a glance, it appears that 2020 trauma mortality rates reported in ASTR are higher by severity score compared to 2010 mortality rates by severity score, although it is difficult to directly compare these years. While comparison between years has limitations and challenges due to changes in the number of trauma centers reporting over time, it is important to continue to track statewide injury rates reported through the Hospital Discharge Database (HDD) in addition to national data sources to determine the true burden of traumatic injury which poses a significant health and economic threat to the state.
Geographically, injury location is associated with trauma rates and access to care. A HDD review suggests that
injury rates are similar across all regions of the state, however ASTR data reports shows that traumatic injuries are highest in Arizona’s Northern region at nearly twice the injury rate of the Central region. It is important to note that trauma mortality rates are similar across all regions, however severity is reported significantly higher in the Northern region compared to other regions. In 2010, level IV trauma centers were shown to increase access to care (injury-to-ED arrival time) by ensuring that more patients statewide had access to a trauma center within the golden hour (<=1 hour of injury). Last year in 2020, the median injury-to-ED arrival time for patients with Injury Severity Score > 15 was 52 minutes, including 48 minutes for urban locations vs. 79 minutes for rural locations. More analysis and complete injury time data is needed in order to further examine injury-to-ED arrival time for patients transferred to a level I trauma center and how that may or may not impact trauma care and outcomes.
As Arizona’s population and number of trauma centers have increased over the last ten years, although it is
difficult to make direct comparisons due to reporting changes, it is noteworthy that there have been shifts in the top mechanisms of traumatic injuries reported in the Arizona State Trauma Registry (ASTR). In 2010, the predominant mechanism of injury was motor vehicle traffic (MVT) including 41% (11,487) of trauma cases reported, whereas in 2020 only 17% (9,891) of trauma cases were reportedly due to MVTs. Between 2013 and 2015, the predominant mechanism of injury reported to ASTR transitioned from MVT to Falls. In 2020, the top three mechanisms of trauma were Falls (47.63%), MVT-Occupant (17.04%), and Struck by/Against (6.17%), which comprised 72% of all traumas in Arizona. Despite a statewide decrease in population mobility and MVT that led to a reduction in the number of trauma incidents overall, trauma severity increased in 2020 compared to the previous year.
1. Rhee P, Joseph B, Pandit V, et al. Increasing Trauma Deaths in the United States. Ann Surg. 2014;00(00):1-9. doi:10.1097/SLA.0000000000000600. 2. Centers for Disease Control and Prevention, National Center for Injury Prevention and Control. Web-based Injury Statistics Query and Reporting System (WISQARS) [online].
(2005) [cited 2017 Sep.]. Available from URL: www.cdc.gov/injury/wisqars
Page 9
EXECUTIVE SUMMARY
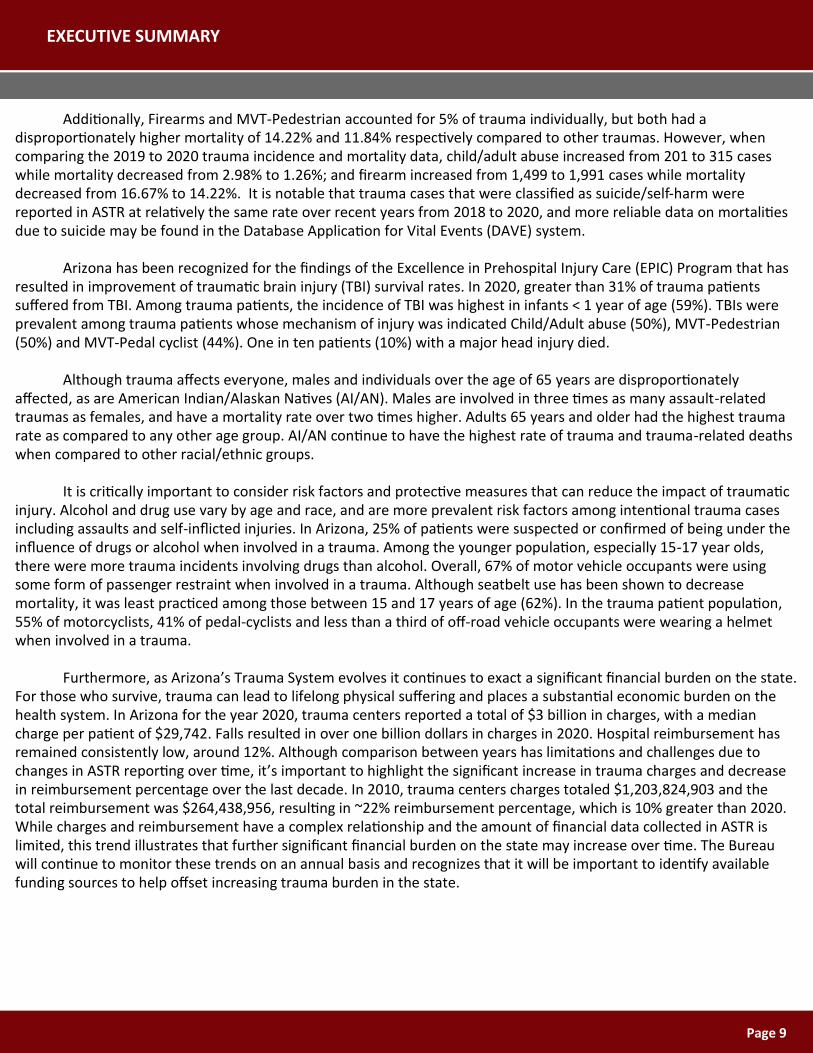
Additionally, Firearms and MVT-Pedestrian accounted for 5% of trauma individually, but both had a disproportionately higher mortality of 14.22% and 11.84% respectively compared to other traumas. However, when comparing the 2019 to 2020 trauma incidence and mortality data, child/adult abuse increased from 201 to 315 cases while mortality decreased from 2.98% to 1.26%; and firearm increased from 1,499 to 1,991 cases while mortality decreased from 16.67% to 14.22%. It is notable that trauma cases that were classified as suicide/self-harm were reported in ASTR at relatively the same rate over recent years from 2018 to 2020, and more reliable data on mortalities due to suicide may be found in the Database Application for Vital Events (DAVE) system.
Arizona has been recognized for the findings of the Excellence in Prehospital Injury Care (EPIC) Program that has
resulted in improvement of traumatic brain injury (TBI) survival rates. In 2020, greater than 31% of trauma patients suffered from TBI. Among trauma patients, the incidence of TBI was highest in infants < 1 year of age (59%). TBIs were prevalent among trauma patients whose mechanism of injury was indicated Child/Adult abuse (50%), MVT-Pedestrian (50%) and MVT-Pedal cyclist (44%). One in ten patients (10%) with a major head injury died.
Although trauma affects everyone, males and individuals over the age of 65 years are disproportionately affected, as are American Indian/Alaskan Natives (AI/AN). Males are involved in three times as many assault-related traumas as females, and have a mortality rate over two times higher. Adults 65 years and older had the highest trauma rate as compared to any other age group. AI/AN continue to have the highest rate of trauma and trauma-related deaths when compared to other racial/ethnic groups.
It is critically important to consider risk factors and protective measures that can reduce the impact of traumatic injury. Alcohol and drug use vary by age and race, and are more prevalent risk factors among intentional trauma cases including assaults and self-inflicted injuries. In Arizona, 25% of patients were suspected or confirmed of being under the influence of drugs or alcohol when involved in a trauma. Among the younger population, especially 15-17 year olds, there were more trauma incidents involving drugs than alcohol. Overall, 67% of motor vehicle occupants were using some form of passenger restraint when involved in a trauma. Although seatbelt use has been shown to decrease mortality, it was least practiced among those between 15 and 17 years of age (62%). In the trauma patient population, 55% of motorcyclists, 41% of pedal-cyclists and less than a third of off-road vehicle occupants were wearing a helmet when involved in a trauma.
Furthermore, as Arizona’s Trauma System evolves it continues to exact a significant financial burden on the state. For those who survive, trauma can lead to lifelong physical suffering and places a substantial economic burden on the health system. In Arizona for the year 2020, trauma centers reported a total of $3 billion in charges, with a median charge per patient of $29,742. Falls resulted in over one billion dollars in charges in 2020. Hospital reimbursement has remained consistently low, around 12%. Although comparison between years has limitations and challenges due to changes in ASTR reporting over time, it’s important to highlight the significant increase in trauma charges and decrease in reimbursement percentage over the last decade. In 2010, trauma centers charges totaled $1,203,824,903 and the total reimbursement was $264,438,956, resulting in ~22% reimbursement percentage, which is 10% greater than 2020. While charges and reimbursement have a complex relationship and the amount of financial data collected in ASTR is limited, this trend illustrates that further significant financial burden on the state may increase over time. The Bureau will continue to monitor these trends on an annual basis and recognizes that it will be important to identify available funding sources to help offset increasing trauma burden in the state.

Page 10
BACKGROUND
BACKGROUND & METHODS
This report analyzed incidents of traumatic injury reported to the ASTR with an Emergency Department Hospital Arrival Date between January 1, 2020 and December 31, 2020. The report gives an overview of trauma in the state by describing patient demographics, injury characteristics, trauma risk factors, regional differences and comparisons with national trauma data.
Descriptive statistics were used to depict the distribution of traumatic injury in Arizona as well as differences over time. When appropriate, rates and 95% confidence intervals (CIs) were calculated per 100,000 Arizona residents using 2020 population denominators from the Arizona Health Status and Vital Statistics database.4 If the CIs of two rates do not overlap, the difference between the rates is considered statistically significant (alpha 0.05). The 2020 data was compared with the 2018 and 2019 two-year median. The Vital Statistics Information Management System‘s Database Applications for Vital Events (DAVE) was used in order to show the complete picture of trauma mortality, including deaths that occurred outside of designated trauma centers.
Note: The 2018 National Trauma Data Bank (NTDB) Annual Report had not been released at the time this report was created; therefore, the section comparing ASTR to NTDB was removed.
METHODS
The Bureau of Emergency Medical Services and Trauma System (BEMSTS) is responsible for collecting, analyzing and reporting on data obtained from designated trauma centers and participating EMS agencies to enhance the EMS and Trauma System in Arizona. In 2020, there were 48 hospitals submitting data to the Arizona State Trauma Registry (ASTR) including thirteen (13) Level I trauma centers, seven (7) Level III trauma centers, twenty-seven (27) Level IV trauma centers, and one (1) Level 1 Pediatric trauma center. Appendix A contains a list of trauma centers reporting to ASTR as of 12/30/2020.
All trauma centers are required to report any injuries meeting the ASTR inclusion criteria (Appendix B). Level I , II and III trauma centers are required to submit the full ASTR data set while Level IV trauma centers and non-designated facilities have the option to submit either the full or reduced data set. The data in the ASTR is validated to meet more than 800 state and national rules. Validation is run at both the hospital and state levels. Any inconsistencies are flagged and returned to the hospitals for review or correction before the data is accepted.
All the Level I trauma centers in Arizona are located in urban areas of the state, including 10 in Maricopa County, one in Coconino County and one in Pima County. Due to Arizona’s unique geography, the BEMSTS has divided the system into four distinct regions based on Arizona’s 15 counties: Western (Mohave, La Paz and Yuma Counties), Northern (Yavapai, Coconino, Navajo and Apache Counties), Southeastern (Pima, Santa Cruz, Graham, Cochise and Greenlee Counties) and Central (Maricopa, Gila and Pinal Counties). Each region has its own community-based, non-profit organization dedicated to improving EMS and trauma care in the state.
Regional EMS Coordinating Systems
• Arizona Emergency Medical Services, Inc. (AEMS) - https://www.aems.org/ • Northern Arizona Emergency Medical Services (NAEMS) - http://www.naems.org/ • Southeastern Arizona EMS Council (SAEMS) - http://saemscouncil.com/ • Western Arizona Council of EMS (WACEMS) - https://wacems.org/
4. Arizona Department of Health Services, Population Health and Vital Statistics. Population Denominators: 2020. http://pub.azdhs.gov/health-stats/menu/info/pop/index.php

Page 11
MAP OF ARIZONA DESIGNATED TRAUMA CENTERS

Page 12
LIST OF TABLES & FIGURES
Trauma Demographics ....................................................................................................................................................... 15
Figure 1/ Table 1: Trauma incidence and rate per 100,000 by year ............................................................................................. 15
Figure 2/ Table 2: Age and gender-specific trauma rate per 100,000 .......................................................................................... 15
Figure 3/ Table 3: Race-specific trauma rate per 100,000 ............................................................................................................ 15
Mechanism of Injury ..................................................................................................................................................... 16-18
Table 4: Trauma incidence and mortality proportion by mechanism of injury............................................................................. 16
Table 5: Trauma incidence and mortality proportion by mechanism of injury among severely injured patients (ISS>15) .......... 17
Figure 4/ Table 6: Trauma rate per 100,000 by top six mechanisms and year ............................................................................. 18
Figure 5: Gender-specific trauma proportion by top six mechanisms .......................................................................................... 18
Intent of Injury ............................................................................................................................................................. 19-20
Table 7: Trauma incidence and mortality proportion by intent of injury ..................................................................................... 19
Figure 6/ Table 8: Trauma rate per 100,000 by intent and year ................................................................................................... 19
Figure 7: Gender-specific trauma proportion by intent ................................................................................................................ 19
Figure 8: Top six mechanisms of unintentional trauma ................................................................................................................ 20
Figure 9: Top six mechanisms of homicide/assault trauma .......................................................................................................... 20
Figure 10: Top six mechanisms of suicide/self-inflicted trauma ................................................................................................... 20
Injury Severity Score .......................................................................................................................................................... 20
Figure 11: Trauma proportion by Injury Severity Score ................................................................................................................ 20
Table 9: Trauma incidence and mortality proportion by Injury Severity Score ............................................................................ 20
Trauma Mortality ......................................................................................................................................................... 21-22
Table 10: Age-specific trauma incidence and mortality proportion.............................................................................................. 21
Figure 12/ Table 11: Age-specific trauma mortality rate per 100,000 .......................................................................................... 21
Figure 13/ Table 12: Gender-specific trauma mortality rate per 100,000 .................................................................................... 22
Figure 14/ Table 13: Race-specific trauma mortality rate per 100,000 ........................................................................................ 22
Figure 15/ Table 14: Age-adjusted trauma mortality rate per 100,000 by year: Trauma center vs. Statewide ........................... 22
Trauma Charges ............................................................................................................................................................ 23-24
Table 15: Total trauma charges and reimbursement by year ....................................................................................................... 23
Figure 16: Primary payment source of traumatic injury by year ................................................................................................... 23
Table 16: Total trauma charges and reimbursement by primary payer ....................................................................................... 23
Table 17: Total trauma charges and reimbursement by mechanism of injury ............................................................................. 24
Drugs & Alcohol ................................................................................................................................................................. 25
Figure 17: Age-specific trauma proportion by drug and alcohol use ............................................................................................ 25
Figure 18: Race-specific trauma proportion by drug and alcohol use .......................................................................................... 25
Figure 19: Intent-specific trauma proportion by drug and alcohol use ........................................................................................ 25
Figure 20: Mechanism-specific trauma proportion by drug and alcohol use ............................................................................... 25
Protective Devices ............................................................................................................................................................. 26
Figure 21: Age-specific proportion of restraint use among motor vehicle traffic occupants ....................................................... 26
Figure 22: Age-specific proportion of helmet use among pedal-cyclists ...................................................................................... 26
Figure 23: Age-specific proportion of helmet use among motorcyclists ...................................................................................... 26
Figure 24: Age-specific proportion of helmet use among off-road vehicle occupants ................................................................. 26

Page 13
LIST OF TABLES & FIGURES
Access to Care ................................................................................................................................................................... 27
Table 18: Injury to ED arrival time for patient with an Injury Severity Score > 15 by injury location ........................................... 27
Table 19: Injury to ED arrival time for transferred patients with an Injury Severity Score > 15 by injury location ...................... 27
Figure 25: Mode of transport to trauma center by Injury Severity Score ..................................................................................... 27
Injury Region ................................................................................................................................................................ 28-30
Figure 26a/ Table 20: Region-specific trauma rate per 100,000 ................................................................................................... 28
Figure 26b/ Table 20: Region-specific severe (ISS>15) trauma rate per 100,000 ......................................................................... 28
Figure 27/ Table 21: Region-specific trauma mortality rate per 100,000 ..................................................................................... 28
Figure 28: Region-specific trauma proportion by Injury Severity Score ........................................................................................ 28
Figure 29/ Table 22: Region-specific trauma rate per 100,000 by the top six mechanisms of injury ........................................... 29
Figure 30/ Table 23: Region-specific trauma rate per 100,000 by intent of injury ....................................................................... 30
Trauma Center Designation ................................................................................................................................................ 31
Table 24: Trauma incidence and mortality proportion by trauma center designation ................................................................ 31
Figure 31: Injury Severity Score by trauma center designation .................................................................................................... 31
Table 25: Trauma charges and reimbursement by trauma center designation………………………………………………………………………..31
Traumatic Brain Injury .................................................................................................................................................. 32-33
Table 26: Traumatic Brain Injury incidence and mortality proportion by age and brain injury severity ...................................... 32
Figure 32: Proportion of Traumatic Brain Injury by mechanism ................................................................................................... 32
Table 27: Traumatic Brain Injury incidence and mortality proportion by age and Glasgow Coma Score .................................... 33
Rehab ................................................................................................................................................................................ 34
Table 28: Discharged to rehab by primary payer and Injury Severity Score ................................................................................. 34
Table 29: Discharge to rehab by region of injury .......................................................................................................................... 34
Epicurve …………………………………………………………………………………………………………………………………………………………………………...35
Comparison of Trauma and COVID-19 Incidents……………………………………………………………………………………………………………………..35
Appendix A. List of trauma centers by level of designation ............................................................................................. 36-37
Appendix B. Arizona State Trauma Registry inclusion criteria ......................................................................................... 38-39

Page 14

Page 15
INCIDENCE & RATE
AGE & GENDER
Table 1: Trauma incidence and rate per 100,000 by year
TRAUMA DEMOGRAPHICS (N = 58,041)
Table 2: Age and gender-specific trauma rate per 100,000
CI = Confidence interval
CI = Confidence interval
Year Total Trauma cases Rate per 100,000 (95%CI)
2010 26,688 418 [413, 423]
2011 28,721 446 [441, 451]
2012 31,246 481 [475, 486]
2013 34,275 521 [515, 526]
2014 39,373 591 [585, 596]
2015 42,351 627 [621, 633]
2016 46,842 685 [679, 691]
2017 51,666 742 [735, 748]
2018 54,273 767 [761, 773]
2019 58,604 815 [809, 822]
2020 58,041 796 [789, 802]
Gender Age Total Trauma Cases Rate per 100,000 (95%CI)
Female Total 24,569 670 [661, 678]
<15 1,827 273 [261, 286]
15-19 1,049 448 [421, 476]
20-44 5,081 436 [424, 448]
45-64 4,253 477 [463, 492]
65+ 12,359 1,742 [1,711, 1,773]
Male Total 33,468 923 [913, 933]
<15 2,761 397 [382, 412]
15-19 2,039 832 [796, 868]
20-44 11,611 940 [923, 957]
45-64 7,230 856 [836, 876]
65+ 9,827 1,623 [1,591, 1,655]
RACE & ETHNICITY
Table 3: Race-specific trauma rate per 100,000
CI= Confidence interval, PI=Pacific Islander, AI/AN=American Indian/Alaska
Race/ethnicity Total Trauma Cases Rate per 100,000 (95%CI)
AA/Black 2,561 701 [674, 728]
AI/AN 4,146 1,372 [1,330, 1,414]
Asian/PI 630 222 [205, 240]
Hispanic 10,583 455 [447, 464]
White 38,753 964 [955, 974]
Data source: Arizona State Trauma Registry 2010-2020
Figure 1: Trauma rate per 100,000 by year
2010 2011 2012 2013 2014 2015 2016 2017 2018 2019 20200
200
400
600
800
Ra
te p
er
10
0,0
00
Data source: Arizona State Trauma Registry 2018-2020 PI=Pacific Islander,AI/AN=American Indian/Alaska Native, AA=African American
Figure 3: Race-specific trauma rate per 100,000
0
250
500
750
1,000
1,250
1,500
Ra
te p
er
10
0,0
00
Asian/PI AA/Black AI/AN Hispanic White
Median 2018-2019
2020
Data source: Arizona State Trauma Registry 2018-2020
Figure 2: Age and gender-specific trauma rate per 100,000
Median 2018-20192020
<1515-19
20-44
45-64
65+<15
15-19
20-44
45-64
65+
0
500
1,000
1,500
Ra
te p
er
10
0,0
00
MaleFemale

Page 16
INCIDENCE & MORTALITY
Table 4: Trauma incidence and mortality proportion by mechanism of injury
MECHANISM OF INJURY
Mechanism Count Percent Deaths Mortality Proportion
Overall 58,041 100.00% 1,442 2.48%
Fall 27,649 47.63% 529 1.91%
MVT-Occupant 9,891 17.04% 202 2.04%
Struck By/Against 3,584 6.17% 15 0.41%
MV Non-Traffic 2,608 4.49% 25 0.95%
Cut/Pierce 2,127 3.66% 26 1.22%
Firearm 1,991 3.43% 283 14.22%
MVT-Motorcyclist 1,926 3.31% 90 4.67%
Pedalcyclist,Other 1,233 2.12% 3 0.24%
MVT-Pedestrian 1,038 1.78% 123 11.84%
Other Land Transport 924 1.59% 7 0.75%
Other Specified,Classifiable 806 1.38% 8 0.99%
Not Documented 521 0.89% 6 1.19%
Bite And Stings-Nonvenomous 509 0.87% 3 0.58%
MVT-Pedalcyclist 457 0.78% 19 4.15%
Pedestrian,Other 397 0.68% 17 4.29%
Unspecified 326 0.56% 12 3.68%
Other Specified,Not Elsewhere Classifiable 319 0.54% 27 8.46%
Other Specified,Child/Adult Abuse 315 0.54% 4 1.26%
Other Transport 296 0.50% 7 2.36%
Machinery 267 0.46% 0 0.00%
Natural/Environmental, Other 251 0.43% 3 1.19%
Overexertion 183 0.31% 0 0.00%
Hot Object/Substance 171 0.29% 0 0.00%
Fire/Flame 103 0.17% 3 2.91%
Suffocation 74 0.12% 21 28.37%
Drowning/Submersion 32 0.05% 8 25.00%
MVT-Other 14 0.02% 0 0.00%
Bite And Stings-Venomous 12 0.02% 0 0.00%
Poisoning:Non-Drug 8 0.01% 1 12.50%
Other Specified,Foreign Body 5 0.00% 0 0.00%
MVT-Unspecified 2 0.00% 0 0.00%
Poisoning:Drug 2 0.00% 0 0.00%
Mechanisms of Injury are classified into various categories based on the tool provided by the Centers for Disease Control and
Prevention categorizing injuries using ICD 10 codes . https://www.cdc.gov/nchs/injury/injury_tools.htm . MVT = Motor Vehicle
Traffic

Page 17
INCIDENCE & MORTALITY: INJURY SEVERITY SCORE (ISS) > 15
Table 5: Trauma incidence and mortality proportion by mechanism of injury among severely injured patients (ISS>15)
MECHANISM OF INJURY
Mechanism Count Percent Deaths Mortality Proportion
Overall 6,017 100.00% 805 13.38%
Fall 2,743 45.58% 224 8.17%
MVT-Occupant 1,106 18.38% 136 12.29%
MVT-Motorcyclist 342 5.68% 68 19.88%
Firearm 310 5.15% 164 52.90%
MVT-Pedestrian 285 4.73% 88 30.87%
Struck By/Against 257 4.27% 11 4.28%
MV Non-Traffic 212 3.52% 18 8.49%
Pedalcyclist,Other 116 1.92% 2 1.72%
MVT-Pedalcyclist 99 1.64% 16 16.16%
Other Land Transport 88 1.46% 7 7.95%
Other Specified,Child/Adult Abuse 85 1.41% 4 4.70%
Cut/Pierce 58 0.96% 10 17.24%
Unspecified 55 0.91% 7 12.72%
Pedestrian,Other 54 0.89% 11 20.37%
Other Specified,Not Elsewhere Classifiable 52 0.86% 15 28.84%
Other Specified,Classifiable 48 0.79% 5 10.41%
Not Documented 31 0.51% 1 3.33%
Other Transport 30 0.49% 3 10.00%
Natural/Environmental, Other 16 0.26% 2 12.50%
Suffocation 13 0.21% 6 46.15%
Fire/Flame 5 0.08% 2 40.00%
Drowning/Submersion 4 0.06% 3 75.00%
Overexertion 4 0.06% 0 0.00%
Bite And Stings-Nonvenomous 2 0.03% 1 50.00%
Hot Object/Substance 1 0.01% 0 0.00%
Poisoning:Non-Drug 1 0.01% 1 100.00%

Page 18
RATE BY YEAR
Table 6: Trauma rate per 100,000 by top 6 mechanisms and year
MECHANISM OF INJURY
Year Mechanism of
injury Total Trauma
Cases Rate per 100,000
(95%CI)
2018 Fall 23,492 332 [328, 336]
MVT-Occupant 11,793 167 [164, 170]
Struck By/Against 3,757 53 [51, 55]
Cut/Pierce 1,951 28 [26, 29]
MV Non-Traffic 1,510 21 [20, 22]
Firearm 1,367 19 [18, 20]
2019 Fall 26,386 367 [363, 371]
MVT-Occupant 11,653 162 [159, 165]
Struck By/Against 4,066 57 [55, 58]
MV Non-Traffic 2,285 32 [30, 33]
Cut/Pierce 2,066 29 [27, 30]
Firearm 1,499 21 [20, 22]
2020 Fall 27,649 379 [375, 384]
MVT-Occupant 9,891 136 [133, 138]
Struck By/Against 3,584 49 [48, 51]
MV Non-Traffic 2,608 36 [34, 37]
Cut/Pierce 2,127 29 [28, 30]
Firearm 1,991 27 [26, 28]
GENDER
Data source: Arizona State Trauma Registry 2020
Figure 5: Gender-specific trauma proportion by top 6mechanisms of injury
59%
18%
3% 1% 1% 3%
39%
15%
7% 5% 5% 5%
Fall
MV
T-O
ccupant
Str
uck
By/A
gain
st
Cut/Pie
rce
Firearm
MV
Non-T
raff
ic
Fall
MV
T-O
ccupant
Str
uck
By/A
gain
st
Cut/Pie
rce
Firearm
MV
Non-T
raff
ic
0%
20%
40%
60%
Pe
rce
nt
FemaleMale
Data source: Arizona State Trauma Registry 2018-2020
Figure 4: Trauma rate per 100,000 by top 6 mechanisms ofinjury
FallMVT-O
ccupant
Struck By/Against
Cut/Pierce
MV Non-Traff ic
Firearm
0
100
200
300
400
Ra
te
202020192018

Page 19
INCIDENCE & MORTALITY
Table 7: Trauma incidence and mortality proportion by intent of injury
INTENT* OF INJURY
INTENT RATE BY YEAR
Intent Count Percent Deaths Mortality Proportion
Overall 58,041 100.00% 1,442 2.48%
Unintentional 51,227 88.26% 1,069 2.08%
Assault 5,037 8.67% 189 3.75%
Self-harm 740 1.27% 127 17.16%
Not documented 521 0.89% 6 1.15%
Undetermined 398 0.68% 37 9.29%
Legal/war 118 0.20% 14 11.86%
Year Intent of injury Total Trauma
Cases Rate per 100,000
(95%CI)
2018 Unintentional 46,498 657 [651, 663]
Assault 4,663 66 [64, 68]
Self-harm 749 11 [10, 11]
Legal Intervention 144 2 [2, 2]
2019 Unintentional 51,628 718 [712, 724]
Assault 5,004 70 [68, 72]
Self-harm 744 10 [10, 11]
Legal Intervention 134 2 [2, 2]
2020 Unintentional 51,227 702 [696, 708]
Assault 5,037 69 [67, 71]
Self-harm 740 10 [9, 11]
Legal Intervention 118 2 [1, 2]
Table 8: Trauma rate per 100,000 by intent and year
INTENT RATE BY GENDER
CI= Confidence Interval
*Intent of Injury: Whether an injury was caused by an act carried out on
purpose by oneself (Self-Harm) or by another person(s) (Assault), with the goal
of injuring or killing; the injury was not inflicted by deliberate means
(Unintentional) or; the injury was inflicted by the police or other legal
authorities during law enforcement activities (Legal/War).
Centers for Disease Control and Prevention. Definitions for WISQARS Nonfatal.
https://www.cdc.gov/ncipc/wisqars/nonfatal/definitions.htm#nonfatalnjury Data source: Arizona State Trauma Registry 2020
Figure 7: Gender-specific trauma proportion by intent
0%0%1%
11%
84%
0%0%0%4%
93%
Unin
tentio
nal
Assault
Self-h
arm
Legal I
nte
rventio
n
Undete
rmin
ed
Unin
tentio
nal
Assault
Self-h
arm
Legal I
nte
rventio
n
Undete
rmin
ed
0%
20%
40%
60%
80%
Pe
rce
nt
MaleFemale
Data source: Arizona State Trauma Registry 2018-2020
Figure 6: Trauma rate per 100,000 by intent of injury andyear
Unintentional Assault Self-harm
Intervention
Legal0
200
400
600
Ra
te
202020192018

Page 20
INTENT BY MECHANISM
INTENT OF INJURY
INJURY SEVERITY SCORE
INCIDENCE & MORTALITY
Injury Severity
Score Count Percent Deaths
Mortality
Proportion
1-8 37,744 65.02% 307 0.81%
9-15 12,470 21.48% 290 2.32%
16-24 4,564 7.86% 228 4.99%
25-75 1,453 2.50% 577 39.71%
Missing/NA/ND 1,810 3.11% 40 2.20%
Table 9: Trauma incidence and mortality proportion by injury severity score
Data source: Arizona State Trauma Registry 2020
Figure 8: Top six mechanisms of Unintentional trauma
FallMVT-O
ccupant
MV Non-Traff ic
MVT-M
otorcyclist
Pedalcyclist,Other
Struck By/Against
0%
10%
20%
30%
40%
50%
Pe
rce
nt
Data source: Arizona State Trauma Registry 2020
Figure 9: Top six mechanisms of Assault trauma
Struck By/Against
Firearm
Cut/Pierce
Child/Adult A
buse
Unspecif ied
Other, Classif iable
0%
10%
20%
30%
40%
Pe
rce
nt
Data source: Arizona State Trauma Registry 2020
Figure 10: Top six mechanisms of Self-harm trauma
Cut/Pierce
Firearm
Not Classif iable
Suffocation
FallStruck By/A
gainst
0%
10%
20%
30%
40%
Pe
rce
nt
Data source: Arizona State Trauma Registry 2020
Figure 11: Trauma proportion by injury severity score
1-89-15
16-24
25-75
Missing/NA
/ND
0%
20%
40%
60%
Pe
rce
nt

Page 21
AGE-SPECIFIC MORTALITY
TRAUMA MORTALITY
Table 10: Age-specific trauma incidence and mortality proportion
Age Trauma Count Trauma Percent Trauma
Deaths Trauma Mortality Proportion
Percent of Arizona
Population (n=7,294,587)*
Total 58,041 100.00% 1,442 2.48% 100.00%
<1 499 0.85% 3 0.60% 1.13%
1-4 1,251 2.15% 11 0.88% 4.78%
5-9 1,253 2.15% 7 0.55% 6.23%
10-14 1,584 2.72% 13 0.82% 6.55%
15-19 3,088 5.32% 61 1.97% 6.57%
20-24 3,801 6.54% 101 2.65% 6.81%
25-34 7,344 12.65% 181 2.46% 13.82%
35-44 5,537 9.53% 144 2.60% 12.29%
45-54 5,036 8.67% 130 2.58% 11.69%
55-64 6,447 11.10% 208 3.23% 12.10%
65-74 7,760 13.36% 184 2.37% 10.35%
75-84 8,340 14.36% 220 2.64% 5.67%
85+ 6,088 10.48% 170 2.80% 2.01%
AGE-SPECIFIC MORTALITY RATE
Age Total Trauma Deaths Rate per 100,000 (95%CI)
<15 35 3 [2, 3]
15-19 61 13 [10, 16]
20-44 433 18 [16, 20]
45-64 339 20 [17, 22]
65+ 574 44 [40, 47]
Overall 1,442 20 [19, 21]
Table 11: Age-specific trauma mortality rate
CI= Confidence interval
* Source: Arizona Department of Health Services, Population Health and Vital Statistics. Population Denominators: 2019. http://pub.azdhs.gov/health-stats/
menu/info/pop/index.php
Data source: Arizona State Trauma Registry 2018-2020
Figure 12: Age-specific trauma mortality rate per 100,000
0
10
20
30
40
Mo
rta
lity
ra
te p
er
10
0,0
00
<15 15-19 20-44 45-64 65+ Overall
Median 2018-2019
2020

Page 22
GENDER-SPECIFIC MORTALITY RATE
TRAUMA MORTALITY
Table 12: Gender-specific trauma mortality rate per 100,000
ASTR VS. STATEWIDE
Table 14: Age-adjusted trauma mortality rate per 100,000 by year: Trauma Center vs. Statewide*
CI= Confidence interval
Gender Total trauma deaths Rate per 100,000 (95%CI)
Female 412 11 [10, 12]
Male 1,029 28 [27, 30]
CI= Confidence interval
RACE-SPECIFIC MORTALITY RATE
Race/ethnicity Total trauma deaths Rate per 100,000 (95%CI)
AA/Black 85 23 [18, 28]
AI/AN 89 29 [23, 36]
Asian/PI 11 4 [2, 6]
Hispanic 229 10 [9, 11]
White 950 24 [22, 25]
CI= Confidence interval
Table 13: Race-specific trauma mortality rate per 100,000
Data source Year Total Trauma
Deaths Rate per 100,000
(95%CI)
ASTR 2018 1,227 16.1 [15.2, 17.0]
2019 1,335 17.1 [16.2, 18.0]
2020 1,442 17.9 [17.0, 18.8]
DAVE 2018 3,723 48.2 [46.7, 49.8]
2019 3,708 47.1 [45.6, 48.7]
2020 3,952 49.7 [48.1, 51.2]
CI= Confidence interval
*Statewide data obtained from the Database Application for Vital Events (DAVE). Includes all trauma deaths including those that occurred outside of trauma centers.
Data source: Arizona State Trauma Registry 2020
Figure 13: Gender-specific trauma mortality rate per100,000
Female Male0
5
10
15
20
25
Mo
rta
lity
ra
te p
er
10
0,0
00
Data source: Arizona State Trauma Registry 2018-2020 PI=PacificIslander, AI/AN=American Indian/Alaska Native, AA=AfricanAmerican
Figure 14: Race-specific trauma mortality rate per 100,000
AA/Black AI/AN Asian/PI Hispanic White0
5
10
15
20
25
30
Mo
rta
lity
ra
te p
er
10
0,0
00
Data sources: Arizona State Trauma Registry 2018-2020 DatabaseApplication for Vital Events, 2018-2020
Figure 15: Age-adjusted trauma mortality rate per 100,000:Trauma center deaths vs. Statewide trauma deaths
16.1 17.1 17.9
48.2 47.149.7
ASTR DAVE0
10
20
30
40
50
Mo
rta
lity
ra
te p
er
10
0,0
00
202020192018

Page 23
CHARGES & REIMBURSEMENT
TRAUMA CHARGES
Table 16: Total trauma charges and reimbursement by primary payer
Primary payer Total Charges Median Charges Total Reimbursement Reimbursement Percent
AHCCCS/Govt $1,002,280,781 $29,161 $77,460,047 7.7%
Medicare $984,995,019 $32,025 $109,349,910 11.1%
Private $842,666,529 $30,266 $150,511,256 17.8%
Self pay $144,470,579 $24,434 $6,135,675 4.2%
Workers Comp $58,095,080 $29,056 $13,063,656 22.4%
Other $22,895,918 $20,368 $3,640,925 15.9%
Not documented $5,366,175 $19,355 $360,657 6.7%
Total $3,060,770,081 $29,742 $360,522,125 11.7%
Year Total Charges Median Charges Total Reimbursement Reimbursement Percent
2018 $2,611,324,694 $28,068 $375,754,016 14.3%
2019 $3,031,698,529 $28,931 $404,109,995 13.3%
2020 $3,060,770,081 $29,742 $360,522,125 11.7%
PRIMARY PAYER BY YEAR
Table 15: Total trauma charges and reimbursement by year
CHARGES & REIMBURSEMENT BY PAYER
Data source: Arizona State Trauma Registry 2018-2020 Other includes: No fault auto,Not bil led, and Other insurance
Figure 16: Primary payment source of traumatic injuries by year
30%30%30% 30%30%
33%
27%27%26%
6% 6% 6%
2%1% 0% 1% 1% 1%
AHCCCS/G
ovt
Medicare
Private
Self pay
Other
Workers Com
p
0%
10%
20%
30%
202020192018

Page 24
Mechanism Total Charges Median Charges Total
Reimbursement Reimbursement
Percent
Bite And Stings-Nonvenomous $16,154,577 $20,589 $2,182,775 13.5%
Bite And Stings-Venomous $460,445 $45,081 $29,244 6.3%
Cut/Pierce $86,752,011 $29,107 $9,875,324 11.3%
Drowning/Submersion $1,230,238 $24,083 $144,167 11.7%
Fall $1,338,949,338 $30,361 $163,932,003 12.2%
Fire/Flame $3,831,894 $16,199 $999,261 26.0%
Firearm $168,682,990 $35,686 $18,987,611 11.2%
Hot Object/Substance $2,707,673 $4,936 $265,288 9.7%
MV Non-Traffic $144,230,952 $25,717 $17,648,067 12.2%
MVT-Motorcyclist $178,828,513 $42,744 $19,658,974 10.9%
MVT-Occupant $576,179,532 $30,641 $60,582,315 10.5%
MVT-Other $665,107 $32,217 $83,040 12.4%
MVT-Pedalcyclist $32,109,227 $39,461 $4,327,903 13.4%
MVT-Pedestrian $122,404,942 $50,941 $11,153,367 9.1%
MVT-Unspecified $55,005 $27,503 $12,077 21.9%
Machinery $11,557,016 $27,814 $1,690,105 14.6%
Natural/Environmental, Other $11,181,153 $19,898 $1,524,050 13.6%
Not Documented $12,200,239 $17,644 $1,590,522 13.0%
Other Land Transport $39,966,828 $23,468 $6,461,865 16.1%
Other Specified,Child/Adult Abuse $16,812,749 $25,455 $2,081,594 12.3%
Other Specified,Classifiable $35,117,179 $24,725 $5,618,105 15.9%
Other Specified,Foreign Body $116,429 $5,191 $5,102 4.3%
Other Specified,Not Elsewhere Classifiable $21,246,891 $37,095 $1,837,647 8.6%
Other Transport $17,415,487 $30,883 $1,603,818 9.2%
Overexertion $7,361,515 $31,607 $1,336,160 18.1%
Pedalcyclist,Other $52,161,296 $27,772 $8,304,777 15.9%
Pedestrian,Other $21,238,132 $26,592 $2,701,116 12.7%
Poisoning:Drug $35,756 $17,878 $7,168 20.0%
Poisoning:Non-Drug $396,036 $17,632 $193,870 48.9%
Struck By/Against $121,835,802 $20,591 $13,859,129 11.3%
Suffocation $3,863,039 $31,777 $394,124 10.2%
Unspecified $15,022,088 $25,738 $1,431,558 9.5%
Total $3,060,770,081 $29,742 $360,522,125 11.7%
CHARGES & REIMBURSEMENT BY MECHANISM
TRAUMA CHARGES
Table 17: Total trauma charges and reimbursement by mechanism of injury

Page 25
AGE-SPECIFIC
DRUGS & ALCOHOL (SUSPECTED OR CONFIRMED USE) (N = 14,209, 25%)
RACE-SPECIFIC
INTENT-SPECIFIC MECHANISM-SPECIFIC
Data source: Arizona State Trauma Registry 2020
Figure 17: Age-specific trauma proportion by alcohol anddrug use
0% 0%
2%
0%
17%
6%
25%
19%
28%26%
18%19%
4%6%
<10 10-14 15-17 18-24 25-44 45-64 65+0%
5%
10%
15%
20%
25%
Pe
rce
nt
AlcoholDrug
Data source: Arizona State Trauma Registry 2020, PI=Pacific Islander,AI/AN=American Indian/Alaska Native, AA=African American
Figure 18: Race-specific trauma proportion by alcohol anddrug use
15%12% 12%
11%
22%
45%
26%
15%
8% 8%
Hispanic White AI/AN AA/Black Asian/PI0%
10%
20%
30%
40%
Pe
rce
nt
AlcoholDrug
Data source: Arizona State Trauma Registry 2020
Figure 19: Intent-specific trauma proportion by alcohol anddrug use
12% 11%
34%35%
41%
34% 34%
20%
Unintentional Assault Self-harm
Intervention
Legal0%
10%
20%
30%
40%
Pe
rce
nt
AlcoholDrug
Data source: Arizona State Trauma Registry 2020
Figure 20: Mechanism-specific trauma proportion byalcohol and drug use
7%9%
19%
15%
22%
29%31%
27%
36%
21%
FallMVT-O
ccupant
Struck By/Against
Cut/Pierce
Firearm
0%
10%
20%
30%
Pe
rce
nt
AlcoholDrug

Page 26
MVT-OCCUPANT (N = 9,891)
PROTECTIVE DEVICES
PEDAL CYCLIST (N = 1,690)
MOTORCYCLIST (N = 1,926) OFF-ROAD VEHICLE OCCUPANT (N = 2,285)
* An age category may be missing in a graph if there are
no cases available in that category.
Data source: Arizona State Trauma Registry 2020
Figure 21: Age-specific proportion of restraint use amongMotor Vehicle Traffic occupants
74
6057
62 63 63
7477
0
20
40
60
80
100
Pe
rce
nt
<5 5-8 9-14 15-17 18-24 25-44 45-64 65+
Overall
Age specific
Data source: Arizona State Trauma Registry 2020
Figure 22: Age-specific proportion of helmet use amongpedal-cyclists
19
33
24 2528
34
45
56
0
20
40
60
80
100
Pe
rce
nt
<5 5-8 9-14 15-17 18-24 25-44 45-64 65+
Overall
Age specific
Data source: Arizona State Trauma Registry 2020
Figure 23: Age-specific proportion of helmet use amongMotorcyclists
100
58 56
72
55
43
54
0
20
40
60
80
100
Pe
rce
nt
5-8 9-14 15-17 18-24 25-44 45-64 65+
Overall
Age specific
Data source: Arizona State Trauma Registry 2020
Figure 24: Age-specific proportion of helmet use amongoff-road vehicle occupants
17
38 4037
3229
32
11
0
20
40
60
80
100
Pe
rce
nt
<5 5-8 9-14 15-17 18-24 25-44 45-64 65+
Overall
Age specific

Page 27
INJURY TO ED ARRIVAL TIME
ACCESS TO CARE
Injury location
ISS>15: Injury to ED Arrival Time (Minutes)
N Median time 25th percentile* 75th percentile** Injury time missing (n)
Rural 609 79 47 129 220
Urban 2,183 48 35 73 1,364
Statewide 2,792 52 36 87 1,584
Table 18: Injury to ED arrival time for patient with an injury severity score > 15 by injury location
Injury location
ISS>15 and transferred to Level 1: Injury to Final ED Arrival Time (Minutes)
N Median time 25th percentile* 75th percentile** Injury time
missing (n)
Rural 284 345 257 530 144
Urban 478 337 249 576 506
Statewide 762 339 253 562 650
Table 19: Injury to ED arrival time for transferred patients with an injury severity score > 15 by injury location
MODE OF TRANSPORT
*25% of the cohort had a median transport time at or below this value
** 75% of the cohort had a median transport time at or below this value
*25% of the cohort had a median transport time at or below this value
** 75% of the cohort had a median transport time at or below this value
POV - Privately owned vehicle
Data source: Arizona State Trauma Registry 2020
Figure 25: Mode of transport to trauma center by InjurySeverity Score
3%
67%
29%
7%
78%
14% 14%
73%
12%
20%
77%
2%
1-8 9-15 16-24 25-750%
20%
40%
60%
80%
Pe
rce
nt
POVGroundAir

Page 28
TRAUMA RATE
INJURY REGION
Table 20: Region-specific trauma rate per 100,000
MORTALITY RATE
Injury Region
All Trauma Patients Severe Trauma Patients (ISS >15) Injury Cases *
Total Trauma
Cases
Rate per 100,000
(95%CI)
Total Trauma
Cases
Rate per
100,000 (95%CI)
Total Injury
Cases
Rate per 100,000
(95%CI)
Western 4,169 873 [847, 900] 343 72 [64, 79] 29,975 6,278 [6,207, 6,349]
Southeastern** 10,057 781 [766, 797] 979 76 [71, 81] 79,887 6,207 [6,164, 6,250]
Northern 7,559 1,332 [1,302, 1,362] 771 136 [126, 145] 38,752 6,826 [6,759, 6,894]
Central 34,707 699 [692, 707] 3,749 76 [73, 78] 297,590 5,997 [5,975, 6,018]
CI= Confidence interval
MORTALITY BY ISS
Injury Region Total Trauma
deaths
Rate per 100,000
(95%CI)
Western 77 16 [13, 20]
Northern 130 23 [19, 27]
Southeastern 268 21 [18, 23]
Central 942 19 [18, 20]
Table 21: Region-specific trauma mortality rate per 100,000
CI= Confidence interval
*The Arizona Hospital Discharge Database (HDD) 2020 was queried
to calculate the injury rate by region (In HDD, region is defined
based on the county of residence; while in ASTR, region is defined
based on the county of injury). ,
** In the year 2020, there was a new Level 1 Trauma center in this
region hence we see a increase in trauma rates and numbers for this
region.
Data source: Arizona State Trauma Registry 2020
Figure 26a: Region-specific trauma rate per 100,000
699781
873
1,332
0
250
500
750
1,000
1,250
Ra
te p
er
10
0,0
00
Central Southeastern Western Northern
Statewide
By region
Data source: Arizona State Trauma Registry 2020
Figure 28: Region-specific trauma proportion by InjurySeverity Score
65%
70% 69% 69%
23%20% 19% 20%
8% 6% 8% 6%2% 1% 2% 3%
1-8 9-15 16-24 25-750%
20%
40%
60%
Pe
rce
nt
Southeastern RegionNorthern Region
Western RegionCentral Region
Data source: Arizona State Trauma Registry 2020
Figure 26b: Region-specific severe trauma (ISS>15) rate per100,000
72 76 76
136
0
25
50
75
100
125
Ra
te p
er
10
0,0
00
Western Central Southeastern Northern
Statewide
By region
Data source: Arizona State Trauma Registry 2020
Figure 27: Region-specific trauma mortality rate per100,000
1619
2123
0
5
10
15
20
Ra
te p
er
10
0,0
00
Western Central Southeastern Northern
Statewide
By region

Page 29
INJURY REGION
CI = Confidence interval
Region Mechanisms Total Trauma Cases Rate per 100,000 (95%CI)
Central Fall 17,766 358 [353, 363]
MVT-Occupant 5,470 110 [107, 113]
Struck By/Against 1,928 39 [37, 41]
Cut/Pierce 1,360 27 [26, 29]
Firearm 1,352 27 [26, 29]
MV Non-Traffic 1,138 23 [22, 24]
Northern Fall 3,069 541 [522, 560]
MVT-Occupant 1,481 261 [248, 274]
Struck By/Against 592 104 [96, 113]
Cut/Pierce 226 40 [35, 45]
Firearm 124 22 [18, 26]
MV Non-Traffic 458 81 [73, 88]
Southeastern Fall 4,231 329 [319, 339]
MVT-Occupant 2,005 156 [149, 163]
Struck By/Against 754 59 [54, 63]
Cut/Pierce 383 30 [27, 33]
Firearm 347 27 [24, 30]
MV Non-Traffic 485 38 [34, 41]
Western Fall 2,053 430 [411, 449]
MVT-Occupant 705 148 [137, 159]
Struck By/Against 153 32 [27, 37]
Cut/Pierce 106 22 [18, 26]
Firearm 108 23 [18, 27]
MV Non-Traffic 350 73 [66, 81]
Statewide Fall 27,649 379 [375, 384]
MVT-Occupant 9,891 136 [133, 138]
Struck By/Against 3,584 49 [48, 51]
Cut/Pierce 2,127 29 [28, 30]
Firearm 1,991 27 [26, 28]
MV Non-Traffic 2,608 36 [34, 37]
MECHANISM OF INJURY
Table 22: Region-specific trauma rate per 100,000 by the top 6 mechanism of injury
Data source: Arizona State Trauma Registry 2020
Figure 29: Region-specific trauma rate per 100,000 by top 6mechanisms
FallMVT-O
ccupant
Struck By/Against
Cut/Pierce
Firearm
MV Non-Traff ic
0
100
200
300
400
500
Ra
te p
er
10
0,0
00
Statewide
Western
Southeastern
Northern
Central

Page 30
INJURY REGION
Table 23: Region-specific trauma rate per 100,000 by intent of injury
CI= Confidence interval
INTENT OF INJURY
Region Intent Total Trauma Cases Rate per 100,000 (95%CI)
Central Region Unintentional 30,995 625 [618, 632]
Assault 2,901 58 [56, 61]
Self-harm 434 9 [8, 10]
Northern Region Unintentional 6,296 1,109 [1,082, 1,136]
Assault 717 126 [117, 136]
Self-harm 98 17 [14, 21]
Southeastern Region Unintentional 8,806 684 [670, 699]
Assault 996 77 [73, 82]
Self-harm 152 12 [10, 14]
Western Region Unintentional 3,838 804 [778, 829]
Assault 218 46 [40, 52]
Self-harm 52 11 [8, 14]
Statewide Unintentional 49,935 685 [679, 691]
Assault 4,832 66 [64, 68]
Self-harm 736 10 [9, 11]
Data source: Arizona State Trauma Registry 2020
Figure 30: Region-specific trauma rate per 100,000 by intent
Unintentional Assault Self-harm
0
200
400
600
800
1,000R
ate
pe
r 1
00
,00
0 Statewide
Southeastern Region
Northern Region
Western Region
Central Region
Page 31
TRAUMA CENTER DESIGNATION
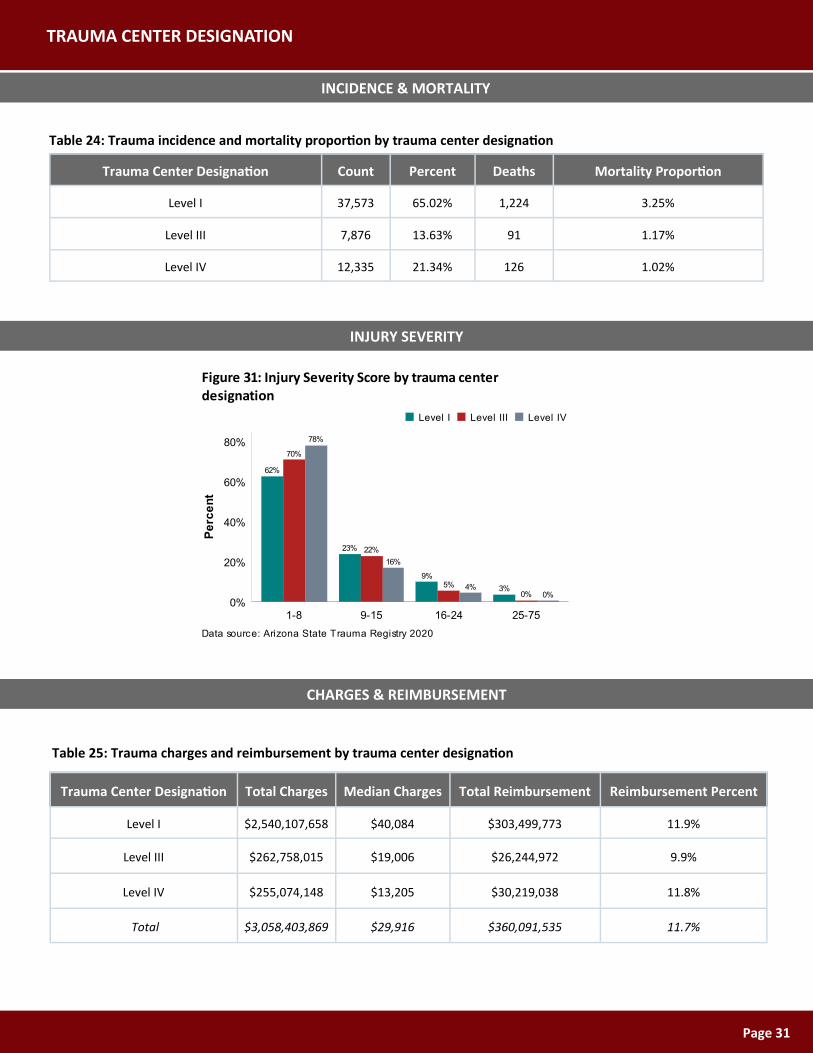
Table 24: Trauma incidence and mortality proportion by trauma center designation
INCIDENCE & MORTALITY
Trauma Center Designation Count Percent Deaths Mortality Proportion
Level I 37,573 65.02% 1,224 3.25%
Level III 7,876 13.63% 91 1.17%
Level IV 12,335 21.34% 126 1.02%
INJURY SEVERITY
Trauma Center Designation Total Charges Median Charges Total Reimbursement Reimbursement Percent
Level I $2,540,107,658 $40,084 $303,499,773 11.9%
Level III $262,758,015 $19,006 $26,244,972 9.9%
Level IV $255,074,148 $13,205 $30,219,038 11.8%
Total $3,058,403,869 $29,916 $360,091,535 11.7%
Table 25: Trauma charges and reimbursement by trauma center designation
CHARGES & REIMBURSEMENT
Data source: Arizona State Trauma Registry 2020
Figure 31: Injury Severity Score by trauma centerdesignation
62%
70%
78%
23% 22%
16%
9%5% 4% 3%
0% 0%
1-8 9-15 16-24 25-750%
20%
40%
60%
80%
Pe
rce
nt
Level IVLevel IIILevel I
Page 32
TRAUMATIC BRAIN INJURY
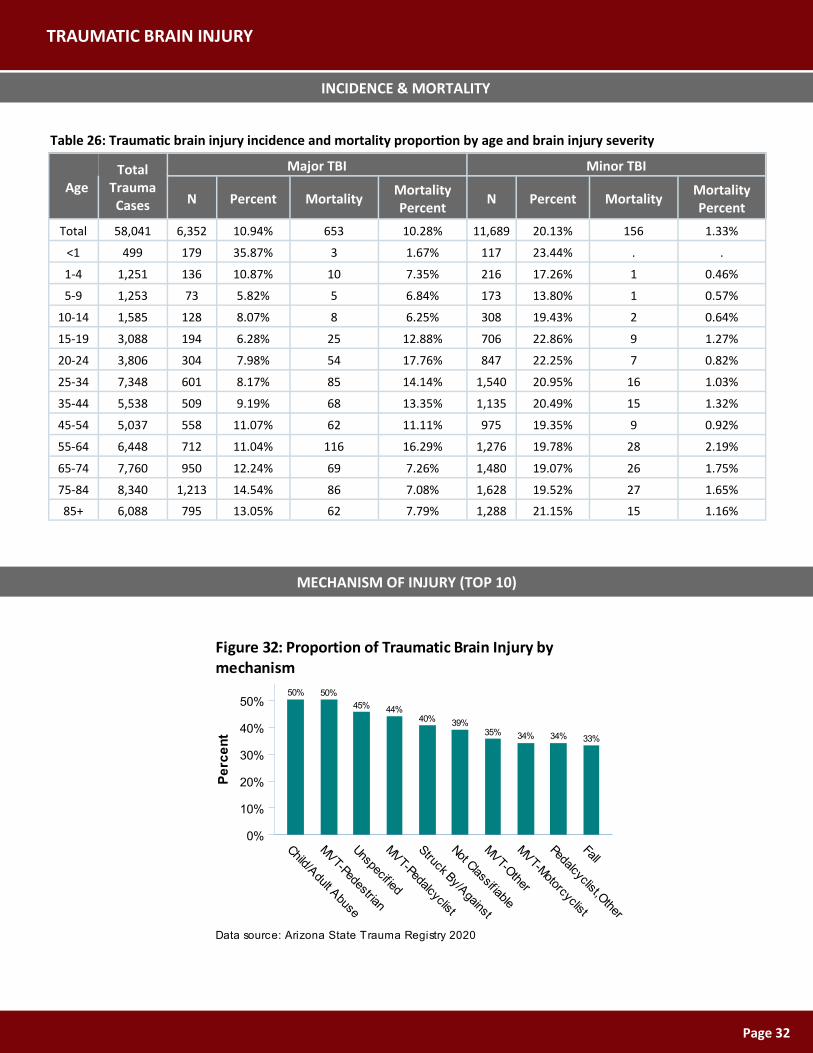
Table 26: Traumatic brain injury incidence and mortality proportion by age and brain injury severity
INCIDENCE & MORTALITY
MECHANISM OF INJURY (TOP 10)
Total Trauma Cases
Major TBI Minor TBI
Age N Percent Mortality
Mortality Percent
N Percent Mortality Mortality Percent
Total 58,041 6,352 10.94% 653 10.28% 11,689 20.13% 156 1.33%
<1 499 179 35.87% 3 1.67% 117 23.44% . .
1-4 1,251 136 10.87% 10 7.35% 216 17.26% 1 0.46%
5-9 1,253 73 5.82% 5 6.84% 173 13.80% 1 0.57%
10-14 1,585 128 8.07% 8 6.25% 308 19.43% 2 0.64%
15-19 3,088 194 6.28% 25 12.88% 706 22.86% 9 1.27%
20-24 3,806 304 7.98% 54 17.76% 847 22.25% 7 0.82%
25-34 7,348 601 8.17% 85 14.14% 1,540 20.95% 16 1.03%
35-44 5,538 509 9.19% 68 13.35% 1,135 20.49% 15 1.32%
45-54 5,037 558 11.07% 62 11.11% 975 19.35% 9 0.92%
55-64 6,448 712 11.04% 116 16.29% 1,276 19.78% 28 2.19%
65-74 7,760 950 12.24% 69 7.26% 1,480 19.07% 26 1.75%
75-84 8,340 1,213 14.54% 86 7.08% 1,628 19.52% 27 1.65%
85+ 6,088 795 13.05% 62 7.79% 1,288 21.15% 15 1.16%
Data source: Arizona State Trauma Registry 2020
Figure 32: Proportion of Traumatic Brain Injury bymechanism
50% 50%
45% 44%40%
39%35% 34% 34% 33%
Child/Adult A
buse
MVT-Pedestrian
Unspecif ied
MVT-Pedalcyclist
Struck By/Against
Not Classif iable
MVT-O
ther
MVT-M
otorcyclist
Pedalcyclist,Other
Fall
0%
10%
20%
30%
40%
50%
Pe
rce
nt

Page 33
TRAUMATIC BRAIN INJURY
Table 27: Traumatic brain injury incidence and mortality proportion by age and GCS
GLASGOW COMA SCORE (GCS)
Total
Trauma
Cases
TBI- GCS<9 TBI- GCS 9-12 TBI- GCS 13-15
Age N Percent Mortality
Mortality
Percent N Percent Mortality
Mortality
Percent N Percent Mortality
Mortality
Percent
Total 58,041 1,358 2.33% 600 44.18% 605 1.04% 40 6.61% 15,740 27.11% 158 1.00%
<1 499 13 2.60% 3 23.07% 10 2.00% . . 257 51.50% . .
1-4 1,251 22 1.75% 10 45.45% 16 1.27% . . 307 24.54% 1 0.32%
5-9 1,253 19 1.51% 6 31.57% 11 0.87% . . 208 16.60% . .
10-14 1,585 30 1.89% 10 33.33% 12 0.75% . . 391 24.66% . .
15-19 3,088 90 2.91% 33 36.66% 19 0.61% . . 786 25.45% 1 0.12%
20-24 3,806 151 3.96% 60 39.73% 31 0.81% . . 958 25.17% . .
25-34 7,348 252 3.42% 97 38.49% 88 1.19% 1 1.13% 1,767 24.04% 2 0.11%
35-44 5,538 185 3.34% 78 42.16% 69 1.24% 2 2.89% 1,366 24.66% 1 0.07%
45-54 5,037 142 2.81% 62 43.66% 59 1.17% 5 8.47% 1,314 26.08% 4 0.30%
55-64 6,448 178 2.76% 99 55.61% 72 1.11% 11 15.27% 1,718 26.64% 32 1.86%
65-74 7,760 127 1.63% 54 42.51% 71 0.91% 3 4.22% 2,178 28.06% 36 1.65%
75-84 8,340 94 1.12% 59 62.76% 86 1.03% 10 11.62% 2,586 31.00% 42 1.62%
85+ 6,088 55 0.90% 29 52.72% 61 1.00% 8 13.11% 1,904 31.27% 39 2.04%

Page 34
REHAB
Table 28: Discharged to rehab by primary payer and Injury Severity Score
DISCHARGED TO REHAB BY PAYER
Primary Payer Total Patient admitted Discharged to Rehab ISS <=15 and
Discharged to Rehab
ISS >15 and
Discharged to Rehab
N % N % N % N %
AHCCCS 10,025 29.21% 596 5.94% 300 3.67% 293 17.74%
Medicare 12,584 36.66% 1,336 10.61% 1,064 9.94% 258 16.16%
Not Documented 59 0.17% 5 8.47% 3 6.25% 2 20.00%
Other 170 0.49% 3 1.76% 3 2.23% . .
Private 9,756 28.42% 794 8.13% 482 5.89% 309 21.41%
Self pay 1,723 5.02% 18 1.04% 11 0.73% 7 3.39%
Total 34,317 100.00% 2,752 8.01% 1,863 6.48% 869 17.61%
DISCHARGED TO REHAB BY REGION
Region Total Patient Admitted
N %
Missing Region 918 2.7%
Central Region 23,984 71.7%
Western Region 1,869 5.5%
Northern Region 3,388 10.1%
Southeastern Region 3,284 9.8%
Statewide 33,443 100.0%
Table 29: Discharged to rehab by region of injury
Other
N %
859 93.5%
22,256 92.7%
1,685 90.1%
3,062 90.3%
2,933 89.3%
30,795 92.0%
Discharged to Rehab
N %
59 6.4%
1,728 7.2%
184 9.8%
326 9.6%
351 10.6%
2,648 7.9%

Page 35
COMPARISION OF TRAUMA AND COVID-19 INCIDENTS
EPI CURVE

Page 36
APPENDIX A. LIST OF TRAUMA CENTERS BY LEVEL OF DESIGNATION
*Application Pending: In accordance with R9-25-1307D – If an owner submits for renewal of designation, the designation does not expire until the Department has made a final determination.
** Due to the significant impacts of COVID-19 on public health The American College of Surgeons (ACS) has made the decision to grant an extension of 1 year for verified hospital programs with a verification expiration date falling between January 2020 and December 2023. The dates above represent state designation expiration dates, not ACS verification expiration dates.
** Pediatric Level I Trauma Centers: All Arizona Designated Trauma Centers are required to have the capabilities necessary to resuscitate, stabilize, and transfer pediatric patients. Pediatric Trauma Centers have a trauma service specifically intended to meet the needs of children requiring trauma care.
Health Care Institution Address Effective
Date
Expiration
Date
Level I Trauma Centers
Abrazo West Campus 13677 W. McDowell Road, Goodyear, AZ 85395 06/30/18 **06/30/21
Banner - University Medical Center Phoenix 1111 E. McDowell Rd., Phoenix, AZ 85006 11/18/17 11/18/21
Banner Desert Medical Center 1400 South Dobson Rd., Meza, AZ 85202 04/23/19 **04/23/22
Banner Thunderbird Medical Center 5555 W. Thunderbird Rd, Glendale, AZ 85306 09/30/19 **09/30/22
Banner University Medical Center – Tucson Campus
1625 N. Campbell Ave, Tucson, AZ 85719 11/11/18 11/11/21
Carondelet St. Joseph’s Hospital 350 N. Wilmot Rd., Tucson, AZ 85718 09/20/20 09/20/23
Dignity Health, dba Chandler Regional Medical Center
1955 W. Frye Rd., Chandler, AZ 85224 07/01/18 07/01/22
Flagstaff Medical Center 1200 N. Beaver St., Flagstaff, AZ 86001 05/27/21 05/27/24
HonorHealth Deer Valley Medical Center 19829 N. 27th Ave., Phoenix, AZ 85027 06/01/19 **06/01/22
HonorHealth John C. Lincoln Medical Center 250 E. Dunlap Ave., Phoenix, AZ 85020 04/24/21 04/24/24
HonorHealth Scottsdale Osborn Medical Center
7400 E. Osborn, Scottsdale, AZ 85251 10/27/18 10/27/21
Maricopa County Special Health Care District, dba Valleywise Health Medical Center
2601 E. Roosevelt, Phoenix, AZ 85008 12/19/17 12/19/21
St. Joseph’s Hospital & Medical Center 350 W. Thomas Rd., Phoenix, AZ 85013 11/20/19 11/20/23
Level I Pediatric Trauma Centers **
Phoenix Children’s Hospital 1919 E. Thomas Rd., Phoenix, AZ 85016 08/31/18 08/31/22
Level III Trauma Centers
Banner Baywood Medical Center 6644 E. Baywood Ave., Mesa, AZ 85206 02/25/20 02/25/24
Banner Del E. Webb Medical Center 14502 W. Meeker Blvd, Sun City West, AZ 85375 01/25/19 01/25/22
Canyon Vista Medical Center 5700 E. Highway 90, Sierra Vista, AZ 85635 04/03/20 04/03/23
Havasu Regional Medical Center 101 Civic Center Ln., Lake Havasu City, AZ 86403 04/26/21 02/28/24
Mountain Vista Medical Center 1301 S. Crismon Rd., Mesa, AZ 85209 07/26/20 * 07/26/21
Tuba City Regional Health Care Corp. P.O. Box 600, 167 Main St., Tuba City, AZ 86045 12/10/18 12/10/21
Page 37
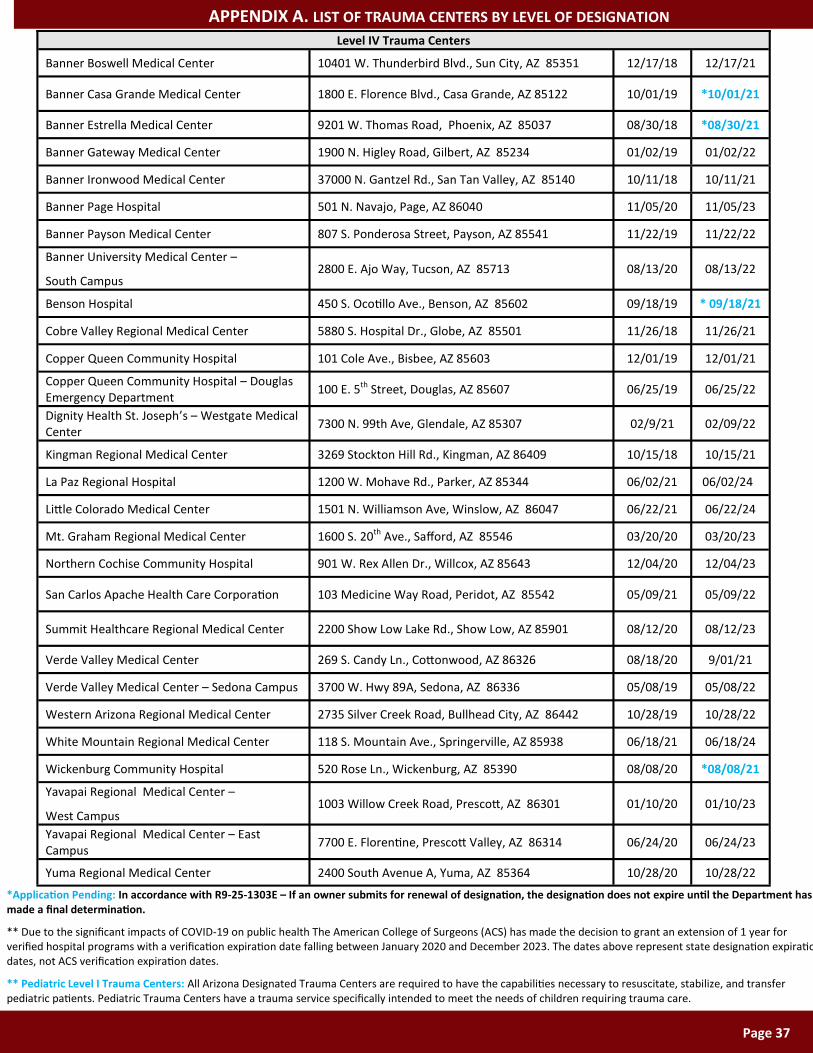
APPENDIX A. LIST OF TRAUMA CENTERS BY LEVEL OF DESIGNATION
Level IV Trauma Centers
Banner Boswell Medical Center 10401 W. Thunderbird Blvd., Sun City, AZ 85351 12/17/18 12/17/21
Banner Casa Grande Medical Center 1800 E. Florence Blvd., Casa Grande, AZ 85122 10/01/19 *10/01/21
Banner Estrella Medical Center 9201 W. Thomas Road, Phoenix, AZ 85037 08/30/18 *08/30/21
Banner Gateway Medical Center 1900 N. Higley Road, Gilbert, AZ 85234 01/02/19 01/02/22
Banner Ironwood Medical Center 37000 N. Gantzel Rd., San Tan Valley, AZ 85140 10/11/18 10/11/21
Banner Page Hospital 501 N. Navajo, Page, AZ 86040 11/05/20 11/05/23
Banner Payson Medical Center 807 S. Ponderosa Street, Payson, AZ 85541 11/22/19 11/22/22
Banner University Medical Center –
South Campus 2800 E. Ajo Way, Tucson, AZ 85713 08/13/20 08/13/22
Benson Hospital 450 S. Ocotillo Ave., Benson, AZ 85602 09/18/19 * 09/18/21
Cobre Valley Regional Medical Center 5880 S. Hospital Dr., Globe, AZ 85501 11/26/18 11/26/21
Copper Queen Community Hospital 101 Cole Ave., Bisbee, AZ 85603 12/01/19 12/01/21
Copper Queen Community Hospital – Douglas Emergency Department
100 E. 5th Street, Douglas, AZ 85607 06/25/19 06/25/22
Dignity Health St. Joseph’s – Westgate Medical Center
7300 N. 99th Ave, Glendale, AZ 85307 02/9/21 02/09/22
Kingman Regional Medical Center 3269 Stockton Hill Rd., Kingman, AZ 86409 10/15/18 10/15/21
La Paz Regional Hospital 1200 W. Mohave Rd., Parker, AZ 85344 06/02/21 06/02/24
Little Colorado Medical Center 1501 N. Williamson Ave, Winslow, AZ 86047 06/22/21 06/22/24
Mt. Graham Regional Medical Center 1600 S. 20th Ave., Safford, AZ 85546 03/20/20 03/20/23
Northern Cochise Community Hospital 901 W. Rex Allen Dr., Willcox, AZ 85643 12/04/20 12/04/23
San Carlos Apache Health Care Corporation 103 Medicine Way Road, Peridot, AZ 85542 05/09/21 05/09/22
Summit Healthcare Regional Medical Center 2200 Show Low Lake Rd., Show Low, AZ 85901 08/12/20 08/12/23
Verde Valley Medical Center 269 S. Candy Ln., Cottonwood, AZ 86326 08/18/20 9/01/21
Verde Valley Medical Center – Sedona Campus 3700 W. Hwy 89A, Sedona, AZ 86336 05/08/19 05/08/22
Western Arizona Regional Medical Center 2735 Silver Creek Road, Bullhead City, AZ 86442 10/28/19 10/28/22
White Mountain Regional Medical Center 118 S. Mountain Ave., Springerville, AZ 85938 06/18/21 06/18/24
Wickenburg Community Hospital 520 Rose Ln., Wickenburg, AZ 85390 08/08/20 *08/08/21
Yavapai Regional Medical Center –
West Campus 1003 Willow Creek Road, Prescott, AZ 86301 01/10/20 01/10/23
Yavapai Regional Medical Center – East Campus
7700 E. Florentine, Prescott Valley, AZ 86314 06/24/20 06/24/23
Yuma Regional Medical Center 2400 South Avenue A, Yuma, AZ 85364 10/28/20 10/28/22
*Application Pending: In accordance with R9-25-1303E – If an owner submits for renewal of designation, the designation does not expire until the Department has made a final determination.
** Due to the significant impacts of COVID-19 on public health The American College of Surgeons (ACS) has made the decision to grant an extension of 1 year for verified hospital programs with a verification expiration date falling between January 2020 and December 2023. The dates above represent state designation expiration dates, not ACS verification expiration dates.
** Pediatric Level I Trauma Centers: All Arizona Designated Trauma Centers are required to have the capabilities necessary to resuscitate, stabilize, and transfer pediatric patients. Pediatric Trauma Centers have a trauma service specifically intended to meet the needs of children requiring trauma care.

Page 38
ARIZONA STATE TRAUMA REGISTRY INCLUSION CRITERIA
APPENDIX B.
TRAUMA PATIENT INCLUSION DEFINITION ARIZONA STATE TRAUMA REGISTRY (ASTR)
Effective for records with ED/Hospital Arrival Dates January 1, 2018** – Current
The owner of a trauma center shall ensure that: 1. The trauma registry, established according to subsection (B)(1), includes the information
required in R9- 25-1309 for each patient with whom the trauma center had contact who meets one or more of the following criteria:
a. A patient with injury or suspected injury who is: i. Transported from a scene to a trauma center or an emergency department based on the responding emergency medical services provider’s or ambulance service’s triage protocol required in R9-25- 201(E)(2)(b), or ii. Transferred from one health care institution to another health care institution by an emergency medical services provider or ambulance service; b. A patient with injury or suspected injury for whom a trauma team activation occurs; or c. A patient with injury, who is admitted as a result of the injury or who dies as a result of the injury, and whose medical record includes one or more of specific ICD-codes indicating that: i. At the initial encounter with the patient, the patient had: (1) An injury or injuries to specific body parts - S00-S99 with 7th character modifiers of A, B, or C ONLY. (Injuries to specific body parts –initial encounter) (2) Unspecified multiple injuries - T07 (unspecified multiple injuries) (3) Injury of an unspecified body region - T14 (injury of unspecified body region) (4) A burn or burns to specific body parts - T20-T28 with 7th character modifier of A ONLY (burns by specific body parts – initial encounter) (5) Burns assessed through Total Body Surface Area percentages - T30-T32 (burn by TBSA percentages) or (6) Traumatic Compartment Syndrome - T79.A1-T79.A9 with 7th character modifier of A ONLY (Traumatic Compartment Syndrome – initial encounter); and

Page 39
ARIZONA STATE TRAUMA REGISTRY INCLUSION CRITERIA
APPENDIX B.
ii. The patient’s injuries or burns were not only: (1) An isolated distal extremity fracture from a same-level fall, (2) An isolated femoral neck fracture from a same-level fall, (3) Effects resulting from an injury or burn that developed after the initial encounter – (Late effect codes, which are represented using the same range of injury diagnosis codes but with the 7th digit modifier code of D through S), (4) A superficial injury or contusion – S00 (Superficial injuries of the head) S10 (Superficial injuries of the neck) S20 (Superficial injuries of the thorax) S30 (Superficial injuries of the abdomen, pelvis, lower back and external genitals) S40 (Superficial injuries of shoulder and upper arm) S50 (Superficial injuries of elbow and forearm) S60 (Superficial injuries of wrist, hand and fingers) S70 (Superficial injuries of hip and thigh) S80 (Superficial injuries of knee and lower leg) S90 (Superficial injuries of ankle, foot and toes)), or (5) A foreign body entering through an orifice; *The inclusion criteria are in the trauma rules. This document is a guide and does not supercede the rules.