statement of adam sieminski administrator energy information
TRANSCRIPT

1
STATEMENT OF ADAM SIEMINSKI
ADMINISTRATOR
ENERGY INFORMATION ADMINISTRATION
U.S. DEPARTMENT OF ENERGY
Before the
COMMITTEE ON ENERGY AND NATURAL RESOURCES
U. S. SENATE
JULY 16, 2013

2
Chairman Wyden, Ranking Member Murkowski, and Members of the Committee, thank you for the
opportunity to appear before you today to discuss the U.S. petroleum supply system, which is changing
rapidly.
The U.S. Energy Information Administration (EIA) is the statistical and analytical agency within the U.S.
Department of Energy. EIA collects, analyzes, and disseminates independent and impartial energy
information to promote sound policymaking, efficient markets, and public understanding regarding
energy and its interaction with the economy and the environment. By law, EIA’s data, analyses, and
forecasts are independent of approval by any other officer or employee of the United States
Government, so the views expressed herein should not be construed as representing those of the
Department of Energy or any other Federal agency. As discussed in my testimony, EIA is active in
providing both data and analysis that bear directly on supplies of petroleum products in this country.
The main points of my testimony are as follows:
The United States is undergoing a dramatic change in domestic oil production. The rate of increase in
domestic production continues to surpass even the most optimistic forecasts of recent years. Domestic
oil production in the United States has increased significantly, and at 7.4 million barrels per day as of
April 2013 is now at the highest level since October 1992. Over the five year period through calendar
year 2012, domestic oil production increased by 1.5 million barrels per day, or 30%. Most of that
growth occurred over the past 3 years. Lower 48 onshore production (total U.S. Lower 48 production
minus production from the federal Gulf of Mexico and federal Pacific) rose more than 2 million barrels
per day (bbl/d), or 64%, between February 2010 and February 2013, primarily because of a rise in
productivity from oil-bearing, low-permeability rocks. Texas more than doubled its production and
North Dakota's output nearly tripled over that period. Five western states —Oklahoma, New Mexico,

3
Wyoming, Colorado, and Utah—had production increases ranging from 23% to 64% over the same three
years. This rapid growth has stressed many parts of the U.S. petroleum supply infrastructure.
Currently, transportation constraints are limiting the full impact of increased domestic crude production,
but these constraints are expected to ease in the coming years. Historically, about 90% of the crude oil
and petroleum products in the United States have been transported by pipeline. However, shipments
of crude oil by rail from North Dakota's Bakken Shale formation have increased dramatically over the past
year, reflecting both lags in adding pipeline infrastructure to transport growing volumes of crude and the
ability of rail shipments to serve east coast refineries in the United States and Canada and U.S. west coast
refineries, where Bakken crude has its greatest economic value as a replacement for seaborne imports
of light sweet crude oil. Crude oil and petroleum products shipments by rail averaged
1.37 million barrels per day during the first half of 2013. (Up 48% from 927,000 bpd in same period in
2012) according to the Association of American Railroads (AAR), which tracks movement of commodities
by rail. Crude oil accounted for an estimated 50% of the combined deliveries in the oil and petroleum
products, up from 3% in 2009. This topic was discussed in the EIA This Week in Petroleum article of July
11 (See Attachment 1)
Several pipeline projects are currently under way or proposed which should increase deliveries of
domestic crude from inland sources to major refining centers, primarily on the Gulf Coast. Additionally,
as discussed in the EIA Today in Energy article of July 10 (See Attachment 2), more Bakken crude is
being moved to market by rail. By addressing logistical constraints, these developments are leading to
lower discounts for inland crudes. Even before these projects, however, increasing domestic crude
production has reduced crude oil imports by almost 1.3 million bpd, or 13%, since 2008. Virtually all of
the reduction in U.S. crude oil imports is reflected in lower imports from member countries of the
Organization of the Petroleum Exporting Countries.

4
Currently the U.S. is also a very limited exporter of crude oil. Any company wanting to export crude oil
must obtain a license from the Bureau of Industry and Security (BIS), which is part of the U.S.
Department of Commerce. According to the regulations published in Title 15 Part 754.2 of the Code of
Federal Regulations, BIS will approve applications for licenses to export crude oil for the following kinds
of transactions:
From Alaska's Cook Inlet
To Canada for consumption or use therein
In connection with refining or exchange of Strategic Petroleum Reserve oil
Of up to an average of 25,000 bbl/d of California heavy crude oil
That are consistent with findings made by the president under an applicable statute
Of foreign-origin crude oil where, based on written documentation satisfactory to BIS,
the exporter can demonstrate that the oil is not of U.S. origin and has not been
commingled with oil of U.S. origin
Monthly exports of crude oil from the United States to Canada have historically averaged 24,000 barrels
per day (bbl/d) and were principally delivered to refineries in central Canada. However, U.S. exports to
Canada averaged over 100,000 bbl/d over the first 4 months of 2013 as Canadian refineries, like those
in the United States, are processing increased volumes of crude oil produced in Texas and North Dakota.
At the same time as domestic crude oil supplies are growing, U.S. refiners face declining demand for
gasoline in the U.S. market. Since 2007, demand for gasoline in the U.S. has declined by almost 600,000
bbl/d, or 6.3%, and the amount of ethanol being added to the gasoline pool has increased by almost
400,000 bbl/d (replacing about 270,000 bbl/d of petroleum gasoline after accounting for ethanol’s
lower energy content relative to petroleum gasoline) . Therefore, from a crude oil refiner’s standpoint,
demand for the refined portion of gasoline has declined by almost 900,000 bbl/d, which is the
5
equivalent output of 14 average sized U.S. refineries. As a response, imports of gasoline blending
components have declined by almost 500,000 bbl/d, or 43%, and exports primarily from the Gulf Coast,
have increased by almost 400,000 bbl/d. In 2012, 84% of the gasoline exports went to countries in Latin
America. In addition, diesel demand in the U.S. declined by 450,000 bbl/d in the same time period, or
by 11%, leading to a drop in diesel imports of 200,000 bbl/d and increased exports of over 700,000
bbl/d. Again, in 2012, 61% of the diesel exports went to Latin America and 35% to Europe.
Infrastructure constraints within the United States, including pipeline capacity and marine vessel
availability, limit the movement of petroleum products from U.S. refining centers like the Gulf Coast to
the Northeast and other regions where product demands far exceeds product production capability of
within-region refining capacity. Product exports provide a way for refining centers to optimize crude
runs and operations. Although expected increases in domestic demand for diesel should reduce future
distillate exports, gasoline exports are likely to increase. Domestic demand is expected to continue to
decline due to improvements in the efficiency of new vehicles subject to fuel economy standards that
grow steadily more stringent through the 2025 model year as well as the potential increased use of
higher-percentage ethanol blends and other biofuels to meet the requirements of the renewable fuel
standards. Access to relatively low cost domestic crude oil and natural gas has given U.S. refineries a
cost advantage in serving foreign product markets compared to refiners located in other countries who
also compete to serve those markets . While access to growing supplies of domestic crude is generally
advantageous for U.S. refiners, they do face some challenges in changing their input slates to
accommodate the quality mix of U.S. crude production. Specifically, while virtually all of the new crude
production in the U.S. is light sweet crude, much of the refining capacity in the Gulf Coast is optimized to
run heavy, sour crude.

6
To adapt to increasing supplies of domestic light sweet crude, there are a number of alternatives
available to refiners that range from little or no cost to major capital investments that would only be
justified by large crude price differentials.
The low cost alternatives are those which do not meaningfully change the average gravity of the crude
for which the refinery was designed. First of all, refiners can simply utilize unused light crude capacity
and increase the amount of crude that they run. Since 2008, refinery runs have increased and average
crude gravity has gone up, particularly on the Gulf Coast, indicating that spare light crude capacity was
being utilized. By 2012, however, U.S. refiners ran at a utilization rate of 88.8 %, the highest level since
2007 and a level which many analysts view as effectively full utilization after accounting for typicallevels
of planned and unplanned outages.
Second, refiners can simply substitute domestic light sweet crude for imported volumes, most of which,
according to EIA data, has already been accomplished on the Gulf Coast. Refiners on the East and West
Coasts still import significant amounts of light sweet crude, but with rail shipments and eventually
pipeline additions, imports can be displaced. Lastly for a low cost alternative, refiners can blend more
light sweet crude with heavier crudes to meet their desired crude quality. The ability and extent to
which this can be accomplished is unique to each refinery and cannot be estimated by EIA at this time.
Other available options that involve changing the average crude quality run at a particular facility away
from its typical inputs require either operational changes based on short term market incentives or
capital investments which require longer term incentives. Operationally, refiners can run more light
sweet crude but at the expense of total crude input, a loss that must be incentivized by relative crude
prices. For longer term capital investments, there are two basic alternatives available to refiners. The

7
first, lower cost option would be to process light sweet crude to remove its lightest components,
thereby making it more like medium gravity crude which could then be used as a substitute for imported
medium crude. The more costly approach would be to invest in larger units throughout the refinery
which deal with lighter components of crude such that light sweet crude could substitute for heavy
crude. Again, these investments are unique to each refinery and are based on individual company
investment decisions.
In spite of the dramatic changes in the U.S. petroleum supply system, prices of both domestic crude and
petroleum products continue to be driven by the international market, albeit subject to short term
fluctuations in the supply chain. The United States continues to rely on imported crude oil and
petroleum products to meet domestic demand. In 2012, the United States imported 11.0 million bbl/d
of crude oil and refined petroleum products. At the same time, the nation exported 2.7 million bbl/d of
finished petroleum products and gasoline blendstocks that are also priced on the international market.
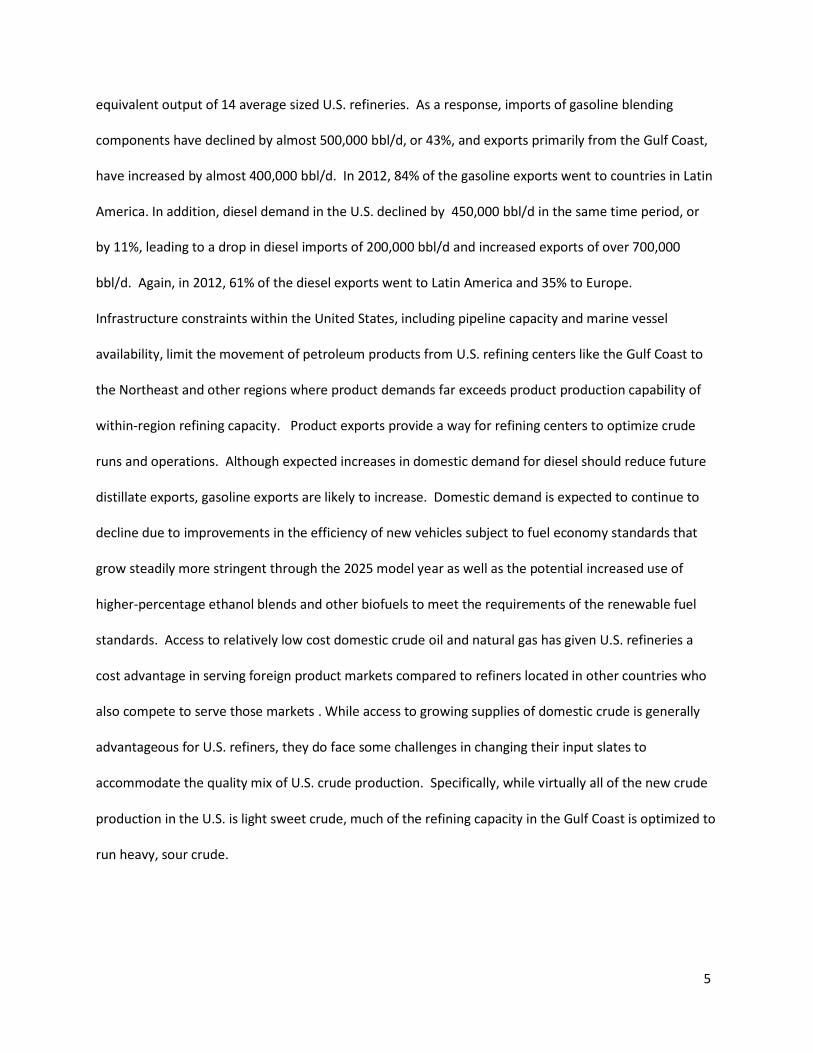
While most product imports occur on the East Coast and exports from the Gulf Coast, the United States
as a whole is linked by a complex logistical system which transports product and influences prices
throughout the country (see Figure 1).
8
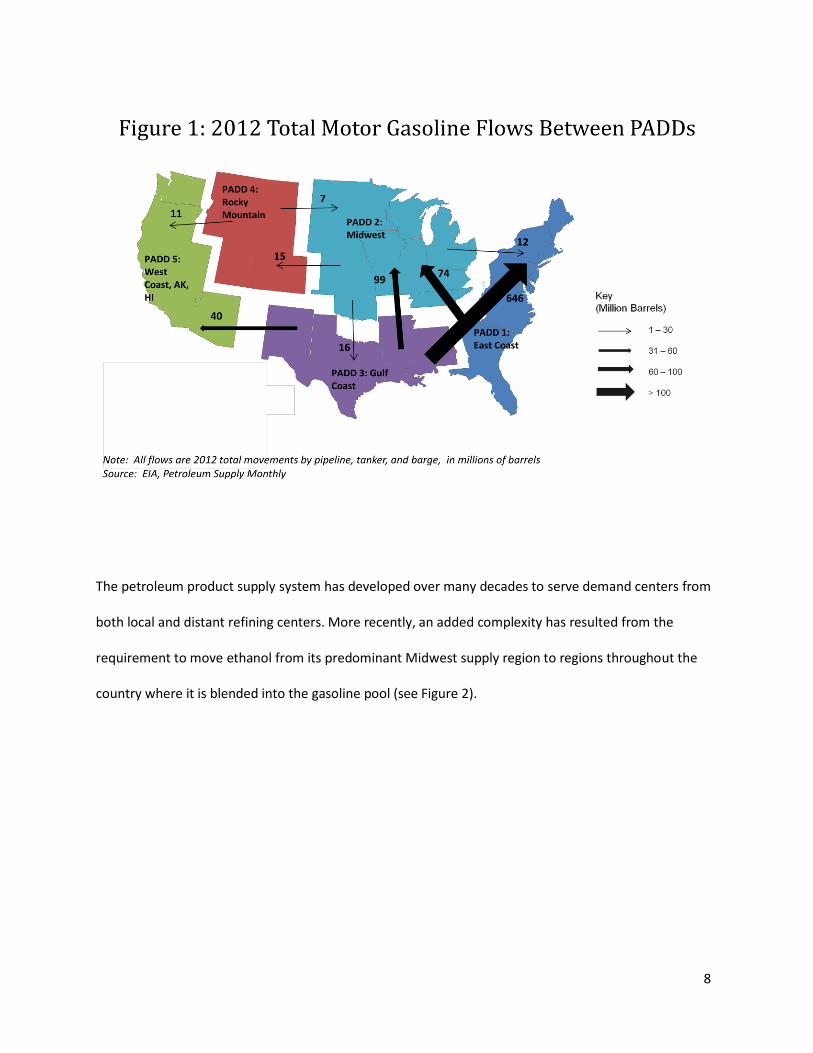
The petroleum product supply system has developed over many decades to serve demand centers from
both local and distant refining centers. More recently, an added complexity has resulted from the
requirement to move ethanol from its predominant Midwest supply region to regions throughout the
country where it is blended into the gasoline pool (see Figure 2).
9
Figure 2: 2012 Regional Share of Total Gasoline Demand and Production
percentage of total U.S.
100%
90%
80%
70%
60%
50%
40%
30%
20%
10%
0%
Finished Gasoline Demand
Blending Component Production
Ethanol Production
Padd 1 Padd 2 Padd 3 Padd 4 Padd 5
Source: EIA, Petroleum Supply Monthly
As noted above, short-term fluctuations in regional product supply chains can cause prices in a
particular region of the country to become temporarily disconnected from world and national market
forces. This spring, two unplanned refinery outages in the Midwest along with delayed restarts at
several others caused average retail gasoline prices to increase by 26 cents per gallon between the end
of April and the middle of June. The price increase was more dramatic in parts of North Dakota and
Minnesota but by the end of June, prices had returned to a more normal level. Similar price increases
occurred in 2012 on the West Coast after a series of unplanned outages. While we recognize the burden
these price increases place on the American public, these occurrences are relatively short-lived and are
the result of largely unforeseeable circumstances.

10
EIA remains actively engaged in monitoring and reporting on matters related to domestic petroleum
product supplies. EIA collects, analyzes, and reports more data on our national petroleum supply
system than any other comparable organization in the world. We access data on where crude is
produced, what type of crude it is, where it goes, and the ultimate slate of refined products. We collect
data on product movements by pipeline and ship and have an extensive database on crude and product
imports including the product type and crude quality, the importing entity, and the country (and port) of
origin. Like any other organization covering a rapidly changing industry, we also recognize the need for
increased data collection and analysis. Over the last several years, EIA has recognized significant changes
to the supply and demand patterns for petroleum products both domestically and with external trade.
As resources have permitted, and in some cases where significant regional transitions have raised
concern with Members of Congress, EIA has monitored, analyzed and reported on potential market
changes, including the following:
U.S. exports of petroleum products
The proposed sale or closure of three East Coast refineries
West Coast refinery outages and gasoline price increases
Possible closure of the Tesoro refinery in Hawaii
Closure of the Hess Port Reading, NJ refinery
Midwest refinery outages and gasoline price increases
We have been developing a system to collect crude production data at the well head to better monitor
and project domestic crude production. EIA is monitoring the following emerging trends in
transportation and midstream infrastructure: crude shipments by rail, barge and truck (see Attachment
1 July 11 This Week in Petroleum article), crude oil pipeline capacity additions and reversals, re-
purposing of natural gas pipelines to crude oil and gas liquids service, changing availability of coastwise

11
compliant and foreign flag vessels. We regularly publish a variety of reports on important petroleum
supply trends, including This Week In Petroleum, the Short Term Energy Outlook and the Annual Energy
Outlook. Although EIA has followed Atlantic basin petroleum product trade for decades, we are
currently challenged to keep up with the expanding products trade within the Americas and across the
Pacific. This Committee is a very important customer of the EIA and I would look forward to a
discussion with you.
Thank you for the opportunity to testify before the Committee.

12
Attachment 1
This Week In Petroleum
Released: July 11, 2013 Next Release: July 17, 2013
U.S. crude oil increasingly moves by barge, truck and rail
The U.S. Energy Information Administration (EIA) recently released its annual data series tracking how crude oil reaches the refinery gate. Not surprisingly, the 2012 data show heightened reliance on crude receipts via barge, truck and rail.
There has been much discussion about the rise in U.S. crude oil production and the resulting overhang in inventories at Cushing, Oklahoma and elsewhere in the midcontinent because of pipeline infrastructure that has not kept pace with burgeoning domestic crude oil supply. The supply-pipeline mismatch is encouraging market participants to increasingly rely on alternative transportation options.
From 2005 to 2010, 96 percent of refinery crude oil receipts came by pipeline and tanker (ship). With relatively low costs and high capacity, pipelines have long been the delivery method of choice for inland refineries. Coastal refineries, on the other hand, have typically been served by tankers of waterborne imports or offshore production. In 2011, this usage began to decline, and in 2012, pipelines and tankers delivered 93 percent of crude oil processed by U.S. refiners (Figure 1). The balance is made up primarily of domestic crude supplies carried via barge, rail and truck. Foreign receipts via barge have declined slightly.

13
Attachment 1
Because truck and rail are less cost-effective options for moving crude, they typically have accounted for a very small portion of refinery crude receipts, averaging just 1 percent of total receipts from 2000 to 2010. Starting in 2011, this truck and rail volume increased, and in 2012 it represented 3 percent of refinery receipts. Additionally, domestic barge receipts also increased, and now account for close to 3 percent (Figure 2). Expanding existing pipelines or building entirely new ones is costly and requires lengthy regulatory review. Using trucks and trains on the other hand, provides greater flexibility and uses existing infrastructure. As long as the Bakken and WTI prices trade at a large enough discount to global, waterborne crudes, these transportation patterns are likely to persist or even expand.
EIA collects data on crude delivery methods annually from all U.S. refineries. In cases where multiple transportation modes are used, respondents report the mode used for the last 100 miles. If several modes are used, and none is more than 100 miles, the method representing the longest distance is recorded. This may partially explain the increase in domestic barge traffic, with crude oil loaded on rail cars at production areas and then transferred to barges for the final leg of some journeys to refineries, particularly on the East Coast and along the Mississippi River. With increased rail traffic reported by the Association of American Railroads for the first half of 2013, it is likely that the EIA data on domestic crude receipts by rail will be higher in EIA's 2013 survey.
In addition to delivering more crude oil to U.S. refineries, railroads are shipping U.S. crude oil to eastern Canadian refineries. While the Midwest has been the traditional source for U.S. crude oil exports to Canada, a recent increase in exports is being led by deliveries from the Gulf Coast (waterborne) and the East Coast. The exports from the East Coast are primarily barrels that moved east from North Dakota's Bakken region by rail and are then exported through New York state. Small amounts of Canadian crude are also starting to move by rail to U.S. refineries, with 2011 marking the first time in 10 years that foreign-sourced rail shipments were reported. At nearly 1,000 barrels per day (bbl/d), this was the highest volume of foreign oil-by-rail recorded since EIA started

14
Attachment 1
publishing these data in 1981. In 2012 that number set a new record of more than 11,000 bbl/d.
Gasoline price decreases while diesel fuel increases The U.S. average retail price of regular gasoline decreased less than a penny to $3.49 per gallon as of July 8, 2013, up eight cents from last year at this time. The Midwest price increased two cents to $3.41 per gallon, while prices in all other regions decreased. The largest decrease came in the Rocky Mountain region, where the price is $3.61 per gallon, down three cents from last week. The Gulf and West Coast prices both decreased two cents, to $3.30 and $3.88 per gallon, respectively. Rounding out the regions, the East Coast price is down one cent to $3.46 per gallon.
The national average diesel fuel price increased one cent to $3.83 per gallon, 15 cents higher than last year at this time. The Rocky Mountain price decreased one cent to $3.81 per gallon, while prices in all other regions increased. The largest increase came on the Gulf Coast, where the price is up two cents to $3.75 per gallon. The East Coast, Midwest, and West Coast prices all increased a penny, to $3.83, $3.82, and $3.95 per gallon, respectively.
Propane inventories gain Total U.S. inventories of propane increased 1.0 million barrels from last week to end at 57.4 million barrels, but are 5.8 million barrels (9.2 percent) lower than the same period a year ago. The Gulf Coast region led the gain with 1.0 million barrels, while East Coast stocks increased by 0.2 million barrels. Midwest stocks increased by 0.1 million barrels and Rocky Mountain/West Coast stocks decreased by 0.3 million barrels. Propylene non-fuel-use inventories represented 5.3 percent of total propane inventories.
Text from the previous editions of This Week In Petroleum is accessible through a link at the top right-hand corner of this page.

15
Attachment 1
Retail Prices (Dollars per Gallon)
Retail Data Change From Last Retail Data Change From Last
07/08/13 Week Year 07/08/13 Week Year
Gasoline 3.492 -0.004 0.081 Diesel Fuel 3.828 0.011 0.145
Futures Prices (Dollars per Gallon*)
Futures Prices Change From Last
07/05/13 Week Year
Crude Oil 103.22 6.66 18.77
Gasoline 2.897 0.145 0.181
Heating Oil 2.990 0.110 0.280
*Note: Crude Oil Price in Dollars per Barrel.
16
Attachment 1
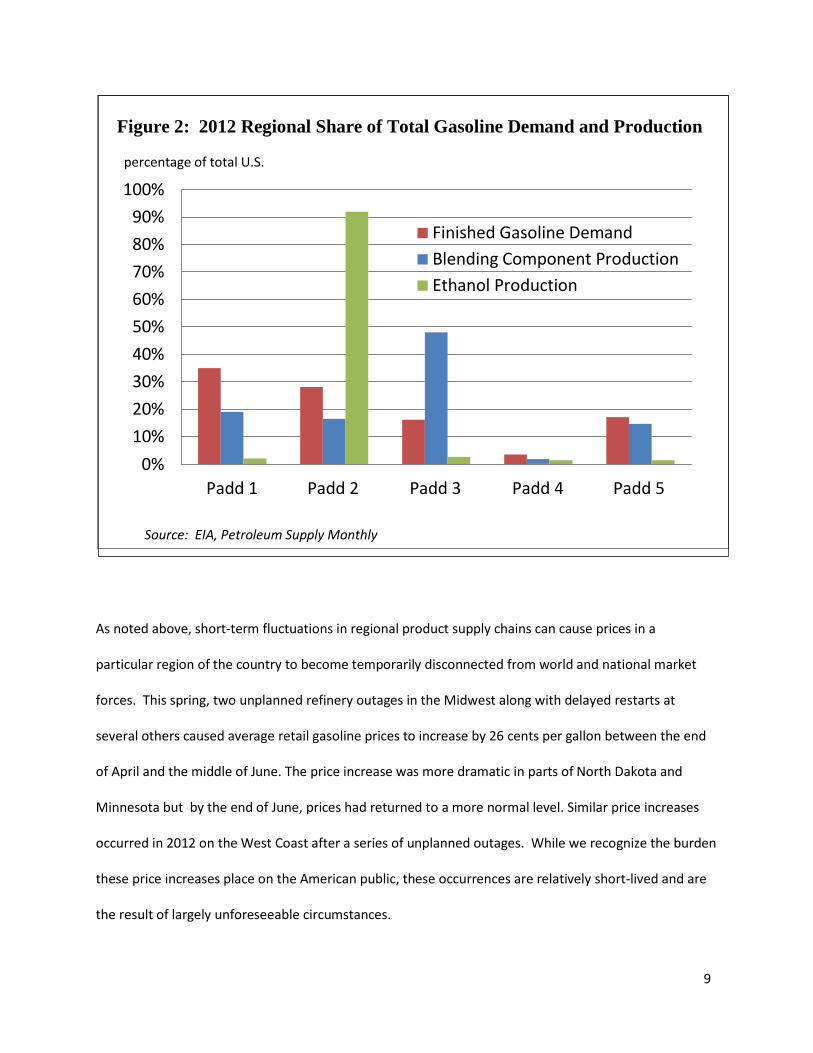
Stocks (Million Barrels)
Stocks Data Change From Last Stocks Data Change From Last
07/05/13 Week Year 07/05/13 Week Year
Crude Oil 373.9 -9.9 -4.3 Distillate 123.8 3.0 2.9
Gasoline 221.0 -2.6 13.3 Propane 57.374 1.021 -5.809
17
Attachment 2
TODAY IN ENERGY JULY 10, 2013
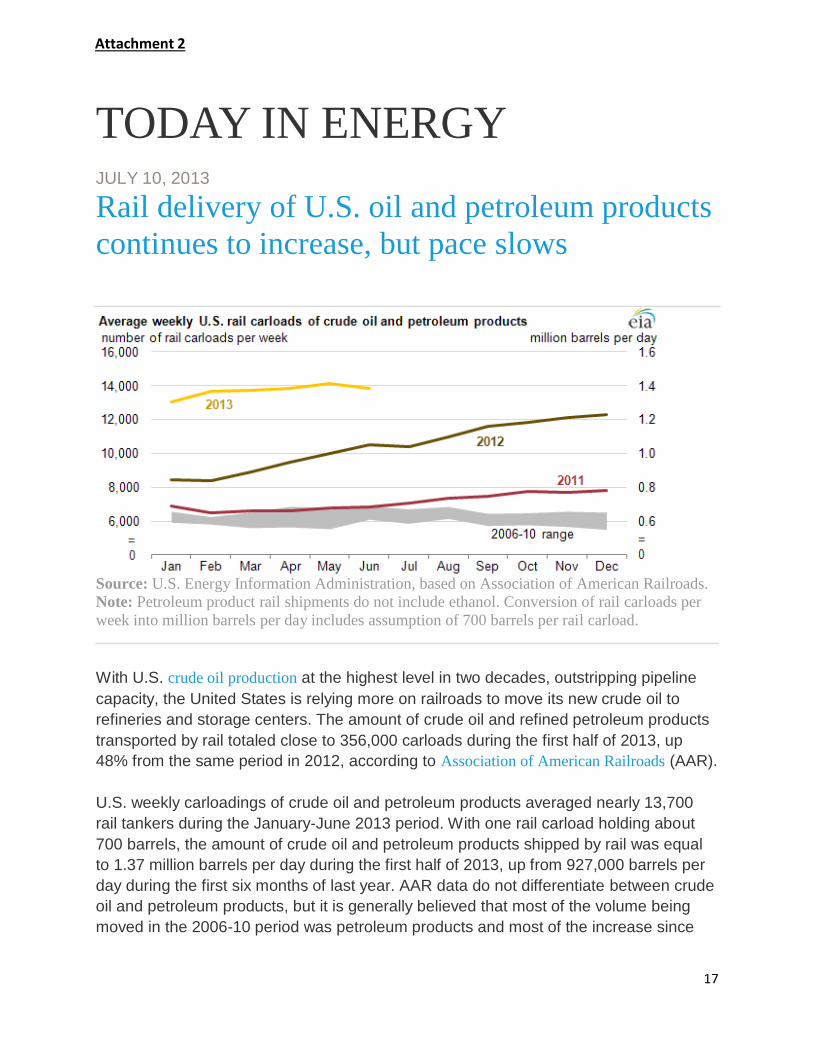
Rail delivery of U.S. oil and petroleum products
continues to increase, but pace slows
Source: U.S. Energy Information Administration, based on Association of American Railroads.
Note: Petroleum product rail shipments do not include ethanol. Conversion of rail carloads per
week into million barrels per day includes assumption of 700 barrels per rail carload.
With U.S. crude oil production at the highest level in two decades, outstripping pipeline
capacity, the United States is relying more on railroads to move its new crude oil to
refineries and storage centers. The amount of crude oil and refined petroleum products
transported by rail totaled close to 356,000 carloads during the first half of 2013, up
48% from the same period in 2012, according to Association of American Railroads (AAR).
U.S. weekly carloadings of crude oil and petroleum products averaged nearly 13,700
rail tankers during the January-June 2013 period. With one rail carload holding about
700 barrels, the amount of crude oil and petroleum products shipped by rail was equal
to 1.37 million barrels per day during the first half of 2013, up from 927,000 barrels per
day during the first six months of last year. AAR data do not differentiate between crude
oil and petroleum products, but it is generally believed that most of the volume being
moved in the 2006-10 period was petroleum products and most of the increase since

18
Attachment 2
then has been crude oil. Crude oil accounts for about half of those 2013 daily volumes,
according to AAR.
The roughly 700,000 barrels per day of crude oil, which includes both imported and
domestic crude oil, moved by rail compares with the 7.2 million barrels of crude oil the
United States produces daily, based on the latest 2013 monthly output numbers from the
U.S. Energy Information Administration.
The jump in crude oil production from North Dakota, where there is not enough pipeline
capacity to move supplies, accounts for a large share of the increased deliveries of oil
by rail. North Dakota is the second largest oil producing state after Texas, as advanced
drilling technology has unlocked millions of barrels of tight oil in the Bakken
Shale formation.
More Bakken crude oil moving to market by rail has helped narrow the difference
between the spot prices for Bakken crude oil and international benchmark Brent crude
oil in recent months to its smallest gap—less than $5 per barrel—in more than one-and-
half years. The narrower spread reduces the incentive to ship oil to coastal refineries.
This development, along with the lack of railcars (some estimates cite a 60,000 car
backlog) may explain the slower growth shown in 2013 carload data. Source: U.S. Energy Information Administration, based on Bloomberg.
Note: The chart above uses Dated Brent for comparison among the crude oil prices. Dated Brent
is a market term for a cargo of North Sea Brent blend crude oil that has been assigned a date
when it will be loaded onto a tanker.
tags: Bakken , Brent , Liquid Fuels , Oil/Petroleum , Rail

19