statement of taskiogcc.ok.gov/.../generalsession-economides-2017.pdftask force membership christine...
TRANSCRIPT
1
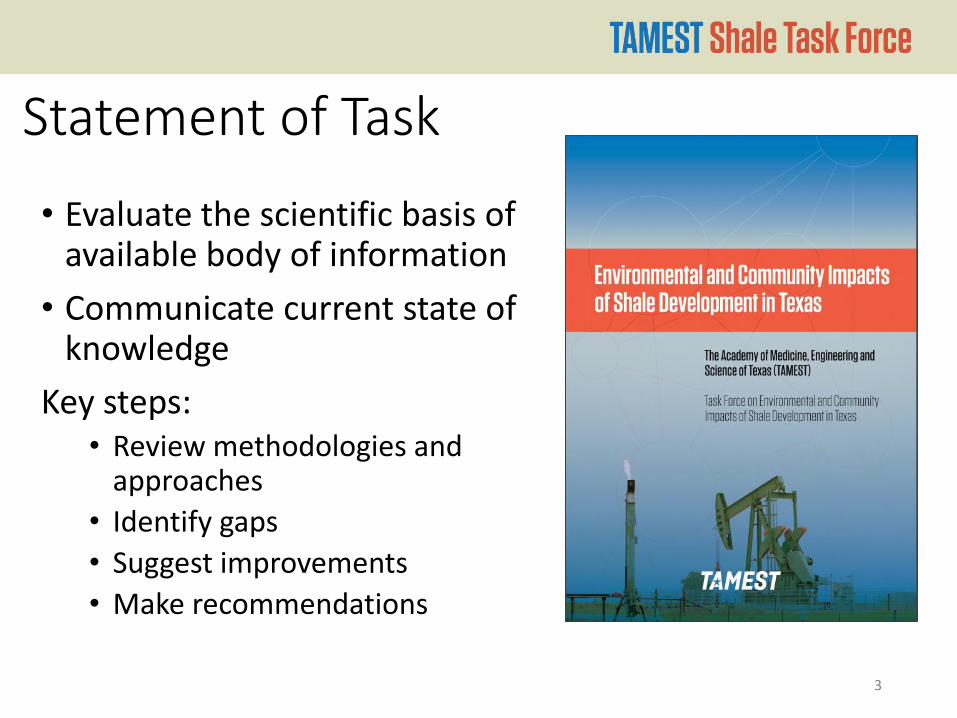
Statement of Task
• Evaluate the scientific basis of available body of information
• Communicate current state of knowledge
Key steps: • Review methodologies and
approaches
• Identify gaps
• Suggest improvements
• Make recommendations
3

Task Force Membership Christine Ehlig-Economides – Chair
Air Land Water
David Allen – Lead Melinda Taylor – Lead Danny Reible – Lead
Ramón Alvarez Joseph Fitzsimons Denny Bullard
Matthew Harrison Tracy Hester Michael Young
Seismicity
Transportation
Economic/Social
Brian Stump – Lead John Barton – Lead Gene Theodori – Lead
Kris J. Nygaard Cesar Quiroga Omar Garcia
Craig Pearson General
Urs Kreuter
Amelie G. Ramirez
4
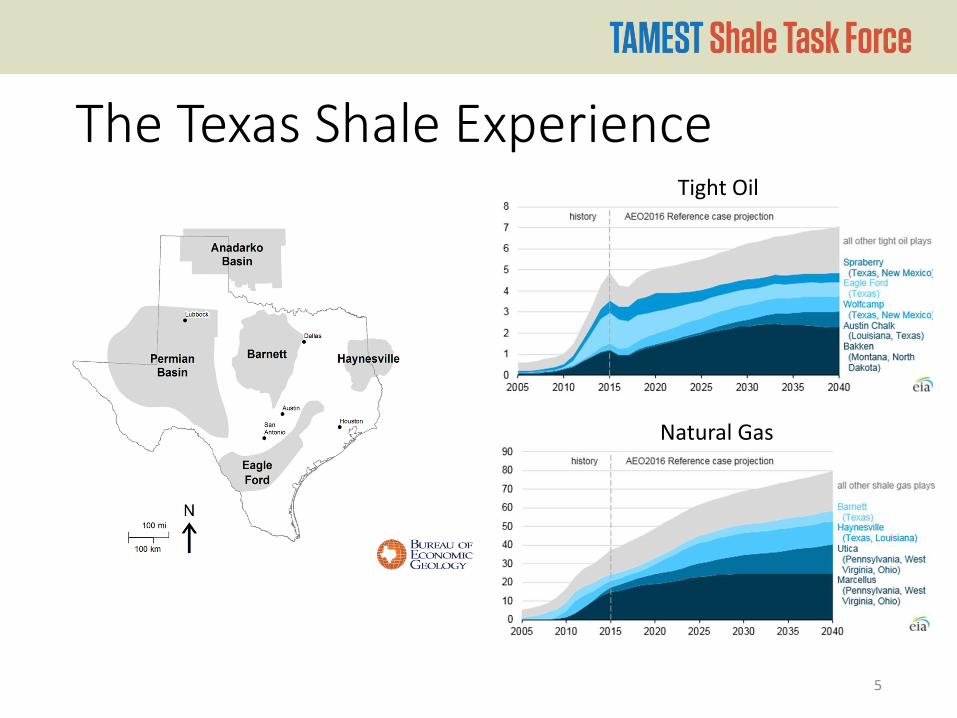
The Texas Shale Experience
5
Tight Oil
Natural Gas
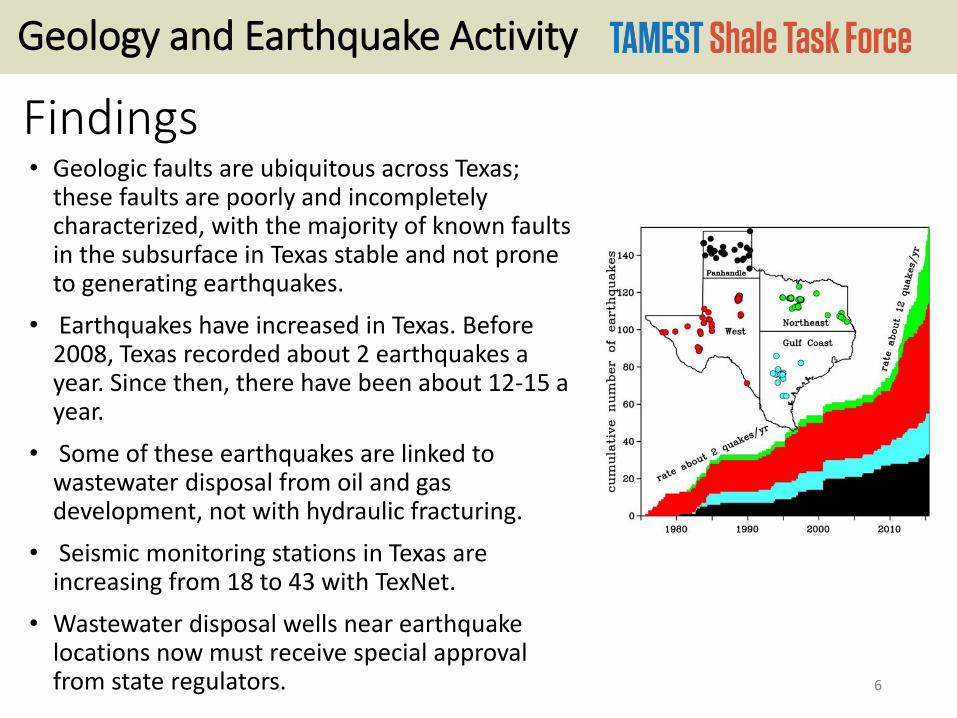
• Geologic faults are ubiquitous across Texas; these faults are poorly and incompletely characterized, with the majority of known faults in the subsurface in Texas stable and not prone to generating earthquakes.
• Earthquakes have increased in Texas. Before 2008, Texas recorded about 2 earthquakes a year. Since then, there have been about 12-15 a year.
• Some of these earthquakes are linked to wastewater disposal from oil and gas development, not with hydraulic fracturing.
• Seismic monitoring stations in Texas are increasing from 18 to 43 with TexNet.
• Wastewater disposal wells near earthquake locations now must receive special approval from state regulators.
6
Geology and Earthquake Activity
Findings
Geology and Earthquake Activity
Recommendations
• Future geologic and seismological research initiatives should develop improved and transparent approaches that seek to balance concerns surrounding data handling and sharing, and that promote sharing of data.
• Development of a common data platform and standardized data formats could enable various entities collecting data to contribute to better data integration. It also could facilitate interdisciplinary collaboration directed toward mitigation and avoidance of induced seismicity.
• The TexNet goals address an integrated research portfolio that considers seismicity analysis, geologic characterization, fluid-flow modeling, and geomechanical analysis.
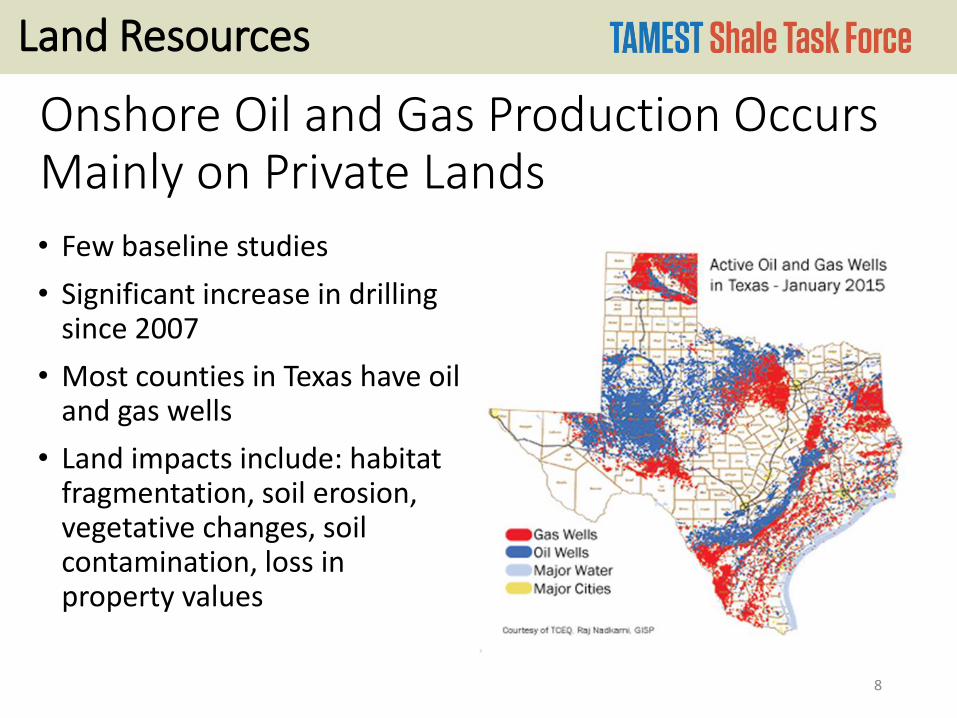
Onshore Oil and Gas Production Occurs Mainly on Private Lands
• Few baseline studies
• Significant increase in drilling since 2007
• Most counties in Texas have oil and gas wells
• Land impacts include: habitat fragmentation, soil erosion, vegetative changes, soil contamination, loss in property values
8
Land Resources

Impacts to Natural Resources of Texas: Fragmentation
• 1.5-3.1 hectares cleared for every well pad
• 26,000 well permits issued in 2014
• Pipelines, roads add to fragmentation
• Effects of fragmentation are not well understood
9
Land Resources
The most comprehensive endangered species data exists for Dunes Sagebrush Lizard and Lesser Prairie Chicken
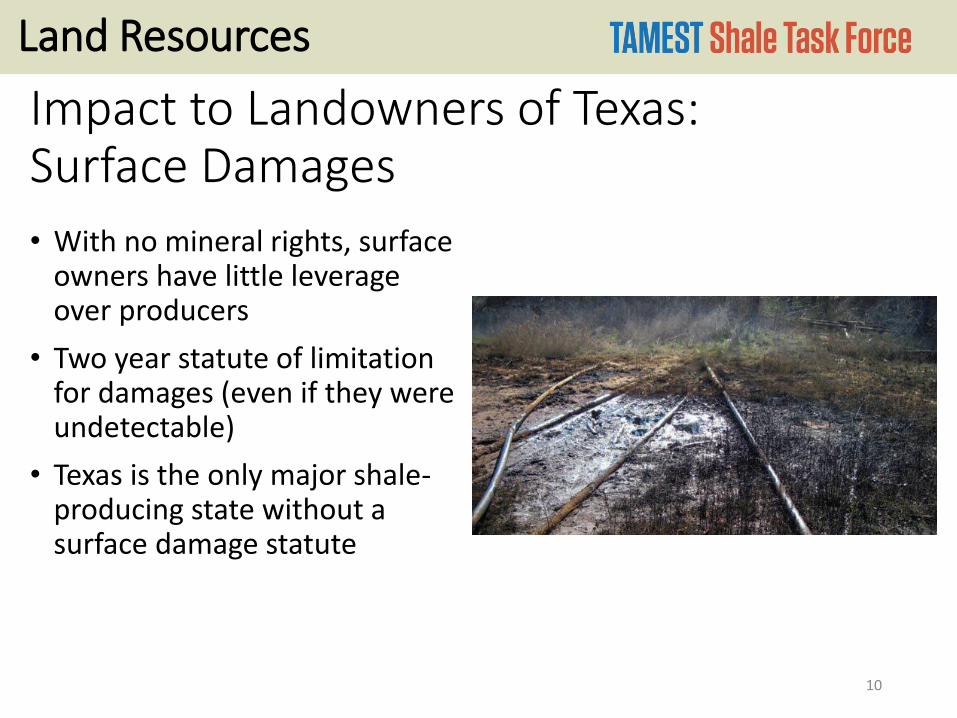
Impact to Landowners of Texas: Surface Damages
• With no mineral rights, surface owners have little leverage over producers
• Two year statute of limitation for damages (even if they were undetectable)
• Texas is the only major shale-producing state without a surface damage statute
10
Land Resources
Recommendations
• Characterize baseline land and habitat conditions.
• Track changes to wildlife populations and vegetation.
• Study effectiveness of voluntary programs to conserve at-risk species.
• Consider options for incentives to conserve at-risk species and reduce effects on land resources by oil and gas development activities.
• Advantages and disadvantages of adopting a surface damages act.
• Make existing, nonproprietary information about land impacts collected and evaluated by multiple state and federal agencies available online to the public.
11
Land Resources
12
Air Quality
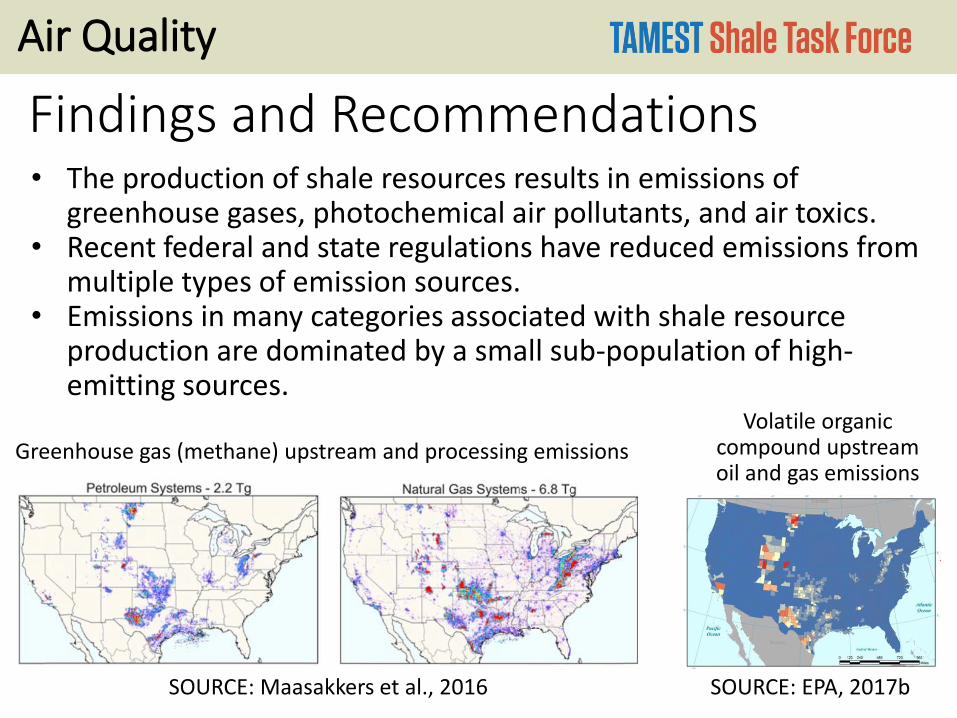
• The production of shale resources results in emissions of greenhouse gases, photochemical air pollutants, and air toxics.
• Recent federal and state regulations have reduced emissions from multiple types of emission sources.
• Emissions in many categories associated with shale resource production are dominated by a small sub-population of high-emitting sources.
Findings and Recommendations
Greenhouse gas (methane) upstream and processing emissions
Volatile organic compound upstream oil and gas emissions
SOURCE: Maasakkers et al., 2016 SOURCE: EPA, 2017b
13
Air Quality
• Development of inexpensive, robust, reliable, and accurate methods of rapidly finding high-emitting sources has the potential to reduce emissions.
• Shale resource development both directly and indirectly impacts air quality. Indirect impacts include reductions in emissions associated with the substitution of natural gas for coal in electricity generation. Comprehensive assessments of both direct and indirect impacts to air quality from the production of shale resources are complex.
• There is limited information concerning exposures to air toxics emissions and their corresponding health impacts. Targeted research in this area should be conducted.
Findings and Recommendations
Water Use for Hydraulic Fracturing
• Life cycle water use for shale oil and gas is typically substantially less than life cycle water use for other forms of energy (e.g. coal, nuclear and biofuels)
• Statewide, total freshwater use for shale oil and gas is <1% of total statewide freshwater use. Future use likely to decrease as brackish and produced water use increases
• Locally, freshwater use can be significant, particularly in rural counties without large amounts of municipal or agricultural freshwater use
• Use of brackish and produced water can substantially reduce the impact of shale development on freshwater resources
14
Water Quantity and Quality

Hydraulic Fracturing is Unlikely to Directly Impact Drinking Water Resources
• Fracturing is typically far removed from drinking water aquifers
• Indirect impacts due to spills and leaks of saline water at the surface more likely a cause for concern
Fisher and Warpinski, 2012, SPE
15
Water Quantity and Quality
Image of mapped fractures in Barnet Shale
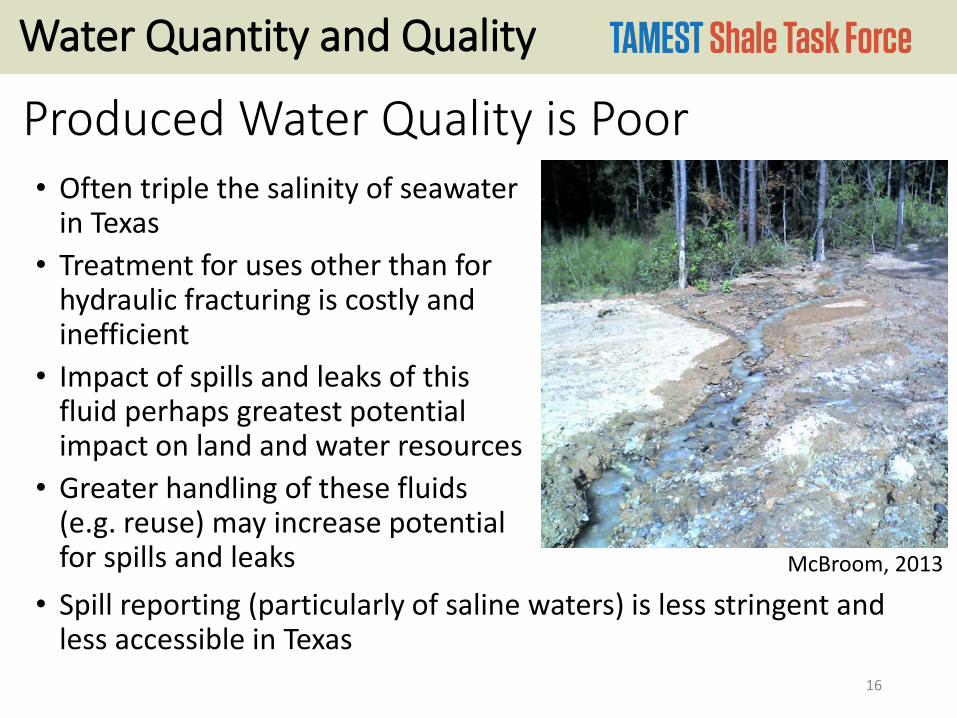
Produced Water Quality is Poor • Often triple the salinity of seawater
in Texas
• Treatment for uses other than for hydraulic fracturing is costly and inefficient
• Impact of spills and leaks of this fluid perhaps greatest potential impact on land and water resources
• Greater handling of these fluids (e.g. reuse) may increase potential for spills and leaks
McBroom, 2013
• Spill reporting (particularly of saline waters) is less stringent and less accessible in Texas
16
Water Quantity and Quality

Recommendations • Use of water resources—other than freshwater—should be
encouraged through operational changes, research and regulatory enhancements. Effectiveness of these efforts should be monitored.
• Brackish water resources should be better understood and, where appropriate, exploited for municipal, agricultural, and industrial uses.
• Spill and leak reporting and tracking should be improved to aid identification, and to correct recurring causes and improve best management practices.
17
Water Quantity and Quality
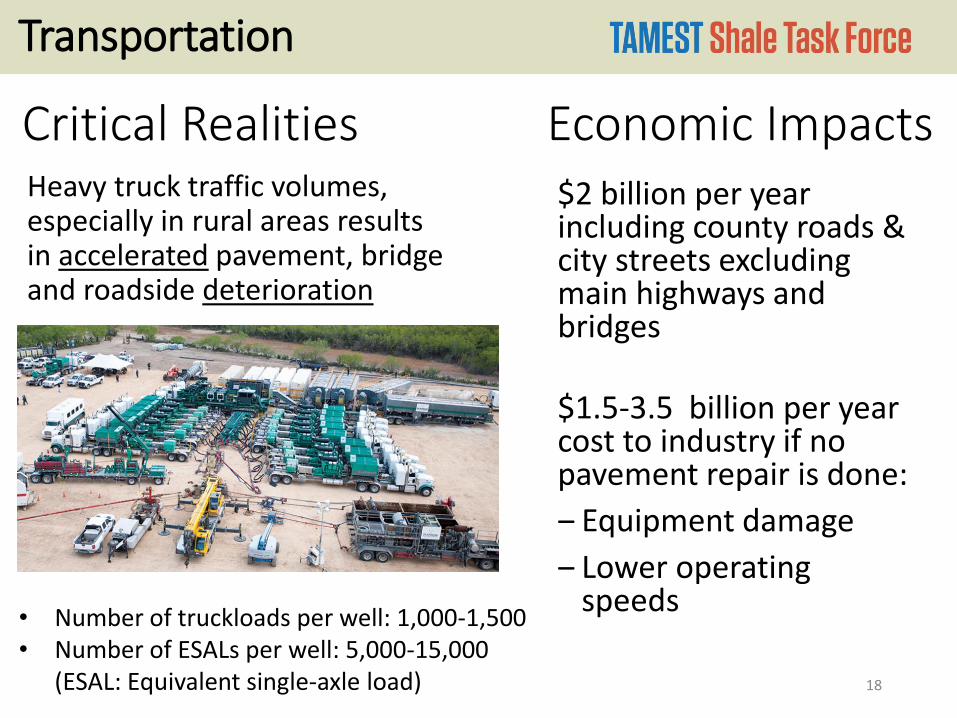
Critical Realities Heavy truck traffic volumes, especially in rural areas results in accelerated pavement, bridge and roadside deterioration
18
• Number of truckloads per well: 1,000-1,500 • Number of ESALs per well: 5,000-15,000
(ESAL: Equivalent single-axle load)
Transportation
Economic Impacts $2 billion per year including county roads & city streets excluding main highways and bridges
$1.5-3.5 billion per year cost to industry if no pavement repair is done:
‒ Equipment damage
‒ Lower operating speeds
Traffic Safety Impacts
Dramatic increase in crash rates: • 52-61% increase in the total number of crashes
• 57-77% increase in the number of fatal, incapacitating, and non-incapacitating crashes
• 76-88% increase in the number of fatal crashes [CMV crashes in rural areas in the Eagle Ford Shale and Permian Basin regions for the 4 year periods of 2006-2009 to 2010-2013]
Dramatic increase in crash-related costs $50-$150 million per year
19
Transportation
Key Findings • Current technologies for oil and gas development and
production from shale formations require extremely large volumes of heavy truckloads
• Most existing roadways and bridges were not designed to carry/accommodate energy sector truckloads
• Truck traffic associated with the development and production of oil and gas from shale formations has resulted in severe traffic crash increases
• Funding to address the impacts to the transportation infrastructure and traffic safety in energy sector areas is very low relative to the magnitude of the impact
20
Transportation
Recommendations The following strategies will improve preparedness of the state’s transportation systems for oil and gas development and production in the future:
Improve availability and quality of data related to ongoing and forecasted drilling activities
Develop integrated, multimodal transportation infrastructure strategies and solutions
Identify provisions for reliable, sustainable funding for proactively preparing the state’s transportation infrastructure for future drilling activities
21
Transportation
Findings – Economic Impacts • Shale energy development primarily contributes positively
to local, regional, and state economies, but not all economic effects have been positive.
• Limited published data exist on the net economic benefits and costs of shale energy development to the institutions and residents in Texas counties and communities.
• Public school districts and universities across Texas benefit substantially from the taxes and royalty revenue paid by the oil and gas industry.
• Economic benefits associated with oil and gas development are unevenly distributed across public schools and universities.
22
Economic and Social Impacts
Findings – Social Impacts • Community leaders and residents in Texas tend to appreciate
and welcome the economic and service-related benefits that accompany shale energy development, whereas they tend to dislike certain social and/or environmental effects that accompany it.
• Traffic-related issues—including increased truck traffic, traffic accidents, and traffic congestion—are of primary concern to leaders and residents in and around communities experiencing shale development.
• The oil and gas industry is viewed as a relatively trustworthy source for information on shale development and hydraulic fracturing.
23
Economic and Social Impacts
Findings – Social Impacts • The more negatively shale energy development is perceived—
particularly with respect to the social and environmental consequences—the more likely local residents are to engage in behaviors opposing increased shale development.
• Decisions regarding setback distances in Texas are established at the municipal level.
• Shale development has the potential to disproportionately affect certain segments of the population.
24
Economic and Social Impacts
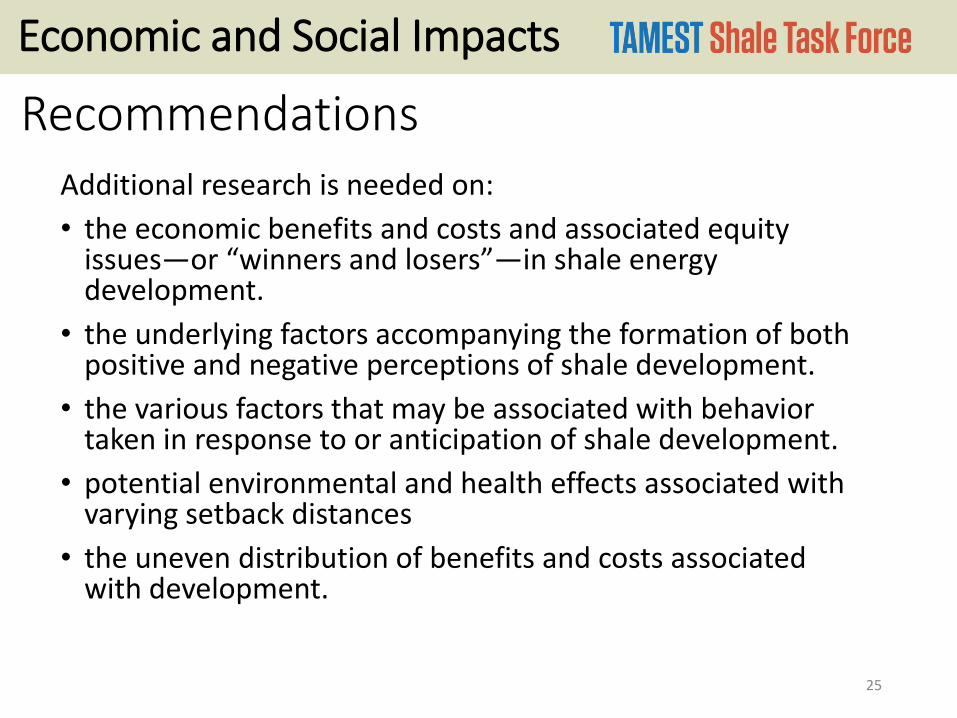
Recommendations Additional research is needed on:
• the economic benefits and costs and associated equity issues—or “winners and losers”—in shale energy development.
• the underlying factors accompanying the formation of both positive and negative perceptions of shale development.
• the various factors that may be associated with behavior taken in response to or anticipation of shale development.
• potential environmental and health effects associated with varying setback distances
• the uneven distribution of benefits and costs associated with development.
25
Economic and Social Impacts
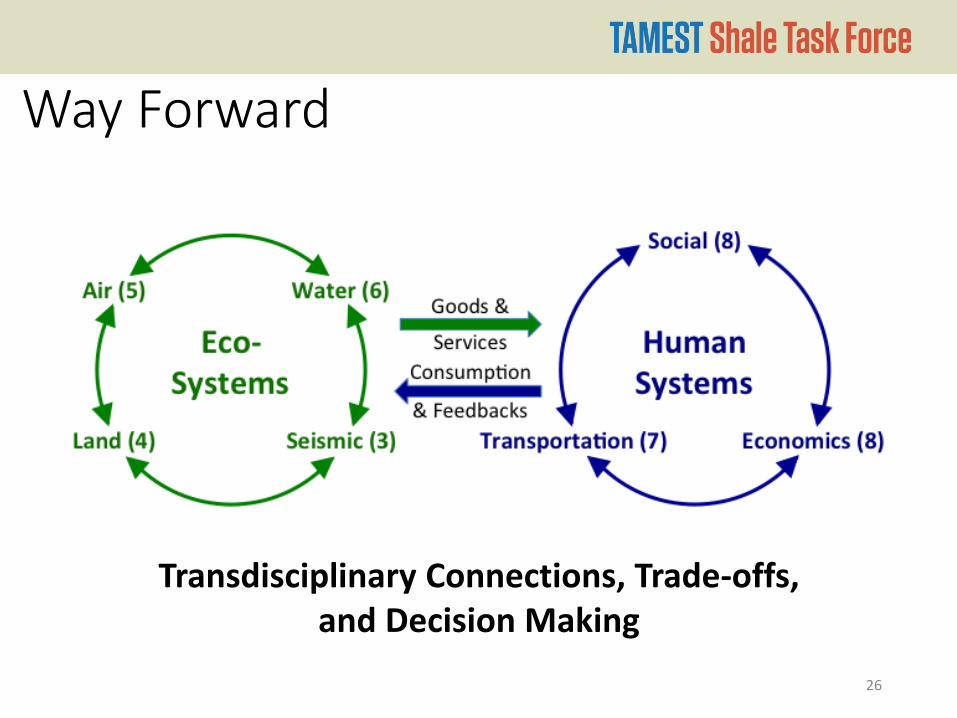
Way Forward
26
Transdisciplinary Connections, Trade-offs, and Decision Making