statewide report card 2017-2018 - eric
TRANSCRIPT

Colt Gill, Director of the Department
of Education www.oregon.gov/ode
An Annual Report to
the Legislature on
Oregon Public Schools
Statewide Report Card
2017-2018

The Oregon Statewide Report Card is an annual publication required by law (ORS 329.115), which reports on the state of public schools and their progress towards the goals of the Oregon Educational Act for the 21st Century. The purpose of the Oregon Report Card is to monitor trends among school districts and Oregon’s progress toward achieving the goals referred to in ORS 329.015. In addition, this report provides a tool that makes education data accessible to researchers, media, students and parents and creates a clear, complete and factual picture of the state of education in Oregon. The Oregon Department of Education (ODE) also publishes an Annual Performance Progress Report (APPR) which describes ODE's yearly progress in fulfilling its mission to increase achievement for all students. The APPR tracks performance on each of ODE's key performance measures, which monitor ODE's work pertaining to the Oregon K-12 education enterprise and ODE's internal operational efficiency.
Published November 30, 2018
The 2017-18 Oregon Statewide Report Card was produced by the Oregon Department of Education
for distribution to Oregon state and federal legislators, public schools, school districts, education service districts, and members of the public.
The Oregon Statewide Report Card is also posted on the Department of Education’s website.
The Oregon Department of Education hereby gives permission to
reproduce and distribute any or all of this document.
It is the policy of the State Board of Education and a priority of the Oregon Department of Education that there will be no discrimination or harassment on the grounds of race, color, religion, sex, sexual orientation, national origin, marital status, age or disability in any educational programs, activities, or employment. Persons having questions about equal
opportunity and nondiscrimination should contact the Deputy Superintendent of Public Instruction at the Oregon Department of Education.
Acknowledgements Oregon Department of Education
Cindy Hunt, Chief of Staff Jon Wiens, Director, Accountability Reporting
Beth Blumenstein, Research Analyst, Accountability Reporting Josh Rew, Education Program Specialist (Psychometrics/Measurement)
Cindy Barrick, Research Analyst, Accountability Reporting Elyse Bean, Research Analyst, Accountability Reporting
Surbhi Singh, Administrative Specialist, Accountability Reporting Marc Siegel, Communications Director
Alternative Education ........................................................................................................... Jeremy A. Wartz Measures of Interim Progress (MIP) and Assessment ............................................................... Cindy Barrick Career and Technical Education ............................................................................................ Lauren Dressen Charter Schools ......................................................................................................................... Kate Pattison Cover Page Design.............................................................................................................. Beth Blumenstein Diploma Requirements ............................................................................................................ Jamie Rumage Discipline Incidents .................................................................................................................... Lisa Bateman Enrollment and Membership .................................................................................................... Robin Stalcup English Learners .............................................................................................................................. Kim Miller Essential Skills .. ..................................................................................................................... Cristen McLean Finance & School Funding .......................................................................................................... Brian Reeder Free & Reduced Price Lunch ........................................................................ Heidi Dupuis and Jeremy Eaton Graduates and Dropouts .................................................................................................... Beth Blumenstein Homeless Students ......................................................................................................................... Dona Bolt NAEP Test Results ....................................................................................................................... Beth LaDuca Persistently Dangerous Schools ................................................................................................. Lisa Bateman Pre-Kindergarten & Early Childhood ..................................................................................... Michael Connor School & District Report Cards ........................................................................................................ Jon Wiens School and District Staff Data ................................................................Brian Reeder and Beth Blumenstein Special Education ...................................................................................................................... Jackie McKim Talented and Gifted (TAG) .......................................................................................................... Angela Allen

Oregon achieves . . . together!
Colt Gill Director of the Oregon Department of Education
255 Capitol St NE, Salem, OR 97310 | Voice: 503-947-5600 | Fax: 503-378-5156 | www.oregon.gov/ode
Dear Oregonians,
I am pleased to present the 2017-18 edition of the Oregon Statewide Report Card. This annual report is a snapshot of our state’s education system that includes important statewide data about our students, teachers and schools. Education is the key to moving our state forward, and the information in this report provides a clear overview of the challenges we face and the opportunities for excellence ahead of us. The 2017-18 Statewide Report Card includes:
Graduation and dropout rates
Early childhood data
Attendance and regular attender data
Student demographics and information on specific student groups
School funding and staff information
Assessment results
Charter school data
Information on alternative education programs
Highlights of the 2017-18 School Year Oregonians have much to be proud of from 2017-2018: developing Oregon’s Plan in response to the Every Student Succeeds Act; working with communities to redesign school and district “At-A-Glance” profiles; additional supports to improve high school success through Career Technical Education (CTE), access to college-credit classes and dropout prevention programs; higher rates of gender equity in school administration; and a move forward toward a more balanced assessment system. Developing Oregon’s Plan From its inception, Oregon’s Plan was designed to capture and reflect the voices of Oregonians. Grounded in extensive engagement efforts with thousands of Oregonians, including schools and districts, families and communities, tribal leaders and policymakers, Oregon’s Plan provides a co-created focus on four key commitments:
Prioritizing and advancing equity
Promoting access to a well-rounded education
Strengthening district systems
Fostering ongoing engagement with education partners
The key commitments within Oregon’s Plan serve as levers to strengthen and shape our educational system.
Redesigning School and District Profiles The Oregon Department of Education (ODE) redesigned “At-A-Glance” school and district profiles. These profiles are a meaningful tool to discuss school performance with parents, community members and school boards.
Gender Equity in School Administration Gender diversity among school administrators continues to increase. The 2016-2017 school year marked the first year that more than 50 percent of Oregon’s principals identified as women and in 2017-2018, that number rose to 53 percent.

Oregon Department of Education 255 Capitol St NE, Salem, OR 97310 | Voice: 503-947-5600 | Fax: 503-378-5156 | www.oregon.gov/ode
www.oregon.gov/ode www.oregon.gov/ode
High School Success The High School Success fund was established in law in 2016 to “improve students’ progress toward graduation beginning with grade 9, increase the graduation rates of high schools and improve high school graduates’ readiness for college or career.” It provides $170 million for the 2017-2019 biennium in direct funding to more than 250 districts, charter schools, youth corrections and juvenile detention education programs. Recipients were required to direct funds toward establishing or expanding:
Career and technical education programs in high schools
College-level educational opportunities for students in high schools
Dropout-prevention strategies in high schools
A Balanced Assessment System End-of-year assessments give us a snapshot of student learning. Overall, scores remain largely flat as compared to previous years, although the results show gains in English Language Arts (ELA) over the previous year. Participation is also down in all student groups. In order to improve student outcomes, ODE is supporting the implementation of local formative assessment practices and the systematic use of interim/benchmark assessments. These tools provide immediate feedback on student learning and help teachers make daily instructional decisions to better support student learning.
Sincerely,
Colt Gill Director
TABLE OF CONTENTS
OREGON STUDENTS .......................................................................................................................................................................... 1
OREGON PUBLIC SCHOOL ENROLLMENT .......................................................................................................................................................... 1 STATEWIDE STUDENT-TEACHER RATIOS .......................................................................................................................................................... 1 PERCENT OF OREGON SCHOOL DISTRICTS BY SIZE OF STUDENT ENROLLMENT ......................................................................................................... 1 OREGON PUBLIC CHARTER SCHOOL ENROLLMENT ............................................................................................................................................ 2 OREGON PUBLIC CHARTER SCHOOL PERFORMANCE .......................................................................................................................................... 3 HOMELESS STUDENTS IN OREGON ................................................................................................................................................................. 4 HOMELESS STUDENT COUNTS ....................................................................................................................................................................... 5 HOMELESS STUDENT PERFORMANCE .............................................................................................................................................................. 6 MCKINNEY-VENTO SUBGRANT PROJECTS ........................................................................................................................................................ 7 CLASS SIZE ................................................................................................................................................................................................ 8 DIVERSE STUDENT POPULATIONS ................................................................................................................................................................... 9 LANGUAGE DIVERSITY ............................................................................................................................................................................... 10 STUDENTS AND TEACHERS OF COLOR............................................................................................................................................................ 11
OREGON STAFF ................................................................................................................................................................................ 12
PERCENTAGE OF POSITIONS HELD BY WOMEN ............................................................................................................................................... 12 ALL SCHOOL STAFF ................................................................................................................................................................................... 13 ANNUAL INSTRUCTIONAL HOURS ................................................................................................................................................................. 13 HISTORICAL SALARY CHARTS ....................................................................................................................................................................... 14
SCHOOL FUNDING ........................................................................................................................................................................... 16
SCHOOL RESOURCES ................................................................................................................................................................................. 16 STUDENT ENROLLMENT ............................................................................................................................................................................. 17 HISTORY OF SCHOOL FUNDING RESPONSIBILITY IN OREGON .............................................................................................................................. 18 OPERATING REVENUES BY SOURCE (HISTORICAL) ............................................................................................................................................ 19
ELEMENTARY AND SECONDARY EDUCATION ACT ........................................................................................................................... 20
FEDERAL PROGRAMS ................................................................................................................................................................................. 20 THE EVERY STUDENT SUCCEEDS ACT (ESSA) – UNSAFE SCHOOL CHOICE OPTION ................................................................................................. 21 DISCIPLINE INCIDENTS BY GRADE LEVEL ......................................................................................................................................................... 21 DISCIPLINE INCIDENTS BY STUDENT GROUP.................................................................................................................................................... 22
SCHOOL AND DISTRICT ACCOUNTABILITY ........................................................................................................................................ 23
NUMBER OF SCHOOLS IDENTIFIED FOR SUPPORT, BY YEAR ................................................................................................................................ 23
MEASURES OF INTERIM PROGRESS ................................................................................................................................................. 24
INDICATORS ............................................................................................................................................................................................. 24 ENGLISH LANGUAGE ARTS ACADEMIC ACHIEVEMENT DETAILS ........................................................................................................................... 25 ENGLISH LANGUAGE ARTS ACADEMIC GROWTH DETAILS.................................................................................................................................. 28 REGULAR ATTENDERS DETAILS .................................................................................................................................................................... 30 9TH GRADE ON-TRACK DETAILS ................................................................................................................................................................... 31 FOUR-YEAR COHORT GRADUATION DETAILS .................................................................................................................................................. 32 FIVE-YEAR COMPLETERS DETAILS ................................................................................................................................................................ 32 ON TRACK TO ENGLISH LANGUAGE PROFICIENCY (ELP) DETAILS ........................................................................................................................ 33 ENGLISH LANGUAGE ARTS PARTICIPATION DETAILS ......................................................................................................................................... 34 MATHEMATICS PARTICIPATION DETAILS ........................................................................................................................................................ 34 ASSESSMENT NON-PARTICIPATION ............................................................................................................................................................... 37
STUDENT SUCCESS ........................................................................................................................................................................... 38
SCORES REQUIRED TO MEET ACHIEVEMENT LEVELS ON STATEWIDE ASSESSMENTS (CUT SCORES) ............................................................................. 38 STUDENT PERFORMANCE IN 2017-18 .......................................................................................................................................................... 39 GRADE 3 ................................................................................................................................................................................................. 39 GRADE 4 ................................................................................................................................................................................................. 39

GRADE 5 ................................................................................................................................................................................................. 39 GRADE 6 ................................................................................................................................................................................................. 40 GRADE 7 ................................................................................................................................................................................................. 40 GRADE 8 ................................................................................................................................................................................................. 40 HIGH SCHOOL .......................................................................................................................................................................................... 41
NATIONAL COMPARISON OF STUDENT ACHIEVEMENT ................................................................................................................... 42
NATIONAL ASSESSMENT OF EDUCATIONAL PROGRESS: READING ....................................................................................................................... 43 NATIONAL ASSESSMENT OF EDUCATIONAL PROGRESS: MATHEMATICS ............................................................................................................... 46 NATIONAL ASSESSMENT OF EDUCATIONAL PROGRESS: SCIENCE ........................................................................................................................ 49
FREE AND REDUCED PRICE LUNCH ................................................................................................................................................... 52
THE OREGON DIPLOMA ................................................................................................................................................................... 53
PERSONALIZED LEARNING ........................................................................................................................................................................... 53 9TH GRADE ON-TRACK ............................................................................................................................................................................... 54 ESSENTIAL SKILLS ...................................................................................................................................................................................... 55
OREGON GRADUATION RATES ........................................................................................................................................................ 57
COHORT GRADUATION RATES OVER TIME (ALL STUDENTS) .............................................................................................................................. 57 OREGON CAREER AND TECHNICAL EDUCATION (CTE) INFORMATION: 2017 GRADUATION RESULTS ........................................................................ 59
DROPOUT RATES ............................................................................................................................................................................. 60
OREGON STATEWIDE DROPOUT RATE CALCULATION ....................................................................................................................................... 60 OREGON HIGH SCHOOL DROPOUT RATES ..................................................................................................................................................... 60 OREGON DROPOUT RATES BY GENDER ......................................................................................................................................................... 61 DROPOUT RATES BY RACE/ETHNICITY AND GENDER ........................................................................................................................................ 61
REGULAR ATTENDERS ...................................................................................................................................................................... 62
STATEWIDE PERCENT REGULAR ATTENDERS ................................................................................................................................................... 62 PERCENT REGULAR ATTENDERS ................................................................................................................................................................... 63
SPECIAL PROGRAMS ........................................................................................................................................................................ 64
SPECIAL EDUCATION.................................................................................................................................................................................. 64 EARLY CHILDHOOD - OREGON HEAD START PRE-KINDERGARTEN PROGRAM ........................................................................................................ 66 TALENTED AND GIFTED .............................................................................................................................................................................. 67 ALTERNATIVE EDUCATION PROGRAMS .......................................................................................................................................................... 68
RESOURCES ..................................................................................................................................................................................... 71
Oregon Statewide Report Card 2017-18 1 Oregon Department of Education https://www.oregon.gov/ode Contact for this section: Beth Blumenstein, 503-947-5767, [email protected]
OREGON STUDENTS
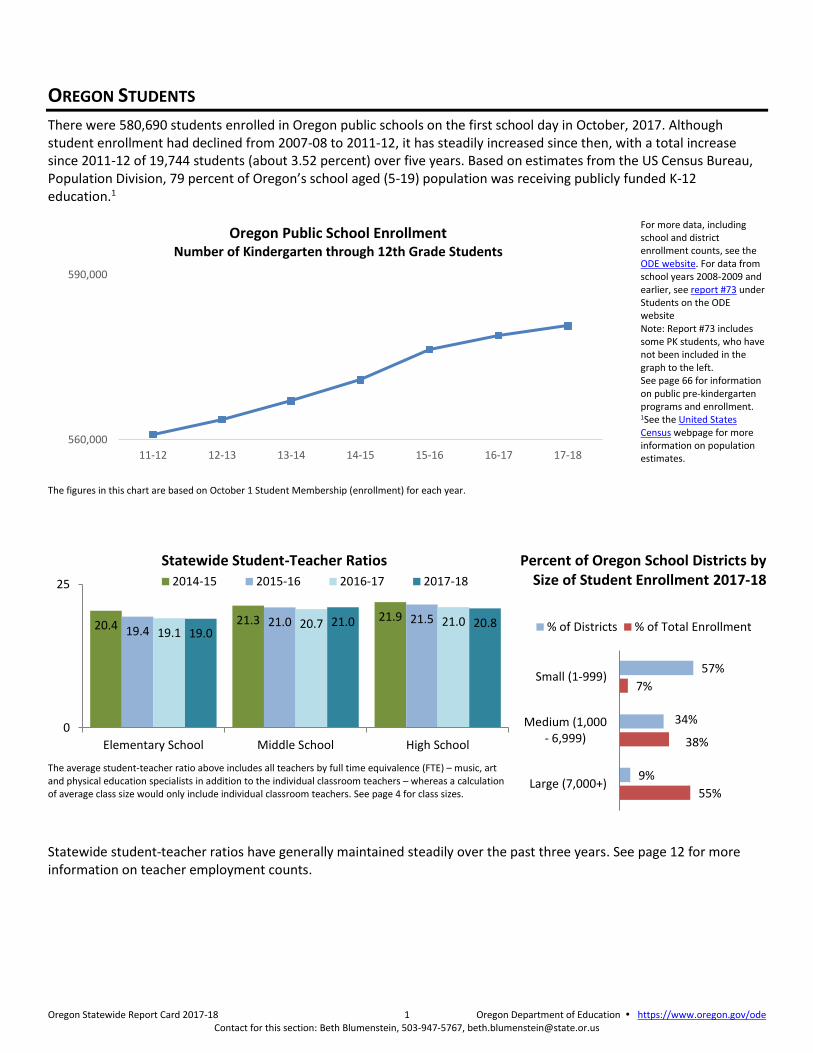
There were 580,690 students enrolled in Oregon public schools on the first school day in October, 2017. Although student enrollment had declined from 2007-08 to 2011-12, it has steadily increased since then, with a total increase since 2011-12 of 19,744 students (about 3.52 percent) over five years. Based on estimates from the US Census Bureau, Population Division, 79 percent of Oregon’s school aged (5-19) population was receiving publicly funded K-12 education.1
Oregon Public School Enrollment Number of Kindergarten through 12th Grade Students
The figures in this chart are based on October 1 Student Membership (enrollment) for each year.
For more data, including school and district enrollment counts, see the ODE website. For data from school years 2008-2009 and earlier, see report #73 under Students on the ODE website Note: Report #73 includes some PK students, who have not been included in the graph to the left. See page 66 for information on public pre-kindergarten programs and enrollment. 1See the United States Census webpage for more information on population estimates.
Statewide Student-Teacher Ratios
The average student-teacher ratio above includes all teachers by full time equivalence (FTE) – music, art and physical education specialists in addition to the individual classroom teachers – whereas a calculation of average class size would only include individual classroom teachers. See page 4 for class sizes.
Percent of Oregon School Districts by Size of Student Enrollment 2017-18
Statewide student-teacher ratios have generally maintained steadily over the past three years. See page 12 for more information on teacher employment counts.
560,000
590,000
11-12 12-13 13-14 14-15 15-16 16-17 17-18
20.4 21.3 21.919.4
21.0 21.519.1
20.7 21.019.0
21.0 20.8
0
25
Elementary School Middle School High School
2014-15 2015-16 2016-17 2017-18
57%
34%
9%
7%
38%
55%
Small (1-999)
Medium (1,000- 6,999)
Large (7,000+)
% of Districts % of Total Enrollment

Oregon Statewide Report Card 2017-18 2 Oregon Department of Education https://www.oregon.gov/ode Contact for this section: Kate Pattison, 503-580-5749, [email protected]
Oregon Public Charter School Enrollment Charter school enrollment has risen from 1.7 percent of the total public school enrollment in 2006-07 and now represents 5.8 percent of enrolled students. Charter schools, authorized by legislation in 1999, were designed to create new, innovative and more flexible ways of educating all children within the public school system. In Oregon, all charter schools are public schools. In the 2017-18 school year, there were 127 charter schools. The average charter school enrolled about 267 students.
Charter School Enrollment Counts and Percent of Total Public School Enrollment
Fall Membership Data Collection
In 2015-16, the Oregon Department of Education began tracking virtual status for all schools. In 2017-18, a total of 15 charter schools (12 percent of all charters) identified themselves as fully or primarily virtual, as compared to about 1 percent of non-charter schools. This relatively small number of virtual charters enrolled 33 percent of all charter school students, however, as compared to less than 1 percent of non-charter students who were enrolled in non-charter virtual schools.
Charter School Enrollment by Ethnicity 2017-18
Source: Fall Membership 2017-18 Note: Multi-Racial does not include students who reported Hispanic Ethnicity – those students are all reported under Hispanic. See the Federal Race and Ethnicity Reporting Assistance Manual for more information.
24,20527,070
28,581 29,883 30,72832,323
33,677
(4.3%)(4.8%)
(5.0%) (5.2%) (5.3%)(5.6%) (5.8%)
0
10,000
20,000
30,000
40,000
Nu
mb
er
of
Stu
de
nts
(P
erc
en
t o
f To
tal)
75.8%
1.6%
12.4%
2.0% 0.3% 1.6%6.4%
57.1%
2.1%
22.0%
3.9%0.7% 1.2%
5.7%
0.0%
50.0%
100.0%
White Black Hispanic Asian Pacific Islander AmericanIndian/ Alaska
Native
Multi-Racial
Charter Schools Non-Charter Schools

Oregon Statewide Report Card 2017-18 3 Oregon Department of Education https://www.oregon.gov/ode Contact for this section: Kate Pattison, 503-580-5749, [email protected]
Oregon Public Charter School Performance In 2014-15, we replaced our previous state tests in reading, writing and mathematics with the new Smarter Balanced assessments in English Language Arts (ELA) and mathematics. Results on these assessments cannot be compared to results on previous state tests. For ELA and mathematics, levels 3 and 4 are considered proficient for purposes of state and federal accountability.
Note: Each year above includes the schools that were operating charter schools in that year.
56.4 55.254.6 53.656.7 54.9
0
20
40
60
Charter Schools State
Pe
rce
nt
Leve
l 3 o
r 4
ELA: Percent (Students) Level 3 or 4
2015-16 2016-17 2017-18
37.441.5
36.640.8
35.740.5
0
20
40
60
Charter Schools State
Pe
rce
nt
Leve
l 3 o
r 4
Mathematics: Percent (Students) Level 3 or 4
2015-16 2016-17 2017-18

Oregon Statewide Report Card 2017-18 4 Oregon Department of Education https://www.oregon.gov/ode Contact for this section: Dona Bolt, 503-947-5781, [email protected]
Homeless Students in Oregon The right of homeless children and youth to have equal access to the same free, appropriate public education provided to other children is ensured under the federal McKinney-Vento Homeless Assistance Act, Subtitle VII-B, Education of Homeless Children and Youth Program, enacted in 1987. Students qualify for McKinney-Vento Homeless Program assistance when they reside in living situations that are not fixed, regular, and/or adequate. The Act requires that every district designate a Homeless Liaison to identify and provide services to homeless students and to contribute to the annual data collection on preschool (ages 3-5) through grade 12 public school-enrolled homeless children and youth. The Education of Homeless Children and Youth Program works to ensure that school age-eligible homeless children and youth are provided with immediate school enrollment and access to education services, despite lack of a permanent residence, a supervising parent or legal guardian or lack of records from a previous school. To reduce frequent school changes, districts are required to stabilize homeless students in their school of origin, even though the transportation route might involve crossing district boundaries. How is “Homeless” Defined? For the purposes of the Education of Homeless Children and Youth Programs under the Elementary and Secondary Schools Act, homeless children and youth “lack a fixed, regular, and adequate nighttime residence.” A homeless family could live in an emergency shelter or transitional housing unit, share housing with others due to loss of housing or economic hardship, reside in motels, or live in tents or trailers for lack of alternative, adequate housing. Unaccompanied minors who have been abandoned by their parents or who have run away from home – whatever the reason - are also eligible for educational rights and services as homeless students.
What are the Living Situations of Homeless Students in Oregon?
How are Homeless Students Counted? Since 2012-13, each district provides the Secure Student ID (SSID) of each homeless student served and two additional pieces of information:
1) living situation (Shelter, Unsheltered, Sharing Housing, Motel/Hotel);
2) unaccompanied status In addition to providing count data for required federal reports, results are used to assist districts with homeless student needs assessments in attendance, academic performance and dropout prevention. ODE initiatives such as High School Success, Career and Technical Education, Trauma-Informed Practice, Early Learning and Successful School Transitions are particularly helpful in retaining homeless students through graduation and into college and career. * PK enrollment is optional
How many homeless students attend public schools in Oregon?
Grade Level Count 2017-18
PK* 1,953
KG 1,734
1 1,640
2 1,568
3 1,662
4 1,694
5 1,615
6 1,490
7 1,459
8 1,439
9 1,465
10 1,534
11 1,737
12 2,719
Total 21,756
School Year In Shelters Sharing Housing Unsheltered Motels
2015-16 1,926 16,163 2,377 1,210
2016-17 1,999 17,210 2,515 1,124
2017-18 1,817 16,399 2,549 1,236

Oregon Statewide Report Card 2017-18 5 Oregon Department of Education https://www.oregon.gov/ode Contact for this section: Dona Bolt, 503-947-5781, [email protected]
What are the trends in poverty and homelessness? Counts of homeless students in high-rent districts are dropping, while many rural districts are seeing increases, as families move seeking more affordable housing.
Homeless Student Counts, K-12 (Percent of Total K-12 Enrollment)
2012-13 to 2017-18
K-12 Students enrolled in Oregon School Districts only. Excludes students enrolled in ESDs, correctional programs, and other non-school district run programs.
Districts with the Highest Number of Homeless Students
District K-12 Total Homeless 2017-18
% of enrollment
2017-18
Beaverton SD 48J 1,799 4.40%
Medford SD 549C 1,164 8.16%
Portland SD 1J 1,142 2.35%
Salem-Keizer SD 24J 1,065 2.54%
Reynolds SD 7 866 7.68%
Eugene SD 4J 864 4.98%
Lincoln Co. SD 825 14.93%
Grants Pass SD 7 500 8.17%
Three Rivers/Josephine Co. SD 477 9.84%
Bend-LaPine SD 1 467 2.55%
While districts with fewer students often have “volatile” data, note that the districts with the highest percentages of homeless students in the state are mainly rural and some distance from the I-5 corridor. Increasing homelessness in Oregon and other western states is attributed to a lack of sufficient affordable housing to meet the demands of a growing and increasingly mobile population. Note: The districts with the highest number and highest percent of homeless students change year to year.
Districts with the Highest % of Homeless Students
District K-12 Total Homeless 2017-18
% of enrollment
2017-18
Mapleton SD 32 43 30.28%
Butte Falls SD 91 58 24.68%
McKenzie SD 68 43 21.61%
North Lake SD 14 43 20.28%
Port Orford-Langlois SD 2CJ 45 19.82%
Reedsport SD 105 128 18.60%
Ukiah SD 80R * 16.13%
Warrenton-Hammond SD 30 160 15.92%
Falls City SD 57 31 14.98%
Lincoln County SD 825 14.95% * Values under 6 are suppressed for privacy
18,165 18,90220,524 21,340
22,541 21,756
(3.22%) (3.35%)(3.60%) (3.71%) (3.90%) (3.75%)
0
5,000
10,000
15,000
20,000
25,000
2012-13 2013-14 2014-15 2015-16 2016-17 2017-18

Oregon Statewide Report Card 2017-18 6 Oregon Department of Education https://www.oregon.gov/ode Contact for this section: Dona Bolt, 503-947-5781, [email protected]
Homeless Students by County of Enrollment, 2017-18
NOTE: Students enrolled in a district that contains schools in more than one county are included in the total of the county where the district administrative office is located.
How do public school programs serve homeless students? Services and accommodations for homeless students may include school transportation, tutoring, extended-day and summer school programs, shoes, clothing and hygiene supplies and referrals to social services and housing programs. Local district general funds may be supplemented by Title I-A funds, McKinney-Vento competitive subgrants, community agencies and local donations. Many districts receive donations from community sponsors, foundations and local businesses to help provide resources for homeless students such as dental and medical care, glasses, mentoring, family support and other services. Partnerships extend across the state between school districts, communities and county agencies working to end homelessness. Many liaisons are involved in county Continuum of Care Committees and Homeless Councils, Oregon Pre-Kindergarten Programs and Runaway & Homeless Youth Programs. Liaisons find collaboration and assistance from non-profit agencies, coalitions and faith-based service organizations. The role of the Homeless Liaison in school districts, as well as the role of school districts in statewide efforts to prevent and end homelessness, has become an imperative. It is hoped that these collaborations will eventually help reduce the number of homeless students in Oregon.
Homeless Student Performance 2017-18 Percent at Level 3 or 4 / Meets or Exceeds Standard, All Grades
Homeless Student Performance 2017-18 Percent Regular Attenders, Percent of 9th Grade On-Track
31.6%
17.7%
39.6%
54.9%
40.5%
60.2%
0%
50%
100%
ELA Math Science
Homeless Students All Students
57.6% 60.2%
79.5%84.5%
0.00%
50.00%
100.00%
Regular Attenders 9th Grade On-Track
Homeless All Students
County Total
Enrolled, K - 12
Baker 175
Benton 259
Clackamas 1147
Clatsop 312
Columbia 229
Coos 576
Crook 92
Curry 129
Deschutes 884
Douglas 629
Gilliam 0
Grant 6
Harney 68
Hood River 32
Jackson 2206
Jefferson 137
Josephine 969
Klamath 367
Lake 48
Lane 2296
Lincoln 825
Linn 1024
Malheur 261
Marion 1649
Morrow 112
Multnomah 3349
Polk 269
Sherman 0
Tillamook 249
Umatilla 177
Union 168
Wallowa 26
Wasco 141
Washington 2638
Wheeler 22
Yamhill 589

Oregon Statewide Report Card 2017-18 7 Oregon Department of Education https://www.oregon.gov/ode Contact for this section: Dona Bolt, 503-947-5781, [email protected]
McKinney-Vento Subgrant Projects Oregon received $742,271 in federal McKinney-Vento Act funds in 2017-18 to serve homeless students. More than 75 percent of this amount went to districts in the form of competitive subgrants. During the 2017-18 school year, 26 local districts were served by 10 subgrant projects from this program. McKinney-Vento Subgrant Projects were required to report results on Oregon State Achievement tests for the homeless students in their districts. Following are the results of those tests.
English Language Arts Mathematics Science
Grade Level
NUMBER OF
HOMELESS STUDENTS TESTED IN
ELA 2017-18
PERCENT OF
HOMELESS STUDENTS AT LEVEL
3/4 2016-17
PERCENT OF
HOMELESS STUDENTS AT LEVEL
3/4 2017-18
NUMBER OF
HOMELESS STUDENTS TESTED IN
MATH 2017-18
PERCENT OF
HOMELESS STUDENTS AT LEVEL
3/4 2016-17
PERCENT OF
HOMELESS STUDENTS AT LEVEL
3/4 2017-18
NUMBER OF
HOMELESS STUDENTS TESTED IN SCIENCE 2017-18
PERCENT OF HOMELESS STUDENTS
WHO MET OR EXCEEDED STANDARD
2016-17
PERCENT OF HOMELESS STUDENTS
WHO MET OR EXCEEDED STANDARD
2017-18
3 1,414 21.49% 25.60% 1,401 22.69% 23.84%
4 1,471 22.97% 27.74% 1,456 19.42% 20.12%
5 1,376 28.48% 31.69% 1,362 14.87% 17.03% 1,385 42.54% 44.98%
6 1,242 27.11% 29.79% 1,230 14.08% 15.77%
7 1,182 29.52% 30.54% 1,164 18.03% 16.32%
8 1,174 29.17% 32.11% 1,148 17.98% 16.29% 1,165 40.04% 39.83%
HS 1,159 46.90% 46.59% 1,119 13.43% 12.42% 984 37.02% 31.81%
The achievement gap between homeless students and all students has decreased in recent years. The following chart shows the difference in percent meeting between homeless students and all students over the past three years.
For more information about the ODE Education of Homeless Children and Youth Program: Contact Dona Bolt, Coordinator: [email protected] or visit the McKinney-Vento Act: Homeless Education Program
webpage.
24.923.1
22.1
25.023.3
21.223.3 22.8
20.6
0.0
5.0
10.0
15.0
20.0
25.0
30.0
English Language Arts Math Science
2015-16 2016-17 2017-18

Oregon Statewide Report Card 2017-18 8 Oregon Department of Education https://www.oregon.gov/ode Contact for this section: Robin Stalcup, 503-947-0849, [email protected]
Class Size In 2014-15, the Oregon Department of Education began a new class size report, using methodology based on a more detailed data source than in prior years. Class enrollments are counted on the first school day in May for all self-contained or core classes in all grade levels K-12. Data from 2014-15 through 2017-18 are available. Median Class Size across school type has not changed over the last three school years. Class sizes in elementary schools increase from a median of 22 kindergarten students to a maximum median class size of 26 students by the fourth grade. Blended classes (giving instruction to more than one grade at a time) also tend to be smaller. Class sizes are highest in middle schools, but then decrease slightly in high schools.
17
25
27
25
25
17
25
27
25
25
16
25
27
24
25
15
25
27
24
25
0 5 10 15 20 25 30
Median Class Size
20
14
-20
15
20
15
-20
16
20
16
-20
17
20
17
-20
18
Median Class Size by School Type over Time
All Classes
Elementary School
Middle School
High School
Combined School
English Language Arts24%
Math21%
Science17%
Social Studies16%
Fine and Performing Arts
12%
World Language and Literature
7%
Multiple Subjects3%
COURSES OFFERED ON MAY 1,2018
Departmentalized courses (those offering instruction in specific core content subjects) comprise most of the courses reported to the department. The median class sizes vary by subject, ranging from 24 students (Math, English Language Arts, and World Languages) to 27 students (Social Studies). More classes are offered in assessed subjects, and fewer in subjects that are not required for assessment or to earn a high school diploma.
Oregon Statewide Report Card 2017-18 9 Oregon Department of Education https://www.oregon.gov/ode Contact for this section: Robin Stalcup, 503-947-0849, [email protected]
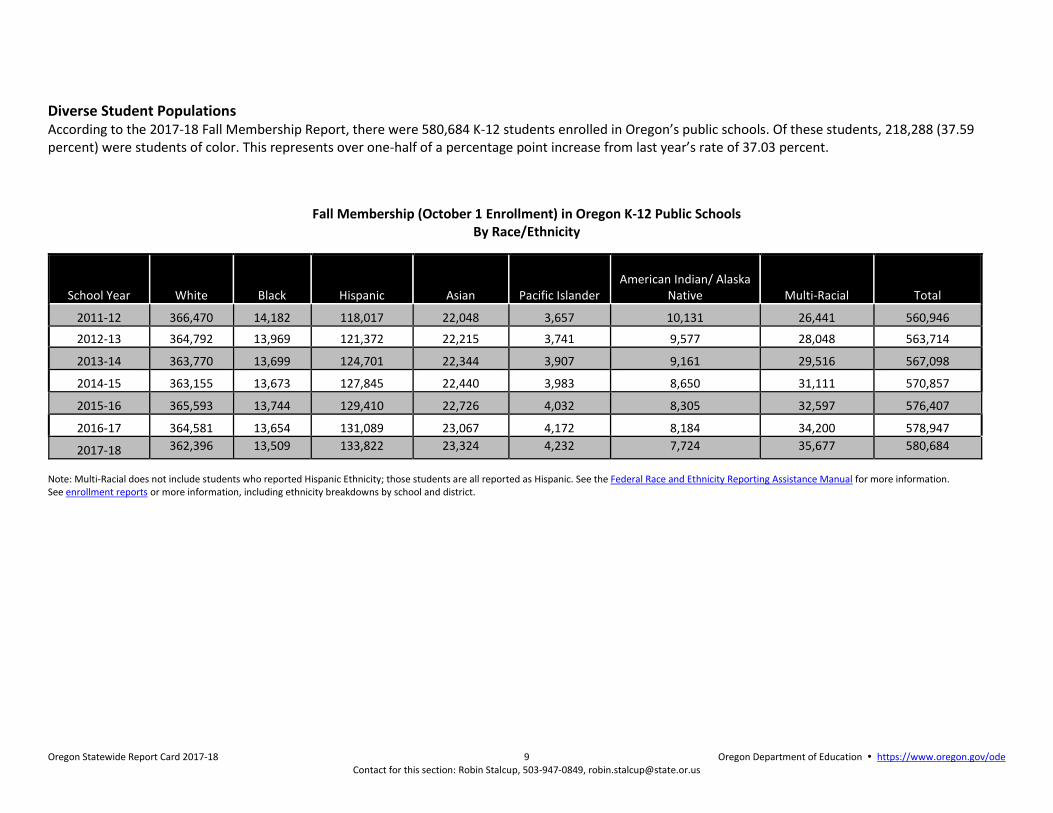
Diverse Student Populations According to the 2017-18 Fall Membership Report, there were 580,684 K-12 students enrolled in Oregon’s public schools. Of these students, 218,288 (37.59 percent) were students of color. This represents over one-half of a percentage point increase from last year’s rate of 37.03 percent.
Fall Membership (October 1 Enrollment) in Oregon K-12 Public Schools By Race/Ethnicity
School Year White Black Hispanic Asian Pacific Islander American Indian/ Alaska
Native Multi-Racial Total
2011-12 366,470 14,182 118,017 22,048 3,657 10,131 26,441 560,946
2012-13 364,792 13,969 121,372 22,215 3,741 9,577 28,048 563,714
2013-14 363,770 13,699 124,701 22,344 3,907 9,161 29,516 567,098
2014-15 363,155 13,673 127,845 22,440 3,983 8,650 31,111 570,857
2015-16 365,593 13,744 129,410 22,726 4,032 8,305 32,597 576,407
2016-17 364,581 13,654 131,089 23,067 4,172 8,184 34,200 578,947
2017-18 362,396 13,509 133,822 23,324 4,232 7,724 35,677 580,684
Note: Multi-Racial does not include students who reported Hispanic Ethnicity; those students are all reported as Hispanic. See the Federal Race and Ethnicity Reporting Assistance Manual for more information. See enrollment reports or more information, including ethnicity breakdowns by school and district.

Oregon Statewide Report Card 2017-18 10 Oregon Department of Education https://www.oregon.gov/ode Contact for this section: Kim Miller, 503-947-5712, [email protected]
Language Diversity According to data from the ESEA Title III: English Learner Collection for 2017-18, there were 54,408 English Learners* (about 9.41 percent of all K-12 students).
Most Common Languages of Origin of Students in Oregon Public Schools (K-12 Students)
2017-18
Language of Origin Number of Enrolled
Students by Language of Origin1
Number of English Learner Students2
Percent of Enrollment3
Percent of English Learner Student
Enrollment3
(Total: 578,033) (Total: 54,408)
English 453,442 759 78.4% 1.4%
Spanish 89,141 41,137 15.4% 75.6%
Russian 4,811 1,654 0.8% 3.0%
Vietnamese 4,420 1,151 0.8% 2.1%
Chinese 3,645 1,058 0.6% 1.9%
Arabic 1,983 1,062 0.3% 2.0%
Somali 1,320 801 0.2% 1.5%
Korean 1,074 309 0.2% 0.6%
Ukrainian 1,041 409 0.2% 0.8%
Japanese 998 354 0.2% 0.7%
Chuukese 991 608 0.2% 1.1%
Romanian 803 268 0.1% 0.5%
Tagalog 626 208 0.1% 0.4%
Marshallese 566 358 0.1% 0.7%
Hmong 550 181 0.1% 0.3%
Hindi 541 113 0.1% 0.2%
Telugu 511 91 0.1% 0.2%
German 355 46 0.1% 0.1%
Tamil 351 37 0.1% 0.1%
Persian 351 168 0.1% 0.3%
French 338 95 0.1% 0.2%
Amharic 305 130 0.1% 0.2%
Thai 305 112 0.1% 0.2%
Swahili 300 207 0.1% 0.4%
Lao 277 90 0.0% 0.2%
Karen 275 200 0.0% 0.4%
Sign languages 260 13 0.0% 0.0%
Other or N/A 8,456 2,792 1.5% 5.1% 1 Source: Spring Membership 2018 2 Source: Unduplicated ESEA Title III: English Learner Collection, 2017-18, excluding students determined not to be currently eligible for English Learner Services.” 3 Percentage columns may not sum to 100% due to rounding. 4 Native American/Alaska Native students may qualify for English learner services even though these students have English as their language of origin. 5 Includes students reported with an uncommon language of origin, as well as students reported with “Other” or “Not Applicable” as their language of origin. *English Learners is the new term for students qualifying to receive instruction in English language acquisition.
See the Title III English Learners and Immigrant Youth webpage for more details on English Learner performance.
Oregon Statewide Report Card 2017-18 11 Oregon Department of Education https://www.oregon.gov/ode Contact for this section: Beth Blumenstein, 503-947-5767, [email protected]
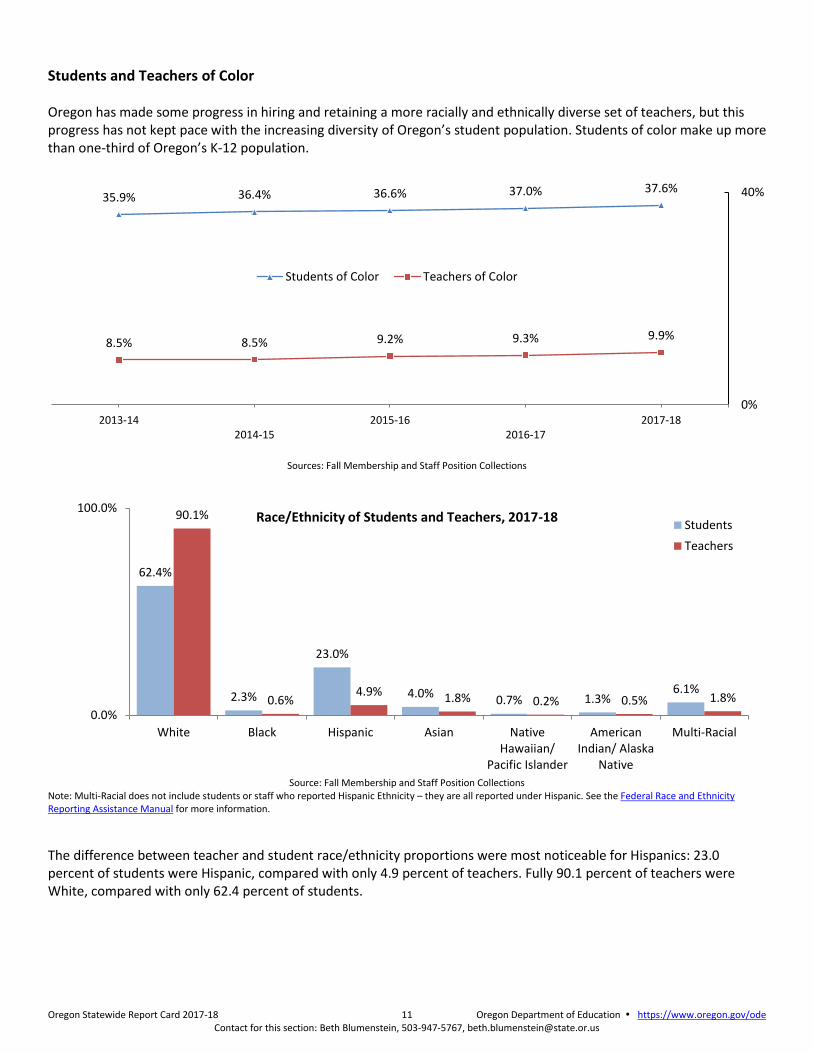
Students and Teachers of Color Oregon has made some progress in hiring and retaining a more racially and ethnically diverse set of teachers, but this progress has not kept pace with the increasing diversity of Oregon’s student population. Students of color make up more than one-third of Oregon’s K-12 population.
Sources: Fall Membership and Staff Position Collections
Source: Fall Membership and Staff Position Collections
Note: Multi-Racial does not include students or staff who reported Hispanic Ethnicity – they are all reported under Hispanic. See the Federal Race and Ethnicity Reporting Assistance Manual for more information.
The difference between teacher and student race/ethnicity proportions were most noticeable for Hispanics: 23.0 percent of students were Hispanic, compared with only 4.9 percent of teachers. Fully 90.1 percent of teachers were White, compared with only 62.4 percent of students.
35.9% 36.4% 36.6% 37.0% 37.6%
8.5% 8.5% 9.2% 9.3% 9.9%
0%
40%
2013-142014-15
2015-162016-17
2017-18
Students of Color Teachers of Color
62.4%
2.3%
23.0%
4.0%0.7% 1.3%
6.1%
90.1%
0.6%4.9% 1.8% 0.2% 0.5% 1.8%
0.0%
100.0%
White Black Hispanic Asian NativeHawaiian/
Pacific Islander
AmericanIndian/ Alaska
Native
Multi-Racial
Race/Ethnicity of Students and Teachers, 2017-18 Students
Teachers
Oregon Statewide Report Card 2017-18 12 Oregon Department of Education https://www.oregon.gov/ode Contact for this section: Beth Blumenstein, 503-947-5767, [email protected]
OREGON STAFF
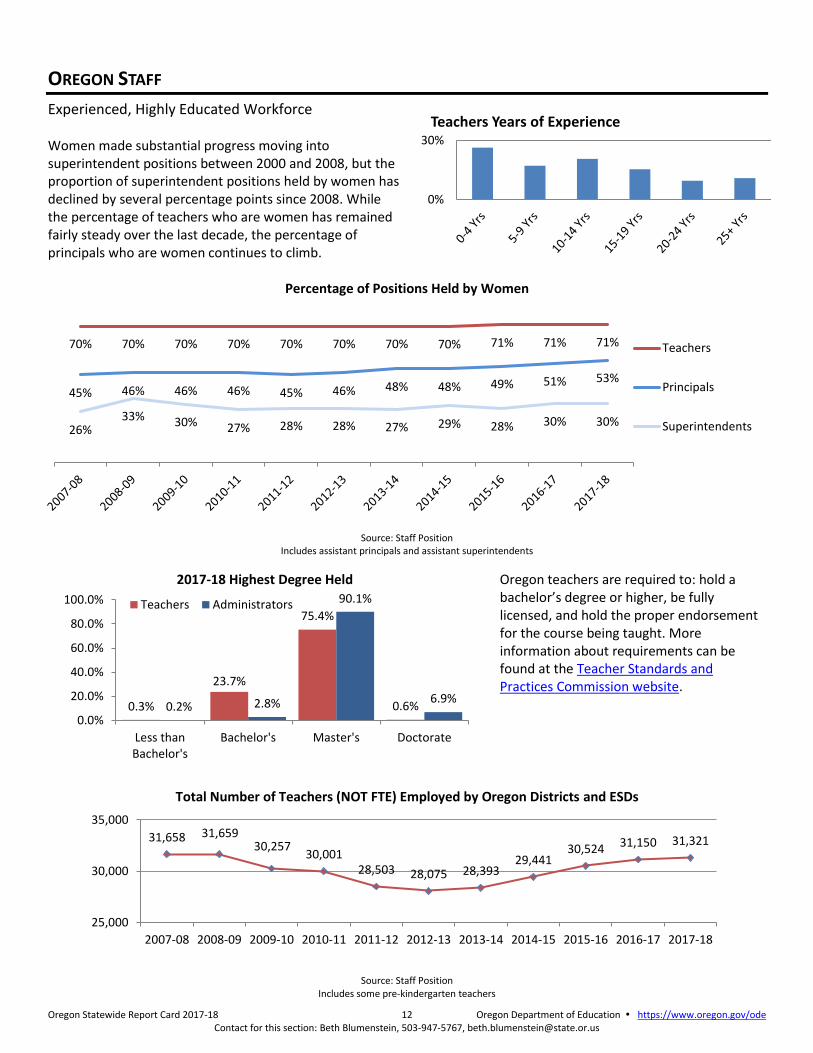
Experienced, Highly Educated Workforce Women made substantial progress moving into superintendent positions between 2000 and 2008, but the proportion of superintendent positions held by women has declined by several percentage points since 2008. While the percentage of teachers who are women has remained fairly steady over the last decade, the percentage of principals who are women continues to climb.
Percentage of Positions Held by Women
Source: Staff Position Includes assistant principals and assistant superintendents
2017-18 Highest Degree Held
Oregon teachers are required to: hold a bachelor’s degree or higher, be fully licensed, and hold the proper endorsement for the course being taught. More information about requirements can be found at the Teacher Standards and Practices Commission website.
Total Number of Teachers (NOT FTE) Employed by Oregon Districts and ESDs
Source: Staff Position Includes some pre-kindergarten teachers
70% 70% 70% 70% 70% 70% 70% 70% 71% 71% 71%
45% 46% 46% 46% 45% 46% 48% 48% 49% 51% 53%
26%33% 30% 27% 28% 28% 27% 29% 28% 30% 30%
Teachers
Principals
Superintendents
0.3%
23.7%
75.4%
0.6%0.2% 2.8%
90.1%
6.9%
0.0%
20.0%
40.0%
60.0%
80.0%
100.0%
Less thanBachelor's
Bachelor's Master's Doctorate
Teachers Administrators
31,658 31,65930,257
30,00128,503 28,075 28,393
29,44130,524 31,150 31,321
25,000
30,000
35,000
2007-08 2008-09 2009-10 2010-11 2011-12 2012-13 2013-14 2014-15 2015-16 2016-17 2017-18
0%
30%
Teachers Years of Experience

Oregon Statewide Report Card 2017-18 13 Oregon Department of Education https://www.oregon.gov/ode Contact for this section: Beth Blumenstein, 503-947-5767, [email protected]
All School Staff In the last year, the total number of full-time equivalent (FTE) school employees increased by 0.63 percent, which is the smallest increase in staff for the past four years. Decreases were seen in District Administrators (-1.24 percent), Library/Media Staff (-2.80 percent), and Support Staff (-1.08 percent). Increases were seen in Educational Assistants (3.36 percent), School Administrators (1.49 percent), and Special Education Specialists (2.17 percent), with the largest increase seen with Guidance Counselors (8.06 percent).
Oregon School Employees (Full-Time Equivalent Positions)
2016-17 2017-18
Number Percent Number Percent
Teachers 29,793.83 43.68% 29,939.71 43.62%
Educational Assistants 11,233.91 16.47% 11,611.57 16.92%
District Administrators 489.70 0.72% 483.61 0.70%
School Administrators 1,716.61 2.52% 1,742.19 2.54%
Guidance Counselors 1,162.57 1.70% 1,256.25 1.83%
Library and Media 869.22 1.27% 844.90 1.23%
Support Staff 20,951.44 30.72% 20,724.33 30.20%
Special Education Specialists 1,985.51 2.91% 2,028.58 2.96%
Total 68,202.79 100.00% 68,631.14 100.00%
Includes all grade levels and institution types. Both years of data make adjustments for partial year employment. Note that the Library and Media category combines the FTE of library/media specialists and library/media support. All data above reflects employment as of December 1 of the school year.
The proportion of total FTE positions held by teachers in Oregon’s public schools decreased slightly this year, and remains under 45 percent. 1Teachers and Pupil/Teacher Ratios
Annual Instructional Hours The minimum number of instructional hours districts must offer each school year, by grade level, are specified in OAR 581-022-2320 - Required Instructional Time.
Instructional Hours Required to be Offered Each Year (Minimum) 2017-18
Kindergarten (half day) 450
Kindergarten (full day) 900
Grades 1-8 900
Grades 9-11 990
Grade 12 966

Oregon Statewide Report Card 2017-18 14 Oregon Department of Education • www.oregon.gov/ode Contact for this section: Brian Reeder, 503-947-5670, [email protected]
Historical Salary Charts
Oregon Average Actual & Inflation-Adjusted Salaries 2011-12 to 2017-18 Superintendents, Principals, Assistant Principals, and Teachers
Actual Salary Inflation-Adjusted Salary
2011-12 2017-18 Percent Change
2011-12 2017-18 Percent Change
Superintendent $117,894 $137,591 16.7% $117,894 $119,834 1.7%
Principal $96,364 $108,819 12.9% $96,364 $94,775 -1.7%
Assistant Principal $90,459 $102,149 12.9% $90,459 $88,966 -1.7%
Teacher $56,941 $63,086 10.8% $56,941 $54,944 -3.5% Source: ODE Staff Position Data Collection Note: The Office of Economic Analysis moved to the West Region CPI starting with the 1st Quarter 2018 Economic Forecast. Inflation-adjusted salaries for the 2017-18 Statewide Report Card were calculated using the West Region CPI. Prior year Oregon Statewide Report Cards used the Portland-Salem Urban Area CPI.
Adjusted for inflation, the average superintendent makes more than they did six years ago. The average principal, assistant principal and teacher make less than they did six years ago.

Oregon Statewide Report Card 2017-18 15 Oregon Department of Education • www.oregon.gov/ode Contact for this section: Brian Reeder, 503-947-5670, [email protected]
Average Salaries for Teachers and Administrators in Oregon: 2011-12 to 2017-18
Average Oregon Principal Salaries
Average Oregon Assistant Principal Salaries
Average Oregon Teacher Salaries
$117,894 $119,432$121,858
$125,529$129,318
$133,950$137,591
$117,542 $117,591 $119,470 $120,380 $121,009 $119,834
$100,000
$115,000
$130,000
$145,000
2011-12 2012-13 2013-14 2014-15 2015-16 2016-17 2017-18
Average Oregon Superintendent SalariesActual Salaries Inflation Adjusted Salaries (West Region CPI; 2011-12 = 100)
$96,364 $97,397
$101,765 $101,329$103,609
$105,889$108,819
$95,855$98,202
$96,438 $96,448 $95,659 $94,775
$80,000
$95,000
$110,000
2011-12 2012-13 2013-14 2014-15 2015-16 2016-17 2017-18
$90,459 $91,380 $92,780 $94,067$97,090
$98,751$102,149
$89,934 $89,531 $89,527 $90,379 $89,211 $88,966
$75,000
$90,000
$105,000
2011-12 2012-13 2013-14 2014-15 2015-16 2016-17 2017-18
$56,941 $57,600 $58,630 $59,477 $60,359$61,860 $63,086
$56,941 $56,688 $56,577 $56,606 $56,187 $55,884 $54,944
$40,000
$55,000
$70,000
2011-12 2012-13 2013-14 2014-15 2015-16 2016-17 2017-18

Oregon Statewide Report Card 2017-18 16 Oregon Department of Education • www.oregon.gov/ode Contact for this section: Brian Reeder, 503-947-5670, [email protected]
SCHOOL FUNDING
The majority of spending is allocated to classroom expenses. In Oregon, about 95 percent of spending is concentrated in school buildings and services to students with 5 percent spent on central support services, such as district office administration and support services.
Operating Expenditures per Student
Where Dollars Were Spent 2014-15 % 2015-16 % 2016-17 %
Direct Classroom $6,063 56% $6,322 56% $6,607 56%
Classroom Support $2,196 20% $2,294 20% $2,401 20%
Building Support $2,077 19% $2,123 19% $2,191 19%
Central Support $491 5% $502 4% $516 4%
TOTAL* $10,827 100% $11,241 100% $11,715 100% *Figures may not sum to TOTAL, due to rounding. Note: Per student calculation excludes students in state-run programs because spending on those students is not included. Source: School District and Education Service District (ESD) Audits
School Resources Since the passage of Measure 5 in 1990, school resources per student have not kept pace with education cost increases.
Staff salaries increased at about the rate of inflation during the 1990s, but health care benefit costs have greatly increased.
Changing student demographics and declining student enrollment in a majority of school districts have also driven costs up.
Growth rates for Special Education students and English Learner students have been far more rapid than the growth rate for all students, and these students are more expensive to educate than students without special needs.
The average age of Oregon’s school buildings is more than 40 years. The cost of operating and maintaining school facilities comes from general fund dollars and reduces the amount available to spend on instruction.
The 2018 Final Report from Oregon’s Quality Education Commission (QEC) states, “The State School Fund requirement to fund K-12 schools at a level recommended by the QEC is estimated at $10.734 billion in the 2019-21 biennium, $1.963 billion more than the funding required to maintain the Current Service Level—that is, to simply keep up with inflation and enrollment growth. This funding gap rose from the prior biennium (2017-19), when it was $1.771 billion.” See the Quality Education Commission page for more information.
1Final Reports from the Quality Education Commission are issued every two years.

Oregon Statewide Report Card 2017-18 17 Oregon Department of Education • https://www.oregon.gov/ode Contact for this section: Michael Wiltfong, 503-947-5914, [email protected]
Student Enrollment Student enrollment is counted in several ways because it is used for a variety of purposes related to school funding: Average Daily Membership – Resident (ADMr): This is the annual average of daily student enrollment for students residing within the district. Some resident students may attend school in another district. Kindergarten students are counted as half-time students through 2014-15. Starting in 2015-16, they are counted as full-time students when students attend a full day. Average Daily Membership – Weighted (ADMw): This count is the basis for funding in Oregon. Resident average daily membership is weighted to compensate for special student needs and uncontrollable cost factors, including Special Education students, English Language Learners, students in poverty, teen parents, neglected and delinquent youth and small school correction factors. October 1 Student Membership (Enrollment): Used for federal reporting purposes, this is the headcount of students enrolled on October 1 of every year. Average Daily Attendance (ADA): This is the annual average of daily student attendance for students residing within the district. It is collected by the federal government and is used as the basis for funding in some states, but not in Oregon.
Measures of Student Enrollment
2012-13 2013-14 2014-15 2015-16
(Revised) 2016-17
(Revised) 2017-18
(Preliminary)
Average Daily Membership – ADMr
533,923 538,389 542,903 568,642 571,775 572,767
Weighted Average Daily Membership – ADMw
659,950 663,123 671,863 701,613 707,233 706,117
Fall Membership (Enrollment on October 1)**
563,714 567,100 570,857 576,407 578,947 580,690
Average Daily Attendance (ADA)*
499,720 505,177 507,656 531,055 532,613 532,664
* ADA includes students who are counted based on instructional hours. ADA for those students is estimated by multiplying the ADM of those students by the ratio of ADA to ADM for "regular" students (Type 1 records in the ADM collection). Kindergarteners are counted as 0.5 in ADM and ADA through 2014-15, then as 1.0. **Fall Membership reported here includes some PK students.
Oregon Statewide Report Card 2017-18 18 Oregon Department of Education www.oregon.gov/ode Contact for this section: Brian Reeder, 503-947-5670, [email protected]
History of School Funding Responsibility in Oregon
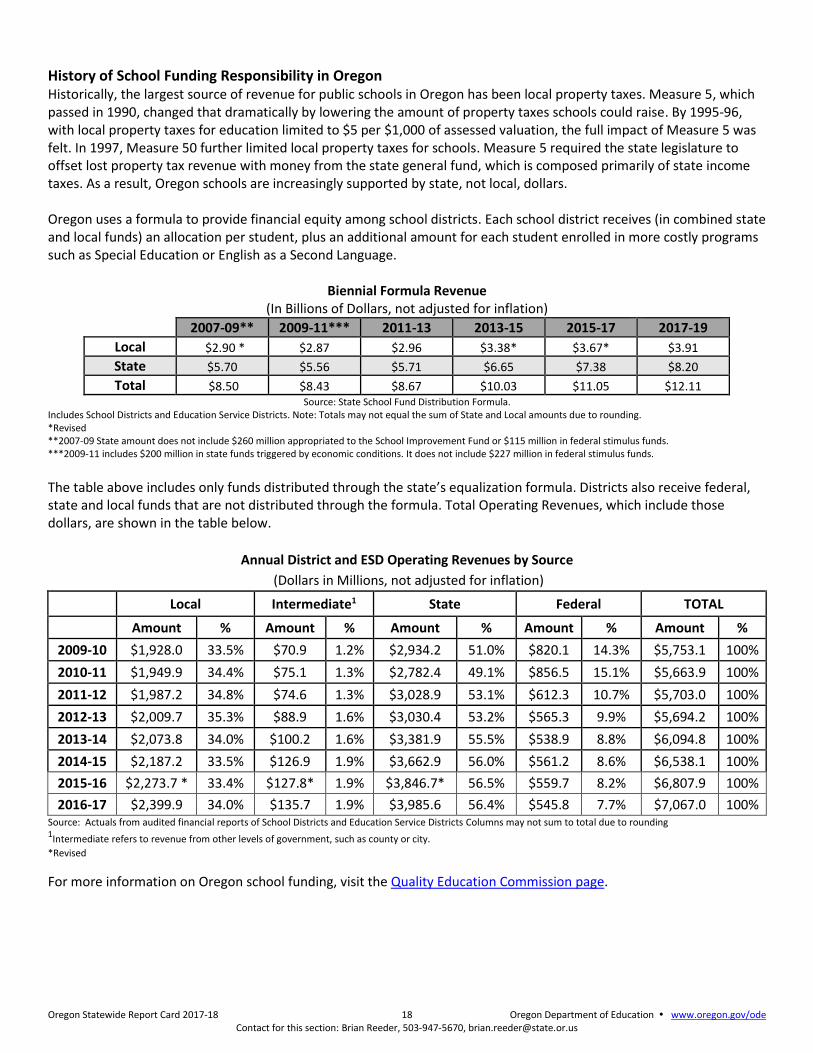
Historically, the largest source of revenue for public schools in Oregon has been local property taxes. Measure 5, which passed in 1990, changed that dramatically by lowering the amount of property taxes schools could raise. By 1995-96, with local property taxes for education limited to $5 per $1,000 of assessed valuation, the full impact of Measure 5 was felt. In 1997, Measure 50 further limited local property taxes for schools. Measure 5 required the state legislature to offset lost property tax revenue with money from the state general fund, which is composed primarily of state income taxes. As a result, Oregon schools are increasingly supported by state, not local, dollars. Oregon uses a formula to provide financial equity among school districts. Each school district receives (in combined state and local funds) an allocation per student, plus an additional amount for each student enrolled in more costly programs such as Special Education or English as a Second Language.
Biennial Formula Revenue (In Billions of Dollars, not adjusted for inflation)
2007-09** 2009-11*** 2011-13 2013-15 2015-17 2017-19
Local $2.90 * $2.87 $2.96 $3.38* $3.67* $3.91
State $5.70 $5.56 $5.71 $6.65 $7.38 $8.20
Total $8.50 $8.43 $8.67 $10.03 $11.05 $12.11 Source: State School Fund Distribution Formula.
Includes School Districts and Education Service Districts. Note: Totals may not equal the sum of State and Local amounts due to rounding. *Revised
**2007-09 State amount does not include $260 million appropriated to the School Improvement Fund or $115 million in federal stimulus funds. ***2009-11 includes $200 million in state funds triggered by economic conditions. It does not include $227 million in federal stimulus funds.
The table above includes only funds distributed through the state’s equalization formula. Districts also receive federal, state and local funds that are not distributed through the formula. Total Operating Revenues, which include those dollars, are shown in the table below.
Annual District and ESD Operating Revenues by Source
(Dollars in Millions, not adjusted for inflation)
Local Intermediate1 State Federal TOTAL
Amount % Amount % Amount % Amount % Amount %
2009-10 $1,928.0 33.5% $70.9 1.2% $2,934.2 51.0% $820.1 14.3% $5,753.1 100%
2010-11 $1,949.9 34.4% $75.1 1.3% $2,782.4 49.1% $856.5 15.1% $5,663.9 100%
2011-12 $1,987.2 34.8% $74.6 1.3% $3,028.9 53.1% $612.3 10.7% $5,703.0 100%
2012-13 $2,009.7 35.3% $88.9 1.6% $3,030.4 53.2% $565.3 9.9% $5,694.2 100%
2013-14 $2,073.8 34.0% $100.2 1.6% $3,381.9 55.5% $538.9 8.8% $6,094.8 100%
2014-15 $2,187.2 33.5% $126.9 1.9% $3,662.9 56.0% $561.2 8.6% $6,538.1 100%
2015-16 $2,273.7 * 33.4% $127.8* 1.9% $3,846.7* 56.5% $559.7 8.2% $6,807.9 100%
2016-17 $2,399.9 34.0% $135.7 1.9% $3,985.6 56.4% $545.8 7.7% $7,067.0 100% Source: Actuals from audited financial reports of School Districts and Education Service Districts Columns may not sum to total due to rounding 1Intermediate refers to revenue from other levels of government, such as county or city.
*Revised
For more information on Oregon school funding, visit the Quality Education Commission page.
Oregon Statewide Report Card 2017-18 19 Oregon Department of Education www.oregon.gov/ode Contact for this section: Brian Reeder, 503-947-5670, [email protected]
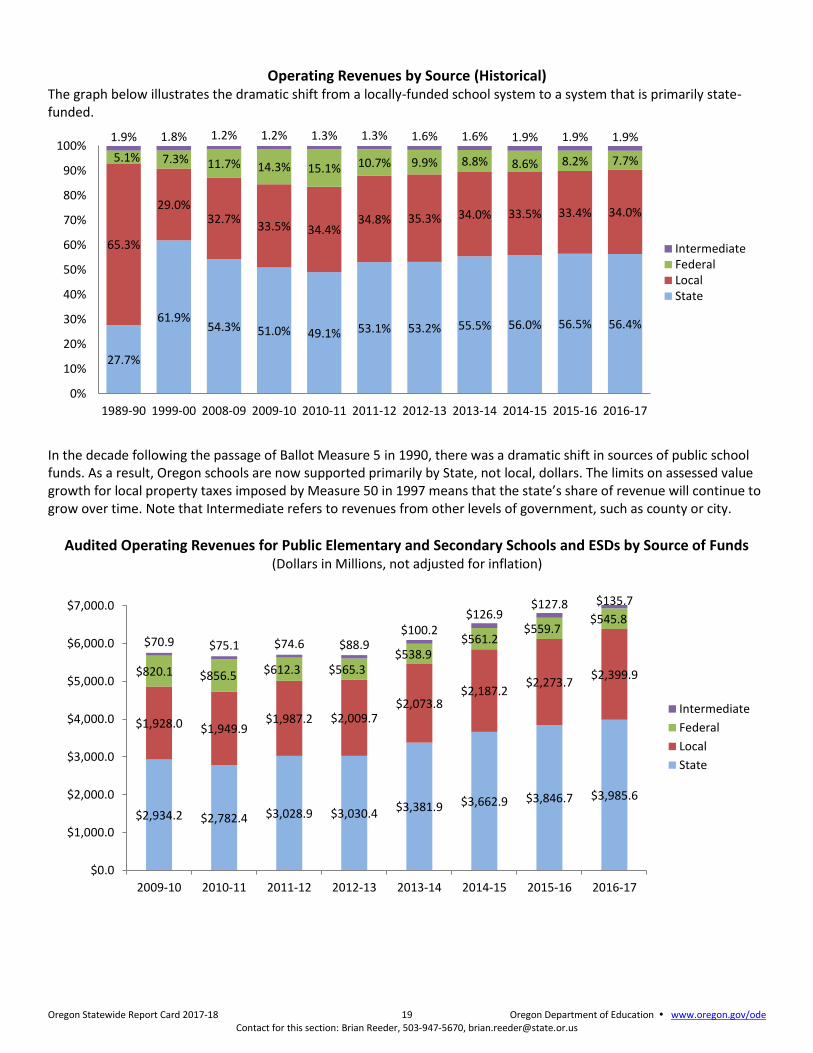
Operating Revenues by Source (Historical)
The graph below illustrates the dramatic shift from a locally-funded school system to a system that is primarily state-funded.
In the decade following the passage of Ballot Measure 5 in 1990, there was a dramatic shift in sources of public school funds. As a result, Oregon schools are now supported primarily by State, not local, dollars. The limits on assessed value growth for local property taxes imposed by Measure 50 in 1997 means that the state’s share of revenue will continue to grow over time. Note that Intermediate refers to revenues from other levels of government, such as county or city.
Audited Operating Revenues for Public Elementary and Secondary Schools and ESDs by Source of Funds (Dollars in Millions, not adjusted for inflation)
27.7%
61.9%54.3% 51.0% 49.1% 53.1% 53.2% 55.5% 56.0% 56.5% 56.4%
65.3%
29.0%32.7%
33.5% 34.4%34.8% 35.3% 34.0% 33.5% 33.4% 34.0%
5.1% 7.3% 11.7% 14.3% 15.1% 10.7% 9.9% 8.8% 8.6% 8.2% 7.7%
1.9% 1.8% 1.2% 1.2% 1.3% 1.3% 1.6% 1.6% 1.9% 1.9% 1.9%
0%
10%
20%
30%
40%
50%
60%
70%
80%
90%
100%
1989-90 1999-00 2008-09 2009-10 2010-11 2011-12 2012-13 2013-14 2014-15 2015-16 2016-17
IntermediateFederalLocalState
$2,934.2 $2,782.4 $3,028.9 $3,030.4$3,381.9 $3,662.9 $3,846.7 $3,985.6
$1,928.0 $1,949.9$1,987.2 $2,009.7
$2,073.8$2,187.2
$2,273.7$2,399.9$820.1 $856.5 $612.3 $565.3
$538.9$561.2
$559.7$545.8
$70.9 $75.1 $74.6 $88.9$100.2
$126.9$127.8 $135.7
$0.0
$1,000.0
$2,000.0
$3,000.0
$4,000.0
$5,000.0
$6,000.0
$7,000.0
2009-10 2010-11 2011-12 2012-13 2013-14 2014-15 2015-16 2016-17
Intermediate
Federal
Local
State

Oregon Statewide Report Card 2017-18 20 Oregon Department of Education https://www.oregon.gov/ode Contact for this section: Deb Lange, 503-947-5922, [email protected]
ELEMENTARY AND SECONDARY EDUCATION ACT
Federal Programs Through the Elementary and Secondary Education Act (ESEA), the Oregon Department of Education receives and distributes federal education funds to eligible school districts throughout Oregon. These supplemental funds support district efforts in meeting federal and state requirements and in implementing programs that improve the ability of all students to receive a well-rounded education and meet high academic standards. The Oregon Department of Education continues its commitment to develop processes that ensure that federal ESEA funds contribute to these opportunities. Oregon students are served through the following programs provided through the Elementary and Secondary Education Act:
Title I-A Improving the Academic Achievement of the Disadvantaged Title I-C Education of Migrant Children Title I-D Prevention and Intervention Programs for Children and Youth Who Are Neglected, Delinquent, or At-Risk Title II-A Supporting Effective Instruction Title III Language Instruction for English Learners and Immigrant Students Title IV-A Student Support and Academic Enrichment Grants Title IV-B 21st Century Community Learning Centers Title V-B Rural Education Initiative Title VI Indian, Native Hawaiian, and Alaska Native Education Title IX-A Homeless Children and Youths
In addition to the management of federal funds, the Office of Teaching, Learning and Assessment provides ongoing guidance, technical assistance, promising practices and monitoring to ensure school districts have systems in place in order for all students to receive these opportunities for academic success. On December 10, 2015, President Barack Obama signed the Every Student Succeeds Act (ESSA) which reauthorized ESEA and signaled the end to ESEA flexibility waivers. ESSA replaces the No Child Left Behind Act (NCLB) of 2001, and its aim is to supplement public school funding to support the learning needs of students living in poverty, English Learners, and other students who have been educationally disadvantaged. ESSA allows states to design their own plans for improving schools so that every student receives the best education. It encourages states and schools to innovate, while at the same time maintains a focus on equity and accountability. In place of the NCLB one-size-fits-all approach, states have the ability to set their own goals for improving student achievement and graduation rates. States also have more flexibility in how they identify and support struggling schools and districts. See the ESSA page for more information. Oregon’s ESSA State Plan was approved by the U.S. Department of Education on August 30, 2017.

Oregon Statewide Report Card 2017-18 21 Oregon Department of Education www.oregon.gov/ode Contact for this section: Lisa Bateman, 503-947-5655, [email protected]
The Every Student Succeeds Act (ESSA) – Unsafe School Choice Option The Every Student Succeeds Act (ESSA) requires state education agencies to establish a school choice policy for students attending a persistently dangerous school as defined by the state. This is known as the Unsafe School Choice Option. A school can be deemed unsafe as a whole or for an individual student who is a victim of a violent criminal offense. Should either of these occur, parents may exercise their right to move their student to a different school within the local education agency. In Oregon, a public elementary or secondary school is considered “persistently dangerous” if the school exceeds a certain threshold of expulsions for three consecutive years (see expulsion types below). The table to the right describes this threshold which varies depending on school size. Expulsions fall within the following two categories:
1. Expulsions for firearms or dangerous weapons 2. Expulsions for students arrested for violent
criminal offenses on school grounds, on school-sponsored transportation, and/or during school-sponsored activities.
Between 2009-10 and 2017-18, Oregon did not identify any schools meeting the criteria for being placed on “watch status.” Oregon also did not identify any schools as “persistently dangerous” for exceeding the threshold for three or more consecutive years. For more information about discipline incidents see the health, safety, and wellness page.
Discipline Incidents by Grade Level Percent of Students with One or More Suspensions or Expulsions in the 2017-2018 School Year by Enrolled Grade on
May 1, 2018
0.0%
2.0%
4.0%
6.0%
8.0%
10.0%
12.0%
KG 1st 2nd 3rd 4th 5th 6th 7th 8th 9th 10th 11th 12th
1.9% 2.1%2.4% 2.5%
3.3%4.0%
8.6%
10.8% 11.1%
9.6%
8.2%
6.6%
4.3%
Grade LevelSource: Spring Membership 2017-18, Discipline Incidents 2017-18
Criteria for Watch Status
Number of Expulsions for Weapons and/or Arrests
for Violent Criminal Behavior
Schools with FEWER than 300 Students
nine or more within a school year
Schools with 300 or MORE Students
three for every 100 students per school year
Source: Oregon Department of Education

Oregon Statewide Report Card 2017-18 22 Oregon Department of Education www.oregon.gov/ode Contact for this section: Lisa Bateman, 503-947-5655, [email protected]
Discipline Incidents by Student Group – Suspensions and Expulsions
Student Group Percent of Students enrolled on May 1, 2018 with One or More Discipline Incidents in the
2017-18 School Year
Total 5.8%
Gender
Male 8.3%
Female 3.1%
Ethnicity
Asian 1.6%
Black/African American 11.1%
Hispanic/Latino 6.5%
American Indian/Alaska Native 10.4%
Multi-Racial 6.3%
Native Hawaiian/Pacific Islander 6.8%
White 5.5%
Other Student Groups
Economically Disadvantaged 7.9%
Not Economically Disadvantaged 3.3%
TAG 2.3%
Not TAG 6.1%
English Learners1 5.4%
Not English Learners 5.8%
Special Education 11.1%
Not Special Education 4.9%
Source: Spring Membership, Discipline Incidents, Title III: English Learner. Includes only discipline incidents resulting in suspension (in school or out of school) or expulsion. For more data regarding discipline incidents, please see the School Discipline, Bullying, and Restraint and Seclusion page. Note: Multi-Racial does not include students who reported Hispanic Ethnicity – these students are all reported under Hispanic. See the Federal Race and Ethnicity Reporting Assistance Manual for more information. 1English Learners is the new term for students identified as having a language other than English. ODE made this change to be consistent with other state reports and guidance.
5.92%
5.54%5.40%
5.17%
5.80%
2013-14 2014-15 2015-16 2016-17 2017-18
Percent of Students Enrolled on May 1 with One or More Discipline Incidents

Oregon Statewide Report Card 2017-18 23 Oregon Department of Education www.oregon.gov/ode Contact for this section: Jon Wiens, 503-947-5764, [email protected]
SCHOOL AND DISTRICT ACCOUNTABILITY
The Oregon Legislature created the school and district performance reports and the statewide report card in 1999. Under Oregon Revised Statutes (ORS) 329.105 and 329.115, these reports contain data from the most recent school year (if available) and help fulfill reporting requirements of state and federal laws. The aim of these reports was to provide clear, meaningful and relevant information to parents, educators and communities concerning public school and district performance, improvement and accountability. These reports have undergone multiple revisions since first being released in 2000.
The passage of the federal Every Student Succeeds Act (ESSA) in December 2015 provided Oregon with an opportunity to further improve the school and district reports so that they could better meet the two objectives outlined in ORS 329.105: to inform parents and to improve schools. The ESSA law provided states with greater flexibility in reporting and evaluating school performance, but it does require that states identify two groups of schools for support through federal Title I funds. Schools identified for comprehensive support must include the lowest performing 5 percent of Title I schools, and any school with graduation rates below 67 percent, while schools identified for targeted support include schools with low performing student groups, regardless of Title I status. Prior to the passage of the ESSA an overall school rating was used to identify schools for extra supports. ODE worked with stakeholder and advisory groups to create an Oregon Plan that met the needs and values of Oregon and met the requirements of the ESSA. These groups recommended that Oregon use a system based on multiple measures of school success, and without an overall rating. The measures (indicators) used are:
Regular attenders
Achievement in English Language Arts
Achievement in mathematics
Growth in English Language Arts (grades 3 through 8)
Growth in mathematics (grade 3 through 8)
Progress of English learners
9th grade on-track
Four-year graduation rates
Five-year completion rates
Each of these indicators is rated on a scale of one to five, with five being the highest. Level 1 indicates that a school or student group is in the lowest 10 percent of schools in the state, while a Level 5 indicates that the school or student group has met the state long-term goal for the indicator. Schools with sufficient data to be rated on at least five indicators are identified for comprehensive supports if the overall graduation rate is below 67 percent, or if the school is Title I and at least 50 percent of the indicators are Level 1. Schools not identified for comprehensive supports are identified for targeted support if they have a student group that is rated on at least five indicators and at least 50 percent of the rated indicators are Level 1.1
Number of Schools Identified for Support, by year2
Level of Support Title I Status 2017-18
Comprehensive Title I 47
Comprehensive Not Title I 43
Targeted Title I 62
Targeted Not Title I 42
Not Identified Title I 468
Not Identified Not Title I 583
1 More details on the process of school identification can be found on the Report Card Policy web page. 2 Data on specific school can be found on the School and District Profiles web page.
Oregon Statewide Report Card 2017-18 24 Oregon Department of Education www.oregon.gov/ode Contact for this section: Jon Wiens, 503-947-5764, [email protected]
MEASURES OF INTERIM PROGRESS
Measures of Interim Progress (MIP) are annual targets for school accountability indicators as required by the Every Student Succeeds Act (ESSA). The MIP for English Language Arts (ELA) and mathematics achievement, English language progress (ELP), and graduation are ESSA requirements. Oregon has also established MIPs for the five-year completers, regular attenders, 9th grade on track, and academic growth indicators that comprise Oregon’s new school accountability system. Assessment participation does not have a MIP, however, it does have an annual goal of 94.5 percent for all student groups. ODE does not expect revisions to the baseline values, MIP, or long-term goals for achievement and graduation; however, ODE intends to review the number of years to attain the long-term goal and may revise if appropriate. The 2017-18 MIP for the ‘All Students’ student group is the target for all student groups on the 2017-18 Report Card Rating Details report. In 2017-18, the indicator targets were diversified by student group. For MIP details by indicator and student group, please see pages 21-32.
Indicators English Language Arts Academic Achievement The percentage of students who meet the standard on the state English Language Arts assessment. Mathematics Academic Achievement The percentage of students who meet the standard on the state Mathematics assessment. English Language Arts Academic Growth The median growth percentile of students on the English Language Arts assessment. Mathematics Academic Growth The median growth percentile of students on the Mathematics assessment. Regular Attenders The percentage of students who attended more than 90 percent of their enrolled days. 9th Grade On-Track The percentage of students who earned at least one fourth of graduation credits during their 9th grade year. Four-Year Graduation The percentage of students who earned a regular or modified diploma within four years of entering 9th grade. Five-Year Completers The percentage of students who earned a regular or modified diploma, or earn a GED, extended diploma or adult high school diploma within five years of entering 9th grade. English Language Proficiency The percentage of students who are meeting progress expectations on the state English Language Proficiency Assessment. For more information, see the Report Card Policy page.

Oregon Statewide Report Card 2017-18 25 Oregon Department of Education www.oregon.gov/ode Contact for this section: Jon Wiens, 503-947-5764, [email protected]
English Language Arts Academic Achievement Details for Elementary (Grades 3-5)
Long Term Goal1: 80%
Student Group School Year
2015-16 School Year
2016-17 School Year
2017-18 3-year
Average
All Students 52.4% 49.6% 51.4% 51.1%
Economically Disadvantaged 40.7% 37.5% 39.1% 39.1%
English Learners2 25.0% 21.8% 26.4% 24.5%
Students with Disabilities 25.0% 23.4% 24.9% 24.5%
American Indian/Alaska Native 35.5% 30.4% 34.8% 33.6%
Black/African American 31.5% 29.0% 29.4% 30.0%
Hispanic/Latino 34.1% 30.9% 32.5% 32.4%
Native Hawaiian/Pacific Islander 40.4% 33.8% 33.9% 36.0%
Underserved Race/Ethnicity3 34.1% 30.8% 32.4% 32.4%
Asian 69.9% 68.5% 69.5% 69.3%
White 59.2% 56.6% 58.6% 58.2%
Multi-racial4 57.1% 54.7% 56.2% 56.0%
Mathematics Academic Achievement Details for Elementary (Grades 3-5)
Long Term Goal1: 80%
Student Group School Year
2015-16 School Year
2016-17 School Year
2017-18 3-year
Average
All Students 44.9% 43.6% 43.7% 44.1%
Economically Disadvantaged 32.9% 31.6% 31.5% 32.0%
English Learners2 20.4% 19.8% 23.1% 21.2%
Students with Disabilities 22.1% 21.1% 21.0% 21.4%
American Indian/Alaska Native 28.7% 26.6% 29.4% 28.2%
Black/African American 21.6% 20.2% 20.1% 20.7%
Hispanic/Latino 26.5% 25.8% 26.1% 26.1%
Native Hawaiian/Pacific Islander 29.4% 26.6% 24.9% 26.9%
Underserved Race/Ethnicity3 26.3% 25.4% 25.7% 25.8%
Asian 68.0% 66.7% 67.7% 67.5%
White 51.7% 50.2% 50.3% 50.7%
Multi-racial4 48.3% 47.5% 46.3% 47.3%
Notes: 1 The State long-term goal in 2024-25 2 The English Learners student group includes current English Learners as well as monitored English Learners (four years). 3 The Underserved Race/Ethnicity student group consists of the following racial/ethnic groups: American Indian/Alaska Native, Black/African American, Hispanic/Latino, and Native Hawaiian/Pacific Islander. 4 Multi-racial does not include students who reported Hispanic ethnicity – these students are all reported under Hispanic. See the Federal Race and Ethnicity Reporting Assistance Manual for more information.

Oregon Statewide Report Card 2017-18 26 Oregon Department of Education www.oregon.gov/ode Contact for this section: Jon Wiens, 503-947-5764, [email protected]
English Language Arts Academic Achievement Details for Middle (Grades 6-8)
Long Term Goal1: 80%
Student Group School Year
2015-16 School Year
2016-17 School Year
2017-18 3-year
Average
All Students 56.7% 55.2% 55.9% 55.9%
Economically Disadvantaged 44.1% 42.3% 43.1% 43.2%
English Learners2 20.0% 17.8% 30.3% 23.7%
Students with Disabilities 20.1% 18.6% 19.4% 19.4%
American Indian/Alaska Native 38.9% 35.6% 38.9% 37.8%
Black/African American 34.4% 33.4% 33.6% 33.8%
Hispanic/Latino 39.7% 38.7% 39.6% 39.3%
Native Hawaiian/Pacific Islander 43.3% 38.8% 39.2% 40.4%
Underserved Race/Ethnicity3 39.3% 38.1% 39.1% 38.8%
Asian 75.5% 75.2% 74.3% 75.0%
White 62.6% 60.9% 62.0% 61.8%
Multi-racial4 61.0% 59.3% 59.7% 60.0%
Mathematics Academic Achievement Details for Middle (Grades 6-8)
Long Term Goal1: 80%
Student Group School Year
2015-16 School Year
2016-17 School Year
2017-18 3-year
Average
All Students 42.8% 41.9% 41.0% 41.9%
Economically Disadvantaged 29.5% 28.4% 27.6% 28.5%
English Learners2 12.2% 11.2% 18.6% 14.6%
Students with Disabilities 14.6% 13.8% 12.4% 13.6%
American Indian/Alaska Native 25.1% 26.1% 24.0% 25.1%
Black/African American 20.6% 19.2% 17.9% 19.3%
Hispanic/Latino 25.0% 24.8% 24.0% 24.6%
Native Hawaiian/Pacific Islander 29.0% 27.2% 27.1% 27.7%
Underserved Race/Ethnicity3 24.8% 24.5% 23.6% 24.3%
Asian 70.0% 68.9% 68.5% 69.1%
White 48.5% 47.5% 46.8% 47.6%
Multi-racial4 46.4% 45.1% 44.6% 45.3%
Notes: 1 The State long-term goal in 2024-25 2 The English Learners student group includes current English Learners as well as monitored English Learners (four years). 3 The Underserved Race/Ethnicity student group consists of the following racial/ethnic groups: American Indian/Alaska Native, Black/African American, Hispanic/Latino, and Native Hawaiian/Pacific Islander. 4 Multi-racial does not include students who reported Hispanic ethnicity – these students are all reported under Hispanic. See the Federal Race and Ethnicity Reporting Assistance Manual for more information.

Oregon Statewide Report Card 2017-18 27 Oregon Department of Education www.oregon.gov/ode Contact for this section: Jon Wiens, 503-947-5764, [email protected]
English Language Arts Academic Achievement Details for High (Grade 11)
Long Term Goal1: 80%
Student Group School Year
2015-16 School Year
2016-17 School Year
2017-18 3-year
Average
All Students 70.0% 71.1% 71.7% 70.9%
Economically Disadvantaged 59.5% 60.6% 61.6% 60.5%
English Learners1 17.6% 14.3% 24.2% 19.8%
Students with Disabilities 29.5% 30.1% 30.9% 30.2%
American Indian/Alaska Native 54.8% 54.8% 60.8% 56.6%
Black/African American 43.8% 45.4% 47.7% 45.5%
Hispanic/Latino 57.6% 59.0% 59.4% 58.7%
Native Hawaiian/Pacific Islander 53.7% 53.7% 55.9% 54.4%
Underserved Race/Ethnicity2 56.0% 57.5% 58.4% 57.3%
Asian 76.1% 79.0% 77.5% 77.5%
White 74.8% 76.0% 77.0% 75.9%
Multi-racial3 74.8% 73.7% 73.3% 73.9%
Mathematics Academic Achievement Details for High (Grade 11)
Long Term Goal1: 80%
Student Group School Year
2015-16 School Year
2016-17 School Year
2017-18 3-year
Average
All Students 34.2% 35.3% 34.4% 34.6%
Economically Disadvantaged 23.1% 23.4% 23.1% 23.2%
English Learners2 10.5% 9.2% 8.0% 9.0%
Students with Disabilities 10.4% 10.7% 8.6% 9.9%
American Indian/Alaska Native 17.2% 18.6% 19.3% 18.4%
Black/African American 13.1% 13.5% 15.5% 14.0%
Hispanic/Latino 19.9% 20.8% 20.6% 20.4%
Native Hawaiian/Pacific Islander 19.2% 20.7% 20.2% 20.1%
Underserved Race/Ethnicity3 19.1% 20.0% 20.2% 19.8%
Asian 56.3% 56.1% 57.5% 56.6%
White 38.6% 40.2% 39.0% 39.2%
Multi-racial4 39.5% 37.7% 36.0% 37.7%
Notes: 1 The State long-term goal in 2024-25 2 The English Learners student group includes current English Learners as well as monitored English Learners (four years). 3 The Underserved Race/Ethnicity student group consists of the following racial/ethnic groups: American Indian/Alaska Native, Black/African American, Hispanic/Latino, and Native Hawaiian/Pacific Islander. 4 Multi-racial does not include students who reported Hispanic ethnicity – these students are all reported under Hispanic. See the Federal Race and Ethnicity Reporting Assistance Manual for more information.

Oregon Statewide Report Card 2017-18 28 Oregon Department of Education https://www.oregon.gov/ode Contact for this section: Jon Wiens, 503-947-5764, [email protected]
English Language Arts Academic Growth Details for Elementary (Grades 3-5)
Long Term Goal1: 60%
Student Group School Year
2015-16 School Year
2016-17 School Year
2017-18 3-year
Average
All Students 50.0 50.0 50.0 50.0
Economically Disadvantaged 47.0 47.0 47.0 47.0
English Learners2 46.0 49.0 48.0 48.0
Students with Disabilities 40.0 41.0 43.0 42.0
American Indian/Alaska Native 45.0 41.5 45.0 44.0
Black/African American 45.0 43.5 43.0 44.0
Hispanic/Latino 47.0 48.0 47.0 47.0
Native Hawaiian/Pacific Islander 47.0 47.0 46.0 47.0
Underserved Race/Ethnicity3 47.0 47.0 47.0 47.0
Asian 58.0 60.0 59.0 59.0
White 51.0 51.0 51.0 51.0
Multi-racial4 50.0 50.0 50.0 50.0
Mathematics Academic Growth Details for Elementary (Grades 3-5)
Long Term Goal1: 60%
Student Group School Year
2015-16 School Year
2016-17 School Year
2017-18 3-year
Average
All Students 50.0 50.0 50.0 50.0
Economically Disadvantaged 47.0 47.0 47.0 47.0
English Learners2 44.0 48.0 47.0 46.5
Students with Disabilities 42.0 43.0 44.0 43.0
American Indian/Alaska Native 42.0 46.0 46.0 45.0
Black/African American 42.0 39.0 41.0 41.0
Hispanic/Latino 46.0 47.0 47.0 47.0
Native Hawaiian/Pacific Islander 47.0 47.0 46.0 47.0
Underserved Race/Ethnicity3 45.0 46.0 46.0 46.0
Asian 57.0 58.0 59.0 58.0
White 52.0 51.0 51.0 52.0
Multi-racial4 50.0 50.0 50.0 50.0
Notes: 1 The State long-term goal in 2024-25 2 The English Learners student group includes current English Learners as well as monitored English Learners (four years). 3 The Underserved Race/Ethnicity student group consists of the following racial/ethnic groups: American Indian/Alaska Native, Black/African American, Hispanic/Latino, and Native Hawaiian/Pacific Islander. 4 Multi-racial does not include students who reported Hispanic ethnicity – these students are all reported under Hispanic. See the Federal Race and Ethnicity Reporting Assistance Manual for more information.

Oregon Statewide Report Card 2017-18 29 Oregon Department of Education https://www.oregon.gov/ode Contact for this section: Jon Wiens, 503-947-5764, [email protected]
English Language Arts Academic Growth Details for Middle (Grades 6-8)
Long Term Goal1: 60%
Student Group School Year
2015-16 School Year
2016-17 School Year
2017-18 3-year
Average
All Students 50.0 50.0 50.0 50.0
Economically Disadvantaged 47.0 48.0 49.0 48.0
English Learners2 44.0 49.0 51.0 48.0
Students with Disabilities 40.0 44.0 46.0 43.0
American Indian/Alaska Native 48.0 46.5 50.0 48.0
Black/African American 44.0 44.0 44.0 44.0
Hispanic/Latino 47.0 48.0 49.0 48.0
Native Hawaiian/Pacific Islander 47.0 44.0 49.0 47.0
Underserved Race/Ethnicity3 47.0 48.0 49.0 48.0
Asian 59.0 59.0 58.0 59.0
White 51.0 50.0 50.0 51.0
Multi-racial4 51.0 50.0 49.0 50.0
Mathematics Academic Growth Details for Middle (Grades 6-8)
Long Term Goal1: 60%
Student Group School Year
2015-16 School Year
2016-17 School Year
2017-18 3-year
Average
All Students 50.0 50.0 50.0 50.0
Economically Disadvantaged 47.0 48.0 49.0 48.0
English Learners2 44.0 49.0 51.0 48.0
Students with Disabilities 40.0 44.0 46.0 43.0
American Indian/Alaska Native 48.0 46.5 50.0 48.0
Black/African American 44.0 44.0 44.0 44.0
Hispanic/Latino 47.0 48.0 49.0 48.0
Native Hawaiian/Pacific Islander 47.0 44.0 49.0 47.0
Underserved Race/Ethnicity3 47.0 48.0 49.0 48.0
Asian 59.0 59.0 58.0 59.0
White 51.0 50.0 50.0 51.0
Multi-racial4 51.0 50.0 49.0 50.0
Notes: 1 The State long-term goal in 2024-25 2 The English Learners student group includes current English Learners as well as monitored English Learners (four years). 3 The Underserved Race/Ethnicity student group consists of the following racial/ethnic groups: American Indian/Alaska Native, Black/African American, Hispanic/Latino, and Native Hawaiian/Pacific Islander. 4 Multi-racial does not include students who reported Hispanic ethnicity – these students are all reported under Hispanic. See the Federal Race and Ethnicity Reporting Assistance Manual for more information.

Oregon Statewide Report Card 2017-18 30 Oregon Department of Education www.oregon.gov/ode Contact for this section: Jon Wiens, 503-947-5764, [email protected]
Regular Attenders Details for Elementary (Grades K-5)
Long Term Goal1: 93%
Student Group School Year
2015-16 School Year
2016-17 School Year
2017-18 3-year
Average
All Students 85.8% 84.5% 84.3% 84.8%
Economically Disadvantaged 82.1% 80.4% 80.3% 80.9%
English Learners2 86.1% 83.2% 82.8% 84.1%
Students with Disabilities 79.6% 78.1% 78.2% 78.6%
American Indian/Alaska Native 75.5% 74.2% 76.5% 75.4%
Black/African American 83.9% 81.8% 81.0% 82.2%
Hispanic/Latino 84.8% 82.0% 82.0% 82.9%
Native Hawaiian/Pacific Islander 76.6% 71.1% 71.6% 73.1%
Underserved Race/Ethnicity3 84.1% 81.3% 81.4% 82.3%
Asian 94.3% 94.2% 93.6% 94.0%
White 86.2% 85.4% 85.1% 85.6%
Multi-racial4 84.4% 83.6% 82.9% 83.6%
Regular Attenders Details for Middle (Grades 6-8)
Long Term Goal1: 93%
Student Group School Year
2015-16 School Year
2016-17 School Year
2017-18 3-year
Average
All Students 83.5% 82.0% 81.3% 82.2%
Economically Disadvantaged 78.9% 76.8% 76.4% 77.4%
English Learners2 82.7% 79.2% 78.0% 79.8%
Students with Disabilities 77.0% 74.5% 73.5% 75.0%
American Indian/Alaska Native 73.3% 71.3% 72.0% 72.2%
Black/African American 83.2% 79.9% 78.0% 80.4%
Hispanic/Latino 83.3% 80.5% 79.6% 81.1%
Native Hawaiian/Pacific Islander 81.2% 75.2% 75.9% 77.3%
Underserved Race/Ethnicity3 82.7% 79.9% 79.0% 80.5%
Asian 95.8% 94.9% 94.9% 95.2%
White 83.2% 82.1% 81.5% 82.3%
Multi-racial4 81.5% 81.1% 80.4% 81.0%
Notes: 1 The State long-term goal in 2024-25 2 The English Learners student group includes current English Learners as well as monitored English Learners (four years). 3 The Underserved Race/Ethnicity student group consists of the following racial/ethnic groups: American Indian/Alaska Native, Black/African American, Hispanic/Latino, and Native Hawaiian/Pacific Islander. 4 Multi-racial does not include students who reported Hispanic ethnicity – these students are all reported under Hispanic. See the Federal Race and Ethnicity Reporting Assistance Manual for more information.

Oregon Statewide Report Card 2017-18 31 Oregon Department of Education www.oregon.gov/ode Contact for this section: Jon Wiens, 503-947-5764, [email protected]
Regular Attenders Details for High (Grades 9-10)
Long Term Goal1: 93%
Student Group School Year
2015-16 School Year
2016-17 School Year
2017-18 3-year
Average
All Students 77.6% 77.6% 76.3% 77.2%
Economically Disadvantaged 70.2% 70.0% 68.5% 69.6%
English Learners2 69.5% 68.9% 67.8% 68.7%
Students with Disabilities 67.6% 68.0% 66.2% 67.2%
American Indian/Alaska Native 65.5% 65.3% 65.0% 65.3%
Black/African American 72.8% 73.0% 70.4% 72.1%
Hispanic/Latino 73.9% 73.1% 71.1% 72.7%
Native Hawaiian/Pacific Islander 69.5% 68.8% 65.1% 67.7%
Underserved Race/Ethnicity3 73.2% 72.6% 70.6% 72.1%
Asian 93.2% 93.1% 92.6% 93.0%
White 78.4% 78.7% 77.7% 78.3%
Multi-racial4 76.6% 77.4% 75.2% 76.4%
9th Grade On-Track Details Long Term Goal1: 95%
Student Group School Year
2015-16 School Year
2016-17 School Year
2017-18 3-year
Average
All Students 83.5% 83.5% 84.5% 83.8%
Economically Disadvantaged 76.2% 75.8% 77.1% 76.4%
English Learners2 67.6% 65.7% 69.6% 67.8%
Students with Disabilities 68.8% 69.7% 71.5% 70.0%
American Indian/Alaska Native 73.5% 70.8% 76.0% 73.4%
Black/African American 78.7% 75.7% 79.0% 77.8%
Hispanic/Latino 77.8% 77.3% 78.9% 78.0%
Native Hawaiian/Pacific Islander 79.9% 76.1% 77.7% 77.9%
Underserved Race/Ethnicity3 77.7% 76.8% 78.8% 77.8%
Asian 95.1% 95.5% 96.0% 95.5%
White 85.2% 85.5% 86.3% 85.6%
Multi-racial4 83.0% 83.8% 83.6% 83.5%
Notes: 1 The State long-term goal in 2024-25 2 The English Learners student group includes current English Learners as well as monitored English Learners (four years). 3 The Underserved Race/Ethnicity student group consists of the following racial/ethnic groups: American Indian/Alaska Native, Black/African American, Hispanic/Latino, and Native Hawaiian/Pacific Islander. 4 Multi-racial does not include students who reported Hispanic ethnicity – these students are all reported under Hispanic. See the Federal Race and Ethnicity Reporting Assistance Manual for more information.

Oregon Statewide Report Card 2017-18 32 Oregon Department of Education www.oregon.gov/ode Contact for this section: Jon Wiens, 503-947-5764, [email protected]
Four-Year Cohort Graduation Details Long Term Goal1: 90%
Student Group Cohort Year
2011-12 Cohort Year
2012-13 Cohort Year
2013-14 3-year
Average
All Students 73.8% 74.8% 76.7% 75.1%
Economically Disadvantaged 66.4% 68.1% 70.1% 68.2%
English Learners2 51.2% 52.9% 54.9% 52.9%
Students with Disabilities 52.7% 55.5% 58.8% 55.7%
American Indian/Alaska Native 55.0% 56.4% 59.1% 56.8%
Black/African American 62.6% 66.1% 67.6% 65.5%
Hispanic/Latino 67.4% 69.4% 72.5% 69.8%
Native Hawaiian/Pacific Islander 63.2% 70.1% 69.4% 67.6%
Underserved Race/Ethnicity3 65.9% 68.3% 71.1% 68.5%
Asian 87.5% 88.0% 88.9% 88.1%
White 76.0% 76.6% 78.0% 76.9%
Multi-racial4 72.7% 74.4% 77.4% 74.9%
Five-Year Completers Details Long Term Goal1: 97%
Student Group Cohort Year
2010-11 Cohort Year
2011-12 Cohort Year
2012-13 3-year
Average
All Students 76.5% 77.8% 78.9% 77.7%
Economically Disadvantaged 70.0% 72.0% 73.4% 71.8%
English Learners2 61.2% 61.2% 63.8% 62.0%
Students with Disabilities 58.4% 59.9% 62.8% 60.4%
American Indian/Alaska Native 59.2% 59.8% 61.1% 60.0%
Black/African American 67.2% 69.9% 74.3% 70.4%
Hispanic/Latino 71.4% 73.6% 75.6% 73.6%
Native Hawaiian/Pacific Islander 72.4% 69.2% 73.1% 71.6%
Underserved Race/Ethnicity3 70.0% 72.1% 74.5% 72.3%
Asian 90.0% 90.9% 91.6% 90.8%
White 78.1% 79.3% 79.9% 79.1%
Multi-racial4 74.1% 76.1% 78.3% 76.2%
Notes: 1 The State long-term goal in 2024-25 2 The English Learners student group includes current English Learners as well as monitored English Learners (four years). 3 The Underserved Race/Ethnicity student group consists of the following racial/ethnic groups: American Indian/Alaska Native, Black/African American, Hispanic/Latino, and Native Hawaiian/Pacific Islander. 4 Multi-racial does not include students who reported Hispanic ethnicity – these students are all reported under Hispanic. See the Federal Race and Ethnicity Reporting Assistance Manual for more information..

Oregon Statewide Report Card 2017-18 33 Oregon Department of Education https://www.oregon.gov/ode Contact for this section: Jon Wiens, 503-947-5764, [email protected]
On Track to English Language Proficiency (ELP) Details for Elementary (Grades K-5)
Long Term Goal1: 80%
Student Group School Year
2015-16 School Year
2016-17 School Year
2017-18 2-year
Average
All Students N/A 55.9% 54.5% 55.2%
On Track to English Language Proficiency (ELP) Details for Middle (Grades 6-8)
Long Term Goal1: 80%
Student Group School Year
2015-16 School Year
2016-17 School Year
2017-18 2-year
Average
All Students N/A 36.7% 33.0% 34.8%
On Track to English Language Proficiency (ELP) Details for High (Grades 9-12)
Long Term Goal1: 80%
Student Group School Year
2015-16 School Year
2016-17 School Year
2017-18 2-year
Average
All Students N/A 32.7% 31.0% 31.8%
Notes: 1 The State long-term goal in 2024-25

Oregon Statewide Report Card 2017-18 34 Oregon Department of Education www.oregon.gov/ode Contact for this section: Jon Wiens, 503-947-5764, [email protected]
English Language Arts Participation Details for Elementary (Grades 3-5)
Annual Goal1: 94.5%
Student Group School Year
2015-16 School Year
2016-17 School Year
2017-18 3-year
Average
All Students 96.6% 95.8% 95.7% 96.0%
Economically Disadvantaged 97.4% 96.3% 96.2% 96.6%
English Learners2 98.9% 98.5% 98.0% 98.5%
Students with Disabilities 92.0% 90.1% 88.9% 90.3%
American Indian/Alaska Native 96.7% 95.1% 95.3% 95.7%
Black/African American 96.1% 94.6% 93.4% 94.7%
Hispanic/Latino 98.2% 97.6% 97.2% 97.7%
Native Hawaiian/Pacific Islander 98.9% 98.0% 98.1% 98.3%
Underserved Race/Ethnicity3 98.0% 97.3% 96.8% 97.4%
Asian 97.8% 98.0% 98.2% 98.0%
White 95.8% 95.1% 95.1% 95.3%
Multi-racial4 96.4% 95.5% 95.4% 95.8%
Mathematics Participation Details for Elementary (Grades 3-5)
Annual Goal1: 94.5%
Student Group School Year
2015-16 School Year
2016-17 School Year
2017-18 3-year
Average
All Students 96.3% 95.5% 95.4% 95.7%
Economically Disadvantaged 97.1% 96.0% 95.8% 96.3%
English Learners2 98.8% 98.2% 97.8% 98.3%
Students with Disabilities 91.6% 89.7% 88.5% 89.9%
American Indian/Alaska Native 96.6% 95.1% 94.9% 95.5%
Black/African American 95.7% 93.6% 92.4% 93.9%
Hispanic/Latino 98.0% 97.4% 97.0% 97.4%
Native Hawaiian/Pacific Islander 98.3% 97.6% 97.8% 97.9%
Underserved Race/Ethnicity3 97.8% 97.0% 96.5% 97.1%
Asian 97.9% 97.8% 98.2% 98.0%
White 95.5% 94.7% 94.8% 95.0%
Multi-racial4 96.2% 95.3% 94.8% 95.4%
Notes: 1 Assessment participation has an annual goal of 94.5% 2 The English Learners student group includes current English Learners as well as monitored English Learners (four years). 3 The Underserved Race/Ethnicity student group consists of the following racial/ethnic groups: American Indian/Alaska Native, Black/African American, Hispanic/Latino, and Native Hawaiian/Pacific Islander. 4 Multi-racial does not include students who reported Hispanic ethnicity – these students are all reported under Hispanic. See the Federal Race and Ethnicity Reporting Assistance Manual for more information.

Oregon Statewide Report Card 2017-18 35 Oregon Department of Education www.oregon.gov/ode Contact for this section: Jon Wiens, 503-947-5764, [email protected]
English Language Arts Participation Details for Middle (Grades 6-8)
Annual Goal1: 94.5%
Student Group School Year
2015-16 School Year
2016-17 School Year
2017-18 3-year
Average
All Students 96.3% 95.2% 94.7% 95.4%
Economically Disadvantaged 96.9% 95.7% 95.2% 95.9%
English Learners2 98.4% 98.1% 97.8% 98.1%
Students with Disabilities 93.4% 91.1% 90.1% 91.6%
American Indian/Alaska Native 96.0% 94.7% 94.7% 95.1%
Black/African American 95.7% 93.4% 92.5% 93.9%
Hispanic/Latino 98.0% 97.4% 96.8% 97.4%
Native Hawaiian/Pacific Islander 97.6% 96.5% 96.1% 96.7%
Underserved Race/Ethnicity3 97.7% 96.9% 96.4% 97.0%
Asian 97.7% 97.2% 97.4% 97.4%
White 95.7% 94.8% 93.9% 94.7%
Multi-racial4 95.7% 94.8% 93.9% 94.8%
Mathematics Participation Details for Middle (Grades 6-8)
Annual Goal1: 94.5%
Student Group School Year
2015-16 School Year
2016-17 School Year
2017-18 3-year
Average
All Students 95.6% 94.4% 93.9% 94.6%
Economically Disadvantaged 96.2% 94.9% 94.3% 95.2%
English Learners2 98.2% 97.8% 97.3% 97.7%
Students with Disabilities 92.4% 90.3% 89.2% 90.6%
American Indian/Alaska Native 95.1% 94.1% 93.7% 94.3%
Black/African American 94.5% 91.5% 91.0% 92.3%
Hispanic/Latino 97.5% 96.8% 96.2% 96.8%
Native Hawaiian/Pacific Islander 97.6% 96.1% 95.3% 96.3%
Underserved Race/Ethnicity3 97.1% 96.2% 95.6% 96.3%
Asian 97.5% 96.8% 97.1% 97.1%
White 94.9% 93.5% 93.0% 93.8%
Multi-racial4 94.8% 94.0% 92.7% 93.8%
Notes: 1 Assessment participation has an annual goal of 94.5% 2 The English Learners student group includes current English Learners as well as monitored English Learners (four years). 3 The Underserved Race/Ethnicity student group consists of the following racial/ethnic groups: American Indian/Alaska Native, Black/African American, Hispanic/Latino, and Native Hawaiian/Pacific Islander. 4 Multi-racial does not include students who reported Hispanic ethnicity – these students are all reported under Hispanic. See the Federal Race and Ethnicity Reporting Assistance Manual for more information.
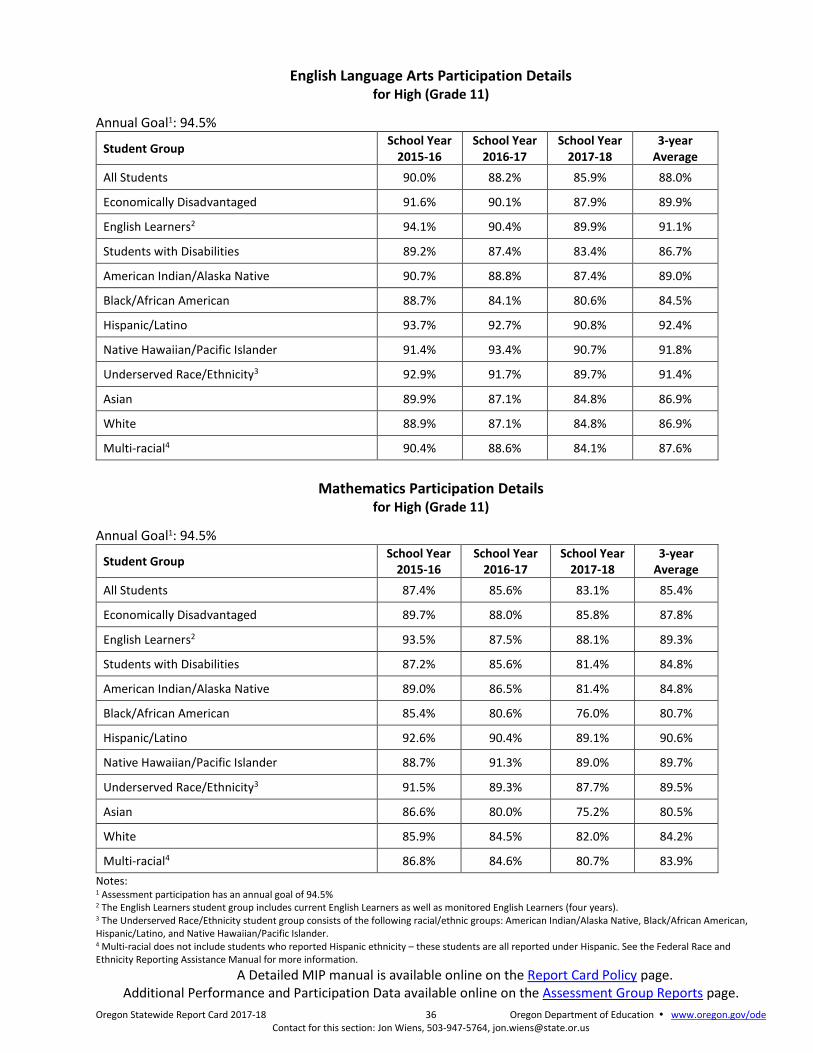
Oregon Statewide Report Card 2017-18 36 Oregon Department of Education www.oregon.gov/ode Contact for this section: Jon Wiens, 503-947-5764, [email protected]
English Language Arts Participation Details for High (Grade 11)
Annual Goal1: 94.5%
Student Group School Year
2015-16 School Year
2016-17 School Year
2017-18 3-year
Average
All Students 90.0% 88.2% 85.9% 88.0%
Economically Disadvantaged 91.6% 90.1% 87.9% 89.9%
English Learners2 94.1% 90.4% 89.9% 91.1%
Students with Disabilities 89.2% 87.4% 83.4% 86.7%
American Indian/Alaska Native 90.7% 88.8% 87.4% 89.0%
Black/African American 88.7% 84.1% 80.6% 84.5%
Hispanic/Latino 93.7% 92.7% 90.8% 92.4%
Native Hawaiian/Pacific Islander 91.4% 93.4% 90.7% 91.8%
Underserved Race/Ethnicity3 92.9% 91.7% 89.7% 91.4%
Asian 89.9% 87.1% 84.8% 86.9%
White 88.9% 87.1% 84.8% 86.9%
Multi-racial4 90.4% 88.6% 84.1% 87.6%
Mathematics Participation Details for High (Grade 11)
Annual Goal1: 94.5%
Student Group School Year
2015-16 School Year
2016-17 School Year
2017-18 3-year
Average
All Students 87.4% 85.6% 83.1% 85.4%
Economically Disadvantaged 89.7% 88.0% 85.8% 87.8%
English Learners2 93.5% 87.5% 88.1% 89.3%
Students with Disabilities 87.2% 85.6% 81.4% 84.8%
American Indian/Alaska Native 89.0% 86.5% 81.4% 84.8%
Black/African American 85.4% 80.6% 76.0% 80.7%
Hispanic/Latino 92.6% 90.4% 89.1% 90.6%
Native Hawaiian/Pacific Islander 88.7% 91.3% 89.0% 89.7%
Underserved Race/Ethnicity3 91.5% 89.3% 87.7% 89.5%
Asian 86.6% 80.0% 75.2% 80.5%
White 85.9% 84.5% 82.0% 84.2%
Multi-racial4 86.8% 84.6% 80.7% 83.9%
Notes: 1 Assessment participation has an annual goal of 94.5% 2 The English Learners student group includes current English Learners as well as monitored English Learners (four years). 3 The Underserved Race/Ethnicity student group consists of the following racial/ethnic groups: American Indian/Alaska Native, Black/African American, Hispanic/Latino, and Native Hawaiian/Pacific Islander. 4 Multi-racial does not include students who reported Hispanic ethnicity – these students are all reported under Hispanic. See the Federal Race and Ethnicity Reporting Assistance Manual for more information.
A Detailed MIP manual is available online on the Report Card Policy page. Additional Performance and Participation Data available online on the Assessment Group Reports page.

Oregon Statewide Report Card 2017-18 37 Oregon Department of Education www.oregon.gov/ode Contact for this section: Jon Wiens, 503-947-5764, [email protected]
Assessment Non-participation On June 22, 2015, House Bill 2655 was signed into law (effective January 1, 2016). Under House Bill 2655, parents and adult students were permitted to annually opt out of Oregon’s statewide summative tests in English Language Arts (ELA) and Math. The following tables show types of non-participation from the 2014-2015 school year through the 2017-2018 school year. Parents have historically had the ability to refuse their child’s participation in state tests for religious or disability-related reasons; however, there have been sharp declines in this type of non-participation since the opt-out option went into effect in the 2015-16 school year.
Percent Non-participant of Students Eligible to Take Smarter Balanced, ELA, 1415-1718
Non-Participant Type 2014-15 2015-16 2016-17 2017-18
Absent 0.0 0.1 0.0 0.0
Parent Refused Child Participation 1.4 0.0 0.0 0.0
Opt Out 0.0 2.8 3.5 2.8
Non-Participant Reason Unknown 2.6 1.6 1.9 3.4
Percent Non-participant of Students Eligible to Take Smarter Balanced, Math, 1415-1718
Non-Participant Type 2014-15 2015-16 2016-17 2017-18
Absent 0.0 0.1 0.0 0.1
Parent Refused Child Participation 1.5 0.0 0.0 0.0
Opt Out 0.0 3.3 3.6 3.3
Non-Participant Reason Unknown 2.9 1.9 2.7 3.5
Across both ELA and Math, there is a slight decrease in the percentage of those who opted out of taking the Smarter Balanced assessment in the 2017-18 school year. In 2017-18, 2.8 percent of students opted out of ELA and 3.3 percent of students opted out in Math. The percent of non-participants for unknown reasons rose to 3.4 percent of students in ELA and 3.5 percent in Math in the 2017-18 school year. For more information about student assessment and the option to opt-out of statewide summative assessments visit the student assessment page.
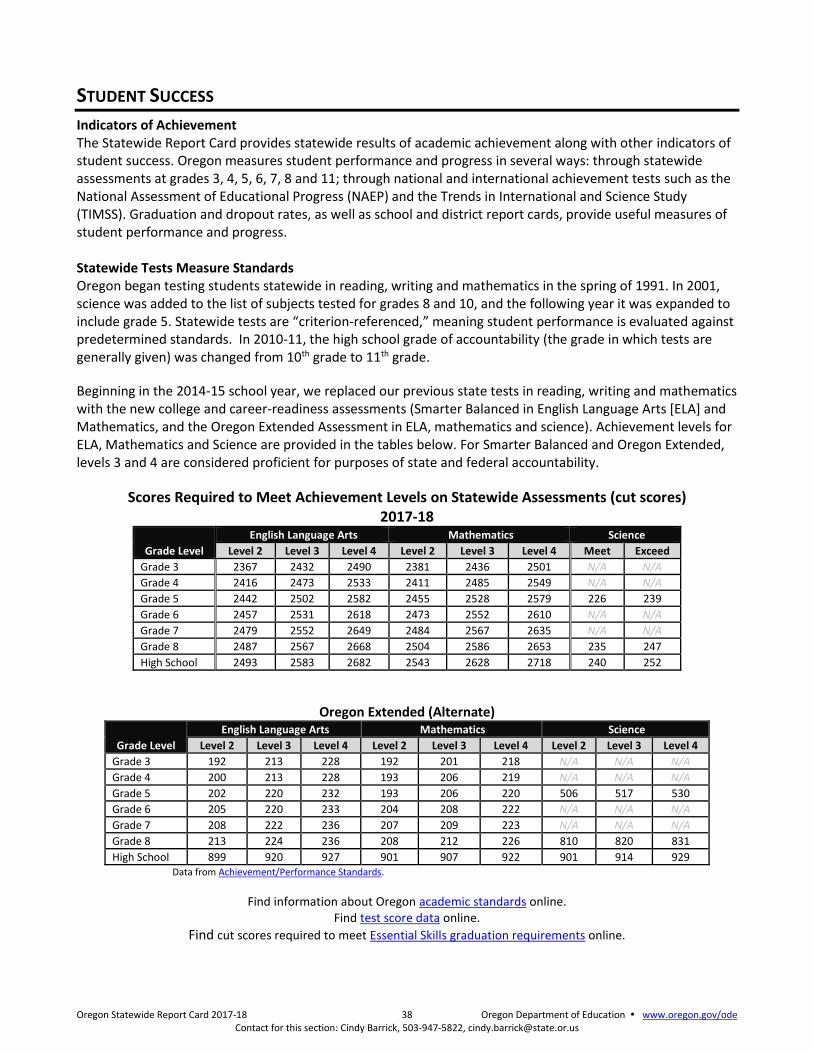
Oregon Statewide Report Card 2017-18 38 Oregon Department of Education www.oregon.gov/ode Contact for this section: Cindy Barrick, 503-947-5822, [email protected]
STUDENT SUCCESS
Indicators of Achievement The Statewide Report Card provides statewide results of academic achievement along with other indicators of student success. Oregon measures student performance and progress in several ways: through statewide assessments at grades 3, 4, 5, 6, 7, 8 and 11; through national and international achievement tests such as the National Assessment of Educational Progress (NAEP) and the Trends in International and Science Study (TIMSS). Graduation and dropout rates, as well as school and district report cards, provide useful measures of student performance and progress. Statewide Tests Measure Standards Oregon began testing students statewide in reading, writing and mathematics in the spring of 1991. In 2001, science was added to the list of subjects tested for grades 8 and 10, and the following year it was expanded to include grade 5. Statewide tests are “criterion-referenced,” meaning student performance is evaluated against predetermined standards. In 2010-11, the high school grade of accountability (the grade in which tests are generally given) was changed from 10th grade to 11th grade.
Beginning in the 2014-15 school year, we replaced our previous state tests in reading, writing and mathematics with the new college and career-readiness assessments (Smarter Balanced in English Language Arts [ELA] and Mathematics, and the Oregon Extended Assessment in ELA, mathematics and science). Achievement levels for ELA, Mathematics and Science are provided in the tables below. For Smarter Balanced and Oregon Extended, levels 3 and 4 are considered proficient for purposes of state and federal accountability.
Scores Required to Meet Achievement Levels on Statewide Assessments (cut scores) 2017-18
Grade Level
English Language Arts Mathematics Science
Level 2 Level 3 Level 4 Level 2 Level 3 Level 4 Meet Exceed
Grade 3 2367 2432 2490 2381 2436 2501 N/A N/A
Grade 4 2416 2473 2533 2411 2485 2549 N/A N/A
Grade 5 2442 2502 2582 2455 2528 2579 226 239
Grade 6 2457 2531 2618 2473 2552 2610 N/A N/A
Grade 7 2479 2552 2649 2484 2567 2635 N/A N/A
Grade 8 2487 2567 2668 2504 2586 2653 235 247
High School 2493 2583 2682 2543 2628 2718 240 252
Oregon Extended (Alternate)
Grade Level
English Language Arts Mathematics Science
Level 2 Level 3 Level 4 Level 2 Level 3 Level 4 Level 2 Level 3 Level 4
Grade 3 192 213 228 192 201 218 N/A N/A N/A
Grade 4 200 213 228 193 206 219 N/A N/A N/A
Grade 5 202 220 232 193 206 220 506 517 530
Grade 6 205 220 233 204 208 222 N/A N/A N/A
Grade 7 208 222 236 207 209 223 N/A N/A N/A
Grade 8 213 224 236 208 212 226 810 820 831
High School 899 920 927 901 907 922 901 914 929 Data from Achievement/Performance Standards.
Find information about Oregon academic standards online. Find test score data online.
Find cut scores required to meet Essential Skills graduation requirements online.

Oregon Statewide Report Card 2017-18 39 Oregon Department of Education www.oregon.gov/ode Contact for this section: Cindy Barrick, 503-947-5822, [email protected]
Student Performance in 2017-18 Percent of Students at Level 3 or 4 / Meets or Exceeds
Grade 3 English Language Arts (ELA) Mathematics Science
All Students 47% 46% N/A
Economically Disadvantaged 34% 35% N/A
English Learners* 9% 14% N/A
Students with Disabilities 21% 22% N/A
American Indian/Alaska Native 32% 33% N/A
Asian (not of Hispanic origin) 64% 68% N/A
Black (not of Hispanic origin) 25% 22% N/A
Hispanic origin 28% 29% N/A
Multi-racial 52% 49% N/A
Native Hawaiian/Pacific Islander 27% 27% N/A
White (not of Hispanic origin) 54% 53% N/A
Extended Assessment** 35% 38% N/A
Grade 4 English Language Arts (ELA) Mathematics Science
All Students 50% 43% N/A
Economically Disadvantaged 37% 31% N/A
English Learners* 9% 9% N/A
Students with Disabilities 21% 18% N/A
American Indian/Alaska Native 30% 27% N/A
Asian (not of Hispanic origin) 68% 68% N/A
Black (not of Hispanic origin) 28% 19% N/A
Hispanic origin 31% 25% N/A
Multi-racial 55% 46% N/A
Native Hawaiian/Pacific Islander 27% 19% N/A
White (not of Hispanic origin) 57% 50% N/A
Extended Assessment** 53% 34% N/A
Grade 5 English Language Arts (ELA) Mathematics Science
All Students 55% 40% 65%
Economically Disadvantaged 43% 27% 53%
English Learners* 8% 6% 15%
Students with Disabilities 21% 14% 35%
American Indian/Alaska Native 37% 24% 50%
Asian (not of Hispanic origin) 75% 66% 76%
Black (not of Hispanic origin) 32% 17% 38%
Hispanic origin 36% 23% 43%
Multi-racial 58% 41% 69%
Native Hawaiian/Pacific Islander 43% 26% 45%
White (not of Hispanic origin) 62% 46% 74%
Extended Assessment** 41% 36% 51%

Oregon Statewide Report Card 2017-18 40 Oregon Department of Education www.oregon.gov/ode Contact for this section: Cindy Barrick, 503-947-5822, [email protected]
Student Performance in 2017-18 Percent of Students at Level 3 or 4 / Meets or Exceeds
Grade 6 English Language Arts (ELA) Mathematics Science
All Students 52% 38% N/A
Economically Disadvantaged 40% 26% N/A
English Learners* 6% <5% N/A
Students with Disabilities 15% 9% N/A
American Indian/Alaska Native 34% 21% N/A
Asian (not of Hispanic origin) 70% 64% N/A
Black (not of Hispanic origin) 31% 14% N/A
Hispanic origin 36% 22% N/A
Multi-racial 57% 43% N/A
Native Hawaiian/Pacific Islander 36% 23% N/A
White (not of Hispanic origin) 58% 44% N/A
Extended Assessment** 44% 34% N/A
Grade 7 English Language Arts (ELA) Mathematics Science
All Students 57% 42% N/A
Economically Disadvantaged 44% 28% N/A
English Learners* 5% <5% N/A
Students with Disabilities 16% 10% N/A
American Indian/Alaska Native 39% 24% N/A
Asian (not of Hispanic origin) 77% 69% N/A
Black (not of Hispanic origin) 32% 18% N/A
Hispanic origin 40% 24% N/A
Multi-racial 60% 45% N/A
Native Hawaiian/Pacific Islander 41% 28% N/A
White (not of Hispanic origin) 63% 48% N/A
Extended Assessment** 44% 34% N/A
Grade 8 English Language Arts (ELA) Mathematics Science
All Students 56% 41% 60%
Economically Disadvantaged 43% 27% 48%
English Learners* 4% 5% 9%
Students with Disabilities 16% 8% 27%
Asian (not of Hispanic origin) 41% 24% 48%
Black (not of Hispanic origin) 75% 71% 72%
Hispanic origin 33% 17% 31%
Multi-racial 40% 24% 40%
Native Hawaiian/Pacific Islander 58% 42% 64%
American Indian/Alaska Native 38% 29% 37%
White (not of Hispanic origin) 62% 46% 68%
Extended Assessment** 41% 36% 51%

Oregon Statewide Report Card 2017-18 41 Oregon Department of Education www.oregon.gov/ode Contact for this section: Cindy Barrick, 503-947-5822, [email protected]
Student Performance in 2017-18 Percent of Students at Level 3 or 4 / Meets or Exceeds
High School Percent of Students at Level 3 or 4 / Meets or Exceeds
English Language Arts (ELA) Mathematics Science
All Students 70% 33% 54%
Economically Disadvantaged 60% 22% 42%
English Learners* 8% <5% <5%
Students with Disabilities 25% 5% 17%
American Indian/Alaska Native 58% 18% 42%
Asian (not of Hispanic origin) 77% 57% 62%
Black (not of Hispanic origin) 45% 13% 25%
Hispanic origin 58% 20% 34%
Multi-racial 72% 35% 56%
Native Hawaiian/Pacific Islander 54% 19% 31%
White (not of Hispanic origin) 76% 38% 61%
Extended Assessment** 56% 40% 62%
High School (Grade 11) English Language Arts Performance
Note: Multi-Racial does not include students who reported Hispanic Ethnicity – these students are all reported under Hispanic. See the Federal Race and Ethnicity Reporting Assistance Manual for more information. * English Learners is the term for students identified as having a language other than English. This group only includes students eligible for or participating in an English Learner program in the current school year. ** Extended assessments are alternatives to grade-level assessments for students with significant cognitive impairments. They are scored on an alternate scale.
74.666.3
60.0 63.6
8.4
49.7
25.2
0.0
20.0
40.0
60.0
80.0
100.0
Female Male Econo.Disadvantaged
Indian Education English Learners Migrant Education Students withDisabilities
2015-16 2016-17 2017-18
70.3
57.5
77.2
45.1
58.2
71.9
54.4
75.6
0.0
20.0
40.0
60.0
80.0
100.0
All Students AmericanIndian/Alaska
Native
Asian Black/AfricanAmerican
Hispanic/Latino Multi-Racial Pacific Islander White
2015-16 2016-17 2017-18
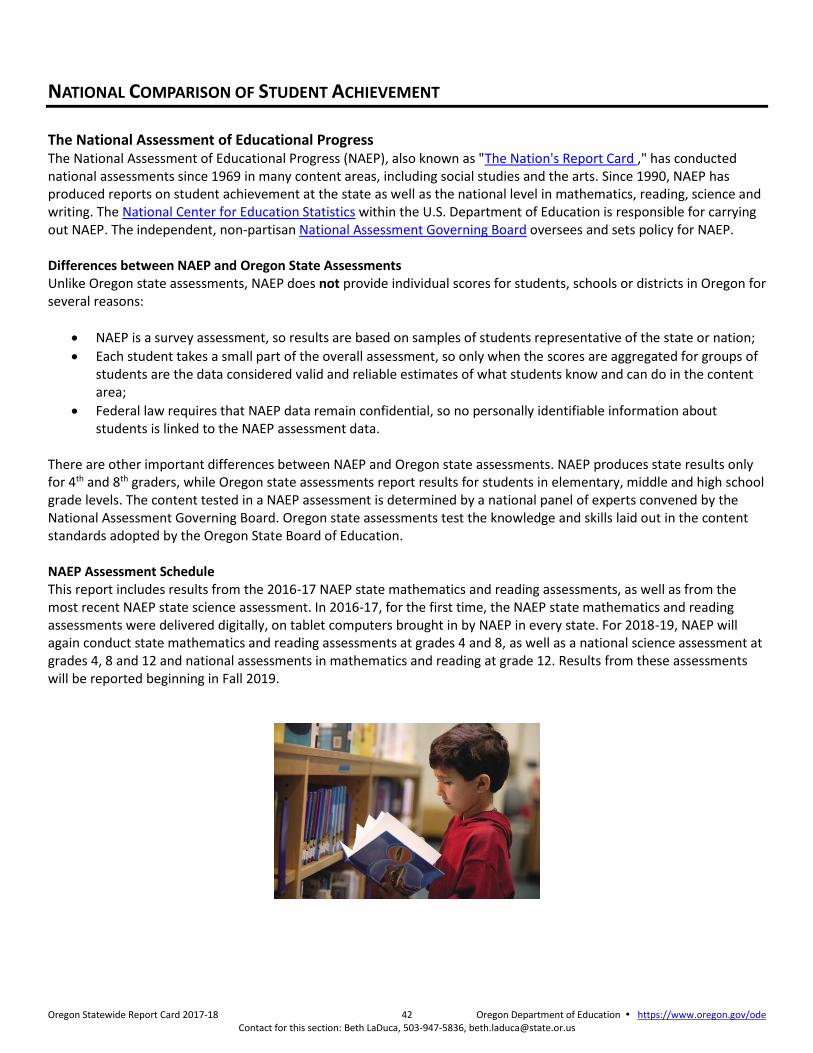
Oregon Statewide Report Card 2017-18 42 Oregon Department of Education https://www.oregon.gov/ode Contact for this section: Beth LaDuca, 503-947-5836, [email protected]
NATIONAL COMPARISON OF STUDENT ACHIEVEMENT
The National Assessment of Educational Progress The National Assessment of Educational Progress (NAEP), also known as "The Nation's Report Card ," has conducted national assessments since 1969 in many content areas, including social studies and the arts. Since 1990, NAEP has produced reports on student achievement at the state as well as the national level in mathematics, reading, science and writing. The National Center for Education Statistics within the U.S. Department of Education is responsible for carrying out NAEP. The independent, non-partisan National Assessment Governing Board oversees and sets policy for NAEP. Differences between NAEP and Oregon State Assessments Unlike Oregon state assessments, NAEP does not provide individual scores for students, schools or districts in Oregon for several reasons:
NAEP is a survey assessment, so results are based on samples of students representative of the state or nation;
Each student takes a small part of the overall assessment, so only when the scores are aggregated for groups of students are the data considered valid and reliable estimates of what students know and can do in the content area;
Federal law requires that NAEP data remain confidential, so no personally identifiable information about students is linked to the NAEP assessment data.
There are other important differences between NAEP and Oregon state assessments. NAEP produces state results only for 4th and 8th graders, while Oregon state assessments report results for students in elementary, middle and high school grade levels. The content tested in a NAEP assessment is determined by a national panel of experts convened by the National Assessment Governing Board. Oregon state assessments test the knowledge and skills laid out in the content standards adopted by the Oregon State Board of Education. NAEP Assessment Schedule This report includes results from the 2016-17 NAEP state mathematics and reading assessments, as well as from the most recent NAEP state science assessment. In 2016-17, for the first time, the NAEP state mathematics and reading assessments were delivered digitally, on tablet computers brought in by NAEP in every state. For 2018-19, NAEP will again conduct state mathematics and reading assessments at grades 4 and 8, as well as a national science assessment at grades 4, 8 and 12 and national assessments in mathematics and reading at grade 12. Results from these assessments will be reported beginning in Fall 2019.

Oregon Statewide Report Card 2017-18 43 Oregon Department of Education https://www.oregon.gov/ode Contact for this section: Beth LaDuca, 503-947-5836, [email protected]
National Assessment of Educational Progress: Reading, Grade 4, 2017 NAEP reports achievement levels and average scale scores. Average scale scores for reading are expressed on a 0-500 scale. NAEP has three achievement levels: Basic, Proficient and Advanced. The National Assessment Governing Board defines the NAEP achievement levels as follows: NAEP Achievement Levels:
2017 NAEP Grade 4 Reading Results Achievement Levels & Participation Rates
Advanced %
Proficient %
Basic %
Below Basic %
Participating %
All Students Oregon 8 26 30 37 99
United States 9 27 31 33* 98*
Economically Disadvantaged Oregon 4 19 30 48 ~
United States 3 18 32 46 ~
English Learners Oregon # 4 18 78 97
United States 1 8* 23 68* 92*
Students with Disabilities Oregon 2 11 15 72 93
United States 2 9 18 71 88*
Female Oregon 10 27 30 32 99
United States 10 28 32 30 98*
Male Oregon 5 24 29 42 98
United States 8* 25 30 36* 97
American Indian/Alaska Native (not of Hispanic origin)
Oregon ~ ~ ~ ~ ~
United States 3 18 28 51 98
Asian (not of Hispanic origin) Oregon 13 34 31 21 ~
United States 22* 36 25 16 ~
Black (not of Hispanic origin) Oregon ~ ~ ~ ~ ~
United States 3 16 31 50 97
Hispanic origin Oregon 3 15 27 56 98
United States 4 18 32* 46* 97*
Native Hawaiian or other Pacific Islander (not of Hispanic origin)
Oregon ~ ~ ~ ~ ~
United States 4 22 30 44 ~
Two or more races (not of Hispanic origin)
Oregon 10 29 30 32 100
United States 11 29 32 28 98*
White (not of Hispanic origin) Oregon 10 30 31 30 99
United States 12 34* 32 22* 98
Legend ~ Not reported by U.S. Department of Education # Rounds to zero * Value is significantly different from OR
Basic Partial mastery of prerequisite knowledge and skills that are fundamental for proficient work at each grade
Proficient Solid academic performance for each grade assessed. Students reaching this level have demonstrated competency over challenging subject matter, including subject-matter knowledge, application of such knowledge to real world situations, and analytical skills appropriate to the subject matter
Advanced Superior performance beyond proficient

Oregon Statewide Report Card 2017-18 44 Oregon Department of Education https://www.oregon.gov/ode Contact for this section: Beth LaDuca, 503-947-5836, [email protected]
National Assessment of Educational Progress: Reading, Grade 8, 2017 2017 NAEP Grade 8 Reading Results Achievement Levels & Participation Rates
Advanced %
Proficient %
Basic %
Below Basic %
Participating %
All Students Oregon 4 32 40 24 98
United States 4 31 41 25 98
Economically Disadvantaged Oregon 2 24 43 31 ~
United States 1 20* 43 36* ~
English Learners Oregon # 1 12 87 93
United States # 5 27* 68* 89
Students with Disabilities Oregon # 6 27 66 87
United States # 7 27 66 88
Female Oregon 6 37 39 18 98
United States 5 35 40 20 98
Male Oregon 2 27 41 29 97
United States 3 27 41 29 97
American Indian/Alaska Native (not of Hispanic origin)
Oregon ~ ~ ~ ~ ~
United States 1 20 42 37 97
Asian (not of Hispanic origin) Oregon 9 47 32 12 ~
United States 12 45 30 13 ~
Black (not of Hispanic origin) Oregon ~ ~ ~ ~ ~
United States 1 16 42 41 97
Hispanic origin Oregon 1 18 43 38 97
United States 1 21 44 34 97
Native Hawaiian or other Pacific Islander (not of Hispanic origin)
Oregon ~ ~ ~ ~ ~
United States 2 21 41 36 ~
Two or more races (not of Hispanic origin)
Oregon 6 34 44 16 98
United States 5 35 41 20 99
White (not of Hispanic origin) Oregon 5 38 39 18 98
United States 5 39 40 17 98
Legend ~ Not reported by U.S. Department of Education # Rounds to zero * Value is significantly different from OR Achievement level results from the 2017 NAEP reading assessment show that a larger percentage of all Oregon 4th graders performed at the "Below Basic" level than 4th graders in the nation's public schools. This was also true for Oregon English Learners, male students, Hispanic students and White students. A smaller percentage of Oregon Hispanic 4th graders performed at the "Basic" level than their peers in the nation's public schools. Smaller percentages of Oregon English Learners and White students performed at the "Proficient" level than their peers nationally, and smaller percentages of Oregon male students and Asian students reached the "Advanced" level than their peers in the nation's public schools. In 8th grade, a smaller percentage of Oregon Economically Disadvantaged 8th graders performed at the "Below Basic" level than Economically Disadvantaged 8th graders in the nation's public schools. However, a larger percentage of Oregon English Learners performed at the "Below Basic" level and a smaller percentage performed at the "Basic" level than their peers nationally. A larger percentage of Economically Disadvantaged 8th graders in Oregon performed at the "Proficient" level in comparison with their peers in the nation's public schools.

Oregon Statewide Report Card 2017-18 45 Oregon Department of Education https://www.oregon.gov/ode Contact for this section: Beth LaDuca, 503-947-5836, [email protected]
National Assessment of Educational Progress: Reading Grade 4 Average Scale Scores 1998 - 2017: Oregon and the Nation
In 1998, Oregon's 4th graders scored statistically the same as the nation's 4th graders. In 2017, Oregon's 4th graders scored 218, which was statistically lower than 4th graders in the nation's public schools (221).
* Value is significantly different from the value for the same jurisdiction in 2017. Values for Oregon are indicated with a box around the label. Grade 8 Average Scale Scores 1998 - 2017: Oregon and the Nation In 1998, Oregon’s 8th graders scored statistically higher than the nation's 8th graders. In 2017, Oregon's 8th graders scored 266, which was statistically the same as 8th graders in the nation's public schools (265).
* Value is significantly different from the value for the same jurisdiction in 2017. Values for Oregon are indicated with a box around the label.
212*
220 218
217 215 218 216 219 220Oregon
218
213*
217* 216*
217* 220* 220* 220 221 221Nation
221
150
170
190
210
230
250
270
290
Ave
rage
Sca
le S
core
(0
-50
0)
266 268264 263 266 265 264
268 268Oregon
266
261* 263* 261* 260* 261* 262* 264* 266 264* Nation265
195
215
235
255
275
295
315
335
Ave
rage
Sca
le S
core
(0
-50
0)

Oregon Statewide Report Card 2017-18 46 Oregon Department of Education https://www.oregon.gov/ode Contact for this section: Beth LaDuca, 503-947-5836, [email protected]
National Assessment of Educational Progress: Mathematics, Grade 4, 2017 NAEP reports achievement levels and average scale scores. Average scale scores for math are expressed on a 0-500 scale. NAEP has three achievement levels: Basic, Proficient and Advanced. The National Assessment Governing Board defines the NAEP achievement levels as follows: NAEP Achievement Levels:
2017 NAEP Grade 4 Math Results Achievement Levels & Participation Rates
Advanced %
Proficient %
Basic %
Below Basic %
Participating %
All Students Oregon 7 27 40 27 98
United States 8 32* 39 21* 98
Economically Disadvantaged Oregon 3 20 42 36 ~
United States 3 22 44 31* ~
English Learners Oregon # 5 32 63 96
United States 2 13* 39* 47* 93*
Students with Disabilities Oregon 3 10 25 61 91
United States 2 12 31 55 89
Female Oregon 5 25 41 28 99
United States 7 31* 42 21* 98
Male Oregon 8 28 38 26 98
United States 9 32* 37 21* 98
American Indian/Alaska Native (not of Hispanic origin)
Oregon ~ ~ ~ ~ ~
United States 3 22 44 31 98
Asian (not of Hispanic origin) Oregon 18 35 33 14 ~
United States 26 41 25 8 ~
Black (not of Hispanic origin) Oregon ~ ~ ~ ~ ~
United States 2 17 44 37 97
Hispanic origin Oregon 2 17 36 44 98
United States 3 23* 44* 30* 97
Native Hawaiian or other Pacific Islander (not of Hispanic origin)
Oregon ~ ~ ~ ~ ~
United States 4 23 43 30 ~
Two or more races (not of Hispanic origin)
Oregon 6 26 46 22 97
United States 10 34 39 16 98
White (not of Hispanic origin) Oregon 8 31 41 20 99
United States 11* 40* 37* 12* 99
Legend ~ Not reported by U.S. Department of Education # Rounds to zero * Value is significantly different from OR
Basic Partial mastery of prerequisite knowledge and skills that are fundamental for proficient work at each grade
Proficient Solid academic performance for each grade assessed. Students reaching this level have demonstrated competency over challenging subject matter, including subject-matter knowledge, application of such knowledge to real world situations, and analytical skills appropriate to the subject matter
Advanced Superior performance beyond proficient

Oregon Statewide Report Card 2017-18 47 Oregon Department of Education https://www.oregon.gov/ode Contact for this section: Beth LaDuca, 503-947-5836, [email protected]
National Assessment of Educational Progress: Mathematics, Grade 8, 2017
2017 NAEP Grade 8 Math Results Achievement Levels & Participation Rates
Advanced %
Proficient %
Basic %
Below Basic %
Participating %
All Students Oregon 9 24 36 30 99
United States 10 24 36 31 98
Economically Disadvantaged Oregon 4 18 37 40 ~
United States 3 15* 37 45* ~
English Learners Oregon 1 2 16 82 97
United States 1 5 23 72* 90*
Students with Disabilities Oregon 2 7 19 72 90
United States 1 5 20 74 89
Female Oregon 9 23 37 31 99
United States 9 24 37 31 99*
Male Oregon 10 26 35 30 98
United States 11 23 34 31 98
American Indian/Alaska Native (not of Hispanic origin)
Oregon ~ ~ ~ ~ ~
United States 4 15 38 43 98
Asian (not of Hispanic origin) Oregon 27 32 25 15 ~
United States 32 32 24 12 ~
Black (not of Hispanic origin) Oregon ~ ~ ~ ~ ~
United States 2 11 34 54 98
Hispanic origin Oregon 3 14 38 46 98
United States 3 16 37 43 97
Native Hawaiian or other Pacific Islander (not of Hispanic origin)
Oregon ~ ~ ~ ~ ~
United States 5 18 39 38 ~
Two or more races (not of Hispanic origin)
Oregon 15 26 28 31 98
United States 12 24 36 28 99
White (not of Hispanic origin) Oregon 10 29 37 23 99
United States 13* 30 37 20* 98 Legend ~ Not reported by U.S. Department of Education # Rounds to zero * Value is significantly different from OR
Achievement level results from the 2017 NAEP mathematics assessment show that a larger percentage of all Oregon 4th graders performed at the "Below Basic" level than 4th graders in the nation's public schools. This was also true for Economically Disadvantaged students, English Learners, female students, male students, Hispanic students and White students in Oregon. Smaller percentages of Oregon English Learners and Hispanic students, and a larger percentage of Oregon White students, performed at the "Basic" level than their peers in the nation's public schools. Smaller percentages of all Oregon 4th graders, English Learners, female students, male students, Hispanic students and White students performed at the "Proficient" level, and a smaller percentage of Oregon White students reached the "Advanced" level, than their peers in the nation's public schools. In 8th grade, a smaller percentage of Oregon Economically Disadvantaged students performed at the "Below Basic" level and a larger percentage at the "Proficient" level than their peers in the nation's public schools. Larger percentages of Oregon English Learners and White students performed at the "Below Basic" level, and a smaller percentage of Oregon White students reached the "Advanced" level, than their peers in the nation's public schools.

Oregon Statewide Report Card 2017-18 48 Oregon Department of Education https://www.oregon.gov/ode Contact for this section: Beth LaDuca, 503-947-5836, [email protected]
National Assessment of Educational Progress: Mathematics Grade 4 Average Scale Scores 2000 - 2017: Oregon and the Nation In 2000, Oregon's 4th graders scored statistically the same as the nation’s 4th graders. In 2017, Oregon's 4th graders scored 233, which was statistically lower than 4th graders in the nation's public schools (239).
* Value is significantly different from the value for the same jurisdiction in 2017. Values for Oregon are indicated with a box around the label. Grade 8 Average Scale Scores 2000 - 2017: Oregon and the Nation In 2000, Oregon’s 8th graders scored statistically higher than the nation's 8th graders. In 2017, Oregon's 8th graders scored 282, which was the same as 8th graders in the nation's public schools.
* Value is significantly different from the value for the same jurisdiction in 2017. Values for Oregon are indicated with a box around the label.
224*
236* 238*
236 238* 237* 240* 238*Oregon
233
224*
234* 237*
239 239 240*241*
240 Nation 239
170
190
210
230
250
270
290
310
Ave
rage
Sca
le S
core
(0
-50
0)
280 281 282 284 285 283 284 283
Oregon282
272*276* 278* 280* 282 283 284* 281
Nation 282
215
235
255
275
295
315
335
355
Ave
rage
Sca
le S
core
(0
-50
0)

Oregon Statewide Report Card 2017-18 49 Oregon Department of Education https://www.oregon.gov/ode Contact for this section: Beth LaDuca, 503-947-5836, [email protected]
National Assessment of Educational Progress: Science, Grade 4, 2015 NAEP reports achievement levels and average scale scores. Average scale scores for science are expressed on a 0-300 scale. NAEP has three achievement levels: Basic, Proficient and Advanced. The National Assessment Governing Board defines the NAEP achievement levels as follows: NAEP Achievement Levels:
2015 NAEP Grade 4 Science Results Achievement Levels & Participation Rates
Advanced %
Proficient %
Basic %
Below Basic %
Participating %
All Students Oregon 1 36 39 25 98
United States 1 36 39 25 98
Economically Disadvantaged Oregon # 23 43 34 ~
United States # 22 41 37* ~
English Learners Oregon # 3 31 65 92
United States # 9* 32 59 96*
Students with Disabilities Oregon # 20 31 49 87
United States # 16 34 50 91
Female Oregon 1 36 39 24 98
United States 1 35 40 25 99
Male Oregon 1 36 38 25 97
United States 1 37 37 25 98
American Indian/Alaska Native (not of Hispanic origin)
Oregon # 10 40 49 91
United States # 21 42 36 98*
Asian (not of Hispanic origin) Oregon 2 48 32 17 ~
United States 3 51 32 13 ~
Black (not of Hispanic origin) Oregon ~ ~ ~ ~ ~
United States # 14 39 47 98
Hispanic origin Oregon # 14 39 47 97
United States # 20* 41 39* 98
Native Hawaiian or other Pacific Islander (not of Hispanic origin)
Oregon ~ ~ ~ ~ ~
United States # 25 39 36 ~
Two or more races (not of Hispanic origin)
Oregon 1 42 36 22 98
United States 2 39 39 20 99
White (not of Hispanic origin) Oregon 1 44 39 16 99
United States 1 49* 38 12* 99
Legend ~ Not reported by U.S. Department of Education # Rounds to zero * Value is significantly different from OR
Basic Partial mastery of prerequisite knowledge and skills that are fundamental for proficient work at each grade
Proficient Solid academic performance for each grade assessed. Students reaching this level have demonstrated competency over challenging subject matter, including subject-matter knowledge, application of such knowledge to real world situations, and analytical skills appropriate to the subject matter
Advanced Superior performance beyond proficient

Oregon Statewide Report Card 2017-18 50 Oregon Department of Education https://www.oregon.gov/ode Contact for this section: Beth LaDuca, 503-947-5836, [email protected]
National Assessment of Educational Progress: Science, Grade 8, 2015
2015 NAEP Grade 8 Science Results Achievement Levels & Participation Rates
Advanced %
Proficient %
Basic %
Below Basic %
Participating %
All Students Oregon 1 35 36 28 98
United States 2 31* 34 33* 98
Economically Disadvantaged Oregon 1 25 37 38 ~
United States # 18* 33* 48* ~
English Learners Oregon # 2 8 90 89
United States # 3 15 82 92
Students with Disabilities Oregon # 11 24 65 87
United States # 8 21 71 90
Female Oregon 1 32 38 29 98
United States 1 29 35 35* 99
Male Oregon 2 38 34 26 97
United States 2 33* 32 32* 98
American Indian/Alaska Native (not of Hispanic origin)
Oregon ~ ~ ~ ~ ~
United States # 16 36 47 98
Asian (not of Hispanic origin) Oregon 4 46 32 18 ~
United States 4 44 32 20 ~
Black (not of Hispanic origin) Oregon # 14 27 58 95
United States # 11 29 60 98
Hispanic origin Oregon # 15 35 49 99
United States 1 17 33 49 98
Native Hawaiian or other Pacific Islander (not of Hispanic origin)
Oregon ~ ~ ~ ~ ~
United States 1 16 30 53 ~
Two or more races (not of Hispanic origin)
Oregon 3 46 29 23 99
United States 3 34 35 28 99
White (not of Hispanic origin) Oregon 2 42 37 19 98
United States 3 43 35 19 99*
Legend ~ Not reported by U.S. Department of Education # Rounds to zero * Value is significantly different from OR
Achievement level results from the 2015 NAEP grade 4 science assessment show that, in comparison with their peers in the nation as a whole, a smaller percentage of Oregon 4th grade Economically Disadvantaged students performed at the "Below Basic" level. However, larger percentages of Oregon Hispanic 4th graders and White 4th graders performed at the "Below Basic" level and smaller percentages at the "Proficient" level than Hispanic and White students in the nation as a whole. Also, a smaller percentage of Oregon English Learners performed at the "Proficient" level than their peers in the nation's public schools. Achievement level results from the 2015 NAEP grade 8 science assessment show that smaller percentages of all Oregon 8th graders as well as Economically Disadvantaged, female students, and male students performed "Below Basic" than their peers in the nation as a whole. A larger percentage of Oregon Economically Disadvantaged students performed at the "Basic" level than their peers in the nation's public schools. Larger percentages of all Oregon 8th graders as well as Economically Disadvantaged and male students reached the "Proficient" level than their peers in the nation as a whole. A larger percentage of Oregon Economically Disadvantaged students performed at the "Basic" level than their peers in the nation's public schools.

Oregon Statewide Report Card 2017-18 51 Oregon Department of Education https://www.oregon.gov/ode Contact for this section: Beth LaDuca, 503-947-5836, [email protected]
National Assessment of Educational Progress: Science Grade 4 Average Scale Scores 2009 and 2015: Oregon and the Nation In 2009, Oregon's 4th graders scored statistically higher than the nation’s 4th graders. In 2015, Oregon's 4th graders scored 153, the same as 4th graders in the nation's public schools.
* Value is significantly different from the value for the same jurisdiction in 2015.
Grade 8 Average Scale Scores 2009, 2011, and 2015: Oregon and the Nation In 2009, Oregon’s 8th graders scored statistically higher than the nation's 8th graders. In 2015, Oregon's 8th graders scored 156, which was statistically higher than 8th graders in the nation's public schools (153).
* Value is significantly different from the value for the same jurisdiction in 2015.
Oregon151
Oregon153
Nation149*
Nation153
80
100
120
140
160
180
200
220
2009 2015
Ave
rage
Sca
le S
core
(0
-30
0)
154 155
Oregon 156
149* 151* 153
80
100
120
140
160
180
200
220
2009 2011 2015
Ave
rage
Sca
le S
core
(0
-30
0)

Oregon Statewide Report Card 2017-18 52 Oregon Department of Education www.oregon.gov/ode Contact for this Section: Heidi Dupuis, 503-947-5893, [email protected]
FREE AND REDUCED PRICE LUNCH
Oregon Public Schools Number and Percent of All Students Eligible October 1, 2017 Enrollment
School Type and Level Total Number of Students
Eligible for Free and Reduced Price Lunch
Total Number of All Students 10/1/2017
Free and Reduced Price Lunch Eligible Students as a Percent of All Students
REGULAR
Elementary 139,653 261,637 53%
Middle/Jr. High 51,741 104,536 49%
High 68,602 158,910 43%
Combined2 2,887 7,018 41%
ALTERNATIVE
Elementary 352 689 51%
Middle/Jr. High -- -- --
High 1,980 2,909 68%
Combined2 418 925 45%
CHARTER
Elementary 2,850 8,203 35%
Middle/Jr. High 43 365 12%
High 925 1,575 59%
Combined2 3,157 6,666 47%
ALL SCHOOLS (Includes REGULAR, ALTERNATIVE, CHARTER, and others noted below)
Elementary 142,855 270,529 53%
Middle/Jr. High 51,784 104,901 49%
High 71,507 163,394 44%
Combined2 6,462 14,609 44%
Total 272,608 553,433 49% Source: Oregon Department of Education
1Note: Includes October 1 Membership (column B) for the schools and programs in the 2017-18 report which reported at least one student eligible for free or reduced lunch. Students attending schools that did not report free/reduced lunch data are not included in the totals. 2Combined schools serve high school grades as well as grades 7 and below.

Oregon Statewide Report Card 2017-18 53 Oregon Department of Education www.oregon.gov/ode Contact for this Section: Jamie Rumage, 503-947-6504, [email protected]
THE OREGON DIPLOMA
In June 2008, the State Board of Education adopted new graduation requirements. These requirements are designed to better prepare each student for success in college, work and citizenship. To earn a diploma, students will need to successfully complete the credit requirements, demonstrate proficiency in essential skills and meet the personalized learning requirements. Students also have the option to earn credit by demonstrating proficiency. In addition to the Oregon Diploma, districts must also offer the Modified diploma. Students are eligible for a Modified diploma only if they have demonstrated the inability to meet the full set of academic content standards for the Oregon diploma even with reasonable modifications and accommodations. The requirements for the modified diploma are also included in the table below. Credit Requirements
Subject Areas* Credit Requirements Modified Diploma
English/Language Arts 4 3
Mathematics 3 - Algebra I & above* 2
Science 3 - Scientific Inquiry & Lab Experiences* 2
Social Sciences 3 2
Physical Education 1 1
Health 1 1
Second Language
3
The Arts 1
Career &Technical Ed
Electives 6 12***
Total Credits 24** 24
*Applied and integrated courses aligned to standards can meet credit requirements. ** These are the minimum graduation requirements set by the state. Individual districts may have additional requirements. Please check with your school district to confirm local graduation requirements. ***School districts and public charter schools shall be flexible in awarding the remaining 12 credits which can include professional technical education, electives, career development, demonstrated proficiency in an area, or can include credits from other regular or modified courses. Lab experiences (2 credits) can take place outside of the school in field-based experiences.
Credit for Proficiency Students can earn credits by successfully demonstrating knowledge and skills defined by standards that meet or exceed defined levels of performance. The State Board adopted revised OAR 581-022-2025 Credit Options in July of 2017.
Essential Skills All students must demonstrate proficiency in the Essential Skills before awarded a diploma. Students master these skills by earning at or above a cut score on one of the approved assessment options in their district.
Personalized Learning These requirements personalize the diploma for each student and help prepare them for their post-high school goals. Education Plan and Profile: Students develop an Education Plan and Profile to guide their learning and document academic achievement and progress toward their personal, career and post-high school goals. Extended Application: Students apply and extend their knowledge in new and complex situations related to the student’s personal and career interests and post-high school goals through critical thinking, problem solving or inquiry in real world contexts.

Oregon Statewide Report Card 2016-17 54 Oregon Department of Education www.oregon.gov/ode Contact for this Section: Beth Blumenstein, 503-947-5767, [email protected]
9th Grade On-Track Students in their first year of high school, who have been enrolled in the same district for at least half of the school year, are considered on-track when they have accrued at least 25 percent of the credits required for high school graduation. This includes credits awarded for advanced work before beginning high school, credits earned during the 9th grade year, and credits earned during the summer after the 9th grade year. 9th Grade On-Track data is displayed at the school and district level on Oregon’s school and district report cards. In 2017-18, the 9th Grade On-Track indicator was added to the ODE’s accountability system. ODE established measures of interim progress (MIP) for the indicator and a statewide long-term goal of 95 percent. Over the last three years, the percent of students on-track to graduate increased for all student groups.
Percent 9th Grade On-Track by Student Group
*English Learners is defined as students eligible for participating in a program to acquire academic English in the current school year. **Ever English Learners is defined as students who have ever been English Learners, in the present school year or in past school years beginning in 2006-07. >95 indicates that the student group percentage is greater than 95% but the exact percentage is not displayed to protect student confidentiality.
85%76%
>95%
79% 79%84%
78%86%
0%
100%
All Students AmericanIndian/ Alaska
Native
Asian Black Hispanic Multiracial NativeHawaiian/
Pacific Islander
White
2015-16 2016-17 2017-18
85% 87%82%
70%
81%
>95%
77%71%
0%
100%
All Students Female Male EnglishLearners*
Ever EnglishLearners**
TAG EconomicallyDisadvantaged
Students withDisabilities
2015-16 2016-17 2017-18

Oregon Statewide Report Card 2017-18 55 Oregon Department of Education www.oregon.gov/ode Contact for this Section: Cristen McLean, 503-947-5842, [email protected]
Essential Skills The Essential Skills are cross-disciplinary skills necessary for success in college and career. They are embedded in the content standards and skill sets that guide Oregon education and students build these skills across their school experiences. There are nine Essential Skills; the first three are already incorporated into the graduation requirements. The State Board of Education approved four assessment options for students to demonstrate Essential Skill proficiency: (1) state test (OAKS or Smarter Balanced assessments), (2) work samples (local performance assessments scored against official state scoring guides; two required), (3) other approved standardized assessments, e.g., SAT, ACT, etc., or (4) local assessment option. Options 3 and 4 are collapsed with Unknown in the graphs due to the low number of students who use these options. The report (data) can be referenced on the next page. Find information on Essential Skills assessment options online.
Methods Used to Demonstrate Proficiency in the Essential Skills of Reading, Writing, and Math 2012-13 Five-year Cohort* Earning Regular High School Diplomas
Reading Writing Math
State Test
Work Samples
Other State Test
Work Samples
Other State Test
Work Samples
Other
All Students 84.78% 8.85% 6.38% 63.13% 28.81% 8.06% 68.87% 21.48% 9.65%
English Learner 39.75% 52.50% 7.75% 25.44% 70.74% 3.82% 32.62% 58.71% 8.67%
Ever English Learner 77.17% 18.50% 4.33% 53.42% 43.32% 3.25% 58.32% 34.76% 6.92%
Economically Disadvantaged 82.81% 12.37% 4.82% 58.49% 36.83% 4.67% 61.78% 28.74% 9.48%
Students w/ Disabilities 67.28% 26.49% 6.23% 39.12% 57.39% 3.49% 37.17% 52.15% 10.68%
American Indian/Alaska Native 84.88% 9.07% 6.05% 59.30% 37.67% 3.02% 59.53% 28.37% 12.09%
Asian 84.00% 10.42% 5.58% 70.06% 20.55% 9.39% 81.27% 12.79% 5.94%
Black 65.30% 27.14% 7.55% 39.69% 55.31% 4.99% 40.72% 50.83% 8.45%
Hispanic 80.35% 14.29% 5.36% 56.06% 40.12% 3.81% 57.91% 32.78% 9.31%
Multi-racial 85.14% 7.96% 6.90% 64.95% 26.47% 8.58% 70.89% 18.90% 10.21%
Pacific Islander 71.43% 20.48% 8.10% 57.14% 39.05% 3.81% 56.67% 36.19% 7.14%
White 86.85% 6.51% 6.64% 65.45% 25.17% 9.38% 72.22% 17.79% 9.98%
* The Five-year Cohort includes the students who earned a diploma during or before 2016-17, including four-year graduates.
Required Essential Skills: Determined by year of first enrollment in grade nine.
Remaining Essential Skills: Timeline for phasing in to be determined.
Read and comprehend a variety of texts
Write clearly and accurately
Apply mathematics in a variety of settings
Think critically and analytically
Use technology to learn, live and work
Demonstrate civic and community engagement
Demonstrate global literacy
Demonstrate personal management and teamwork skills
Listen actively and speak clearly and coherently

Oregon Statewide Report Card 2017-18 56 Oregon Department of Education www.oregon.gov/ode Contact for this Section: Cristen McLean, 503-947-5842, [email protected]
Methods Used to Demonstrate Proficiency in the Essential Skills of Reading, Writing, and Math 2013-14 Four-year Cohort* Earning Regular High School Diplomas
Reading Writing Math
State Test
Work Samples
Other State Test
Work Samples
Other State Test
Work Samples
Other
All Students 82.54% 9.10% 8.37% 65.13% 27.25% 7.62% 66.62% 21.45% 11.93%
English Learner 45.20% 46.01% 8.79% 24.86% 72.14% 3.01% 29.71% 57.92% 12.37%
Ever English Learner 75.90% 17.87% 6.24% 55.15% 41.51% 3.34% 54.40% 34.83% 10.77%
Economically Disadvantaged 80.65% 12.78% 6.57% 60.51% 35.20% 4.29% 59.38% 28.97% 11.65%
Students w/ Disabilities 63.88% 28.22% 7.90% 36.99% 59.93% 3.08% 34.33% 53.48% 12.19%
American Indian/Alaska Native 81.18% 11.29% 7.53% 57.65% 39.29% 3.06% 55.29% 33.41% 11.29%
Asian 80.53% 9.09% 10.38% 69.16% 20.27% 10.57% 76.89% 12.42% 10.69%
Black 64.40% 26.70% 8.90% 42.02% 53.27% 4.71% 39.53% 49.61% 10.86%
Hispanic 79.49% 14.35% 6.16% 58.94% 37.62% 3.45% 55.87% 32.55% 11.58%
Multi-racial 82.88% 8.05% 9.07% 68.97% 22.65% 8.37% 69.99% 19.11% 10.90%
Pacific Islander 72.48% 21.56% 5.96% 58.72% 35.78% 5.50% 54.59% 36.70% 8.72%
White 84.27% 6.91% 8.82% 67.30% 23.94% 8.76% 69.96% 17.76% 12.28%
* The Four-year Cohort includes the students who earned a diploma during or before 2016-17, including four-year graduates.

Oregon Statewide Report Card 2017-18 57 Oregon Department of Education www.oregon.gov/ode Contact for this Section: Beth Blumenstein, 503-947-5767, [email protected]
OREGON GRADUATION RATES
Summary of Cohort Graduation Rates Cohort graduation rates begin with a group of students entering high school for the first time in a given school year. The cohort is adjusted for students who move into or out of the system, emigrate or are deceased. The graduation rate is calculated by taking the number of students in the cohort who earned a regular or modified diploma within four years and dividing that by the total number of students in the cohort. Oregon schools increasingly offer the option to remain enrolled in high school for a fifth year in order to pursue college credit options through partnerships with community colleges and universities. Legislation that took effect in the 2016-17 school year placed limits on this practice. Beginning with the 2013-14 cohort graduation rates, students who had met all requirements for an Oregon (regular) or Modified Diploma were counted as graduates, even if the diploma was not awarded, in order to allow the student to remain enrolled for a fifth year. Because of this significant change, rates from 2013-14 and later are not comparable to rates prior to 2013-14. For four and five year rates by all student groups, and historical data, see the Cohort Media Files. The files also provide district and school-level data, including counts of students with other outcomes, such as GEDs or continuing enrollment. The chart below shows the increase in 4 and 5 year graduation and completer rates based on the students’ first year in high school. The rate of 76.7 in this chart shows that 76.7% of students who began their high school career in the 2013-14 school year graduated within four years (by the end of the 2016-17 school year).
Cohort Graduation Rates Over Time (All Students)
1See Expanded Options Program page for information about Oregon’s Expanded Options program, one of the programs students exercising this option may be participating in.
83.2
80.278.9
76.7
66.0
68.0
70.0
72.0
74.0
76.0
78.0
80.0
82.0
84.0
86.0
2010-11 2011-12 2012-13 2013-14
High School Entry (Cohort) Year
5-Year Completer
4-Year Completer
5-Year Graduation
4-Year Graduation

Oregon Statewide Report Card 2017-18 58 Oregon Department of Education www.oregon.gov/ode Contact for this Section: Beth Blumenstein, 503-947-5767, [email protected]
Achievement Gaps In cohort graduation rates, the gap between students of historically underserved races/ethnicities (Black/African American, Hispanic, American Indian/Alaska Native, and Native Hawaiian/Pacific Islander) and other students (White, Asian, and Multiracial) has been cut in half, from more than 18 percentage points to less than 8 percentage points.
Other gaps have remained wide (economically disadvantaged students graduate at rates about 15 points lower than the rates for students who were not economically disadvantaged in high school), or are broadening. Rates for students who are not yet proficient in English by the time they enroll in high school are almost 23 percentage points below rates for students with English proficiency, wider than the 16 percentage point gap eight years earlier.
70%79%
52%
71%
40%
80%
2005-06 2006-07 2007-08 2008-09 2009-10 2010-11 2011-12 2012-13 2013-14
High School Entry (Cohort) Year
Four-year Cohort Graduation RateUnderserved Race/Ethnicity Compared to White/Asian/Multi-Racial
72%
85%
58%
70%
50%
90%
2005-06 2006-07 2007-08 2008-09 2009-10 2010-11 2011-12 2012-13 2013-14
High School Entry (Cohort) Year
Four-year Cohort Graduation RateEconomically Disadvantaged Compared to Not Economically Disadvantaged
68%78%
51% 55%
40%
80%
2005-06 2006-07 2007-08 2008-09 2009-10 2010-11 2011-12 2012-13 2013-14
High School Entry (Cohort) Year
Four-year Cohort Graduation RateEnglish Learners Compared to English Proficient Students

Oregon Statewide Report Card 2017-18 59 Oregon Department of Education www.oregon.gov/ode Contact for this Section: Lauren Dressen, 503-947-5700, [email protected]
Oregon Career and Technical Education (CTE) Information: 2017 Graduation Results The Oregon Department of Education (ODE) collects data from Oregon schools and community colleges on the enrollment and performance of students who complete courses in state-approved Career and Technical Education (CTE) Programs of Study. CTE means content, programs, and instructional strategies based on business and industry workplace skills and technical skill sets and needs. Instruction incorporates standards-based academic content, technical skills and workplace behaviors necessary for success in careers of the 21st century. The CTE instruction reflected in Oregon’s published results happens exclusively in the context of ODE approved Programs of Study and State Recognized Programs. CTE Programs of Study are designed by secondary and postsecondary partners to be a series of complete, yet non-duplicative career focused courses. Descriptive analysis of this data reveals consistently higher graduation rates among CTE concentrators1 relative to all students statewide.2 Among students beginning secondary school in 2013-2014, CTE concentrators were 15 percentage points more likely to graduate high school in four years than students statewide.
CTE Concentrator and Statewide Four-Year Cohort Graduation Rates over Time
Not only did CTE concentrators graduate at higher rates than students in the same population statewide, they graduated above the statewide average of 76.7 percent in every racial/ethnic student population measured.
CTE and Statewide Four-Year Graduation Rates, 2013-14 High School Cohort
Outcomes as of the 2016-17 school year
1 A CTE concentrator is defined as, “[a]ny secondary student who has earned one or more credits in technical skill-based courses as part of an Oregon state-approved CTE program, of which at least one-half credit must be designated as a required course.” For more information, go to the Secondary CTE Data Collection and Reporting webpage. 2CTE graduation rates and statewide graduation are not perfectly comparable. As noted in the “CTE Report Card” “Oregon statewide cohort graduation rates include every first year student (net of students moving into/out of the state, etc.).” CTE graduation rates include students who meet the definition of a CTE concentrator (see footnote one).
87.5% 87.6% 90.7% 91.7%
72.0% 73.8% 74.8% 76.7%
40.0%
60.0%
80.0%
100.0%
2010-11 2011-12 2012-13 2013-14
High School Entry (Cohort) Year
CTE4Yr Grad
Statewide4Yr Grad
91.7%82.8%
91.7% 90.5% 91.0% 93.3% 91.5%>95%
76.7%
59.1%69.4% 67.6%
72.5% 77.4% 78.0%88.9%
0.0%
20.0%
40.0%
60.0%
80.0%
100.0%
All Students AmericanIndian/
Alaska Native
NativeHawaiian/
Pacific Islander
AfricanAmerican
Hispanic/Latino
Multi-Racial White Asian
CTE Concentrator Statewide Average

Oregon Statewide Report Card 2017-18 60 Oregon Department of Education www.oregon.gov/ode Contact for this Section: Beth Blumenstein, 503-947-5767, [email protected]
DROPOUT RATES
Dropout Rate Formula: The one-year statewide dropout rate calculation is made by dividing the number of dropouts (for grades 9-12) by the number of students reported as enrolled on the first school day in October in grades 9-12. Note that unlike the cohort graduation rates, the dropout rate includes all events within a single year, irrespective of the year a student began high school.
Oregon Statewide Dropout Rate Calculation For a given school year:
𝑵𝒖𝒎𝒃𝒆𝒓 𝒐𝒇 𝑫𝒓𝒐𝒑𝒐𝒖𝒕𝒔 𝒇𝒐𝒓 𝑮𝒓𝒂𝒅𝒆𝒔 𝟗 − 𝟏𝟐
𝑭𝒊𝒓𝒔𝒕 𝑺𝒄𝒉𝒐𝒐𝒍 𝑫𝒂𝒚 𝒊𝒏 𝑶𝒄𝒕𝒐𝒃𝒆𝒓 𝑬𝒏𝒓𝒐𝒍𝒍𝒎𝒆𝒏𝒕 𝒇𝒐𝒓 𝑮𝒓𝒂𝒅𝒆𝒔 𝟗− 𝟏𝟐
Dropout rates are also calculated for schools and districts. More information is available on the Dropout Rates in Oregon High Schools webpage.
Oregon High School Dropout Rates
4.0% 4.0%4.3%
3.9% 3.9%
0%
1%
2%
3%
4%
5%
6%
2012-13 2013-14 2014-15 2015-16 2016-17
Report Year

Oregon Statewide Report Card 2017-18 61 Oregon Department of Education www.oregon.gov/ode Contact for this Section: Beth Blumenstein, 503-947-5767, [email protected]
Oregon Dropout Rates by Gender Male students in 2016-17, as in prior years, dropped out at a higher rate than female students. Male students of every ethnicity dropped out at a higher rate than female students of the same ethnicity. American Indian/Alaska Native and Black/African American male students have the highest dropout rates, while Asian male and female students have the lowest rates. Note: Multi-Racial does not include students who reported Hispanic Ethnicity – these students are all reported under Hispanic. See the Federal Race and Ethnicity Reporting Assistance Manual for more information.
Dropout Rates by Race/Ethnicity and Gender Grades 9-12 2016-17
3.3% 3.3% 3.6% 3.4% 3.4%
4.6% 4.5% 4.9%4.5% 4.3%
0%
2%
4%
6%
2012-13 2013-14 2014-15 2015-16 2016-17
Female Dropout Rate Male Dropout Rate
3.37%
7.83%
0.74%
5.14%
3.98%
3.46%
4.80%
3.14%
4.31%
10.08%
1.66%
6.70%
5.51%
4.12%
6.60%
3.84%
0% 2% 4% 6% 8% 10%
All Students
American Indian/Alaska Native
Asian
Black/African American
Hispanic
Multiracial
Native Hawaiian/Pacific Islander
White
Female Dropout Rate Male Dropout Rate

Oregon Statewide Report Card 2017-18 62 Oregon Department of Education www.oregon.gov/ode Contact for this Section: Elyse Bean, 503-947-5831, [email protected]
REGULAR ATTENDERS
Regular Attenders (formerly Not Chronically Absent) is the measure of the percent of students who were present for more than 90 percent of their total enrolled days. Conversely, a student is considered to be chronically absent if they are absent for 10 percent or more of their total enrolled days. Note that the definition of Regular Attenders was updated in 2016-17 to align with Oregon’s chronic absenteeism plan. In prior years, students were considered a regular attender if they were present for 90 percent or more of their total enrolled days (as opposed to more than 90% starting in 2016-17). Regular Attenders data is displayed at the school and district level on Oregon’s school and district report cards. The Regular Attender measure is included in the ODE’s accountability system. In the 2017-18 school year, the ODE established measures of interim progress (MIP) for the indicator and a statewide long-term goal of 93 percent. The Regular Attenders rate only includes students in standard enrollment, whose attendance is tracked on a daily basis. Students taking college coursework, part-time online courses or some types of alternative education programs are not included.
Statewide Percent Regular Attenders By Year
Note: Due to data quality concerns, the percent regular attenders is not reported for the 2013-14 year. The placeholder represents the mean of the 2012-13 and 2014-15 reporting years.
82.3% 82.5% 82.6%
81.3%80.3%
79.5%
75.0%
85.0%
2012-13 2013-14 2014-15 2015-16 2016-17 2017-18

Oregon Statewide Report Card 2017-18 63 Oregon Department of Education www.oregon.gov/ode Contact for this Section: Elyse Bean, 503-947-5831, [email protected]
Percent Regular Attenders
By Student Group, 2017-18
Percent Regular Attenders
By Grade Level, 2017-18
Chronic absenteeism increases significantly in high school grades, particularly 12th grade.
80%
75%
73%
80%
79%
92%
75%
77%
70%
79%
69%
80%
20%
25%
27%
20%
21%
8%
25%
23%
30%
21%
31%
20%
AllStudents
EconomicallyDisadvantaged
Students withDisabilities
English Learner
Ever EnglishLearner
Asian
Black
Hispanic
American Indian/Alaska Native
Multiracial
Native Hawaiian/Pacific Islander
White
Regular Attender Chronically Absent
79% 83% 85% 86% 86% 85% 84% 81% 79% 79% 74% 69%60%
80%
21% 17% 15% 14% 14% 15% 16% 19% 21% 21% 26% 31%40%
20%
KG 1 2 3 4 5 6 7 8 9 10 11 12 Total
Regular Attender Chronically Absent

Oregon Statewide Report Card 2017-18 64 Oregon Department of Education www.oregon.gov/ode Contact for this section: Jackie McKim, 503-947-5629, [email protected]
SPECIAL PROGRAMS
Many Oregon students receive additional services through special programs to assist them in school.
Special Education The number of Oregon students receiving special education services through the federal Individuals with Disabilities Education Act (IDEA) has averaged 13.39 percent of total enrollment over the last five years.
2012-13 2013-14 2014-15 2015-16 2016-17 2017-18
Special Education 74,793 75,363 75,927 76,820 77,964 78,867
Total Enrollment 563,714 567,098 570,857 576,407 578,947 580,690
% of Total Enrollment 13.3% 13.3% 13.3% 13.3% 13.5% 13.6%
Sources: December Special Education Child Count, Fall Membership
Each special education student in Oregon has at least one of the eleven different disabilities listed for school age students in the federal Individuals with Disabilities Education Act. Over time, several disability categories have shown an increase in the number of identified students. These changing percentages reflect trends in the field and require that the Department of Education, Office of Student Services keep up with the ever-changing needs of Oregon’s children.
Number of Students with Disabilities (Ages 5-21)
Type of Disability 2012-13 Number of Students 2017-18 Number of Students Percent Change
Autism Spectrum Disorder 8,216 9,718 18.3%
Deaf/Blindness 11 14 27.3%
Emotional Disturbance 4,550 5,156 13.3%
Hearing Impairment 864 895 3.6%
Intellectual Disability* 3,883 4,140 6.6%
Other Health Impairment 11,090 14,121 27.3%
Orthopedic Impairment 755 671 -11.1%
Specific Learning Disability 26,893 25,304 -5.9%
Visual Impairment 318 293 -7.9%
Speech or Language Impairment 17,953 18,264 1.7%
Traumatic Brain Injury 260 291 11.9%
Total 74,793 78,867 5.4% Source: December Special Education Child Count *Before 2010-11, this category was labeled “Mental Retardation”

Oregon Statewide Report Card 2017-18 65 Oregon Department of Education www.oregon.gov/ode Contact for this section: Jackie McKim, 503-947-5629, [email protected]
School Age Students with Disabilities Receiving Special Education Services 2017-18 School Year Total: 78,867 Students
Placement of School Age Special Education Students by Disability – 2017-18
Regular Class
80% or Greater Regular Class
40% -79% Regular Class
< 40% Other*
Autism Spectrum Disorder 49.87% 19.03% 28.12% 2.98%
Deaf/Blindness * * * *
Emotional Disturbance 57.54% 17.82% 16.83% 7.80%
Hearing Impairment 68.49% 9.39% 8.83% 13.30%
Intellectual Disability** 16.09% 36.62% 45.05% 2.25%
Other Health Impairment 74.00% 14.75% 8.72% 2.52%
Orthopedic Impairment 35.17% 16.10% 43.52% 5.22%
Specific Learning Disability 85.15% 13.03% 1.00% 0.83%
Visual Impairment 91.01% 5.02% 2.05% 1.92%
Speech or Language Impairment 68.26% 10.24% 17.75% 3.75%
Traumatic Brain Injury 60.48% 20.27% 17.53% 1.72%
Total Special Education Population 73.95% 13.77% 9.90% 2.37% * This category includes students in corrections, home school, separate schools, parentally placed in private schools, hospital programs, homebound, public and private facilities. **Before 2010-11, this category was labeled “Mental Retardation” Percentages reflect the portion of students with the listed disability in each placement. Note: not all rows sum to total due to rounding.
Autism Spectrum Disorder12.32%
Deaf/Blindness0.02%
Emotional Disturbance
6.54%
Hearing Impairment
1.13%
Intellectual Disability
5.25%
Other Health Impairment
17.90%
Orthopedic Impairment
0.85%
Specific Learning Disability32.08%
Visual Impairment0.37%
Speech or Language Impairment
23.16%
Traumatic Brain Injury0.37%

Oregon Statewide Report Card 2017-18 66 Oregon Department of Education www.oregon.gov/ode Contact for this section: Michael Connor, 503-947-5968, [email protected]
Early Childhood - Oregon Head Start Pre-Kindergarten Program Oregon Head Start Pre-Kindergarten (OHS PreK) is a high-quality, comprehensive, early childhood program serving children ages three to five from families living at or below the federal poverty level. The program offers integrated services to support school readiness in the areas of:
Early childhood education and development
Child health and nutrition
Parent education and family support
There are 28 Oregon Head Start Prekindergarten (OHS PreK) and nine Preschool Promise programs receiving state funds. Together, these programs serve children in all 36 counties in Oregon. Programs receive funding from the Federal Office of Head Start, the Oregon Department of Education, or both. A state and federal partnership agreement allows grantees to blend funding to provide a seamless, integrated program that is tailored to meet the needs of children and families in their community.
Preschool Promise is a model for a publicly-funded, high-quality preschool system. Preschool Promise leverages high-quality, local and culturally-relevant early child care and education programs and makes them available to children living at 200 percent of the poverty level. By incorporating a mixed delivery approach which recognizes that high quality early learning experiences can take place in a wide variety of settings, Preschool Promise provides opportunities for families to access and choose the preschool setting which best meets their needs. Preschool Promise is offered through nine different Early Learning Hub regions.
OHS PreK programs serve children with the highest needs from families living at or below the federal poverty level. Children ages 3-5 living in poverty are considered eligible for Head Start. Children in foster care and children who are homeless are automatically income eligible. At least 10 percent of enrollment is reserved for children with disabilities. While federal law allows up to 10 percent of Head Start slots to be filled by children from over-income families who meet locally based need criteria, OHS PreK services are free for qualifying children
The 2017-2018 legislatively approved budget for Oregon Prekindergarten and Preschool Promise slots was $90,451,613, and this year it funded 9,556 enrollment slots for children in 28 OHS PreK programs and nine Early Learning Hubs coordinating services with 93 Preschool Promise programs. When combined with Federal and other funding sources, total OHS PreK and Preschool Promise funded enrollment for 2017-2018 was 14,696. An estimated 11,184 of the enrollment slots were filled by age eligible children living at or below the federal poverty level. The remaining slots were filled by children with other identified risk factors.
School Year
Number of Children
Eligible for Services*
Number of Eligible
Children Served
Number of Eligible
Children Not Served
Percent of Eligible
Children Served
Percent of Eligible
Children Not Served
2010-2011 17,894 11,368 6,526 63.5% 36.5%
2011-2012 19,605 12,523 7,082 63.9% 36.1%
2012-2013 25,161 12,545 12,092 50.0% 50.0%
2013-2014 24,766 12,293 12,473 49.6% 50.4%
2014-2015 22,150 12,257 9,893 55.3% 44.7%
2015-2016 20,695 12,201 8,484 59.0% 41.0%
2016-2017 19,613 12,215 7,398 62.3% 37.7%
2017-2018 17,721 11,184 6,537 63.1% 36.9% * State population and poverty rates for children ages 3-4 were provided by Kanhaiya Vaidya, Senior Demographer for the Office of Economic Analysis, based on age group numbers from the 2010 Decennial Census and poverty characteristics from the 2009 American Community Survey. 2010-2011 data were revised when the 2010 census data became available and reflect an increase in the number of young children in Oregon living in poverty due to significant economic factors in the past several years. Source: Oregon Department of Education, Early Learning Division Oregon Head Start Prekindergarten Annual Estimates of Eligible 3 and 4 Year-Olds

Oregon Statewide Report Card 2017-18 67 Oregon Department of Education www.oregon.gov/ode Contact for this section: Angela Allen, 503-947-5931, [email protected]
Talented and Gifted Talented and Gifted (TAG) children are defined by the State of Oregon as “those children who require special educational programs or services, or both, beyond those normally provided by the regular school program in order to realize their contribution to self and society and who demonstrate outstanding ability or potential” in one of the recognized areas of giftedness (ORS 343.391). Oregon statutes and administrative rules require school districts to identify TAG students and to provide TAG students with instruction that is designed to meet their assessed levels of learning and accelerated rates of learning (OAR 581-022-2500). School districts are required to identify TAG students in the categories of Intellectually Gifted, Academically Talented—Reading, Academically Talented—Mathematics and Potential to Perform at the 97th Percentile. The definition of Potential to Perform at the 97th Percentile may be determined locally by individual districts. The Oregon Department of Education defines the categories Intellectually Gifted and Academically Talented in either Reading or Mathematics. Districts also have the option to identify students in three other areas: creativity, leadership and visual and performing arts. All TAG identification is based on a body of evidence and multiple data points.
Oregon Talented and Gifted Students 2017-18 Statewide
Total: 37,462 Students*
State-defined:
Intellectually Gifted: 16,589
Academically Talented: o Reading: 15,571 o Math: 16,213
District-defined:
Potential to Perform at the 97th Percentile: 5,185
District Option to Identify**:
Creativity: 50
Leadership: 48
Visual and Performing Arts: 22
*It is possible for individual students to have multiple areas of TAG identification. **Districts may choose to identify students in these TAG categories. It is permissible for a student to be identified in one of these three optional categories who was not in one of the four required TAG identifications. Source: Spring Student Membership TAG data. ***Students may be TAG-identified while also being identified for Special Education, or “Dual-Identified” Source: All student data based on Spring Student Membership Note: Multi-Racial does not include students who reported Hispanic Ethnicity – these students are all reported under Hispanic. See the Federal Race and Ethnicity Reporting Assistance Manual for more information.
Complete TAG Oregon Revised Statute and Oregon Administrative Rule information is available from the Oregon Department of Education website.
School Year TAG Graduates All Graduates 2013-14 (10-11 cohort) 4,022 (92.4%) 32,877 (72.0%)
2014-15 (11-12 cohort) 3,890 (93.2%) 33,347 (73.8%)
2015-16 (12-13 cohort) 3,900 (92.7%) 34,678 (74.8%)
2016-17 (13-14 cohort) 3,772 (94.2%) 35,380 (76.6%) Source: Cohort Graduation Rates.
Student Group Number of
TAG Students
Percent of TAG
Students
Number of All Students
Percent of All Students
Percent of Student Group
Identified as TAG
Total 38,173 100.00% 573,542 100.00% 6.66%
Gender
Male 20,325 53.24% 294,919 51.42% 6.89%
Female 17,848 46.76% 278,623 48.58% 6.41%
Race/Ethnicity
White 26,442 69.27% 356,897 62.23% 7.41%
Hispanic 4,014 10.52% 132,704 23.14% 3.02%
Native American 159 0.42% 7,485 1.31% 2.12%
Asian 4,209 11.03% 23,237 4.05% 18.11%
African American 368 0.96% 13,349 2.33% 2.76%
Pacific Islander 112 0.29% 4,226 0.74% 2.65%
Multi-Ethnic 2,869 7.52% 35,644 6.21% 8.05%
Other
Economically Disadvantaged 10,152 26.59% 310,676 54.17% 3.27%
Not Economically Disadvantaged 28,021 73.41% 262,866 45.83% 10.66%
Special Education** 1,419 3.72% 84,132 14.67% 1.69%
Not Special Education 36,754 96.28% 489,410 85.33% 7.51%

Oregon Statewide Report Card 2017-18 68 Oregon Department of Education www.oregon.gov/ode
Contact for this section: Jeremy A. Wartz, 503-947-5736, [email protected]
Alternative Education Programs An “alternative education program” means a school or separate class group designed to best serve students' educational needs and interests and assist students in achieving the academic standards of the school district and the state (ORS 336.615). School districts provide alternative education programs for students who need
additional academic supports because they do not meet state academic standards
additional academic supports because they are exceeding academic standards
additional behavioral supports
Alternative education programs are also provided for students who
are pregnant or are parenting
have been expelled from school
have dropped out of school, or are at risk of dropping out
need additional supports to earn a diploma
In general, Oregon student enrollment in alternative education remained at similar levels as compared with past years, while there continued to be a decline in the number of programs and services. Districts report that on average they serve an estimated 13,300 students in alternative education statewide.
Alternative Education Services in Oregon By Type of Program Service -- Number of Students
2016 2017 2018
Type of Operation Number of Students
Percentage of Students
Number of Students
Percentage of Students
Number of Students
Percentage of Students
Resident School District 13,855 84.80% 11,255 81.51% 11,126 83.71%
Another School District 29 0.18% 67 0.49% 92 0.69%
Private Program 1,279 7.83% 1,443 10.45% 1,077 8.10%
Community College 819 5.01% 847 6.13% 843 6.34%
Educational Service District (ESD) 101 0.62% 63 0.46% 56 0.42%
Other Program 256 1.57% 133 0.96% 97 0.73%
Terminated Program 0 0.00% 0 0.00% 0 0.00%
Total 16,339 100.00% 13,808 100.00% 13,808 100.00% Source: ODE Alternative Education Data Collection
District alternative schools and programs, such as small learning communities (programs within schools), charter and magnet schools and programs of choice are utilized to meet individualized student learning and socio-emotional needs. School report cards report summative data for students enrolled at these schools and districts. Some districts may offer a variety of guidance and career counseling services, tutoring, small-group instruction, online/blended learning, career related learning and proficiency credit options to support improved student achievement according to their education plan. Alternative education is included in school district improvement planning and goal setting as we continue to support schools in need. Private or charter alternative schools are annually evaluated by their contracting districts to assure they are comprehensive, aligned with content standards and essential skills and offering the courses required for high school graduation. An annual evaluation and site visit is required to result in Division 22 assurances that support school boards in their annual approval of programs. A growing number of annual program evaluations are making use of a more formative evaluation method that seeks to support "quality" academic and scheduling programing. These evaluations are required to include the review of an annual statement of expenditures to ensure that the program enhances the ability of the district and its students to achieve district and state standards (ORS 336.655).

Oregon Statewide Report Card 2017-18 69 Oregon Department of Education www.oregon.gov/ode Contact for this section: Jeremy A. Wartz, 503-947-5736, [email protected]
Alternative Education Services in Oregon
by Type of Program Service -- Number of Programs
2016 2017 2018
Type of Operation Number of Programs
Percent of Programs
Number of Programs
Percent of Programs
Number of Programs
Percent of Programs
Resident School District
138 49.64% 120 52.63% 121 57.89%
Another School District 11 3.96% 6 2.63% 5 2.39%
Private Program 60 21.58% 46 20.18% 31 14.83%
Community College 39 14.03% 32 14.04% 29 13.88%
Educational Service District (ESD)
14 5.04% 10 4.39% 9 4.31%
Other Program 4 1.44% 3 1.32%% 3 1.44%
Terminated Program 12 4.32% 11 4.82% 11 5.26%
Total 278 228 209
Source: ODE Alternative Education Data Collection
The majority of alternative education in Oregon is estimated to occur in schools and programs operated by the student’s resident school district (58%), but a consistent percentage of alternative program services have been offered by community colleges (14%), whereas there has been a consistent decline in alternative program services offered by private organizations (15%). The remaining programs are operated by the Education Service District (ESD) or in another district, school or program.
Districts with Reported Alternative Education Programs, 2014-2018
7367
61 5750
73
130136 140
147
20
14
20
15
20
16
20
17
20
18
Count of Districts Reporting Alt Ed. Programs
Count of Districts Without Alt Ed. Programs

Oregon Statewide Report Card 2017-18 70 Oregon Department of Education www.oregon.gov/ode Contact for this section: Jeremy A. Wartz, 503-947-5736, [email protected]
Type of Program Services Statewide Alternative education programs must continue to be designed and evaluated for quality as well as compliance to assure they address the diverse student needs the social behaviors they are designed to address. Alternative programs need to address the development of knowledge/skills with a level of rigor that will enable youth to be successful in post-secondary education and careers. The National Alternative Education Association (NAEA) describes youth attending alternative education programs as students who were found to have not been succeeding in the traditional education setting. Traditional school staff are left to respond to the needs of an increased number of students that might benefit from alternative programs and attempt to do so through personalized learning experiences in accordance with a student’s education plan and profile. A number of school districts have responded by offering differing types of online/blended learning and intervention programs on site at traditional schools (schools within schools) which accounts for the decrease in the number of programs. Alternative schools offer innovative and non-traditional approaches to teaching and learning which helps to prevent these students from becoming dropouts and assists the state and district in serving all students.
Alternative Education Services in Oregon By Type of Program Service -- Number of Services
Types of Program Services Statewide
Number of Services
Provided 2014
Number of Services Provided
2015
Number of Services Provided
2016
Number of Services Provided
2017
Number of Services Provided
2018
Students with at-risk Behaviors 217 196 177 140 124
Remediation, Credit Recovery, or GED 207 204 172 138 124
Pregnant or Parenting Students 80 70 58 51 50
Students Advanced Beyond Standards 54 48 54 50 44
Other Programs 41 39 34 34 25
Total 599 557 495 413 367
Source: ODE Alternative Education Data Collection
Alternative Education Services in Oregon By Grade Range – Number of Students
Number of Students
Using Services 2014
Number of Students
Using Services
2015
Number of Students
Using Services
2016
Number of Students
Using Services
2017
Number of Students
Using Services
2018
Secondary 13455 13714 14056 11,392 11,037
Elementary 1463 2126 2283 2,416 2,254
Total 14918 15840 16339 13,808 13,291
Source: ODE Alternative Education Data Collection
Links to Reference Documents Oregon Alternative Education

Oregon Statewide Report Card 2017-18 71 Oregon Department of Education www.oregon.gov/ode
RESOURCES
Visit the webpages below for additional information on key education topics.
School and District Accountability
Elementary and Secondary Education Act http://www.oregon.gov/ode/schools-and-districts/grants/ESEA/Pages/default.aspx
Unsafe School Choice Option (USCO) and Persistently Dangerous Schools http://www.oregon.gov/ode/students-and-family/healthsafety/Pages/Safe-and-Drug-Free-Schools.aspx
Oregon School & District Report Cards http://www.oregon.gov/ode/schools-and-districts/reportcards/reportcards/Pages/default.aspx
Quality Education Model http://www.oregon.gov/ode/reports-and-data/taskcomm/Pages/QEMReports.aspx
Accountability Reports http://www.oregon.gov/ode/reports-and-data/dataresources/Pages/Quick-Links-to-Accountability-Information.aspx
Report Cards http://www.oregon.gov/ode/schools-and-districts/reportcards/Pages/default.aspx
School Funding and Finance
State School Fund http://www.oregon.gov/ode/schools-and-districts/grants/Pages/School-District-and-ESD-payment-Statements.aspx
Special Education Funding http://www.oregon.gov/ode/schools-and-districts/Pages/Special-Education-Funding.aspx
Student Information
Fall Membership Report http://www.oregon.gov/ode/reports-and-data/students/Pages/Student-Enrollment-Reports.aspx
English Learners http://www.oregon.gov/ode/schools-and-districts/grants/ESEA/EL/Pages/default.aspx
School Nutrition/Free and Reduced Price Lunch http://www.oregon.gov/ode/students-and-family/childnutrition/Pages/default.aspx

Oregon Statewide Report Card 2017-18 72 Oregon Department of Education www.oregon.gov/ode
Teacher Information
Teacher Licensure http://www.oregon.gov/ode/educator-resources/Pages/default.aspx
Highly Qualified Teachers http://www.oregon.gov/ode/schools-and-districts/grants/ESEA/IIA/Pages/default.aspx
Resources for Teachers http://www.oregon.gov/ode/educator-resources/Pages/default.aspx
Special Programs and Information
Alternative Education http://www.oregon.gov/ode/learning-options/schooltypes/AltEd/Pages/default.aspx
Charter Schools http://www.oregon.gov/ode/learning-options/schooltypes/charter/Pages/default.aspx
Early Childhood http://www.oregon.gov/ode/students-and-family/SpecialEducation/earlyintervention/Pages/default.aspx
Homeless Students http://www.oregon.gov/ode/schools-and-districts/grants/ESEA/McKinney-Vento/Pages/default.aspx
Special Education Programs http://www.oregon.gov/ode/rules-and-policies/Pages/Individuals-with-Disabilities-Education-Act.aspx
Talented and Gifted http://www.oregon.gov/ode/learning-options/TAG/Pages/default.aspx
Title I Title I-A: Improving Basic Programs http://www.oregon.gov/ode/schools-and-districts/grants/ESEA/IA/Pages/default.aspx
Title I-C: Migrant Education http://www.oregon.gov/ode/schools-and-districts/grants/ESEA/Migrant/Pages/default.aspx
Title I-D: Neglected and Delinquent or At-Risk Children http://www.oregon.gov/ode/schools-and-districts/grants/ESEA/ID/Pages/default.aspx

Oregon Statewide Report Card 2017-18 73 Oregon Department of Education www.oregon.gov/ode
Student Achievement
Oregon Statewide Assessment http://www.oregon.gov/ode/educator-resources/assessment/Pages/default.aspx
Statewide Test Results https://www.oregon.gov/ode/educator-resources/assessment/Pages/Assessment-Group-Reports.aspx
National Assessment of Education Progress (NAEP) http://www.oregon.gov/ode/educator-resources/assessment/NAEP/Pages/default.aspx http://nces.ed.gov/nationsreportcard
Cohort Graduation Rate http://www.oregon.gov/ode/reports-and-data/students/Pages/Cohort-Graduation-Rate.aspx
Dropout Reports http://www.oregon.gov/ode/reports-and-data/students/Pages/Dropout-Rates.aspx
Essential Skills http://www.oregon.gov/ode/educator-resources/essentialskills/Pages/default.aspx
Data Collections https://district.ode.state.or.us/apps/info/