education report card 2016 - amazon s3 · education report. card 2016. 25th edition. ... statewide...
TRANSCRIPT

Submitted by the Chamber Education Report Card CommitteeCo-Chairs Harry Allen and Katherine McElroy Metropolitan Nashville Public Schools | 2015 - 2016 School Year
N A S H V I L L E
T E N N E S S E E
EDUCATION REPORT
CARD 2016
25TH EDITION
Pivotal Partners
Presenting Sponsor
Education Advocate
Supporting Sponsors Technology Partner
2
4
6
8
10
12
13
18
24
29
31
35
37
42
44
46
47
49
51
Table of Contents
Committee Roster
Executive Summary
Recommendations
Committee Commendations
Committee Concerns
Metro Nashville Public Schools Landscape
School System Performance
Literacy
Appendix A: Status of 2015 Education Report Card Recommendations
Appendix B: MNPS Demographic, Enrollment and Suspension Data
Appendix C: MNPS Funding
Appendix D: MNPS ACT and Graduation Data
Appendix E: MNPS Teacher Effectiveness and Attrition
Appendix F: MNPS Literacy Supports
Appendix G: MNPS Community Achieves
Appendix H: Experts Interviewed
Appendix I: Glossary
Acknowledgements
Data in this report was sourced from the following: MNPS/ACT District Report, MNPS; Tennessee Department of Education; U.S. Census Bureau
3

2016 Committee Roster
Co-Chair Harry AllenSenior vice president, Pinnacle Financial PartnersHume-Fogg alumnus MNPS parent (second year)
Co-Chair Katherine McElroy Partner, c3/consulting(third year)
Greg Bailey Principal, Bailey & Company Public RelationsHillwood High School alumnus(second year)
Dane Danielson Director of education, Gould Turner Group, P.C. (first year)
Laura Delgado Director, Pionero Scholars program, Lipscomb University (third year)
Rashed Fakhruddin Engineering supervisor, Nashville Electric ServiceHillsboro High School alumnusMNPS parent (second year)
Mel Fowler-Green Executive director, Metro Human Relations Commission (first year)
AE GrahamCommunications director, Tennesseans for Student Success(first year) Meg Harris Human resources business partner, UBSMNPS parent (second year)
James Hartman Retired MNPS teacherCorinne L. Cohn High School alumnus(third year)
Colleen HoyDirector, We Build Tech, Nashville Technology Council (first year)
Jennifer Johnston Executive director, Vanderbilt Center for Nashville Studies(third year)
Tara Lentz Senior director of programs, Conexión Américas (second year)
The Honorable Freddie O’ConnellSoftware developer, Rustici SoftwareDistrict 19, Metropolitan Nashville CouncilMNPS parent (third year)
Tom ParrishChief operating officer, Scarlett Family FoundationHillwood High School alumnus(second year)
Anita H. RyanSenior account executive, HST Interior ElementsMNPS parent (third year)
Becky SharpeCEO, International Scholarship and Tuition Services, Inc.Overton High School alumna MNPS parent(third year)
Melissa Spradlin Executive director, Book’em (first year)
4
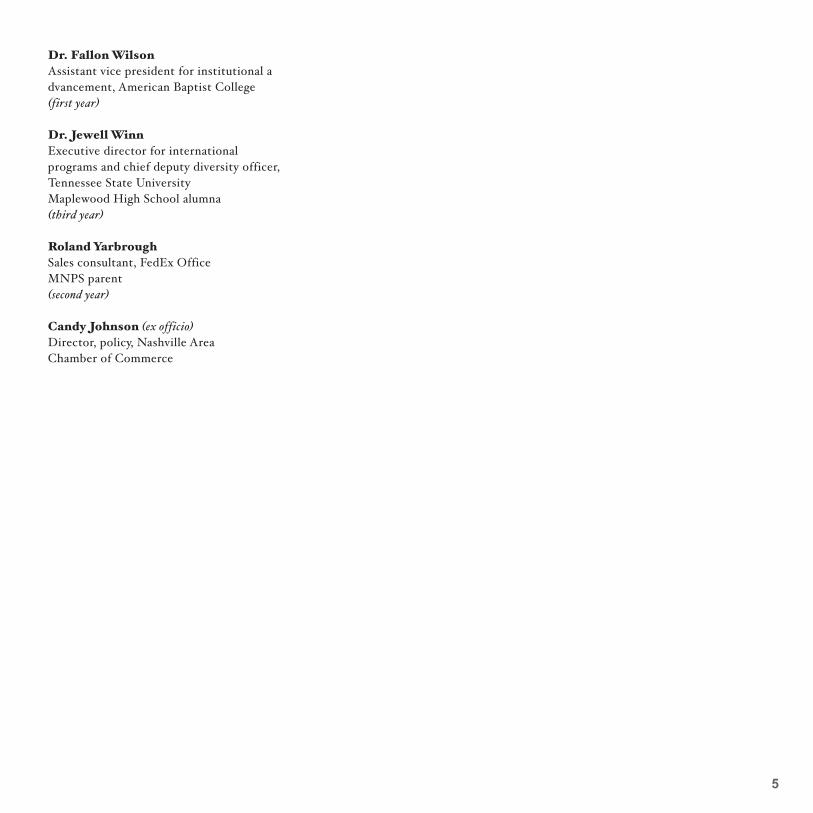
Dr. Fallon Wilson Assistant vice president for institutional advancement, American Baptist College(first year)
Dr. Jewell Winn Executive director for international programs and chief deputy diversity officer, Tennessee State UniversityMaplewood High School alumna(third year)
Roland YarbroughSales consultant, FedEx OfficeMNPS parent(second year) Candy Johnson (ex officio)Director, policy, Nashville Area Chamber of Commerce
55
Executive Summary
Since 1992, the Nashville Area Chamber of Commerce has organized a diverse and committed group of Nashvillians to evaluate the progress of Metropolitan Nashville Public Schools (MNPS) during the most recently completed school year. In assessing the 2015-2016 academic year, the 22-member Education Report Card Committee has spent the last six months interviewing Metro Schools’ staff and administration, Tennessee Department of Education (TDOE) officials, state and local elected leaders, nonprofit organizations, and experts from higher education and parents. The committee visited four schools as an opportunity to talk to students and teachers, as well as observe instructional practices.
It has been a challenging and frustrating year for anyone trying to measure the progress of K-12 education in Tennessee. Missing test data for elementary and middle schools across the state and new high school end-of-course tests make comparisons with results from previous years impossible. In the spring of 2016, the TDOE abandoned its annual assessment program for grades 3-8 after repeated failures of the online testing platform. In high school, the state administered new tests based on the revised state standards, setting a much higher bar in defining student mastery of each subject. As a result, there were dramatic declines statewide in student proficiency in high school math and English, reflecting more accurately our students’ annual results on the ACT.
This prevented our committee from analyzing the results of schools through the district’s Academic Performance Framework (APF) this year. The framework relies on student achievement and value-added growth data, as well as other measures, including parent and student climate survey and teacher and principal satisfaction information, to rate the performance of individual MNPS schools. Each year, this committee evaluates the overall district improvement based on an increase in APF-designated “excelling” or “achieving” school seats and a decrease in “target” school seats. TDOE is currently redesigning its annual state report card for 2018 with a statutory mandate to assign A through F letter grades to all public schools in a way that closely resembles the district’s APF approach. With this impending
implementation, Metro Schools should revisit the use of its APF in order to reduce the duplication of measurements in the future.
The only comparable measures available for 2016 – high school graduation rates and ACT performance – show a slight decline. The graduation rate, which measures the percentage of all students who graduate from high school within four years, plus a summer period, fell from 81.6 percent in 2015 to 81 percent in 2016. The number of MNPS students taking the ACT increased by 586 students in 2016, while the percentage of those scoring at least a 21 dropped from 30 percent in 2015 to 28 percent in 2016. Based on these limited results, we must conclude that MNPS did not record overall improvement during 2015-2016 – for the second year in a row. With a new director of schools and executive team in place for the 2016-2017 school year, there is an expectation in the community for MNPS to resume a faster pace of improvement.
The recent congressional reauthorization of the federal K-12 education law in the form of the Every Student Succeeds Act provides Tennessee with a unique opportunity to redesign its accountability system for districts and schools. As the result of new flexibility in the federal law, states are allowed to incorporate new measures into their systems, in addition to the traditional measures of reading and math proficiency and graduation rates. While there appears to be growing consensus among educators and community stakeholders around the ultimate goal of preparing all students for college and career, career-readiness measures have not historically been included in Tennessee’s accountability system. As TDOE develops its new accountability system for federal approval in March 2017, we recommend that districts and high schools be rewarded for graduating students who earn early postsecondary credit and valued industry certifications.
The committee chose literacy and language arts as our special focus topic for this year’s report. In the absence of 2016 reading assessment results for elementary and middle school students,
6

we continue to be concerned that 64 percent of fourth-grade students left elementary schools reading below grade level in 2015. Research indicates that proficient readers are able to do two things well. First, a reader decodes text by piecing together letters and sounds to form complete words. Second, a proficient reader comprehends the meaning of a series of words through a strong vocabulary and world knowledge that produces a mental image from those words, as well as command of advanced grammar.
The Metro school board approved an increase of $4 million for literacy initiatives as part of the 2016-2017 operating budget. This funded, in part, an additional 32 Reading Recovery teachers for one-on-one literacy instruction with struggling first-grade students, as well as an expansion of the literacy professional development partnership with Lipscomb University to all Metro elementary schools. As the district’s new administration develops its districtwide literacy plan and expands resources, they must measure each school’s implementation of these literacy initiatives to ensure fidelity. In addition, as more professional development is provided around literacy, it is imperative that Metro Schools’ reading coaches and early-grade teachers have demonstrated expertise in literacy instruction.
While Metro Schools is ultimately responsible for ensuring every one of its students reaches reading proficiency, there is clearly a role for community organizations to support this effort. Currently, dozens of nonprofits and community groups are supporting literacy. These efforts are longstanding and vital, and yet the level of reading proficiency continues to be low as students advance across grade levels. Metro Schools and its community partners must develop a citywide literacy plan by May 2017, so that implementation can begin with urgency before the 2017-2018 school year.
Over the course of researching this 25th edition of the Education Report Card, the committee has revisited a number of past recommendations that remain relevant to our challenges in 2016. In the 1990s, this committee began with a goal of 100 percent student success, portending the recent discussion around educational equity – the belief that all students should
reach their academic potential and at least a certain level of attainment, regardless of their circumstances or background. While we are still a long way from reaching this goal for all students, we believe the district’s move to school-based budgeting, with higher-need students bringing more financial resources, is an important tool to advance student equity and school leader accountability. Ensuring there is a great teacher in every classroom and an outstanding principal in every school, and that those professionals are supported strategically by the district, families and the broader community, is the opportunity before Metro Schools and its new leadership.
7

2016 Recommendations
To their great credit, each year Metro Nashville Public Schools’ administration and the school board carefully consider the Report Card’s findings and recommendations. MNPS’ responses to last year’s Report Card recommendations can be found in Appendix A.
In looking back at the 2015-2016 school year, the Report Card committee encourages MNPS, the State of Tennessee and the broader community to provide thoughtful consideration to these recommendations, as we look to see real progress over the next year.
1. Metro Schools should expand its commitment to school-based budgeting to ensure equitable access to resources across all schools. page 21
2. The State of Tennessee should incorporate measures of both career and college readiness into the new school and district accountability system. page 23
3. Metro Schools should ensure that its early-grade teachers have demonstrated expertise in literacy instruction. page 26
4. Metro Schools should measure each school’s implementation of the district’s literacy initiatives to ensure fidelity. page 26
5. Metro Schools should engage community partners in developing a citywide plan and timeline to ensure early-grade (K-2) literacy by May 2017. page 28
8

9

Committee Commendations
• A new opportunity for effective governanceThe successful second attempt to hire a new director of schools in June 2016 saw the school board partner effectively with Mayor Megan Barry, the Nashville Public Education Foundation and community leaders. The unanimous vote to hire Dr. Shawn Joseph has since led to a series of productive board retreats with the new director of schools and his executive team that we hope will continue through the coming year. The ability of the board to unify and move forward in concert with the director once difficult votes are taken will be crucial in rallying community and external support for the district’s new strategic plan.
• Increased resources for schoolsMayor Megan Barry and the new Metropolitan Council elected in 2015 are to be commended for increasing education funding in their first operating budget. The 2016-2017 city budget includes an $843 million operating budget for MNPS, representing a 4 percent, or $33 million, increase over the previous year. In addition, Gov. Haslam and the Tennessee General Assembly increased state funding for K-12 education, including adding new funding to support English Language Learner (ELL) instruction. The funding ratio for ELL teachers in the state funding formula was reduced from 1 teacher for every 30 ELL students to 1:25. While this progress is important, the state has still not met the statutory funding goal of 1:20 for ELL instruction, also one of the recommendations made in the 2009 Education Report Card.
• Wraparound services to support student successWith three out of four MNPS students living in poverty, families often have challenges that get in the way of student learning. The district’s Community Achieves initiative identifies, recruits and coordinates organizations in the community to support the needs of students and their families at the school level (see appendix G). These support services, often provided by area nonprofits, can include food and clothing assistance, crisis counseling, and case management. As MNPS considers the worthy expansion of Community Achieves to other schools, there is also an opportunity to create greater alignment with similar efforts in other MNPS schools, such as Communities In Schools of Tennessee and the United Way-supported Family Resource Centers. MNPS should also consider expanding summer opportunties and extended learning for students.
10

11
Committee Concerns
• Underperforming, under-enrolled schoolsAdditional resources will likely be required to ensure that all students leave elementary school proficient in reading and to meet the needs of our growing population of English Learners. It is imperative, then, that the district maximize its existing resources by regularly evaluating the utilization of its school facilities. The 2013 Education Report Card recommended the district take decisive action toward discontinuing its lowest-performing, under-enrolled schools, and MNPS appropriately converted two such schools to pre-K centers the following year. With finite resources available to the district, it is imperative that the school board and administration evaluate these potential operational efficiencies on a more regular basis.
• Need for increased rigor in K-8While MNPS continues to garner national attention for its academy model in its 12 zoned high schools, with more than 950 people from around the country attending the academy study visits during 2015-2016 school year, the district is not on pace to meet its ACT goal of at least 50 percent of students making a 21 or higher. While the percentage of 11th-grade students making at least a 21 or above dropped slightly to 28 percent, ACT predictor data provided by the state of Tennessee suggests that our elementary and middle schools do not prepare students to meet this goal. Using each student’s entire testing history, 18 percent of fourth-grade students and 22 percent of eighth-grade students in MNPS were on track to make at least a 21 on the ACT in high school. There is a clear opportunity for increased rigor at the K-8 level, with an immediate opportunity to better connect the middle school experience to high school academy and magnet programs.
• Nashville misses opportunity to benchmark against peersThe challenge of each state having its own academic standards and assessments is that it is not possible to compare student results across the 50 states. The only opportunity for such a comparison is through the National Assessment of Educational Progress (NAEP), sometimes called the “nation’s report card.” NAEP is given to a national sample of students in fourth, eighth and 12th grade reading and math in odd number years. While this data is reported for each state, it was not until NAEP initiated the Trial Urban District Assessment (TUDA) in 2002 at the behest of the Council of Great City Schools that large individual school districts could compare their students’ NAEP results with their peers. Congress has expanded funding for TUDA, so that 27 school districts in 2017 will participate, including many of the cities Nashville competes with economically, such as Austin, Charlotte, Louisville, Atlanta and Memphis. Participating in TUDA was a recommendation of the 2008 Education Report Card, and despite the endorsement of the director of schools and mayor at that year’s report presentation, this was never implemented. In our research this year, we learned that Nashville was invited last year to participate in the NAEP TUDA for the coming cycle at no financial cost to the district, but declined to join. Should funding be available to expand TUDA in 2017, we hope that MNPS will choose to join the growing list of large cities that find value in this benchmarking.
• Diversifying our teaching force starts at homeDiversifying the teaching force to better reflect the changing student demographics in our public schools is a state and national challenge. A March 2016 report produced by the Metro Human Relations Commission noted that 23.5 percent of MNPS teachers were African American, compared to 42.2 percent of students. Even more dramatically, Hispanic teachers accounted for less than 2 percent of teachers, but 21.5 percent of students. And teaching continues to be a female-dominated profession, with males accounting for only 21.7 percent of MNPS teachers. Tennessee’s teacher preparation programs have a long way to go in addressing these disparities. An October 2016 report released by the Statewide Collaborative on Reforming Education (SCORE) on early-career teaching referenced that African Americans, Hispanics, and Asians together comprised only 11 percent of those completing teacher preparation programs in Tennessee in 2014. MNPS teaching academy programs at Antioch and Whites Creek High Schools represent an unrealized opportunity for the district to grow its own diverse teaching force. Ideas for growing and expanding the impact of these programs could include paid fellowships with MNPS during undergraduate study, financial incentives for teaching in MNPS after graduation and citywide marketing of these academy programs to attract interested students from other school zones.
12
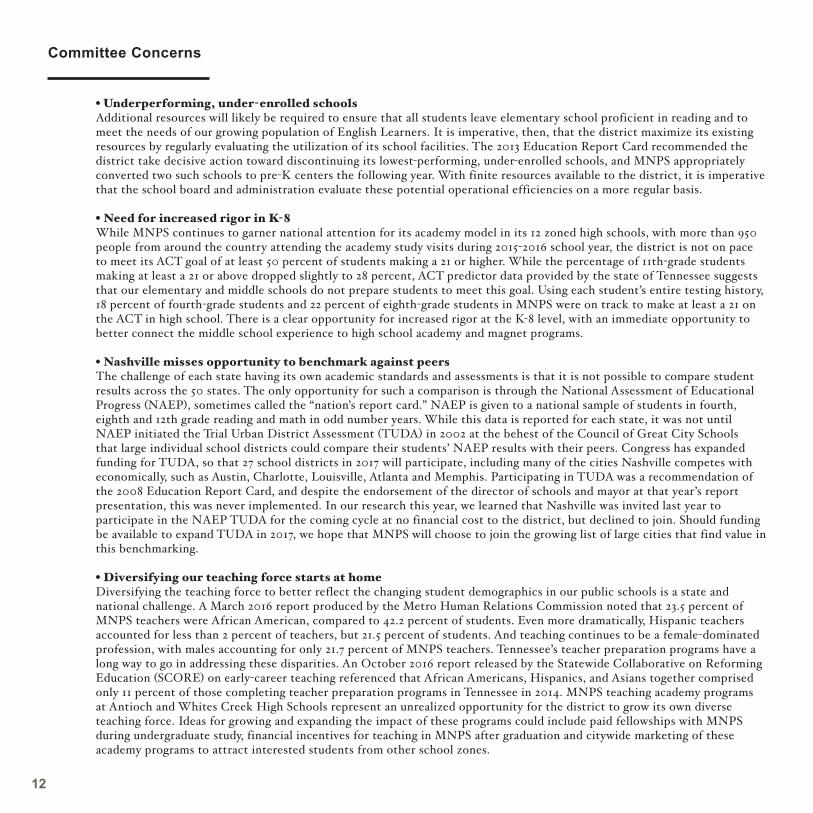
Zoned Schools (70)
Charter Schools (8)
Magnet Schools (3)
Zoned Schools (27)
Charter Schools (14)
Magnet Schools (5)
Other (1)
Zoned Schools (12)
Charter Schools (5)
Magnet Schools (6)
Other (8)
Zoned
Academic Magnet
Choice/Magnet
Other
Charter
Special Ed
Elementary Schools Middle Preps High Schools
Special EdOther
Charter
Academic Magnet
Choice/Magnet
Zoned
Special Education Schools
The MNPS landscape is complex. According to information provided by the district, there are 81 elementary schools, 47 middle schools and 31 high schools. The district’s designation for schools include zoned, choice, magnet, charter, academic magnet and other.
Metro Nashville Public Schools Landscape
13
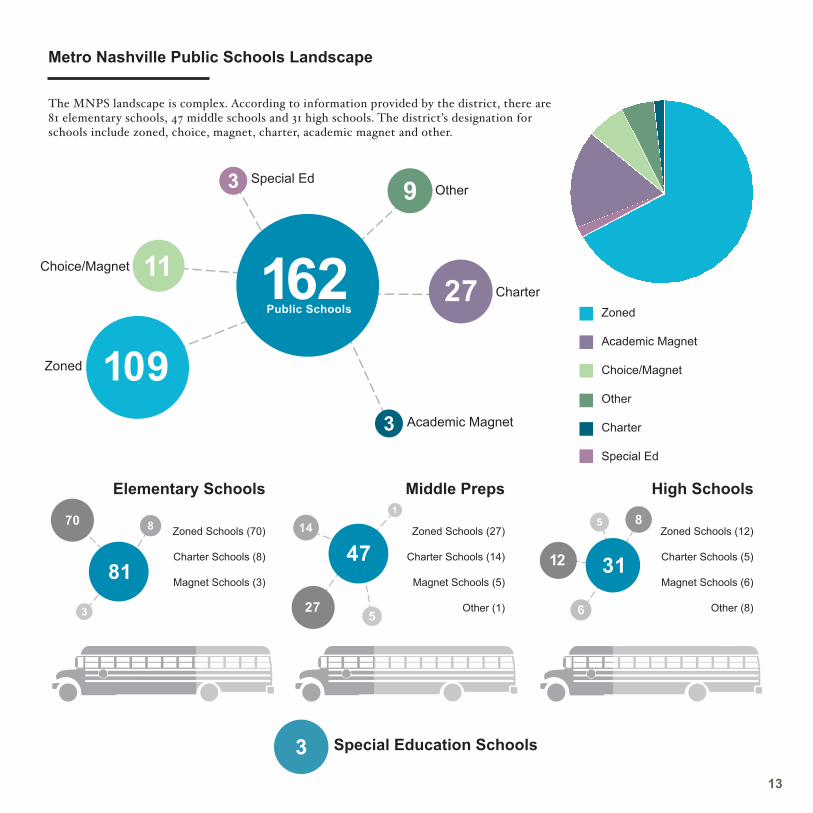
MNPS Demographic Subgroup Data
*Four students may have more than one active enrollment.
Data provided by MNPS reflects enrollment on October 31, 2016.
Asian (3,779)
African American (38,052)
Hispanic or Latino (20,414)
American Indian or Alaska Native (136)
Native Hawaiian/Pacific Islander (105)
Caucasian (26,337)
88,827 Students Total*
Asian 3,779
Caucasian 26,337
American Indian or Alaska Native136
African American38,052
Hispanic or Latino38,052
Hawaiian/Pacific Islander105
14
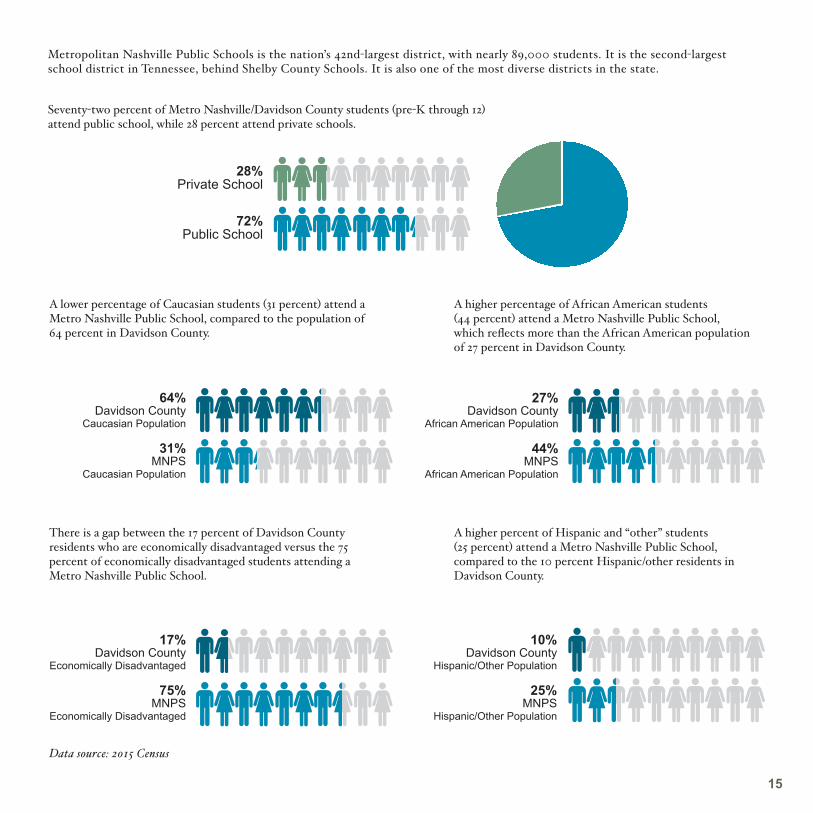
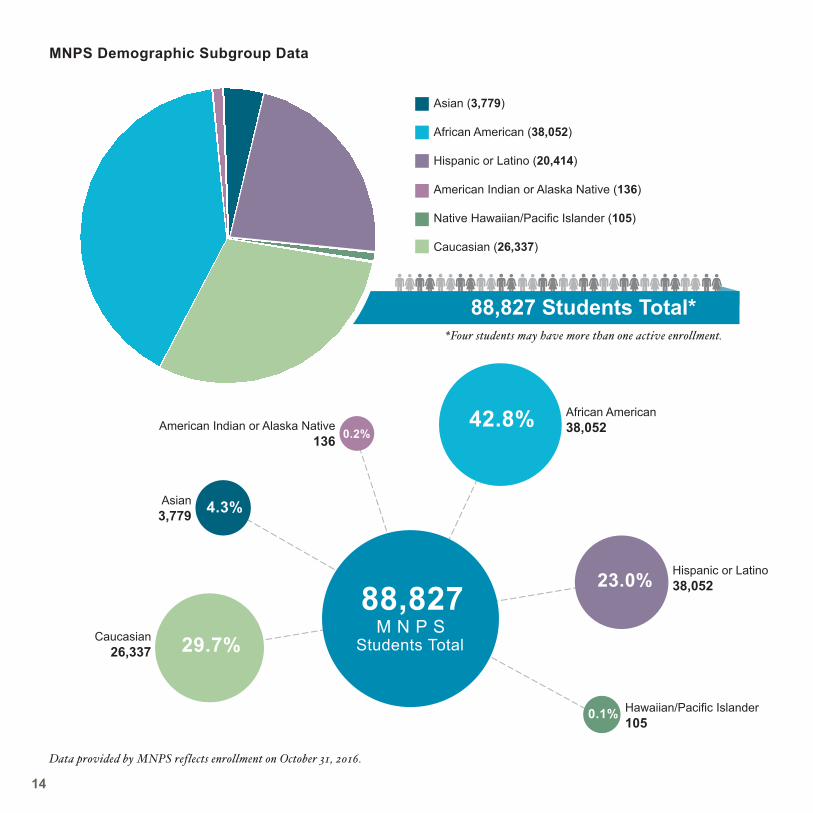
Metropolitan Nashville Public Schools is the nation’s 42nd-largest district, with nearly 89,000 students. It is the second-largest school district in Tennessee, behind Shelby County Schools. It is also one of the most diverse districts in the state.
Seventy-two percent of Metro Nashville/Davidson County students (pre-K through 12) attend public school, while 28 percent attend private schools.
A lower percentage of Caucasian students (31 percent) attend a Metro Nashville Public School, compared to the population of 64 percent in Davidson County.
A higher percentage of African American students (44 percent) attend a Metro Nashville Public School, which reflects more than the African American population of 27 percent in Davidson County.
There is a gap between the 17 percent of Davidson County residents who are economically disadvantaged versus the 75 percent of economically disadvantaged students attending a Metro Nashville Public School.
A higher percent of Hispanic and “other” students (25 percent) attend a Metro Nashville Public School, compared to the 10 percent Hispanic/other residents in Davidson County.
28%Private School
72%Public School
64%Davidson County
Caucasian Population
31%MNPS
Caucasian Population
27%Davidson County
African American Population
44%MNPS
African American Population
17%Davidson County
Economically Disadvantaged
75%MNPS
Economically Disadvantaged
10%Davidson County
Hispanic/Other Population
25%MNPS
Hispanic/Other Population
15
Data source: 2015 Census
Director of SchoolsShawn Joseph
Metropolitan Board of
Education
Chief Operating Officer Chris Henson
Chief of SchoolsSito Narcisse
Chief of StaffJana Carlisle
Director -Communications
Janel Lacy
Executive Director -Talent Strategy
Vacant
Executive Director -HRTS Operations
Craig Ott
Director - Budgeting & Financial Reporting
Glenda Gregory
Director - Financial OperationsJohn Ford
Executive Director - Facility & Grounds
MaintenanceDennis Neal
Director -Purchasing
Gary Appenfelder
Executive Director -Technology &
Information ServicesToni Russell
Executive Director - Research Assessment
& EvaluationPaul Changas
Director - Student Assignment Services
Chris Weber
Director - Information Management &
Decision SupportLaura Hansen
Executive Director - Nutrition Services
Spencer Taylor
Executive Director -Cluster Support
Alvin Jones
Executive Director - Security
James Wheeler
Director -Family & Community
PartnershipsMolly Sehring
Executive Director -Transportation
Taffy Marsh
Director - Central Services
Joe VanderveenExecutive Director - Facility Services (PT)
Joe Edgens
Director – Facility Planning &
ConstructionDavid Proffitt
Director – School AuditVacant
Manager – Executive Office
Melissa Bryant
Director – Government RelationsHank Clay
Revised: 10.10.16
Executive Director -Federal Programs &
GrantsJulie McCargar
Executive Director – Pre-K - 12 Instruction
Kelly Henderson
Director – Student Discipline
North - Bruce CurtisSouth - Lisa Currie
Director – Student Health Services
Nicole Proffitt
Coordinator – Behavioral Specialist
Derrick Williams
Director – Resource StrategyBrian Hull
Executive Director -Guidance
Nicole Cobb
Executive Director -Exceptional Education
Debbie McAdams
Executive Director -English Learners
Kevin Stacy
Director – Talent Management
Shannon Black
Director – Temporary PlacementAmber Tyus
Director -Compensation &
RewardsVacant
Director – Employee Benefits
David Hines
Director – Employee Relations
Scott Lindsey
Director – Business ServicesLisa Few
Chief Academic OfficerMonique Felder
Director - Athletics
Roosevelt Sanders
Executive Officer Level 5 Innovation
SchoolsMoreno Carrasco
Executive Officer - HSAimee Wyatt
Executive Officer -Equity & DiversityMaritza Gonzalez
Executive Lead Principal
Bill Warren
Executive Officer - MS
Antoinette Williams
Executive Officer - ES
Vanessa Garcia
Executive Officer – Charter Schools
Dennis Queen
Executive Officer – Leadership DevelopmentTerry Shrader
Executive Officer -Student Support
ServicesTony Majors
Executive Officer – FinanceVacant
Executive Officer – Human Resources
Deborah Story
Executive Officer - OperationsKen Stark
Board Exec Admin Cameo Bobo
Board Admin Liaison
Brigette Brandon
Executive Lead PrincipalKathleen Dawson
Executive Lead Principal Michele
Maultsby-Springer
Executive Lead Principal Damon Cathey
Executive Lead Principal SharonWright
Executive Lead Principal
Pippa Meriwether
Executive Lead Principal
Dottie Critchlow
Executive Lead Principal
Karen DeSouza-Gallman
Executive Lead Principal Lily Leffler
Executive Lead Principal
Adrienne Battle-Koger
Executive Lead Principal
David Kovach
Executive Lead Principal
Jon HubbleExecutive Director -
Professional Learning
Tamika Tasby
Director – Extended Learning
Jennifer Bell
Executive Director -Instructional
Technology & Library Services
Doug Renfro
Director -The Academies of
NashvilleDonna Gilley
Director -Pre-K Programs
Phyllis Philips
Director -Early Learning
CentersDana Eckman
Executive Lead Principal
Letrecia Gloster
Metropolitan Nashville Public Schools
Master Organizational Chart
16
Director of SchoolsShawn Joseph
Metropolitan Board of
Education
Chief Operating Officer Chris Henson
Chief of SchoolsSito Narcisse
Chief of StaffJana Carlisle
Director -Communications
Janel Lacy
Executive Director -Talent Strategy
Vacant
Executive Director -HRTS Operations
Craig Ott
Director - Budgeting & Financial Reporting
Glenda Gregory
Director - Financial OperationsJohn Ford
Executive Director - Facility & Grounds
MaintenanceDennis Neal
Director -Purchasing
Gary Appenfelder
Executive Director -Technology &
Information ServicesToni Russell
Executive Director - Research Assessment
& EvaluationPaul Changas
Director - Student Assignment Services
Chris Weber
Director - Information Management &
Decision SupportLaura Hansen
Executive Director - Nutrition Services
Spencer Taylor
Executive Director -Cluster Support
Alvin Jones
Executive Director - Security
James Wheeler
Director -Family & Community
PartnershipsMolly Sehring
Executive Director -Transportation
Taffy Marsh
Director - Central Services
Joe VanderveenExecutive Director - Facility Services (PT)
Joe Edgens
Director – Facility Planning &
ConstructionDavid Proffitt
Director – School AuditVacant
Manager – Executive Office
Melissa Bryant
Director – Government RelationsHank Clay
Revised: 10.10.16
Executive Director -Federal Programs &
GrantsJulie McCargar
Executive Director – Pre-K - 12 Instruction
Kelly Henderson
Director – Student Discipline
North - Bruce CurtisSouth - Lisa Currie
Director – Student Health Services
Nicole Proffitt
Coordinator – Behavioral Specialist
Derrick Williams
Director – Resource StrategyBrian Hull
Executive Director -Guidance
Nicole Cobb
Executive Director -Exceptional Education
Debbie McAdams
Executive Director -English Learners
Kevin Stacy
Director – Talent Management
Shannon Black
Director – Temporary PlacementAmber Tyus
Director -Compensation &
RewardsVacant
Director – Employee Benefits
David Hines
Director – Employee Relations
Scott Lindsey
Director – Business ServicesLisa Few
Chief Academic OfficerMonique Felder
Director - Athletics
Roosevelt Sanders
Executive Officer Level 5 Innovation
SchoolsMoreno Carrasco
Executive Officer - HSAimee Wyatt
Executive Officer -Equity & DiversityMaritza Gonzalez
Executive Lead Principal
Bill Warren
Executive Officer - MS
Antoinette Williams
Executive Officer - ES
Vanessa Garcia
Executive Officer – Charter Schools
Dennis Queen
Executive Officer – Leadership DevelopmentTerry Shrader
Executive Officer -Student Support
ServicesTony Majors
Executive Officer – FinanceVacant
Executive Officer – Human Resources
Deborah Story
Executive Officer - OperationsKen Stark
Board Exec Admin Cameo Bobo
Board Admin Liaison
Brigette Brandon
Executive Lead PrincipalKathleen Dawson
Executive Lead Principal Michele
Maultsby-Springer
Executive Lead Principal Damon Cathey
Executive Lead Principal SharonWright
Executive Lead Principal
Pippa Meriwether
Executive Lead Principal
Dottie Critchlow
Executive Lead Principal
Karen DeSouza-Gallman
Executive Lead Principal Lily Leffler
Executive Lead Principal
Adrienne Battle-Koger
Executive Lead Principal
David Kovach
Executive Lead Principal
Jon HubbleExecutive Director -
Professional Learning
Tamika Tasby
Director – Extended Learning
Jennifer Bell
Executive Director -Instructional
Technology & Library Services
Doug Renfro
Director -The Academies of
NashvilleDonna Gilley
Director -Pre-K Programs
Phyllis Philips
Director -Early Learning
CentersDana Eckman
Executive Lead Principal
Letrecia Gloster
Metropolitan Nashville Public Schools
Master Organizational Chart
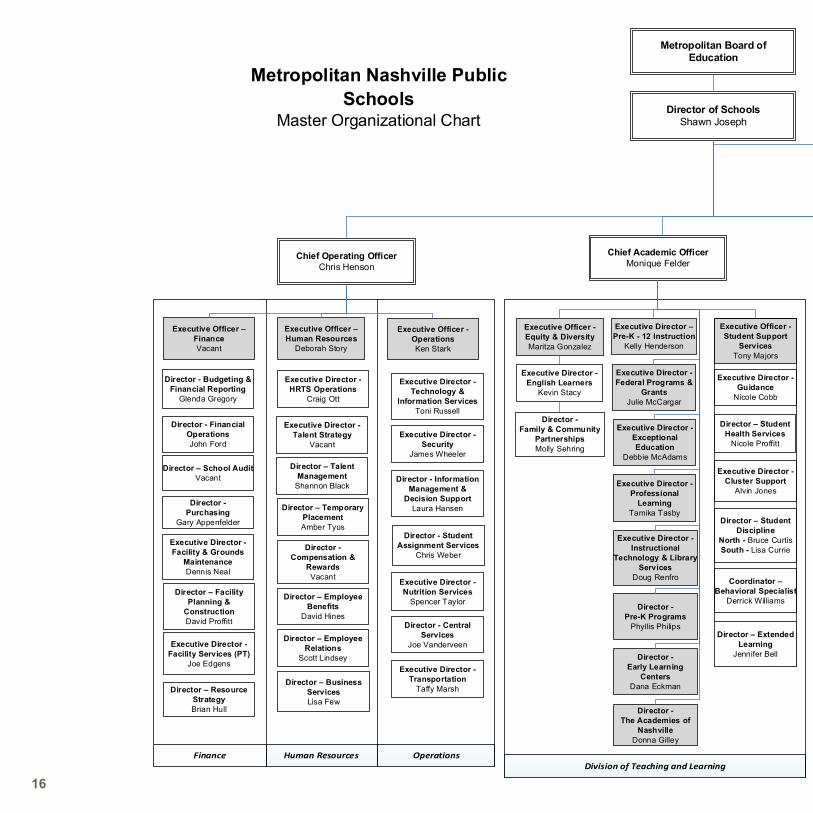
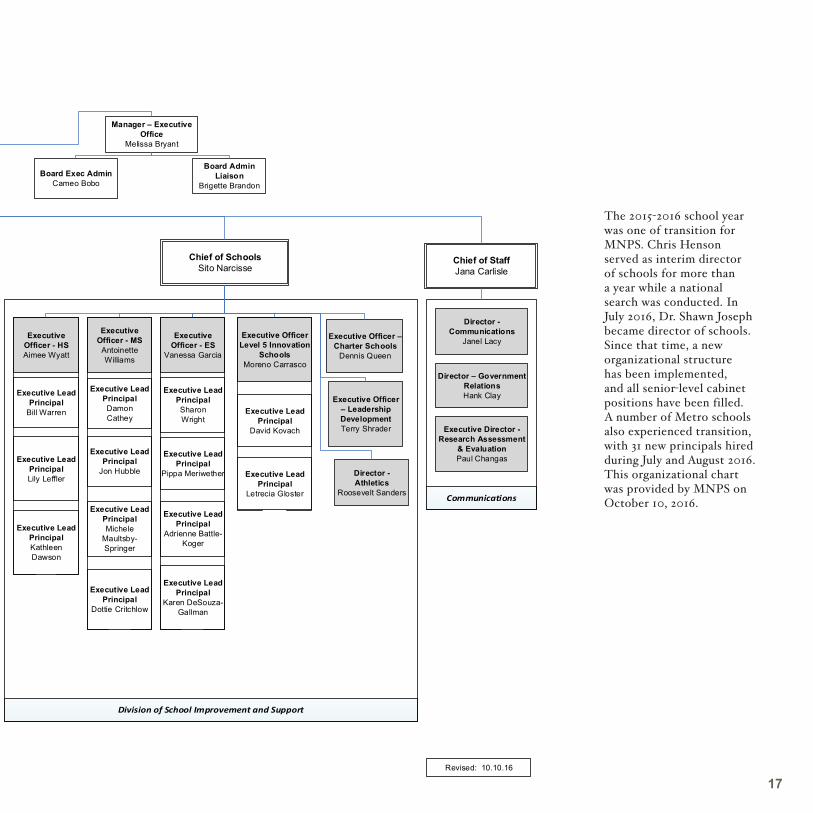
The 2015-2016 school year was one of transition for MNPS. Chris Henson served as interim director of schools for more than a year while a national search was conducted. In July 2016, Dr. Shawn Joseph became director of schools. Since that time, a new organizational structure has been implemented, and all senior-level cabinet positions have been filled. A number of Metro schools also experienced transition, with 31 new principals hired during July and August 2016. This organizational chart was provided by MNPS on October 10, 2016.
17
School System Performance
The Education Report Card Committee concludes that Metro Schools did not record overall improvement during 2015-2016. This assessment is based on a review of the previous five years’ data, a complete absence of information about performance at the 3-8 grade levels in 2016, and an absence of district-specific high school end-of-course information. Elementary and middle school test data is missing because of the repeated statewide failures of the online testing platform. Entirely new high school end-of-course tests were administered based on the revised state standards, setting a much higher bar in defining student mastery of each subject. This makes comparisons with previous years impossible. Additionally, while state-level data has been released, as of early December 2016, district-specific information was not publicly available.
All of this prevents our committee and Metro Schools from analyzing the results of schools through the district’s Academic Performance Framework (APF). The framework relies on student achievement and value-added growth data, in addition to parent and faculty climate surveys and a weighting of scores based on school demographics. In previous years, this committee looked for an increase in APF-designated “excelling” or “achieving” school seats and a decrease in “target” school seats as the primary determination of district improvement.
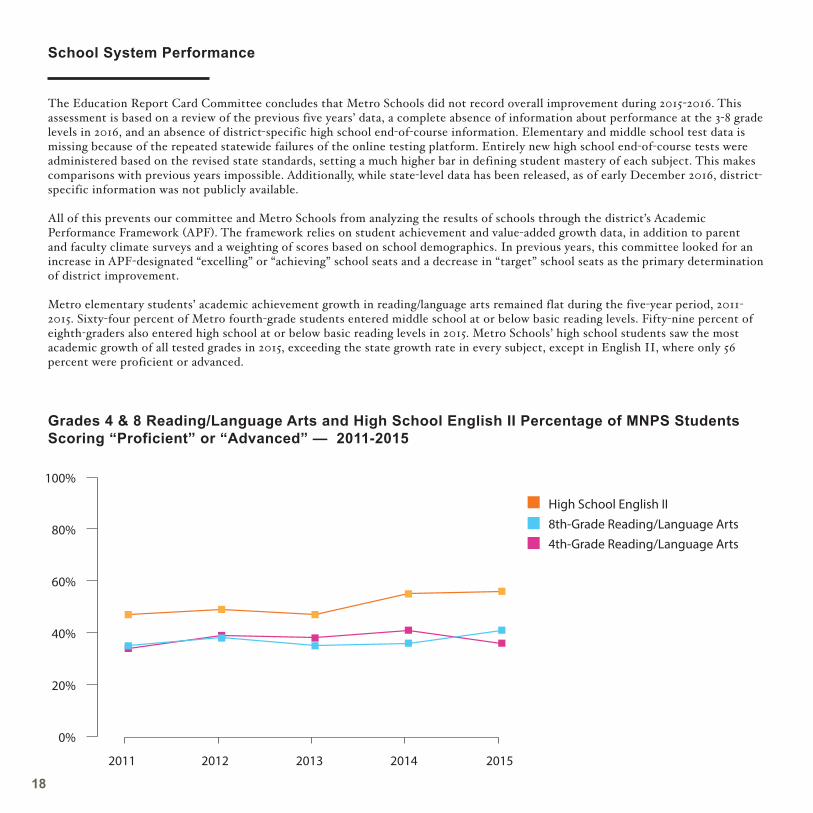
Metro elementary students’ academic achievement growth in reading/language arts remained flat during the five-year period, 2011-2015. Sixty-four percent of Metro fourth-grade students entered middle school at or below basic reading levels. Fifty-nine percent of eighth-graders also entered high school at or below basic reading levels in 2015. Metro Schools’ high school students saw the most academic growth of all tested grades in 2015, exceeding the state growth rate in every subject, except in English II, where only 56 percent were proficient or advanced.
Grades 4 & 8 Reading/Language Arts and High School English II Percentage of MNPS Students Scoring “Proficient” or “Advanced” — 2011-2015
2012 2013 2014 20152011
High School English II8th-Grade Reading/Language Arts 4th-Grade Reading/Language Arts
100%
80%
60%
40%
20%
0%
18

Graduation Rate
Metro Schools did not improve its overall graduation rate in 2016, dropping slightly from 81.6 percent in 2015 to 81 percent. Fourteen of 23 Metro high schools showed graduation rate improvements. The committee notes that the reported graduation rate reflects students who graduate in four years plus a summer period. As in previous years, we encourage the state to also report a district’s five-year graduation rate, which more accurately captures the successful graduation of student populations such as ELL and special education students.
0 20 40 60 80 100
2012
2013
2014
2015
2016
*Policy changes in 2013 required more detailed documentation for students leaving the district, making the 2013 graduation rate less comparable to previous years.
78.4%
76.6%*
78.8%
81.6%
81.0%
ACT Scores
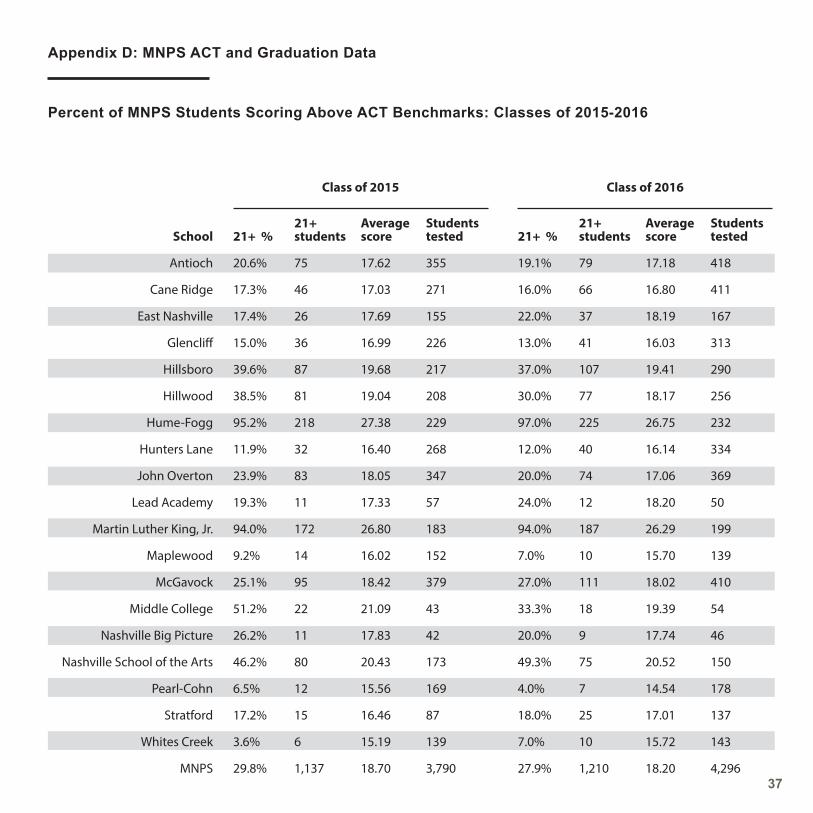
Only 11 percent of Metro students met ACT college-readiness benchmark scores in four tested subject areas – English, mathematics, reading and science. The percentage of MNPS students earning a 21 or higher on the ACT fell from 29.8 in 2015 to 27.9 in 2016, though there was a gain of 88 more individual students scoring a 21 or higher in 2016 over 2015. The decrease in percentage scoring at least a 21 is explained, in part, by the approximately 600 additional students who took the ACT in 2016 versus 2015. Because TDOE now uses a 95 percent participation rate as a component of accountability, districts across Tennessee are striving to increase the number of student test takers. Additionally, the state requires that every public school student must take the ACT to earn a high school diploma. Metro Schools should implement official ACT makeup days at its high schools as a way to encourage full ACT participation going forward. Currently, if students are absent from school on the day the school-wide ACT is administered, they receive a voucher and are responsible for scheduling a makeup exam and arranging for transportation to a testing site. A mandatory, school-based makeup day could substantially increase the percentage of test-takers.
In Metro Schools, nearly 76 percent of students are economically disadvantaged. From this group, only 18.5 percent who took the ACT scored a 21 or higher. The district’s non-economically disadvantaged students scored approximately three points higher. They also, on average, achieved a score of 21 or higher at an almost 2 to 1 rate compared to their economically disadvantaged peers. Since accessing the state’s lottery-funded Hope Scholarship for postsecondary education is crucial for many economically disadvantaged learners, Metro Schools must improve the ACT performance of these students.
19
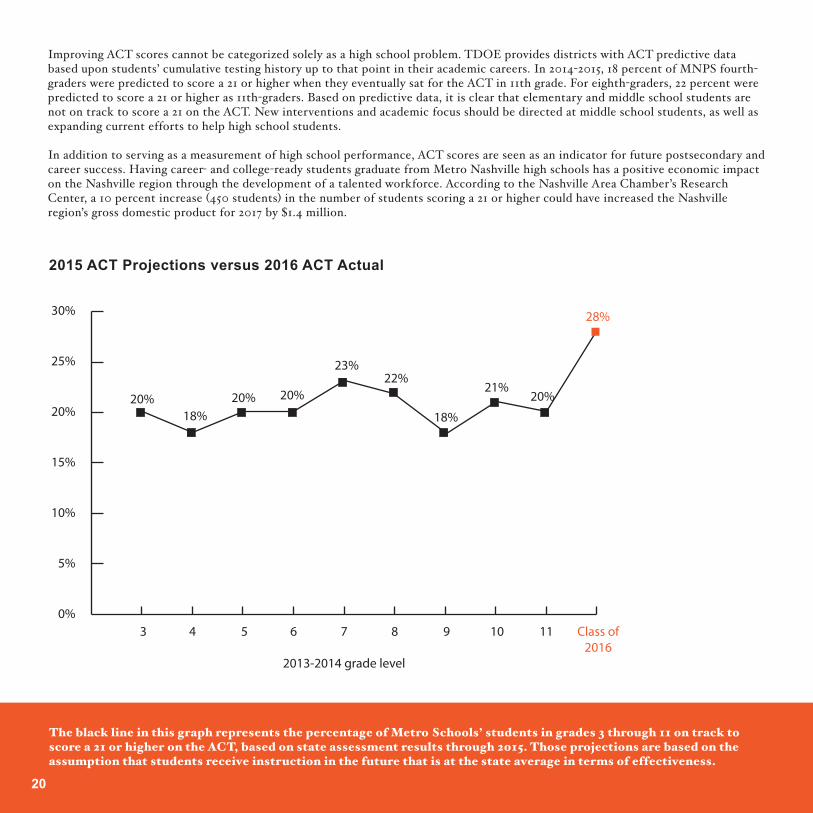
Improving ACT scores cannot be categorized solely as a high school problem. TDOE provides districts with ACT predictive data based upon students’ cumulative testing history up to that point in their academic careers. In 2014-2015, 18 percent of MNPS fourth-graders were predicted to score a 21 or higher when they eventually sat for the ACT in 11th grade. For eighth-graders, 22 percent were predicted to score a 21 or higher as 11th-graders. Based on predictive data, it is clear that elementary and middle school students are not on track to score a 21 on the ACT. New interventions and academic focus should be directed at middle school students, as well as expanding current efforts to help high school students.
In addition to serving as a measurement of high school performance, ACT scores are seen as an indicator for future postsecondary and career success. Having career- and college-ready students graduate from Metro Nashville high schools has a positive economic impact on the Nashville region through the development of a talented workforce. According to the Nashville Area Chamber’s Research Center, a 10 percent increase (450 students) in the number of students scoring a 21 or higher could have increased the Nashville region’s gross domestic product for 2017 by $1.4 million.
The black line in this graph represents the percentage of Metro Schools’ students in grades 3 through 11 on track to score a 21 or higher on the ACT, based on state assessment results through 2015. Those projections are based on the assumption that students receive instruction in the future that is at the state average in terms of effectiveness.
2015 ACT Projections versus 2016 ACT Actual
2013-2014 grade level
3 4
30%
25%
20%
15%
10%
5%
0%5 6 7 8 9 10 11 Class of
2016
20% 18%
20% 20%
23%22%
18%
21%20%
28%
20
End-of-Course exams
While TDOE released statewide high school End–of-Course (EOC) scores in early November 2016, district results were not available in time to be included in this report. The state administered new tests based on the revised state standards, which set a much higher bar in defining student mastery of each subject. As a result, there were dramatic declines statewide in student proficiency in high school math and English. Statewide proficiency in English I dropped 45 percentage points from 72 percent in 2015 to 27 percent in 2016. In algebra I, the proficiency rate dropped from 66 percent to 14 percent. Based on this data, we expect to see similar, dramatic declines at the district level.
District-level financing and school-based budgeting
The current Metro Schools budget reflects a $33.3 million increase over the prior year for a total FY2016-2017 budget of $843,299,700, an increase of 4.1 percent. Metro Schools' operating budget is 41 percent of Metro Government’s total budget, by far the largest recipient of funds. Public safety receives the second largest portion of the budget at 21 percent. With this increase, Metro Schools made major investments in English Learners, literacy support, its Community Achieves program, student-based budgeting, teacher leadership stipends, and a revised salary scale for teachers and salary-step increases for all staff.
Themes of equity specific to funding were consistently identified during the committee’s work. Metro Schools faces the challenge of ensuring that all schools have the appropriate resources necessary to serve students’ social, emotional and academic needs. Schools with greater than 50 percent of their students in poverty qualify for additional federal funding through the Title I program; however, there is a significant number of schools with student populations just below that federal threshold. They serve a large number of students in need, but do not qualify for Title I funds. These schools, in particular, face difficult decisions about prioritizing staff hires and providing wraparound services for their students.
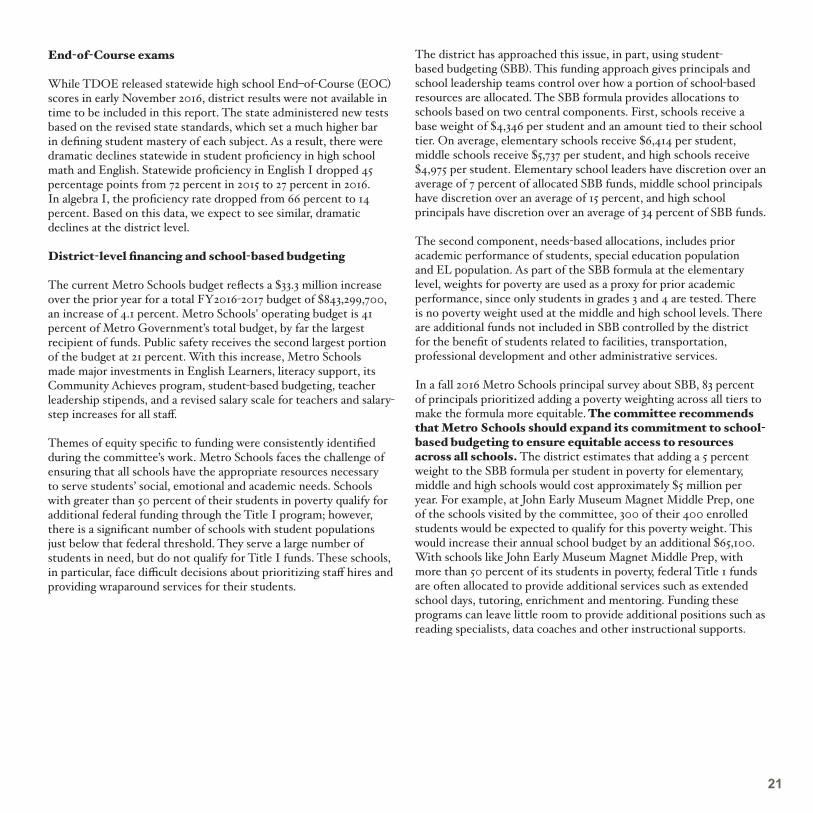
The district has approached this issue, in part, using student-based budgeting (SBB). This funding approach gives principals and school leadership teams control over how a portion of school-based resources are allocated. The SBB formula provides allocations to schools based on two central components. First, schools receive a base weight of $4,346 per student and an amount tied to their school tier. On average, elementary schools receive $6,414 per student, middle schools receive $5,737 per student, and high schools receive $4,975 per student. Elementary school leaders have discretion over an average of 7 percent of allocated SBB funds, middle school principals have discretion over an average of 15 percent, and high school principals have discretion over an average of 34 percent of SBB funds.
The second component, needs-based allocations, includes prior academic performance of students, special education population and EL population. As part of the SBB formula at the elementary level, weights for poverty are used as a proxy for prior academic performance, since only students in grades 3 and 4 are tested. There is no poverty weight used at the middle and high school levels. There are additional funds not included in SBB controlled by the district for the benefit of students related to facilities, transportation, professional development and other administrative services. In a fall 2016 Metro Schools principal survey about SBB, 83 percent of principals prioritized adding a poverty weighting across all tiers to make the formula more equitable. The committee recommends that Metro Schools should expand its commitment to school-based budgeting to ensure equitable access to resources across all schools. The district estimates that adding a 5 percent weight to the SBB formula per student in poverty for elementary, middle and high schools would cost approximately $5 million per year. For example, at John Early Museum Magnet Middle Prep, one of the schools visited by the committee, 300 of their 400 enrolled students would be expected to qualify for this poverty weight. This would increase their annual school budget by an additional $65,100. With schools like John Early Museum Magnet Middle Prep, with more than 50 percent of its students in poverty, federal Title 1 funds are often allocated to provide additional services such as extended school days, tutoring, enrichment and mentoring. Funding these programs can leave little room to provide additional positions such as reading specialists, data coaches and other instructional supports.
21

MNPS Student-Based Budgeting Phase-In
School-Level Flexibility & Needs-Based Allocation
Information provided by MNPS
Allocations for school-based budgeting do not include MNPS charter schools or some schools listed as “other”.
22
New Opportunities for Accountability
The 2015 congressional reauthorization of the federal K-12 education law – Every Student Succeeds Act (ESSA) — provides Tennessee with a unique opportunity to redesign its existing accountability system. ESSA, which replaced the No Child Left Behind Act of 2001, allows states to add additional performance measures beyond math, reading and graduation rates into their accountability measures. Each state’s education department must choose at least one additional indicator from among choices such as student engagement, educator engagement, school climate and safety, access to and completion of advanced coursework, or postsecondary readiness. They can also now receive competitive federal Title VI funds in support of 21st-century skill-building in areas such as school climate, discipline and technology.
Each state’s accountability system must include a plan to improve schools that are in the bottom 5 percent, schools that have less than two-thirds of their students graduating, and schools with the greatest achievement gaps by subgroups. Plans must also detail when states will assess English Language Learners in order to provide evidence that these students are increasing their proficiency. To support this, additional federal Title III funds will be available to states.
TDOE is engaging stakeholders – including directors of schools, principals, educators, parents and students, the business community, and advocacy groups – in its work to create a new accountability system in line with the department’s current strategic plan. The department will work towards a final plan to be submitted to the U.S. Department of Education in March 2017, with implementation to begin in the 2017-2018 school year.
Any indicator the state selects must be valid, reliable, comparable and statewide to allow for meaningful differentiation in school performance. The Report Card Committee believes a focus on student preparation represents an important opportunity for Tennessee to ensure students are prepared for life after high school. This could be earning industry-recognized credentials, early college credit or gaining work-based learning experiences. The committee recommends that Tennessee should incorporate both career and college readiness into the new school and district accountability system.
A-F Grading System
In 2016, the Tennessee General Assembly passed legislation that became Public Chapter 680, requiring TDOE to develop a grading system in which schools will receive an A-F grade beginning with the 2017-2018 school year. In previous editions of the state report card, schools received grades in specific areas, but those grades did not roll up into a single letter grade. Sixteen other states have adopted this type of reporting system to inform the public on the quality of schools. TDOE is working to ensure that the A-F grading system aligns with the state’s new accountability framework for schools and districts. Discussion continues at the state level – guided by stakeholder input – to determine the exact criteria that will make a school eligible for a particular letter grade. Providing a consistent and understandable framework for accountability in our state is a significant opportunity to align the state’s report card and Achievement School District (ASD) eligibility for schools in the bottom 5 percent of statewide performance.
23

24
Literacy
Literacy is built through a combination of mastery in phonics, oral language and content knowledge, which leads to comprehension. Reading tends to be understood as the act of looking at a string of letters in a written text and translating or decoding these letters into sound. A core part of reading instruction includes skills-based competencies such as alphabet knowledge, fluency and word reading. Some literacy experts, such as Vanderbilt University professor David K. Dickinson, suggest there tends to be an overemphasis on phonics and not enough focus on academic vocabulary, advanced grammar skills and world knowledge. These elements of reading comprehension play a pivotal role in success, particularly for students in the later grades. Deep comprehension – also referred to as knowledge-based competencies – takes place when a reader both decodes individual words and forms images of what those words mean based on firsthand exposure or experience in the real world. Many of the 75 percent of Metro Schools students who live in poverty enter school without personal experiences beyond their immediate neighborhoods and without exposure to vocabulary-rich environments. As a result, decoding words becomes an even greater challenge, often leaving words as abstract concepts with little real meaning. Students living in poverty need more access to high-quality books and other resources so that they can make meaning of text. The roughly 17 percent of MNPS students for whom English is a new or second language face additional challenges, particularly in the case of children from immigrant and refugee backgrounds who have experienced interrupted formal schooling.
It is disheartening that the past two decades of literacy efforts in Metro Schools are not having a stronger positive impact on students. Literacy and reading proficiency were cited as a concern in the first Education Report Card in 1993, and the 1997 edition warned that MNPS would face major problems in the future because less than two-thirds of students had mastered appropriate reading comprehension skills. We now know that the 62 percent of Metro Schools students who were considered proficient in reading in 1997 did not portray an accurate picture of student achievement, due to insufficient rigor of Tennessee’s academic standards at the time. In 2015, the last year for which we have data for grades 3-8, only 36 percent of fourth-grade students and 41 percent of eighth-grade students were proficient in reading. Literacy challenges are also a state and national issue. In Tennessee, 47 percent of students in grades 3-8 were proficient readers on the TCAP assessment. Nationally, only 34 percent of fourth-grade students were proficient on the National Assessment of Educational Progress reading assessment in 2015, which includes 33 percent of Tennessee fourth-graders.
There is ample evidence of the detrimental effects of low literacy rates on both students and the community, according to the 2012 report from the Annie E. Casey Foundation, Double Jeopardy: How Third-Grade Reading Skills and Poverty Influence Education. It found that students who were not reading proficiently by the end of third grade were four times more likely to drop out of high school than their peers who had developed those skills. Dropping out of high school had major long-term implications for these students’ financial well-being and health, as well as societal costs. Research from multiple sources found that high school dropouts cost taxpayers approximately $292,000 over the course of their lives, and that dropouts were more likely to become incarcerated or be enrolled in social programs.
Recognizing its reading and literacy challenges, the state of Tennessee has set an ambitious goal of having 75 percent of Tennessee students reading at proficient or advanced levels by the year 2025. In early 2016, Gov. Haslam announced the Read to be Ready initiative, allocating $9 million in the state budget to fund reading instructional coaches who provide professional development to school districts across the state. As part of this new initiative, the Dollar General Literacy Foundation provided a $1 million grant over three years to support summer reading programs statewide. TDOE officials have reported that, on average, the more than 500 students statewide participating in the new summer program increased their fluency by 23 percent, decoding ability by 44 percent and phonemic awareness by 66 percent. It is important to continue tracking the progress of these students in the years ahead to see if these gains are sustained and translate into increases in reading proficiency on the new state assessment.
TDOE has also provided new assessment resources to school districts in earlier grades. After a trial year, the state has offered a voluntary second-grade assessment in literacy and math to help schools identify struggling students before the third grade. Unfortunately, Metro Schools is not among the 67 Tennessee school districts administering the test at the end of the 2016-2017 school year. The district should take advantage of TDOE resources, such as the second-grade assessment, to help teachers better understand student needs for early mastery of foundational literacy standards.
Over the past two decades, Metro Schools has launched various district reading and literacy initiatives, with no discernable impact on overall reading results. For the past 13 years, MNPS has used a “balanced literacy approach,” a three-part strategy focused on reading, writing and building vocabulary; however,
25
fidelity of implementation varies from classroom to classroom. Concluding that the district’s persistently low reading proficiency levels could no longer await an incremental or limited approach, the 2015 Education Report Card committee recommended that Metro Schools implement a dramatic intervention for all students reading below grade level in first through third grades. The district’s response to this recommendation can be found in Appendix A. In the last year, the district has launched new literacy efforts, including school-based literacy coaches and reading interventionists who provide support to teachers and students, and a growing literacy partnership with Lipscomb University to provide professional development to educators. Going forward, Metro Schools should measure each school’s implementation of the district’s literacy initiatives to ensure fidelity.
The 2016-2017 Metro Schools operating budget allocated an additional $4 million for literacy efforts, mostly for an expansion of the district’s 2016-2017 Reading Recovery initiative, a reading intervention for struggling first-grade students. Reading Recovery is a school-based, short-term program designed for children aged 5 or 6, who are the lowest achieving in literacy after their first year of school. A Reading Recovery teacher serves the lowest 20 percent of first-graders with a research-based model and serves other struggling students in small group instruction. The district currently has 63 Reading Recovery teachers. In 2015, each Reading Recovery teacher worked with approximately 40 to 50 students in small group or one-on-one instruction. Of the more than 350 students who received the full 20-week series of lessons in 2015, 68 percent made sufficient progress to exit the program, surpassing the national Reading Recovery success rate of 63 percent. The fact that 32 percent of the students who received this intensive intervention still did not become proficient suggests that a reliance on remediation alone is insufficient.
In 2015-2016, 40 MNPS schools had created a literacy coach position, designated to provide professional coaching and curriculum resources to teachers and some instructional support to students. This position is often filled through the use of a school’s Title I federal funds or through discretionary dollars available as part of school-based budgeting. Metro Schools also has 20 reading interventionists, mostly retired educators working on a 120-day contract to provide small group instruction to older elementary school students who are behind grade level. While many schools rely on their literacy coach and interventionist to drive gains in their students’ reading proficiency, the district does not require teachers holding this position to possess a specific credential related to literacy instruction. Given the importance of providing students a strong literacy foundation in the early grades and realizing that programs and interventions alone cannot substitute for a well-trained and highly effective teacher, Metro Schools should ensure that its early-grade teachers have demonstrated expertise in literacy instruction. At
the state level, TDOE is working with state teacher preparation programs to increase literacy instruction licensure requirements.In 2016-2017, Metro Schools entered into its third year of expanding its literacy partnership with Lipscomb University. As part of this initiative, Lipscomb faculty work with each of the principals in the 73 district-run elementary schools to create an eight- to 10- member literacy team that identifies the school’s coaching and professional development needs. Once a month, each school’s literacy coach undergoes training at Lipscomb to learn about a research-based practice, such as guided reading and how to implement that practice in a classroom laboratory. The literacy coaches then offer professional development around that research and practice to their school’s faculty. Once this round of training is delivered at the school level, Lipscomb and MNPS convene the literacy coaches as a group to reflect on their experience and share best practices.
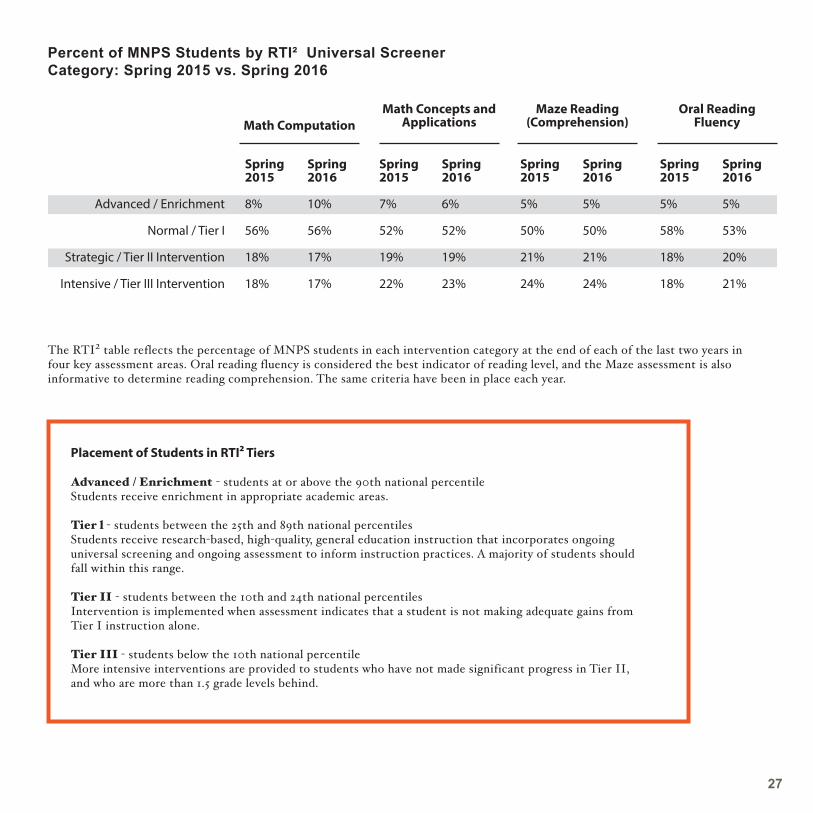
At the typical classroom level, schools address students’ literacy needs through the Response to Instruction and Intervention (RTI²) framework. RTI² is a process by which teachers identify specific student needs and match appropriate instructional strategies. Tennessee implemented RTI² in elementary schools during the 2014-2015 school year and middle schools in 2015-2016. For 2016-2017, all K-12 public schools in all grade levels are implementing this approach. RTI² provides ongoing assessments to identify each student’s specific needs in reading, writing and math so they can get the appropriate level of instruction. Ideally, most students reside in Tier I, receiving differentiated instruction in the regular classroom based on a regular assessment of their level of progress. Tier 2 students receive targeted academic interventions and more frequent assessment of their progress to guide those additional supports. Students in Tier 3 are typically more than a grade level behind or in the bottom 10 percent of their peer group academically, necessitating more dramatic interventions, such as one-on-one instruction. The goal is for students to benefit from the academic interventions so that they are able to progress appropriately in the regular classroom setting.
In 2016, Metro Schools determined that about five percent of its students resided in Advanced / Enrichment in both reading comprehension and fluency. Fifty percent of MNPS students resided in Tier I for reading comprehension and fluency, which is regular classroom instruction. Approximately 20 percent of the students were in Tier II for moderate interventions, and another 20 percent were in Tier III, the most intensive assistance. Most discouragingly, these numbers did not materially improve from the spring of 2015, reinforcing the committee’s belief that MNPS has not shown districtwide improvement in literacy over the course of the past year.
26
Percent of MNPS Students by RTI² Universal Screener Category: Spring 2015 vs. Spring 2016
Advanced / Enrichment
Normal / Tier I
Strategic / Tier II Intervention
Intensive / Tier III Intervention
Spring 2015
8%
56%
18%
18%
Math Computation
Spring 2016
10%
56%
17%
17%
Spring 2015
7%
52%
19%
22%
Spring 2016
6%
52%
19%
23%
Spring 2015
5%
50%
21%
24%
Spring 2016
5%
50%
21%
24%
Spring 2015
5%
58%
18%
18%
Spring 2016
5%
53%
20%
21%
Math Concepts and Applications
Maze Reading(Comprehension)
Oral Reading Fluency
The RTI² table reflects the percentage of MNPS students in each intervention category at the end of each of the last two years in four key assessment areas. Oral reading fluency is considered the best indicator of reading level, and the Maze assessment is also informative to determine reading comprehension. The same criteria have been in place each year.
Placement of Students in RTI² Tiers
Advanced / Enrichment - students at or above the 90th national percentile Students receive enrichment in appropriate academic areas.
Tier l - students between the 25th and 89th national percentiles Students receive research-based, high-quality, general education instruction that incorporates ongoing universal screening and ongoing assessment to inform instruction practices. A majority of students should fall within this range.
Tier II - students between the 10th and 24th national percentilesIntervention is implemented when assessment indicates that a student is not making adequate gains from Tier I instruction alone.
Tier III - students below the 10th national percentile More intensive interventions are provided to students who have not made significant progress in Tier II, and who are more than 1.5 grade levels behind.
27
The focus on literacy also includes students learning English as a new language, although a full analysis of the EL program is beyond the scope of this year’s report. In 2016, there were 13,496 Metro Schools students receiving EL services. While this represents 17 percent of the district’s total student population, 32 percent of all students have a non-English language family background. MNPS has increased resources to EL students in recent years, and while this group of students faces significant challenges, there are signs of progress. Over the past three years, the district has increased the language growth of EL students on the ACCESS language proficiency test, which is different from the state assessment that measures the reading proficiency of all students. In 2015, EL students reached 9.4 percent English proficiency on the ACCESS test, and achieved 13.6 percent proficiency in 2016, more than doubling the state target of 4.7 percent.
Metro Schools is not alone in their desire to see students proficient in literacy. There are hundreds of community nonprofits, business partners and extended learning programs providing support to district students across all grade levels. Nashville has not formally mapped out community assets related to K-12 literacy. As part of its Read to be Ready initiative, TDOE is beginning an inventory of these assets, with the goal of documenting the literacy resources available across the state for students, families and educators in each school district. The state hopes this tool will inspire additional support by informing communities of gaps in resources.
The Nashville Public Library has multiple education partnerships centered on literacy. Metro Schools students have immediate access to the Nashville Public Library collection through the Limitless Libraries program, initiated by former Nashville mayor Karl Dean. More than 25,000 MNPS students – 15,000 of them first-time library users – are registered users of the program. In 2013, MNPS students received more than 112,000 books and other items via daily courier deliveries to their school location. Bringing Books to Life is a library partnership with Nashville early childhood centers, serving children 3-5 years of age enrolled in a full-time preschool or pre-K program. During the six-week, onsite program, library staff conduct two teacher workshops on the best practices for developing literacy skills. Library staff then visits the early childhood classroom, leads a story time and provides each child with an art activity that reinforces literature themes and reading skills. The library also coordinates the city’s Nashville Afterschool Zone Alliance (NAZA), a nationally recognized system of free, high-quality afterschool programs that provide academic support and new creative outlets for students in 26 middle schools.
There are dozens of nonprofits that also play a critical role in supporting MNPS’s literacy efforts. United Way of Metropolitan Nashville’s Read to Succeed program, initiated in 2004, also supports the city’s early childhood education providers. The program design focuses on building literacy and social-emotional skills for Nashville’s most at-risk preschoolers through practice of vocabulary, phonological awareness, print awareness, alphabet knowledge and social-emotional development. In 2015, the program reported that 96 percent of participating children had the basic literacy skills necessary to succeed in kindergarten. NAZA has served 4,300 students since 2010. Books from Birth and Book ‘Em are organizations that focus on putting books into the hands of children and families. Books from Birth, the Nashville chapter of the Imagination Library initiative founded by Dolly Parton, mails a free book every month to an enrolled family from the time of a child’s birth until they reach 5 years of age. Book ‘Em facilitates donations of books and administers Nashville’s Reading Is Fundamental (RIF) program, in which volunteers read to a classroom of students and give a free book to every child following the reading. In 2015-2016, RIF served 3,375 students at 13 of Metro’s elementary schools. The 23 reading clinics in MNPS schools are filled with community volunteers through the PENCIL Foundation’s Reading Partners program. These volunteers work individually with students for 30 minutes a week over an eight-week period. During the 2014-2015 school year, 930 students were served by volunteer reading partners.
While these organizations, and many more, are committed to improving the reading ability of Nashville’s students, there is a clear opportunity to better align community efforts around a citywide literacy plan that builds upon the work and responsibility of Metro Schools in a way that ultimately boosts reading proficiency. In its 2015 report, Picking Up the Pace, the Nashville Public Education Foundation called for the creation of a citywide early literacy strategy that brings these efforts together. With a new MNPS administration making reading proficiency its top priority, it is time to take action. Metro Schools should engage its community partners in developing a citywide plan by May 2017 to ensure early-grade literacy success. Completing the plan on this timeline would allow for the funding of new strategies in the 2017-2018 city budget and would allow for implementation during the next school year. As addressed during the last two decades, if students are not proficient in literacy by third grade, there are serious challenges to their future success.
28
Appendix A: Status of 2015 Education Report Card Recommendations
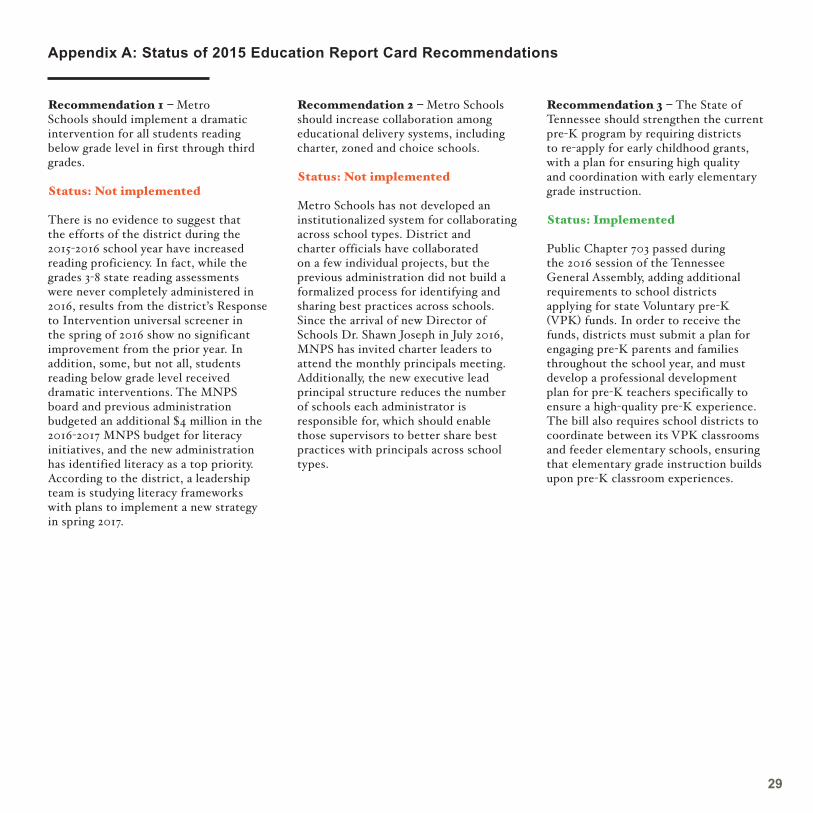
Recommendation 1 – Metro Schools should implement a dramatic intervention for all students reading below grade level in first through third grades.
Status: Not implemented
There is no evidence to suggest that the efforts of the district during the 2015-2016 school year have increased reading proficiency. In fact, while the grades 3-8 state reading assessments were never completely administered in 2016, results from the district’s Response to Intervention universal screener in the spring of 2016 show no significant improvement from the prior year. In addition, some, but not all, students reading below grade level received dramatic interventions. The MNPS board and previous administration budgeted an additional $4 million in the 2016-2017 MNPS budget for literacy initiatives, and the new administration has identified literacy as a top priority. According to the district, a leadership team is studying literacy frameworks with plans to implement a new strategy in spring 2017.
Recommendation 2 – Metro Schools should increase collaboration among educational delivery systems, including charter, zoned and choice schools.
Status: Not implemented
Metro Schools has not developed an institutionalized system for collaborating across school types. District and charter officials have collaborated on a few individual projects, but the previous administration did not build a formalized process for identifying and sharing best practices across schools. Since the arrival of new Director of Schools Dr. Shawn Joseph in July 2016, MNPS has invited charter leaders to attend the monthly principals meeting. Additionally, the new executive lead principal structure reduces the number of schools each administrator is responsible for, which should enable those supervisors to better share best practices with principals across school types.
Recommendation 3 – The State of Tennessee should strengthen the current pre-K program by requiring districts to re-apply for early childhood grants, with a plan for ensuring high quality and coordination with early elementary grade instruction.
Status: Implemented
Public Chapter 703 passed during the 2016 session of the Tennessee General Assembly, adding additional requirements to school districts applying for state Voluntary pre-K (VPK) funds. In order to receive the funds, districts must submit a plan for engaging pre-K parents and families throughout the school year, and must develop a professional development plan for pre-K teachers specifically to ensure a high-quality pre-K experience. The bill also requires school districts to coordinate between its VPK classrooms and feeder elementary schools, ensuring that elementary grade instruction builds upon pre-K classroom experiences.
29

Recommendation 4 – The State of Tennessee should explore offering first-year teachers increased choice in benefit packages, with any savings directed toward increasing starting salary.
Status: Not implemented
While introductory discussions with the state treasurer’s office were held to explore this idea, the state’s addition of a hybrid retirement benefit plan in 2014 for new teachers and state employees, containing features of both the traditional defined benefit program offered by the state and a defined contribution 401(k) program, precluded serious consideration of further changes to the benefit structure at this time.
Recommendation 5 – Metro Schools should conduct an independent, comprehensive review of its human capital department using HR professionals from some of Nashville’s leading businesses.
Status: Implemented
The human resources department under the previous MNPS administration met once with a group of private-sector HR professionals recruited by the Chamber, but declined to engage those experts in a comprehensive review. Instead, Metro Schools retained a team of from the Council of the Great City Schools (CGCS) to conduct an independent, comprehensive review of its human resources department in spring 2016. The CGCS review highlighted substantive, systemic ways to improve the department, and recommended that MNPS engage private-sector professionals as part of its reformation. The human resources department is now under new leadership, and the CGCS review is informing its analysis of the future of the department. Dr. Joseph appointed several prominent business leaders to his transition team, which has conducted a thorough review of human resources. Those findings and recommendations will be finalized by January 2017.
30
Appendix B: MNPS Demographic, Enrollment and Suspension Data
100,000
80,000
60,000
40,000
20,000
0
2006
2007
2008
2009
2010
2011
2012
2013
2014
2015
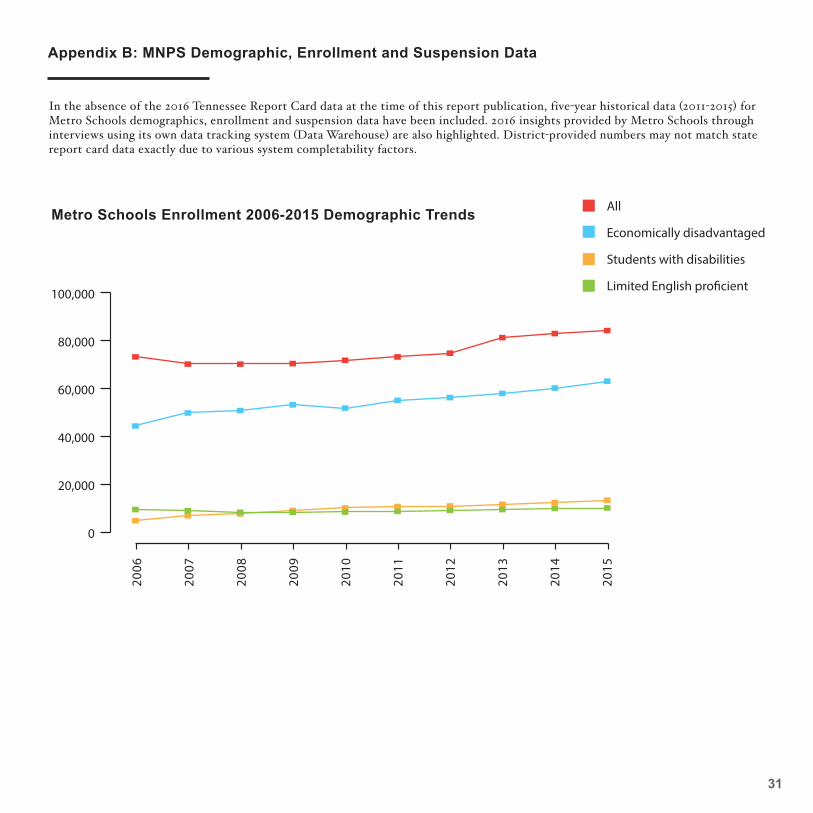
Metro Schools Enrollment 2006-2015 Demographic Trends All
Economically disadvantaged
Students with disabilities
Limited English proficient
In the absence of the 2016 Tennessee Report Card data at the time of this report publication, five-year historical data (2011-2015) for Metro Schools demographics, enrollment and suspension data have been included. 2016 insights provided by Metro Schools through interviews using its own data tracking system (Data Warehouse) are also highlighted. District-provided numbers may not match state report card data exactly due to various system completability factors.
31
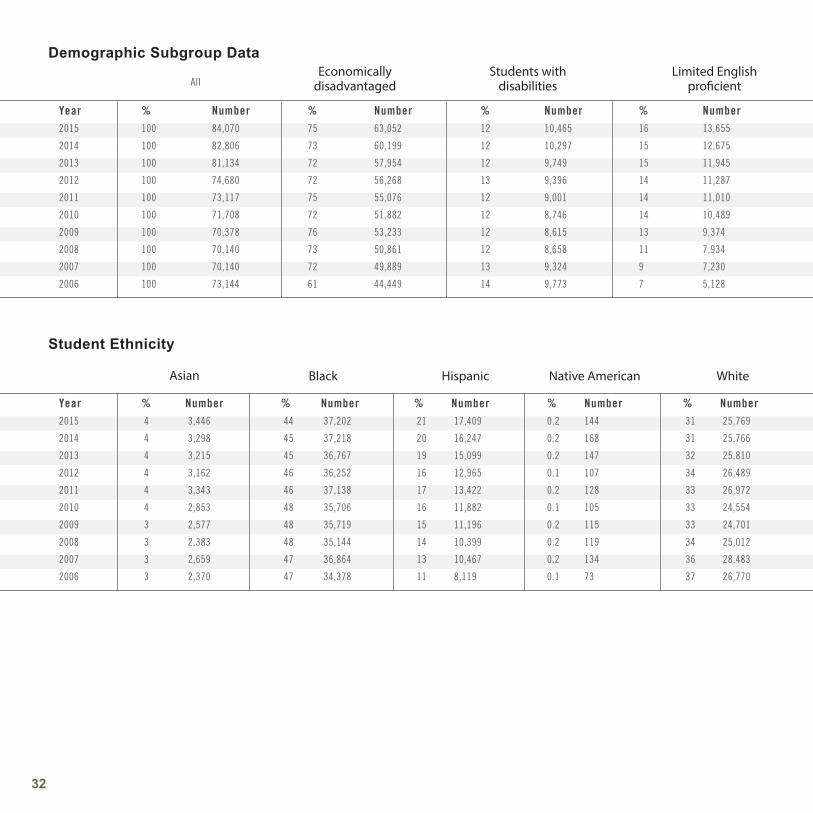
Demographic Subgroup Data
All
Year2015
2014
2013
2012
2011
2010
2009
2008
2007
2006
%100
100
100
100
100
100
100
100
100
100
Number84,070
82,806
81,134
74,680
73,117
71,708
70,378
70,140
70,140
73,144
Economically disadvantaged
%75
73
72
72
75
72
76
73
72
61
Number63,052
60,199
57,954
56,268
55,076
51,882
53,233
50,861
49,889
44,449
%12
12
12
13
12
12
12
12
13
14
Number10,465
10,297
9,749
9,396
9,001
8,746
8,615
8,658
9,324
9,773
%16
15
15
14
14
14
13
11
9
7
Number13,655
12,675
11,945
11,287
11,010
10,489
9,374
7,934
7,230
5,128
Students with disabilities
Limited English proficient
Student Ethnicity
Asian
Year2015
2014
2013
2012
2011
2010
2009
2008
2007
2006
% 4
4
4
4
4
4
3
3
3
3
Number 3,446
3,298
3,215
3,162
3,343
2,853
2,577
2,383
2,659
2,370
Black
% 44
45
45
46
46
48
48
48
47
47
Number 37,202
37,218
36,767
36,252
37,138
35,706
35,719
35,144
36,864
34,378
% 21
20
19
16
17
16
15
14
13
11
Number 17,409
16,247
15,099
12,965
13,422
11,882
11,196
10,399
10,467
8,119
%0.2
0.2
0.2
0.1
0.2
0.1
0.2
0.2
0.2
0.1
% 31
31
32
34
33
33
33
34
36
37
Number144
168
147
107
128
105
115
119
134
73
Number 25,769
25,766
25,810
26,489
26,972
24,554
24,701
25,012
28,483
26,770
Hispanic Native American
White
32
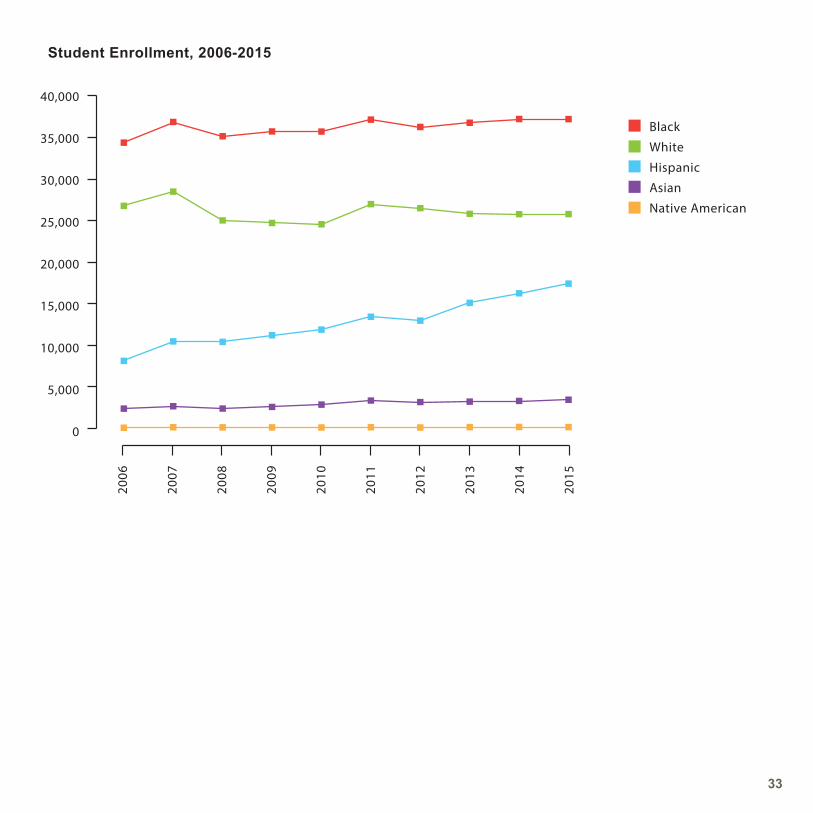
Black
White
Hispanic
Asian
Native American
Student Enrollment, 2006-2015
40,000
35,000
30,000
25,000
20,000
15,000
10,000
5,000
0
2006
2007
2008
2009
2010
2011
2012
2013
2014
2015
33
Suspensions
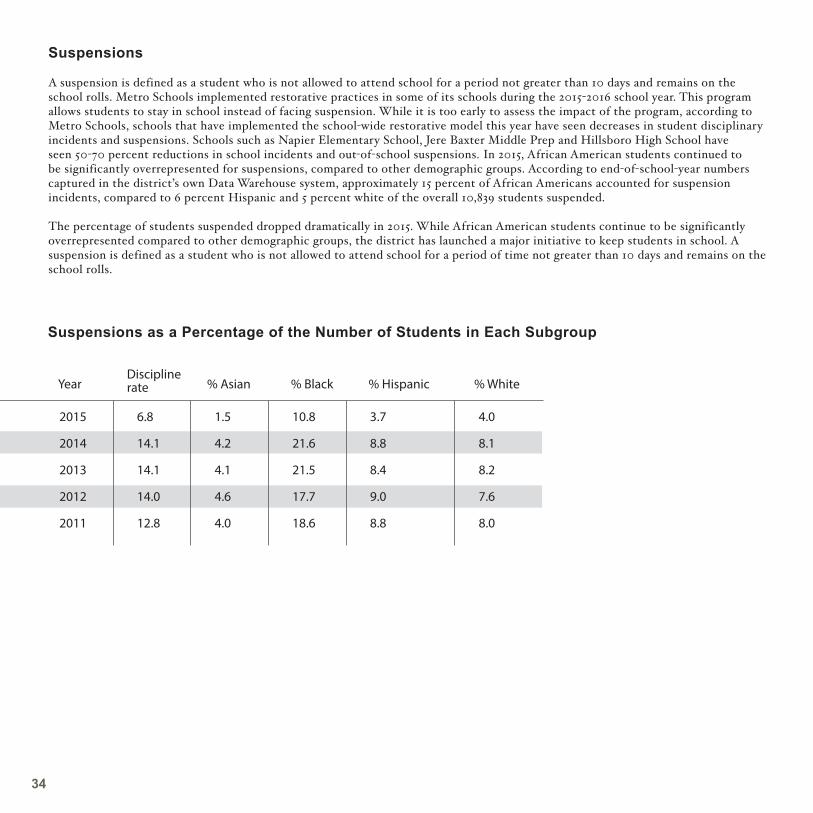
A suspension is defined as a student who is not allowed to attend school for a period not greater than 10 days and remains on the school rolls. Metro Schools implemented restorative practices in some of its schools during the 2015-2016 school year. This program allows students to stay in school instead of facing suspension. While it is too early to assess the impact of the program, according to Metro Schools, schools that have implemented the school-wide restorative model this year have seen decreases in student disciplinary incidents and suspensions. Schools such as Napier Elementary School, Jere Baxter Middle Prep and Hillsboro High School have seen 50-70 percent reductions in school incidents and out-of-school suspensions. In 2015, African American students continued to be significantly overrepresented for suspensions, compared to other demographic groups. According to end-of-school-year numbers captured in the district’s own Data Warehouse system, approximately 15 percent of African Americans accounted for suspension incidents, compared to 6 percent Hispanic and 5 percent white of the overall 10,839 students suspended.
The percentage of students suspended dropped dramatically in 2015. While African American students continue to be significantly overrepresented compared to other demographic groups, the district has launched a major initiative to keep students in school. A suspension is defined as a student who is not allowed to attend school for a period of time not greater than 10 days and remains on the school rolls.
Suspensions as a Percentage of the Number of Students in Each Subgroup
Year
2015
2014
2013
2012
2011
Disciplinerate
6.8
14.1
14.1
14.0
12.8
% Asian
1.5
4.2
4.1
4.6
4.0
% Black
10.8
21.6
21.5
17.7
18.6
% Hispanic
3.7
8.8
8.4
9.0
8.8
% White
4.0
8.1
8.2
7.6
8.0
34

Appendix C: MNPS Funding
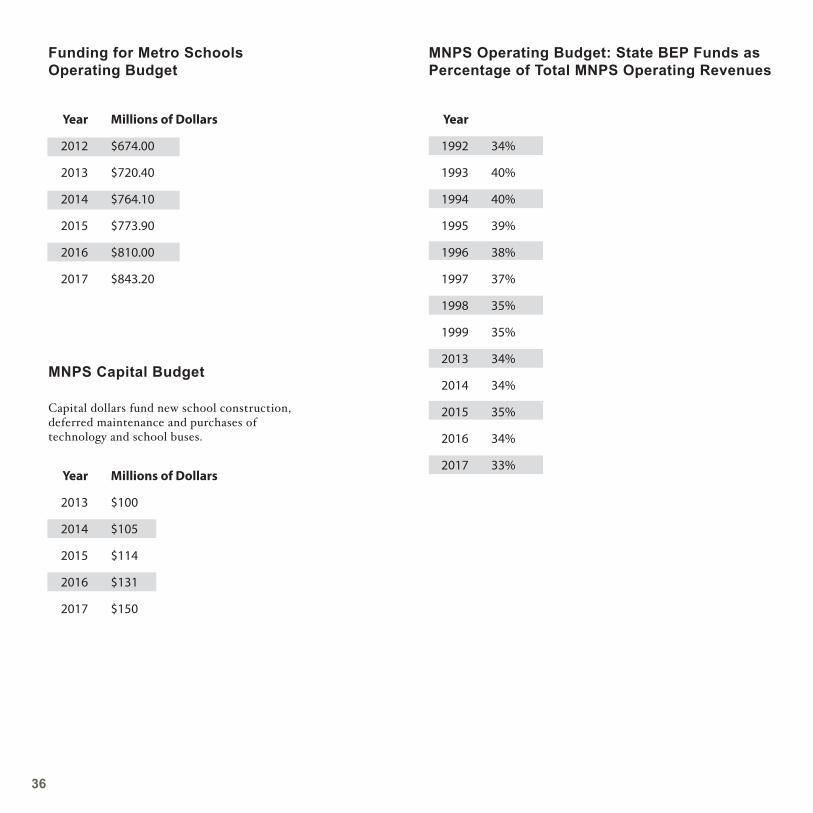
The MNPS budget reflects a 4.1 percent increase over prior year (2015). The final FY2016-2017 overall budget is $843,299,700, which is a $33.3 million increase over the FY2016 budget of $810,000,000. The entire Metro Government budget increased by 6.1 percent.
The MNPS operating budget is 41 percent of Metro Government’s total budget, by far the largest recipient of funds. Public safety receives the second largest portion of the budget, at 21 percent. MNPS includes investments in:
• English Language Learners• Literacy support• Community Achieves• Student-based budgeting• Teacher-leadership stipends• Reflects revised salary scale for teachers and salary-step increases for all staff
According to Tennessee Department of Education calculations, MNPS expenditure per student during the 2014-2015 school year was $11,496. This calculation is based on average daily attendance. Of these funds, 59.0 percent are local dollars, 12.1 percent are federal dollars and 28.9 percent are state dollars. This data comes from the state report card, and 2014-2015 data are the most current.
35
Funding for Metro Schools Operating Budget
MNPS Capital Budget
Year
2012
2013
2014
2015
2016
2017
Year
2013
2014
2015
2016
2017
Millions of Dollars
$674.00
$720.40
$764.10
$773.90
$810.00
$843.20
Millions of Dollars
$100
$105
$114
$131
$150
MNPS Operating Budget: State BEP Funds as Percentage of Total MNPS Operating Revenues
Year
1992
1993
1994
1995
1996
1997
1998
1999
2013
2014
2015
2016
2017
34%
40%
40%
39%
38%
37%
35%
35%
34%
34%
35%
34%
33%
Capital dollars fund new school construction, deferred maintenance and purchases of technology and school buses.
36
Percent of MNPS Students Scoring Above ACT Benchmarks: Classes of 2015-2016
School
Antioch
Cane Ridge
East Nashville
Glencliff
Hillsboro
Hillwood
Hume-Fogg
Hunters Lane
John Overton
Lead Academy
Martin Luther King, Jr.
Maplewood
McGavock
Middle College
Nashville Big Picture
Nashville School of the Arts
Pearl-Cohn
Stratford
Whites Creek
MNPS
21+ %
20.6%
17.3%
17.4%
15.0%
39.6%
38.5%
95.2%
11.9%
23.9%
19.3%
94.0%
9.2%
25.1%
51.2%
26.2%
46.2%
6.5%
17.2%
3.6%
29.8%
21+ students
75
46
26
36
87
81
218
32
83
11
172
14
95
22
11
80
12
15
6
1,137
Averagescore
17.62
17.03
17.69
16.99
19.68
19.04
27.38
16.40
18.05
17.33
26.80
16.02
18.42
21.09
17.83
20.43
15.56
16.46
15.19
18.70
Studentstested
355
271
155
226
217
208
229
268
347
57
183
152
379
43
42
173
169
87
139
3,790
Class of 2015
21+ %
19.1%
16.0%
22.0%
13.0%
37.0%
30.0%
97.0%
12.0%
20.0%
24.0%
94.0%
7.0%
27.0%
33.3%
20.0%
49.3%
4.0%
18.0%
7.0%
27.9%
21+ students
79
66
37
41
107
77
225
40
74
12
187
10
111
18
9
75
7
25
10
1,210
Averagescore
17.18
16.80
18.19
16.03
19.41
18.17
26.75
16.14
17.06
18.20
26.29
15.70
18.02
19.39
17.74
20.52
14.54
17.01
15.72
18.20
Studentstested
418
411
167
313
290
256
232
334
369
50
199
139
410
54
46
150
178
137
143
4,296
Class of 2016
Appendix D: MNPS ACT and Graduation Data
37
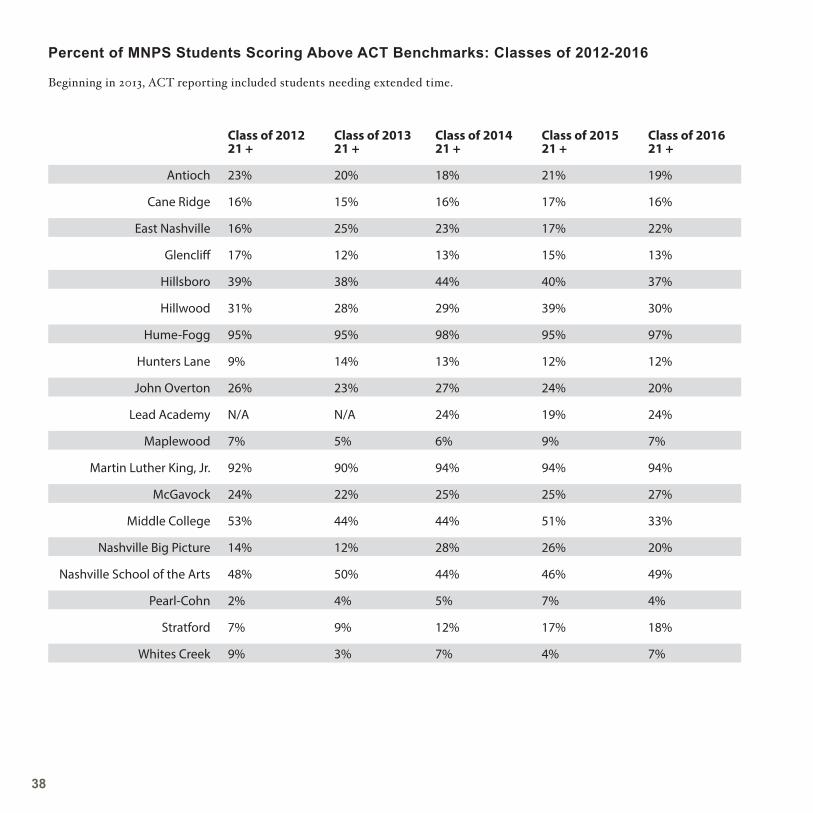
Percent of MNPS Students Scoring Above ACT Benchmarks: Classes of 2012-2016
Beginning in 2013, ACT reporting included students needing extended time.
Antioch
Cane Ridge
East Nashville
Glencliff
Hillsboro
Hillwood
Hume-Fogg
Hunters Lane
John Overton
Lead Academy
Maplewood
Martin Luther King, Jr.
McGavock
Middle College
Nashville Big Picture
Nashville School of the Arts
Pearl-Cohn
Stratford
Whites Creek
Class of 201221 +
23%
16%
16%
17%
39%
31%
95%
9%
26%
N/A
7%
92%
24%
53%
14%
48%
2%
7%
9%
Class of 201321 +
20%
15%
25%
12%
38%
28%
95%
14%
23%
N/A
5%
90%
22%
44%
12%
50%
4%
9%
3%
Class of 201421 +
18%
16%
23%
13%
44%
29%
98%
13%
27%
24%
6%
94%
25%
44%
28%
44%
5%
12%
7%
Class of 201521 +
21%
17%
17%
15%
40%
39%
95%
12%
24%
19%
9%
94%
25%
51%
26%
46%
7%
17%
4%
Class of 201621 +
19%
16%
22%
13%
37%
30%
97%
12%
20%
24%
7%
94%
27%
33%
20%
49%
4%
18%
7%
38
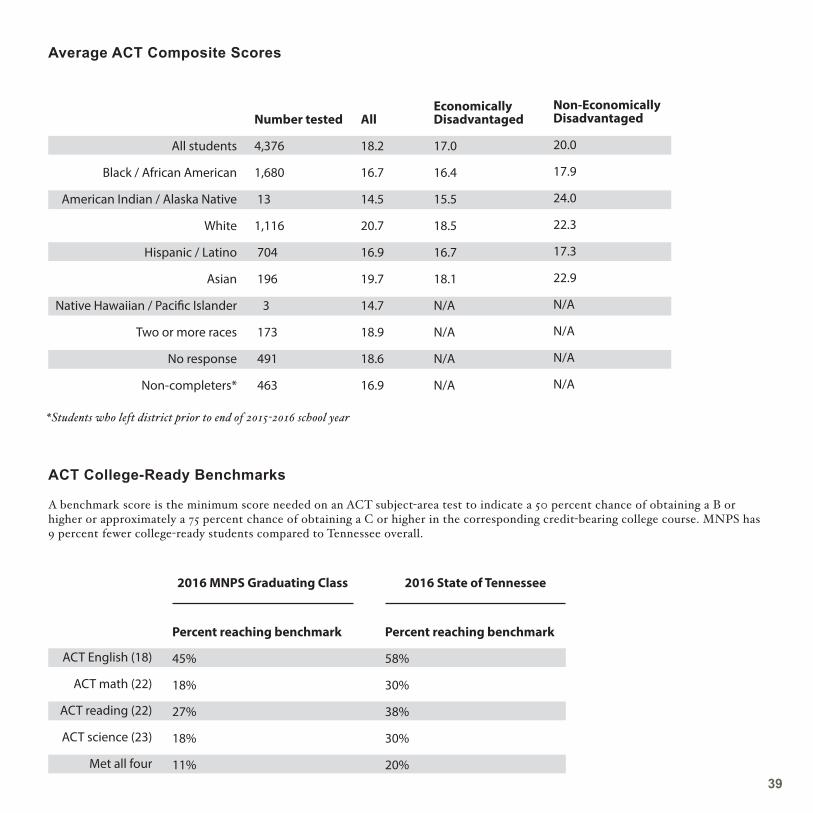
Average ACT Composite Scores
All students
Black / African American
American Indian / Alaska Native
White
Hispanic / Latino
Asian
Native Hawaiian / Pacific Islander
Two or more races
No response
Non-completers*
Number tested
4,376
1,680
13
1,116
704
196
3
173
491
463
All
18.2
16.7
14.5
20.7
16.9
19.7
14.7
18.9
18.6
16.9
Economically Disadvantaged
17.0
16.4
15.5
18.5
16.7
18.1
N/A
N/A
N/A
N/A
Non-Economically Disadvantaged
20.0
17.9
24.0
22.3
17.3
22.9
N/A
N/A
N/A
N/A
*Students who left district prior to end of 2015-2016 school year
ACT College-Ready Benchmarks
A benchmark score is the minimum score needed on an ACT subject-area test to indicate a 50 percent chance of obtaining a B or higher or approximately a 75 percent chance of obtaining a C or higher in the corresponding credit-bearing college course. MNPS has 9 percent fewer college-ready students compared to Tennessee overall.
ACT English (18)
ACT math (22)
ACT reading (22)
ACT science (23)
Met all four
Percent reaching benchmark
45%
18%
27%
18%
11%
2016 MNPS Graduating Class
Percent reaching benchmark
58%
30%
38%
30%
20%
2016 State of Tennessee
39

MNPS Graduation Rates by Percentage by School
Metro Schools had an 81 percent graduation rate for the 2015-2016 school year, down from 81.6 percent the previous year. On the graph below, the green numbers indicate schools that improved graduation rates over the previous year, while red numbers indicate schools that decreased.
Antioch
Cane Ridge
East Nashville
Glencliff
Hillsboro
Hillwood
Hume-Fogg
Hunters Lane
John Overton
Lead Academy
Maplewood
Martin Luther King, Jr.
McGavock
Middle College
Nashville Big Picture
Nashville School of the Arts
Pearl-Cohn
Stratford
Whites Creek
MNPS
2012
69.8
82.1
96.1
71.6
80.3
84.0
99.6
77.8
78.8
N/A
68.4
99.4
77.6
94.1
94.6
94.5
69.3
64.4
71.0
78.4
2013
75.2
79.0
100.0
70.7
84.2
84.4
98.7
77.6
72.7
N/A
74.9
100.0
73.7
95.7
94.7
95.2
73.8
59.9
68.3
76.6
2014
75.2
82.5
100.0
76.3
82.4
82.8
100.0
77.2
81.6
93.5
82.4
100.0
76.9
97.4
89.7
97.9
69.4
75.0
73.4
78.7
2015
77.7
82.8
99.3
80.8
87.1
84.7
99.6
79.2
86.4
94.0
82.3
100.0
78.0
100.0
97.6
98.2
84.8
81.5
73.7
81.6
2016
82.0
80.2
100.0
76.6
89.5
87.8
99.1
80.9
86.9
78.7
76.0
100.0
76.3
98.1
100.0
95.8
78.6
86.2
78.5
81.0
40

MNPS Graduation Rates by Subgroups
0 10 20 30 40 50 60 70 80
% Economically Disadvantaged
% Special Education
% Limited English Proficiency
2013
2014
2015
2016
41

Appendix E: Teacher Effectiveness and Attrition
Based on the most recent MNPS data impacting the 2015-2016 school year, MNPS elementary schools had 34 percent of its classrooms filled with level 4 or 5 teachers. In the early grades (K-2), MNPS had only 30 percent of its highly effective elementary teachers in these classrooms.
MNPS Level of Effectiveness (LOE) reflects highly effective teachers classified by TDOE as teachers who had a Tennessee Value Added Assessment System (TVAAS) level 4 or 5 in the previous school year. TVAAS measure indicates a teacher’s contribution to his/her students’ academic progress and grade-level growth score. Research shows that teachers have greater impact on student achievement than any other in-school factor. Learn more at bit.ly/2fWfK6x.
Level 1 or 2: Teacher’s students made below expected growth in that subject-gradeLevel 3: Teacher’s students made expected growth Level 4 or 5: Teacher’s students exceeded expected growth
All elementary roles
(2014-2015 level of effectiveness)
Teacher K-2 elementary roles
(2014-2015 level of effectiveness)30
25
20
15
10
5
0LOE 1
0.43
LOE 2 LOE 3 LOE 4 LOE 5 No 2014 - 2015 Score*
PYE Exempt
0.70
11.6
0
26.2
1
12.9
5
29.9
8
23.8
1
22.7
1
10.2
8
7.27
24.8
6
23.0
1
2.82 3.
39
*No 2014-2015 Score refers to teachers who did not have enough time in the position to receive a score.
42

MNPS Teacher Attrition
New Hire: SY 2015
New Hire: SY 2016
New Hire: SY 2015
New Hire: SY 2016
Total
1,045
957
1,045
957
Remained to Date
978
909
93.59%
94.98%
Remained End of Year
771
can’t calculate at this time
73.78%
can’t calculate at this time
Attrition to Date
67
48
6.41%
5.02%
Left End of Year
274
can’t calculate at this time
26.22%
can’t calculate at this time
Total numbers
Total percentages
Metro Schools hired 1,045 teachers in 2015-2016, of which 73.78 percent were retained at the end of the school year. Twenty-two percent (274) of those teachers left the district.
43

Appendix F: MNPS Literacy Supports, 2016-2017
Schools with Reading Recovery
School
Alex Green
Amqui
Bellshire
Buena Vista
Caldwell
Cane Ridge
Churchwell
Cockrill
Cole
Cumberland
Dan Mills
Gateway
Glencliff
Glengarry
Glenn
Glenview
Hattie Cotton
Haywood
J.E. Moss
Maxwell
Napier
Neely’s Bend
Cluster
Whites Creek
Hunters Lane
Hunters Lane
Pearl-Cohn
Stratford
Cane Ridge
Pearl-Cohn
Pearl-Cohn
Cane Ridge
Whites Creek
Stratford
Hunters Lane
Glencliff
Glencliff
Maplewood
Glencliff
Maplewood
Overton
Antioch
Cane Ridge
McGavock
Hunters Lane
Cluster
Overton
Glencliff
Pearl-Cohn
Stratford
Hunters Lane
Maplewood
Overton
Antioch
Stratford
Glencliff
School
Norman Binkley
Paragon Mills
Park
Rosebank
Stratton
Tom Joy
Tusculum
Una
Warner
Whitsitt
Schools listed have access to a Reading Recovery teacher, coach and teacher leader focused on literacy.
Reading Recovery teachers serve the lowest 10 percent of first-graders with a research-based model and serve other struggling students in small group instruction.
A reading/literacy coach is a reading specialist who focuses on providing professional development for teachers.
MNPS uses the Literacy Partnership model for this literacy layer of work. These individuals attend, participate and deliver the work of the Literacy Partnership, as well as other duties in the school pertaining to literacy and assessment.
44
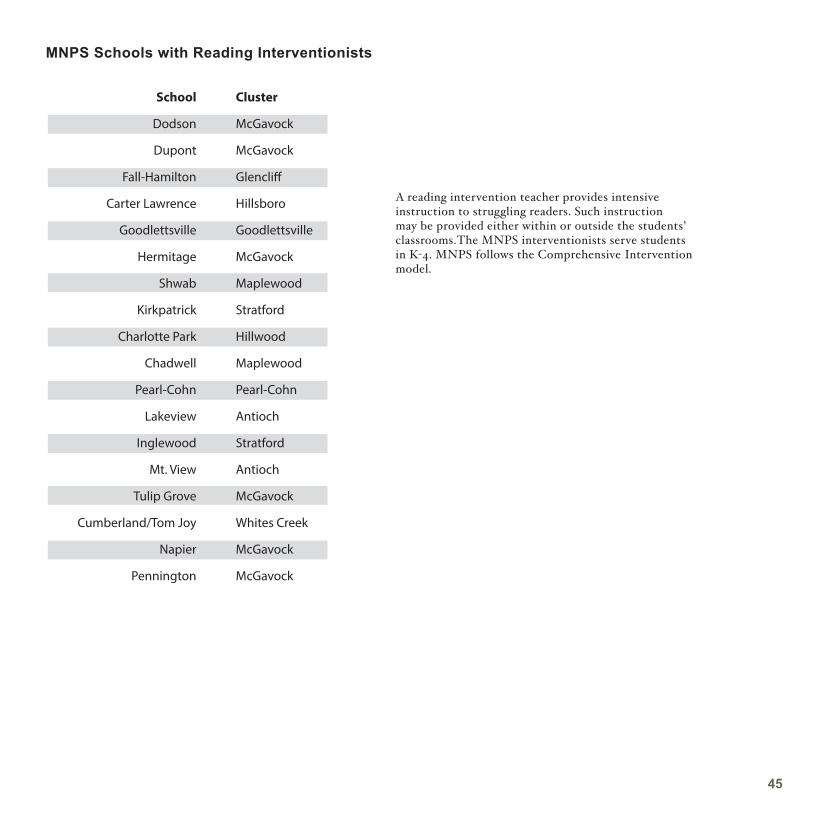
MNPS Schools with Reading Interventionists
School
Dodson
Dupont
Fall-Hamilton
Carter Lawrence
Goodlettsville
Hermitage
Shwab
Kirkpatrick
Charlotte Park
Chadwell
Pearl-Cohn
Lakeview
Inglewood
Mt. View
Tulip Grove
Cumberland/Tom Joy
Napier
Pennington
Cluster
McGavock
McGavock
Glencliff
Hillsboro
Goodlettsville
McGavock
Maplewood
Stratford
Hillwood
Maplewood
Pearl-Cohn
Antioch
Stratford
Antioch
McGavock
Whites Creek
McGavock
McGavock
A reading intervention teacher provides intensive instruction to struggling readers. Such instruction may be provided either within or outside the students’ classrooms.The MNPS interventionists serve students in K-4. MNPS follows the Comprehensive Intervention model.
45

Appendix G: MNPS Community Achieves
Principles of Community Achieves
School-level Coordination
Community School as Continuous Quality Improvement Effort
Extended Learning Opportunities
Results-Focused Partnerships
Community Achieves (CA) is a district-led student support services initiative that supports the development of full-service community schools through infrastructure consisting of Family Resource Center managers working with external school partners and interdepartmentally with other Metro Schools departments to provide wraparound-services and technical assistance. CA is currently in 23 of 162 schools (six elementary, 11 middle and six high schools).
External Partnerships & Programs
46
WraparoundServices
Appendix H: Experts Interviewed
The Education Report Card Committee is grateful to the students, teachers, administrators, elected officials and community representatives who made time to talk with us. The following individuals shared their candid opinions and insights, providing the information necessary for us to complete this report. We offer our sincere thanks and appreciation.
Metropolitan Government of Nashville and Davidson CountyThe Honorable Megan Barry, mayorMelody (Mel) Fowler-Green, executive director, Metro Human Relations Commission
Metropolitan Board of Public EducationThe Honorable Anna Shepherd (chair), District 4
Metro Schools Central Administration and StaffMoreno Carrasco, executive officer, L5 Innovation SchoolsDr. Paul Changas, executive director of research, assessment and evaluationDr. Monique Felder, chief academic officerDr. Maritza Gonzalez, executive officer, Equity and Diversity Chris Henson, chief operating officerBrian Hull, director of resource strategyDr. Shawn Joseph, director of schoolsDr. Tammy Lipsey, director of literacyAlison McArthur, Community Achieves coordinator Dr. Sito Narcisse, chief of schoolsDennis Queen, executive officer, Charter SchoolsDr. Terry Shrader, executive officer, Leadership DevelopmentKevin Stacey, executive director, English LearnersDeborah Story, executive officer, Human ResourcesDr. David Williams, interim executive director, Curriculum and Instruction
Principals and School StaffZoe Beckman, dean of operations, KIPP:Kirkpatrick Annie Driskell, literacy coach, Dan Mills ElementaryLynn Edmonson, instructional designer, John Early Museum Magnet Middle PrepKristen Fisk, data coach, Dan Mills ElementaryAmy Galloway, school leader, KIPP:Kirkpatrick Brenda Gass, teacher, John Early Museum Magnet Middle PrepMiriam Harrington, executive principal, Jere Baxter Middle SchoolJulia Hoge, school counselor, Dan Mills ElementaryMarcus Kinnon, instructional specialist, John Early Museum Magnet Middle PrepKristen Lockert, teacher, John Early Museum Magnet Middle PrepTracy McPherson, executive principal, Inglewood Elementary SchoolRise Pope, principal, John Early Museum Magnet Middle Prep Whitney Slovick, Community Achieves site managerDr. Sonia Stewart, principal, Pearl-Cohn Entertainment Magnet High SchoolRebecca Verner, instructional designer, John Early Museum Magnet Middle PrepBobby Yates, principal, Dan Mills Elementary
47
State of TennesseePaige Atchley, director, Read to be Ready, Tennessee Department of EducationMary Batiwalla, executive director, Office of Accountability, Tennessee Department of EducationEve Carney, executive director, Consolidated Planning and Monitoring, Tennessee Department of EducationThe Honorable Steven Dickerson, 20th District State SenatorThe Honorable Ferrell Haile, 18th District State Senator Heather Justice, executive director, Career and Technical Education, Tennessee Department of EducationThe Honorable Joe Pitts, 67th District State Representative Dr. Nakia Towns, assistant commissioner, Division of Data and Research, Tennessee Department of Education
Community and Advocacy GroupsElyse Adler, assistant director for community engagement and education, Nashville Public Library Liz Attack, program manager, Bringing Books to Life, Nashville Public Library Maya Bugg, chief executive officer, Tennessee Charter School CenterMary Cypress, chief of staff, SCOREDr. David K. Dickinson, professor and Margaret Cowan chair, department of teaching and learning; associate dean for research and strategic planning, Peabody College, Vanderbilt UniversityRandy Dowell, founder/CEO, KIPP:NashvilleStarr Herrman, director, Nashville Ford NGL HubShannon Hunt, chief executive officer, Nashville Public Education Foundation Donna Mason, state lead Tennessee, client relations, ACTJeremy Meredith, policy and research analyst, SCOREKent Oliver, director, Nashville Public LibraryMelissa Spradlin, executive director, Book’em Joe T. Woods, Tennessee state liaison, Battelle for Kids Dr. B.J. Worthington, director of schools, Clarksville-Montgomery County School System
Schools Visited by Committee MembersSchool visits are an integral part of the work of this committee. We understand the time and effort required when hosting a group of our size, so we are especially appreciative of these schools and their leaders for affording us the opportunity to talk with principals and school administrators, teachers, students and parents. We also thank the parents of John Early Museum Magnet Middle Prep for their time and insights.
• Dan Mills Elementary • John Early Museum Magnet Middle Prep• KIPP:Kirkpatrick
MNPS Liaison to the CommitteeHank Clay, director of government relations
48
Appendix I: Glossary
AON (Academies of Nashville) - MNPS high school transformation strategy initiated in 2006, in which the district’s 12 zoned high schools have been reorganized into freshman academies for ninth-grade students and career and thematic academies for grades 10-12. www.myacademyblog.com
Achievement School District - The Achievement School District was created to improve the bottom 5 percent of schools in Tennessee to become the top 25 percent in the state.
ACT - A standardized test, typically taken in 11th grade, to measure high school achievement and college readiness. www.act.org
APF (Academic Performance Framework) - Standardized accountability metrics developed by MNPS to complement increased school-level autonomy and provide a transparent set of indicators to assess school performance. The APF is used to inform decisions regarding rewards, supports and resource allocation for schools, as well as evaluations of school leaders’ performance.
BEP (Basic Education Program) - The funding formula through which state education dollars are generated and distributed to Tennessee school systems.
Charter School - A public school governed and operated independently of the local school board, often with a curriculum and educational philosophy different from other schools in the district. Charter schools have a contract, or charter, with their local school board to operate within that district.
Digital Literacy Assessment 5 - An assessment that measures how students are using technology for learning. It helps identify whether students have appropriate access to instructional technology at school and are active in learning.
Education 2018 - MNPS’ 2013-2018 strategic plan, approved by the MNPS Board of Education on Sept. 10, 2013.
EL (English Learners) - Students who have been assessed and identified as needing EL instruction and are actively receiving EL services.
EOCs (End-of-Course Exams) - are given in specific high school subjects that are used for accountability purposes and value-added analysis.
ESSA (Every Student Succeeds Act) - This bipartisan measure was signed into law on December 10, 2015. It reauthorizes the 50-year-old Elementary and Secondary Education Act (ESEA), the nation’s national education law and longstanding commitment to equal opportunity for all students.
Formative Assessment - An assessment to monitor student learning and provide ongoing feedback to instructors. It helps teachers and coaches recognize and address areas where students are struggling.
Lead Principal Network - An MNPS initiative in which certain principals receive more autonomy and decision-making power in return for supervising and sharing effective practices with small networks of schools.
LEADS (Longitudinal Education and Analysis Decision Support) - This is the formal name for MNPS’ data warehouse.
LEP (Limited English Proficient) - refers to students who are actively receiving EL services, as well as students who are fewer than two years removed from exiting the EL program.
MNPS (Metropolitan Nashville Public Schools) -www.mnps.org
MNPS Benchmark Assessments - These assessments for students grades 2 through 11 are aligned to state academic standards in English/language arts and math. They are administered three times in an academic year to measure student progress in mastering state academic standards.
NAEP (National Assessment of Educational Progress) -Also known as the “nation’s report card,” this assessment is given to a sample of students across the country, allowing for comparisons across states in fourth- and eighth-grade reading and math.
49

NCLB (No Child Left Behind) - The 2001 reauthorization of the federal Elementary and Secondary Education Act, meant to hold primary and secondary schools measurably accountable to higher standards. Requires 100 percent of students within a school or school system to make adequate yearly progress and reach the same set of state standards in math and reading by 2014. Tennessee has been granted a waiver from NCLB and is now measured by a separate accountability system.
Priority Schools - Under Tennessee’s accountability system, priority schools are schools in the bottom 5 percent of overall performance across tested grades and subjects. Schools identified as priority schools retain the designation and varied support for three years.
Reading Recovery - A school-based, short-term intervention designed for children aged 5 or 6, who are the lowest achieving in literacy after their first year of school.
Reward Schools - Under Tennessee’s accountability system, reward schools are schools in the top 5 percent for performance, as measured by overall student achievement levels, and the top 5 percent for year-over-year progress, as measured by gains in student achievement - a total of 10 percent of schools in all. This designation is determined annually.
RTI² - Tennessee implemented RTI² in elementary schools in the 2014-2015 school year and middle schools in 2015-2016. The RTI² framework is a multi-tiered delivery system designed to address individual student needs. It relies on the premise of high-quality instruction and interventions tailored to student need where core instructional and intervention decisions are guided by student outcome data.
Title I Federal Funds - The U.S. Department of Education provides supplemental funding to local school districts through states to meet the needs of at-risk and low-income students.
TVAAS (Tennessee Value-Added Assessment System) -A statistical analysis performed by Dr. William Sanders at SAS Institute, Inc., estimating the academic progress or growth of individual students. TVAAS summary data are reported at the school and school-system levels.
Text-Level Assessments - These assessments for students grade K through 4 measure reading development. This assessment system is a series of texts that can be used to identify a student’s current reading level and progress along a gradient of text levels over time.
50

Acknowledgements
The purpose of the Nashville Area Chamber of Commerce is to facilitate community leadership to create economic prosperity. As we work toward our No. 1 priority of improving public education, we rely greatly on our dedicated volunteers, including the business and community leaders who serve on the Report Card Committee. Meeting nearly every Friday morning from late July through December and attending several additional education-related field trips, these members gave their time, energy and talents toward the successful completion of this report.
Those who serve for three consecutive years rotate off the committee so others have a chance to become involved. We offer a special thank you and fond farewell to our third-year members: Anita Ryan, Becky Sharpe, The Honorable Freddie O’Connell, James “Jim” Hartman, Jennifer Johnston, Co-Chair Katherine McElroy, and Laura Delgado.
We also thank the many presenters who took time to share their expertise and viewpoints with us. Their candor and insights allow us to more accurately report the successes and challenges of our education system and to propose creative solutions for improvement.
The production of this report would be impossible without the full support and cooperation of Metropolitan Nashville Public Schools and MNPS committee liaison, Hank Clay. These people, all from MNPS, are to be commended for their willingness to answer our multiple rounds of follow-up questions: Brian Hull, Chris Henson, David Williams, Paul Changas, Tina Stenson and Tammy Lipsey. Special thanks goes to the faculty and students at Dan Mills Elementary, KIPP: Kirkpatrick and John Early Museum Magnet Middle Prep. Their willingness to host us during special visits provided committee members with a firsthand look at the hard work taking place every day at the school level.
The committee also thanks Nashville Rescue Mission (downtown) for hosting our weekly meetings. Melanie Whitaker, Garrett Causey, James Deer and, especially, Deena Turner are to be commended for their unparalleled hospitality. A special thanks to Laura Delgado for serving as the social chair of the Report Card committee and being the official note-taker during our weekly meetings. Her hard work is appreciated!
Finally, several Chamber staff provide support for the committee’s work. We appreciate Marc Hill, chief policy officer, whose knowledge of Nashville’s education landscape provides important context and guidance. We also appreciate Whitney Weeks, senior vice president of policy, for her support in transitioning new staff to lead the Report Card this year. Candy Johnson, director of policy, is commended for her approach to thoughtfully facilitating the weekly Report Card meetings. She, in turn, appreciates the Johnson family (Bryan, Malia and Bryan Jr.) for the unconditional support they provided mid-October through December 19, and Cara Hatcher, Whitney Weeks, Rita McDonald and Verlinda Darden for being a listening ear when needed. This report wouldn’t be the incredible resource it is if Courtney Cotton, Landon Matney and Lindsay Chambers hadn’t ensured this document is visually stunning as well as grammatically correct.
The Education Report Card is the collective work of many. We hope it spurs ongoing interest and dialogue around the progress of our public schools, while serving as an important resource for education stakeholders and the broader community.
51

nashvillechamber.com