static-content.springer.com10.1007... · web viewsupporting information meaningful comparison of...
TRANSCRIPT
Supporting Information
Meaningful comparison of photocatalytic properties of {001} and
{101} faceted anatase TiO2 nanocrystals
Yang Lu1, Yipeng Zang1,2, Haimin Zhang1*, Yunxia Zhang1, Guozhong Wang1, Huijun Zhao1,3*
1 Key Laboratory of Materials Physics, Centre for Environmental and Energy Nanomaterials, Anhui Key Laboratory of Nanomaterials and Nanotechnology,
Institute of Solid State Physics, Chinese Academy of Sciences, Hefei 230031, China. Email: [email protected]; Tel: +86 551 65591973
2 University of Science and Technology of China, Hefei 230026, China
3 Centre for Clean Environment and Energy, Griffith University, Gold Coast Campus, QLD 4222, Australia. Email: [email protected]; Tel: +61 7 55528261
Table S1 Elemental composition of A101 and A001 samples obtained by EDS.
A101 A001
Element wt.% atom.% Element wt.% atom.%
O 36.01 64.50 O 36.26 67.48
Si 0.44 0.45 Si 1.17 1.24
Ti 54.95 32.90 Ti 41.50 25.82
In 8.60 2.15 In 21.07 5.46
Total: 100.00 100.00 Total: 100.00 100.00
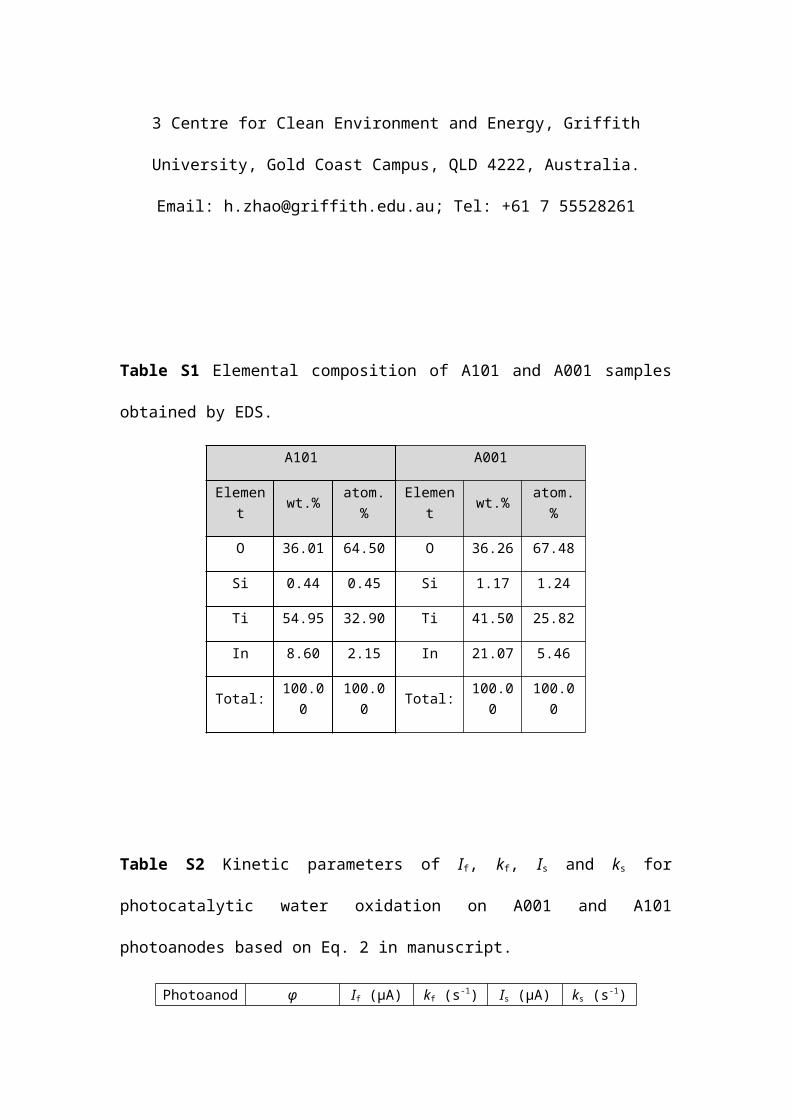
Table S2 Kinetic parameters of If, kf, Is and ks for photocatalytic water oxidation on A001 and A101 photoanodes based on Eq. 2 in manuscript.
Photoanode φ (mW/cm2) If (μA) kf (s-1) Is (μA) ks (s-1)
A001
11.5 36.5003 0.96709 20.728 0.074594
9.1 28.6154 0.861252 17.3829 0.06716
6.7 20.8081 0.71734 13.2769 0.057944
4.9 11.832 0.601634 8.88537 0.04473
3.1 9.50991 0.41469 6.89833 0.034079
1.5 3.88789 0.348832 3.52325 0.020229
A101
11.5 17.1849 0.642525 9.08638 0.040786
9.1 11.0422 0.502882 8.3997 0.039786
6.7 4.1877 0.362949 5.53199 0.027117
4.5 1.59561 0.321617 3.36326 0.024208
2.8 0.92965 0.26768 1.70807 0.018047
1.3 0.799547 0.137197 0.683251 0.015571

Table S3 Kinetic parameters of If, kf, Is and ks for photocatalytic phenol oxidation on A001 and A101 photoanodes based on Eq. 2 in manuscript.
Photoanode φ (mW/cm2) If (μA) kf (s-1) Is (μA) ks (s-1)
A001
11.1 81.64702 1.75963 9.979112 0.04844
9.1 51.89062 1.47417 7.298116 0.04584
7.1 34.86792 1.20234 4.139319 0.04131
5.1 16.85791 0.79518 2.387819 0.03180
3.3 11.55898 0.74096 1.685055 0.02360
1.5 4.096777 0.46554 1.069007 0.01637
A101
11.5 26.77349 1.32871 2.490394 0.02693
9.1 19.30692 1.04758 1.654419 0.02259
6.7 12.11518 0.77761 1.151024 0.01794
4.5 6.465212 0.54467 0.877638 0.01757
2.8 3.089959 0.36524 0.669341 0.01499
1.3 1.004861 0.22430 0.307425 0.00955
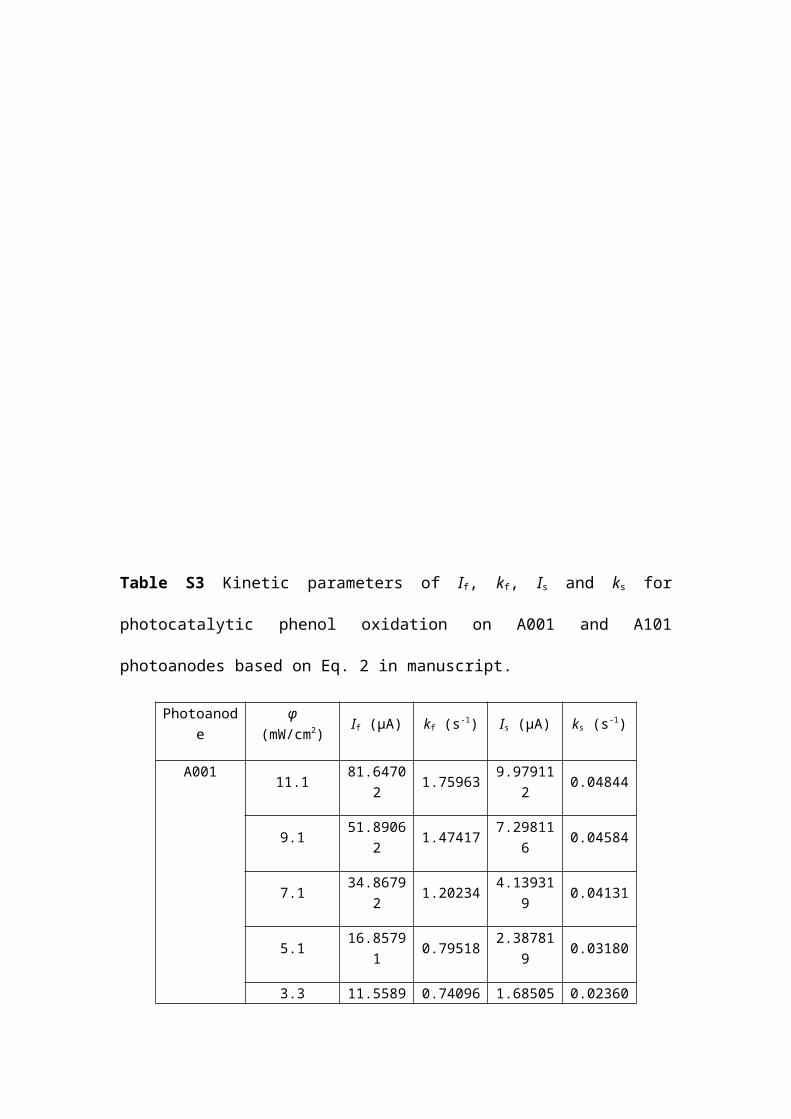
Fig. S1 Typical ex situ transition photocurrent-time profile of a TiO2 electrode in 0.10 mol/L NaNO3 solution after pre-adsorbed in 0.10 mol/L NaNO3 solution containing 10 μmol/L phthalic acid (KHP) for 30 min (red line) and in 0.10 mol/L NaNO3
solution without KHP for 10 min (black line).

Fig. S2 a-c EDS and elemental mapping of A001 photoanode. d-f EDS and elemental mapping of A101 photoanode. Insets are corresponding SEM images.
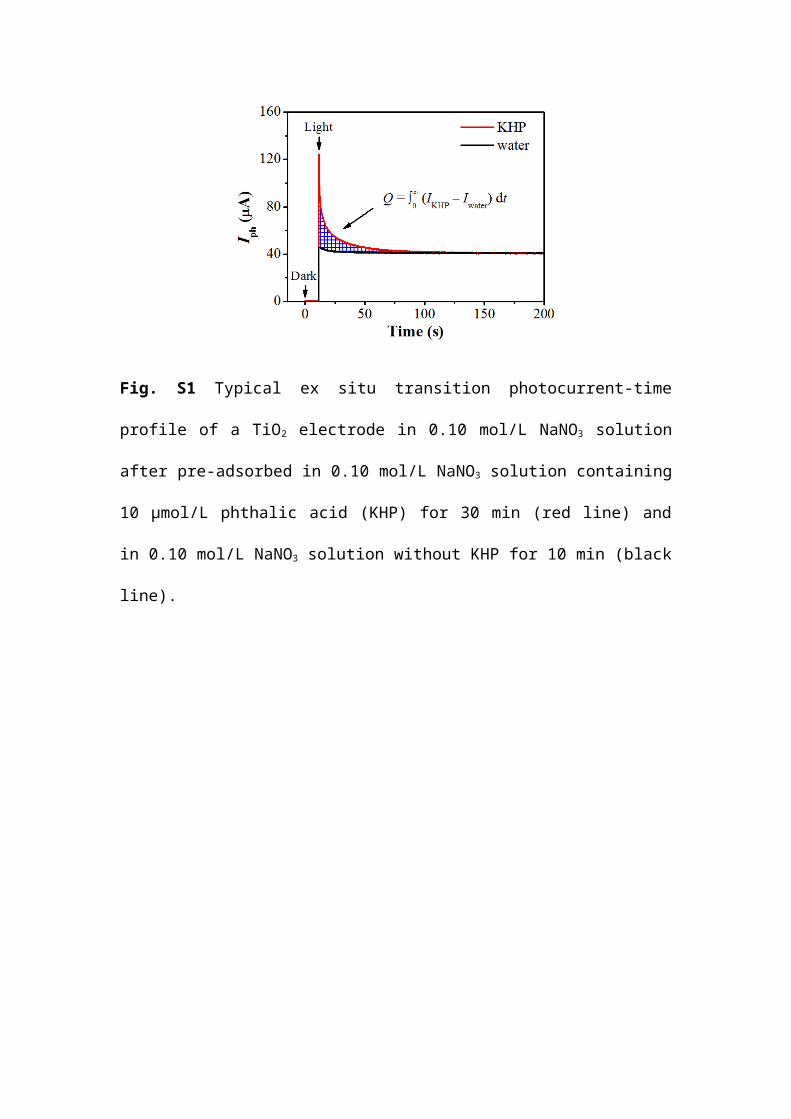
Fig. S3 a Survey XPS spectra of A001 and A101. b-d High-resolution XPS spectra of Ti 2p, O 1s, and F 1s of A001 and A101.

Fig. S4 a and b Photocurrent decay curves (dense-line) and fitting data (○) of A001 and A101 photoanodes from 0.10 mol/L NaNO3 aqueous solution containing 100 μmol/L butyl alcohol under different light intensities (φ) and an applied potential bias of +0.40 V vs. Ag/AgCl. c Ist-φ relationships derived from a and b. d Ist/Q-φ relationships derived from a and b. e Q-φ relationships derived from a and b. f k-φ relationships derived from a and b.

Fig. S5 a and b Photocurrent decay curves (dense-line) and fitting data (○) of A001 and A101 photoanodes from 0.10 mol/L NaNO3 aqueous solution containing 100 μmol/L benzyl alcohol under different light intensities (φ) and an applied potential bias of +0.40 V vs. Ag/AgCl. c Ist-φ relationships derived from a and b. d Ist/Q-φ relationships derived from a and b. e Q-φ relationships derived from a and b. f k-φ relationships derived from a and b.
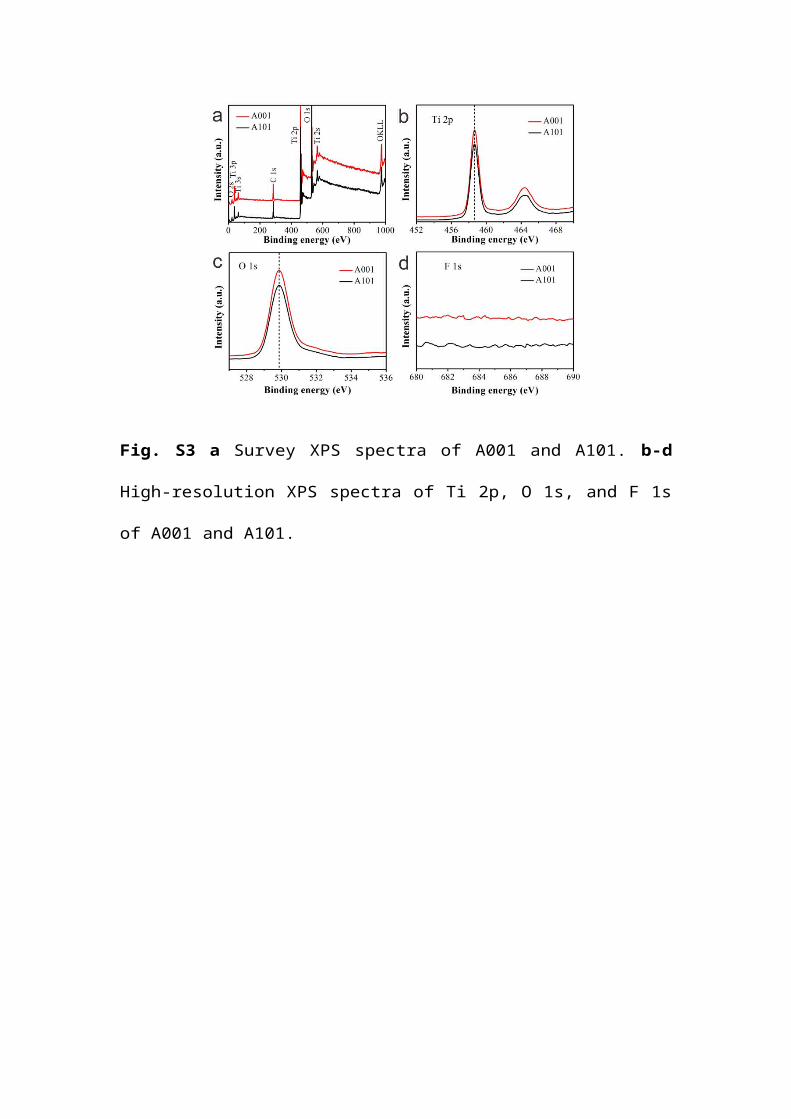
Fig. S6 a and b Photocurrent decay curves (dense-line) and fitting data (○) of A001 and A101 photoanodes from 0.10 mol/L NaNO3 aqueous solution containing 100 μmol/L glutaric dialdehyde under different light intensities (φ) and an applied potential bias of +0.40 V vs. Ag/AgCl. c Ist-φ relationships derived from a and b. d Ist/Q-φ relationships derived from a and b. e Q-φ relationships derived from a and b. f k-φ relationships derived from a and b.
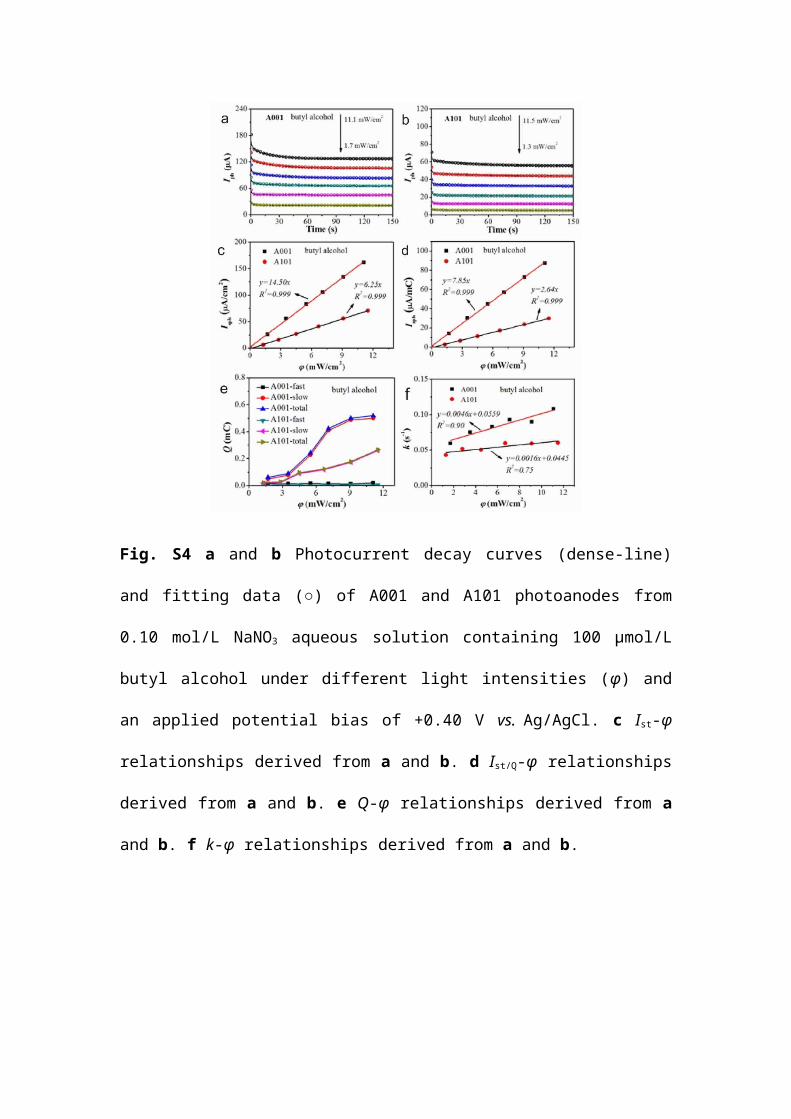
Fig. S7 a and b Photocurrent decay curves (dense-line) and fitting data (○) of A001 and A101 photoanodes from 0.10 mol/L NaNO3 aqueous solution containing 100 μmol/L benzaldehyde under different light intensities (φ) and an applied potential bias of +0.40 V vs. Ag/AgCl. c Ist-φ relationships derived from a and b. d Ist/Q-φ relationships derived from a and b. e Q-φ relationships derived from a and b. f k-φ relationships derived from a and b.
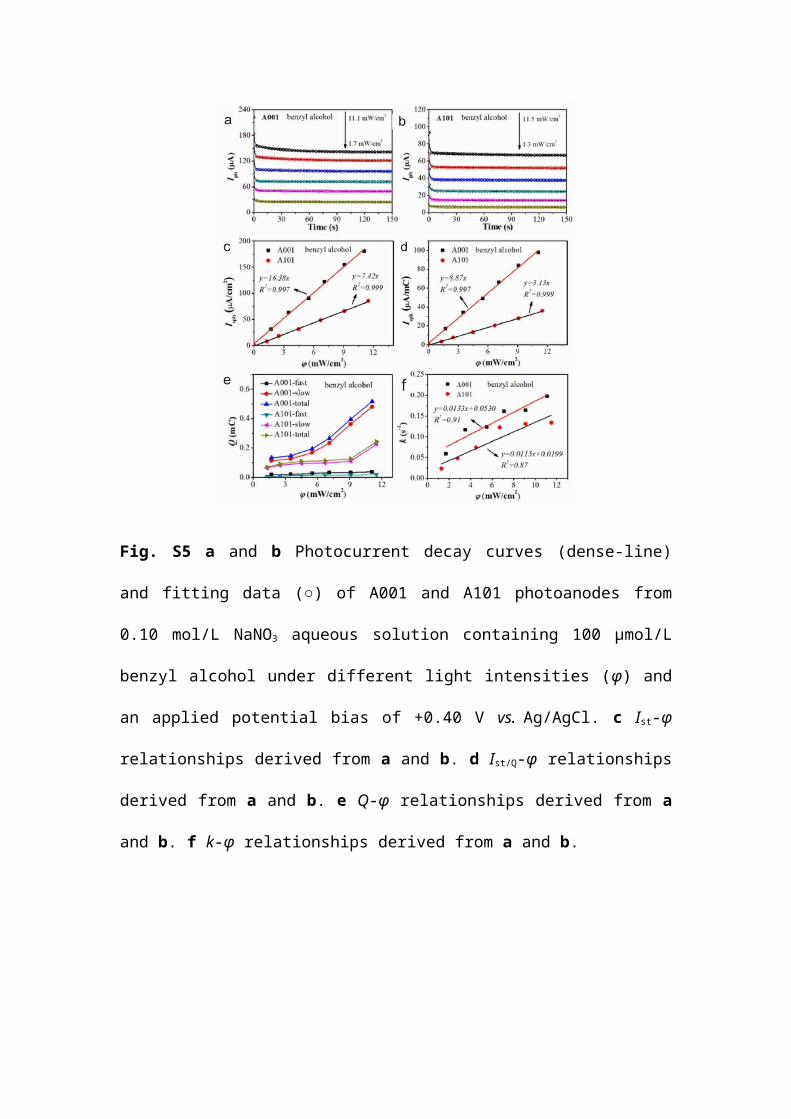
Fig. S8 a and b Photocurrent decay curves (dense-line) and fitting data (○) of A001 and A101 photoanodes from 0.10 mol/L NaNO3 aqueous solution containing 100 μmol/L glutaric acid under different light intensities (φ) and an applied potential bias of +0.40 V vs. Ag/AgCl. c Ist-φ relationships derived from a and b. d Ist/Q-φ relationships derived from a and b. e Q-φ relationships derived from a and b. f k-φ relationships derived from a and b.

Fig. S9 a and b Photocurrent decay curves (dense-line) and fitting data (○) of A001 and A101 photoanodes from 0.10 mol/L NaNO3 aqueous solution containing 100 μmol/L benzoic acid under different light intensities (φ) and an applied potential bias of +0.40 V vs. Ag/AgCl. c Ist-φ relationships derived from a and b. d Ist/Q-φ relationships derived from a and b. e Q-φ relationships derived from a and b. f k-φ relationships derived from a and b.