staticsourcecodeanalysisin patternrecognition ...doktori.bibl.u-szeged.hu/4095/2/booklet_en.pdf ·...
TRANSCRIPT

Static Source Code Analysis inPattern Recognition,
Performance Optimization andSoftware Maintainability
Dénes BánDepartment of Software Engineering
University of Szeged
Szeged, 2017
Supervisor:
Dr. Rudolf Ferenc
Summary of the Ph.D. Thesis
University of SzegedPh.D. School in Computer Science


IntroductionSoftware rules the world.
As true as this statement already was decades ago, it rings even truer now. When the pro-portion of the U.S. population using any kind of embedded system – including phones, cameras,watches, entertainment devices, etc. – went from its 2011 estimate of 65% to 95% by 2017 purelythrough phone ownership. When we are at a point where we can even talk about “smart cities”,let alone build them. When – according to Cisco – connected devices have been outnumberingthe population of Earth by a ratio of at least 1.5 since 2015.
This is just exacerbated by the host of embedded systems most people never even consider. Aneveryday routine contains household appliances like microwave ovens and refrigerators, heatingor cooling our spaces, starting or stopping our vehicles; the list goes on. A modern life in this erainvolves countless hidden, invisible processors, along with the visible ones we have all got so usedto. And we have not even mentioned critical applications like flight guidance, keeping patientsalive and well in hospitals, or operating nuclear power plants.
All of those need software to run. And all that software needs to be written by someone. Thereis no question about either the growth of the software industry or the significant acceleration ofsaid growth. The only question is whether or not we can actually keep up.
Having established the importance of software development, we can focus on arguably thetwo most important factors for its success: maintainability and performance. Software systemsspend the majority of their lifetime in the maintenance phase, which, on average, can account for60% of the total costs. Of course, maintaining a codebase does not only mean finding and fixingprogram faults, as enhancements and constantly changing requirements are far more common.This means that for an efficient maintenance life cycle, a software product has to be quicklyanalysable, modifiable and testable – among other characteristics.
Just as critical is the issue of software performance and energy efficiency. A software productthat fails to meet its performance objectives can be costly by causing schedule delays, costoverruns, lost productivity, damaged customer relations, missed market windows, lost revenues,and a host of other difficulties. Not to mention that the great amounts of energy consumed bylarge-scale computing and network systems, such as data centers and supercomputers, have beena major source of concern in a society increasingly reliant on information technology.
There are, however, many obstacles in the way of clean, maintainable and high-performancesoftware. Time constraints of the ever-expanding market often make it appear infeasible to con-sider design best practices when these considerations would push back release times. Similarly,haste and an unwillingness to put in extra effort in advance is what seems to lead to antipatternsand code duplications, harming quality in the long run. Also, inadequate accessibility, tools, anddeveloper support could significantly hinder the full utilization of today’s performance optimiza-tion opportunities, such as specialized hardware platforms (e.g., GPGPU, DSP, or FPGA) andtheir corresponding compilers.
Our work aims to assist in both of these areas. Our goals are to:
I. Draw attention to the importance of the maintenance phase, and illustrate itsassets and risks by highlighting the objective, tangible effect design patternsand antipatterns can have on software maintainability; and
II. Help developers more easily utilize modern accelerator hardware and increaseperformance by creating an easily usable and extendable methodology for build-ing static platform selection models.
1
I Empirical validation of the impact of source code pat-terns on software maintainability
The contributions of this thesis point are related to software maintainability and its connectionto static source code patterns.
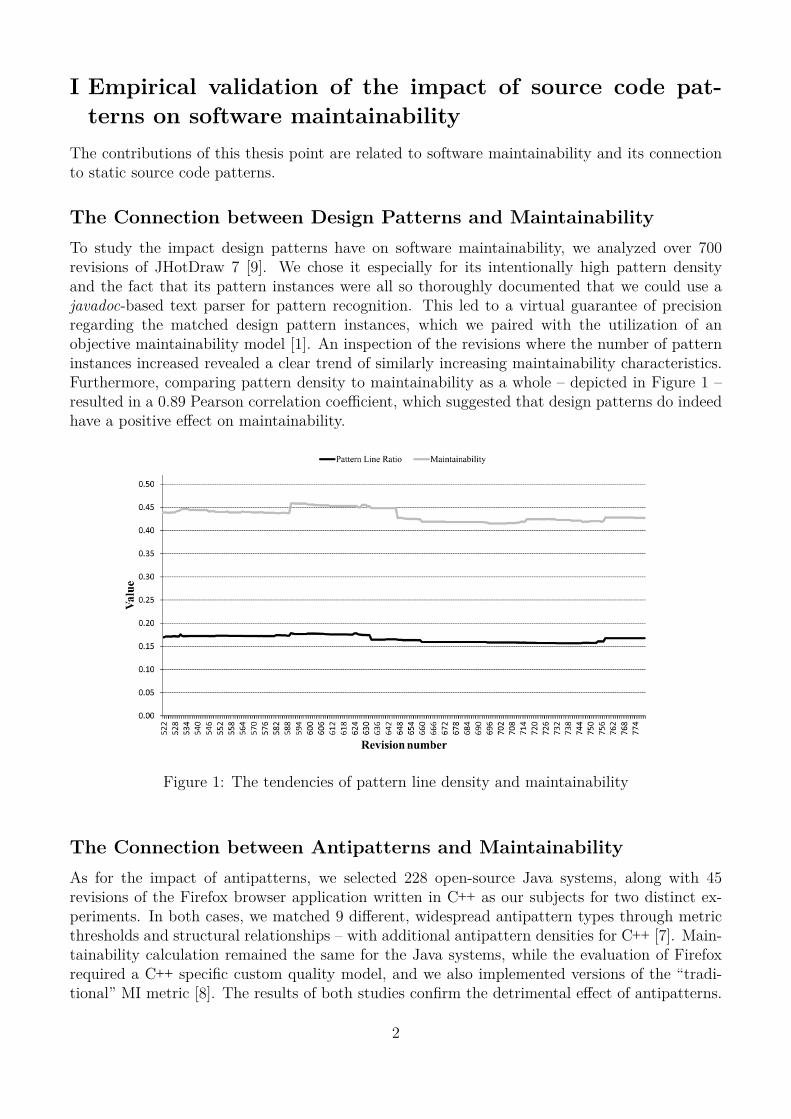
The Connection between Design Patterns and MaintainabilityTo study the impact design patterns have on software maintainability, we analyzed over 700revisions of JHotDraw 7 [9]. We chose it especially for its intentionally high pattern densityand the fact that its pattern instances were all so thoroughly documented that we could use ajavadoc-based text parser for pattern recognition. This led to a virtual guarantee of precisionregarding the matched design pattern instances, which we paired with the utilization of anobjective maintainability model [1]. An inspection of the revisions where the number of patterninstances increased revealed a clear trend of similarly increasing maintainability characteristics.Furthermore, comparing pattern density to maintainability as a whole – depicted in Figure 1 –resulted in a 0.89 Pearson correlation coefficient, which suggested that design patterns do indeedhave a positive effect on maintainability.
Figure 1: The tendencies of pattern line density and maintainability
The Connection between Antipatterns and MaintainabilityAs for the impact of antipatterns, we selected 228 open-source Java systems, along with 45revisions of the Firefox browser application written in C++ as our subjects for two distinct ex-periments. In both cases, we matched 9 different, widespread antipattern types through metricthresholds and structural relationships – with additional antipattern densities for C++ [7]. Main-tainability calculation remained the same for the Java systems, while the evaluation of Firefoxrequired a C++ specific custom quality model, and we also implemented versions of the “tradi-tional” MI metric [8]. The results of both studies confirm the detrimental effect of antipatterns.
2

The trend line of the maintainability value for the Java systems – sorted in the descending orderof the antipatterns they contain – shows clear improvement, as illustrated in Figure 2. Theoverall Spearman correlation coefficient between antipatterns and maintainability for Java was-0.62.
Figure 2: The trend of maintainability in the case of decreasing antipatterns (Java)
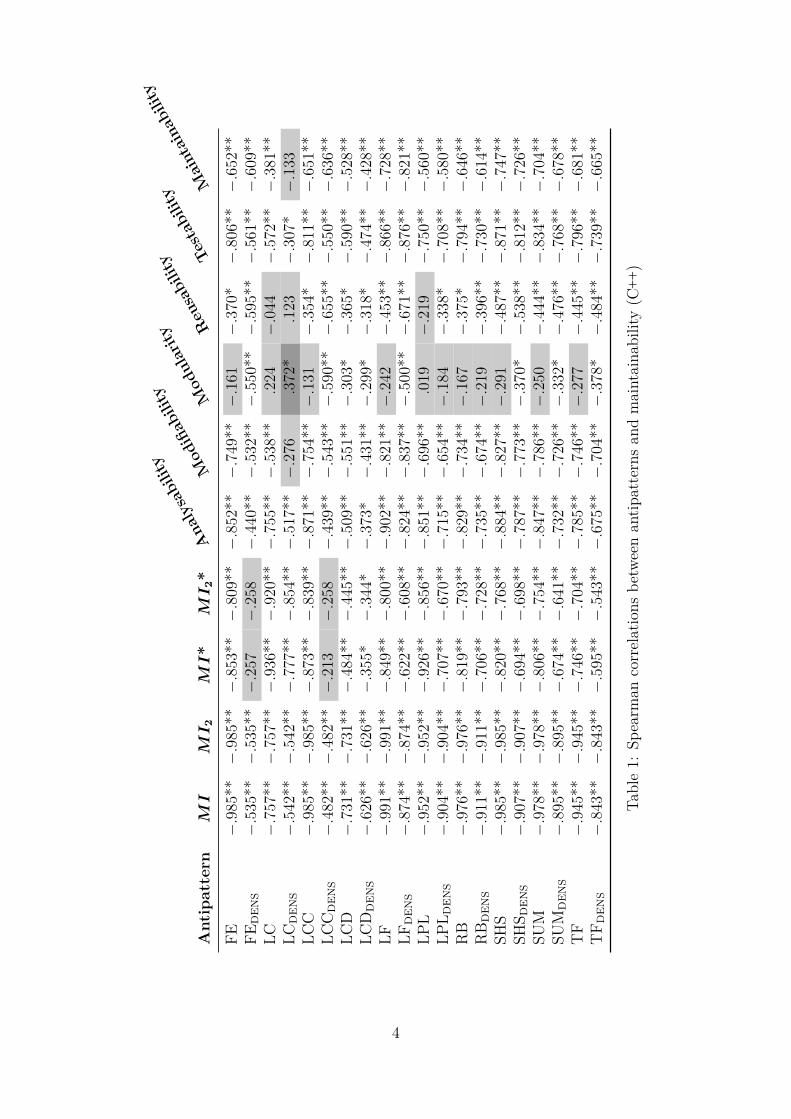
On the other hand, the C++ analysis provided values for both absolute antipattern instancesand antipattern densities. We highlight the correlations between the overall antipatten sum anddensity and our final Maintainability measure as these represent most closely the total effects ofantipatterns on maintainability. The corresponding values are -0.658 and -0.692 for Pearson, and-0.704 and -0.678 for Spearman correlation, respectively. The full set of Spearman correlationsbetween the various antipattern/maintainability measure pairs is shown in Table 1.
Another interesting result is that using antipattern instances as predictors for maintainabilityestimation produced models with precisions ranging from 0.76 to 0.93.
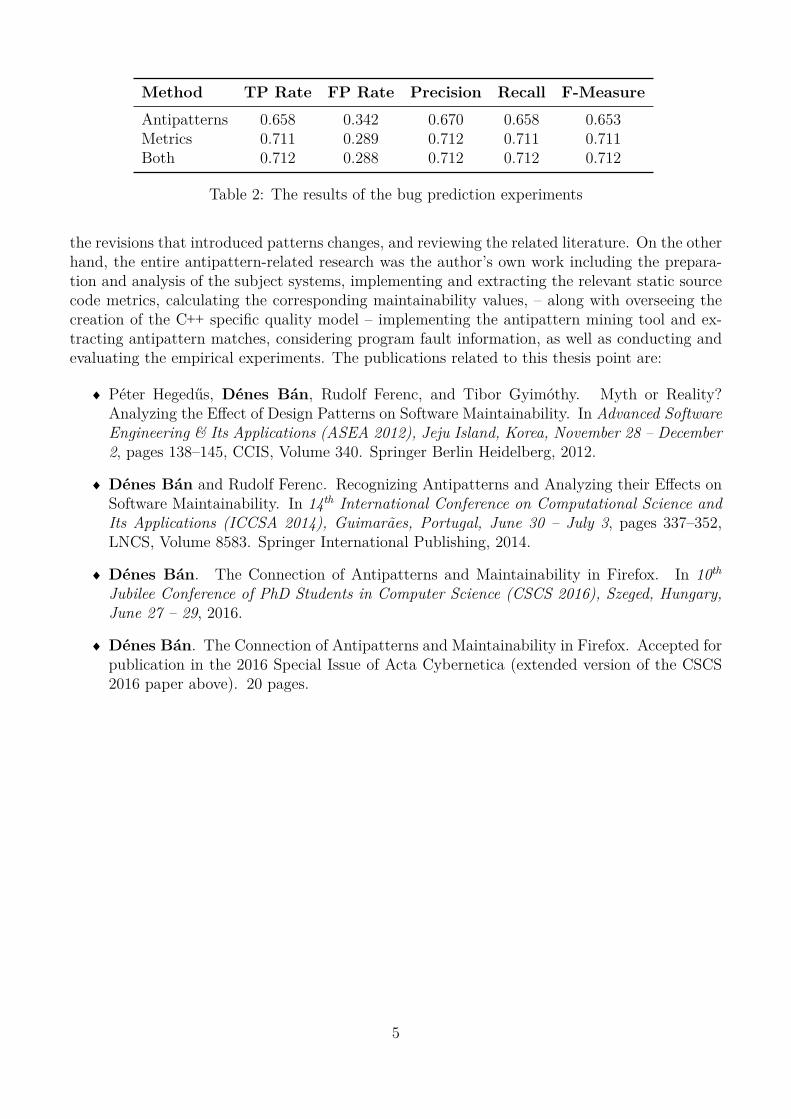
The Connection between Antipatterns and Program FaultsIn addition, our Java experiment seeks to connect the presence of antipatterns to program faults(or bugs) through the PROMISE open bug database [12]. The study of the 34 systems (fromamong the 228 Java systems mentioned above) that had corresponding bug information revealeda statistically significant Spearman correlation of 0.55 between antipattern instances and bugs.Moreover, antipatterns yielded a precision of 67% when predicting bugs, being notably abovethe 50% baseline, and only slightly below the 71.2% of more than five times as many raw staticsource code metrics, – shown in Table 2 – thereby demonstrating their applicability.
The Author’s ContributionsFor the research linked to design patterns, the author’s main contributions were the implementa-tion of the pattern mining tool, calculating the relevant source code metrics, manually validating
3
Antipattern
MI
MI
2M
I*
MI
2*Analysability Modifiability Modularity
Reusability Te
stability
Maintainability
FE−
.985**
−.9
85**
−.8
53**
−.8
09**
−.8
52**
−.7
49**
−.1
61−
.370*
−.8
06**
−.6
52**
FED
EN
S−
.535**
−.5
35**
−.2
57−
.258
−.4
40**
−.5
32**
−.5
50**
−.5
95**
−.5
61**
−.6
09**
LC−
.757**
−.7
57**
−.9
36**
−.9
20**
−.7
55**
−.5
38**
.224
−.0
44−
.572**
−.3
81**
LCD
EN
S−
.542**
−.5
42**
−.7
77**
−.8
54**
−.5
17**
−.2
76.3
72*
.123
−.3
07*
−.1
33LC
C−
.985**
−.9
85**
−.8
73**
−.8
39**
−.8
71**
−.7
54**
−.1
31−
.354*
−.8
11**
−.6
51**
LCC
DE
NS
−.4
82**
−.4
82**
−.2
13−
.258
−.4
39**
−.5
43**
−.5
90**
−.6
55**
−.5
50**
−.6
36**
LCD
−.7
31**
−.7
31**
−.4
84**
−.4
45**
−.5
09**
−.5
51**
−.3
03*
−.3
65*
−.5
90**
−.5
28**
LCD
DE
NS
−.6
26**
−.6
26**
−.3
55*
−.3
44*
−.3
73*
−.4
31**
−.2
99*
−.3
18*
−.4
74**
−.4
28**
LF−
.991**
−.9
91**
−.8
49**
−.8
00**
−.9
02**
−.8
21**
−.2
42−
.453**
−.8
66**
−.7
28**
LFD
EN
S−
.874**
−.8
74**
−.6
22**
−.6
08**
−.8
24**
−.8
37**
−.5
00**
−.6
71**
−.8
76**
−.8
21**
LPL
−.9
52**
−.9
52**
−.9
26**
−.8
56**
−.8
51**
−.6
96**
.019
−.2
19−
.750**
−.5
60**
LPL D
EN
S−
.904**
−.9
04**
−.7
07**
−.6
70**
−.7
15**
−.6
54**
−.1
84−
.338*
−.7
08**
−.5
80**
RB
−.9
76**
−.9
76**
−.8
19**
−.7
93**
−.8
29**
−.7
34**
−.1
67−
.375*
−.7
94**
−.6
46**
RB D
EN
S−
.911**
−.9
11**
−.7
06**
−.7
28**
−.7
35**
−.6
74**
−.2
19−
.396**
−.7
30**
−.6
14**
SHS
−.9
85**
−.9
85**
−.8
20**
−.7
68**
−.8
84**
−.8
27**
−.2
91−
.487**
−.8
71**
−.7
47**
SHS D
EN
S−
.907**
−.9
07**
−.6
94**
−.6
98**
−.7
87**
−.7
73**
−.3
70*
−.5
38**
−.8
12**
−.7
26**
SUM
−.9
78**
−.9
78**
−.8
06**
−.7
54**
−.8
47**
−.7
86**
−.2
50−
.444**
−.8
34**
−.7
04**
SUM
DE
NS
−.8
95**
−.8
95**
−.6
74**
−.6
41**
−.7
32**
−.7
26**
−.3
32*
−.4
76**
−.7
68**
−.6
78**
TF
−.9
45**
−.9
45**
−.7
46**
−.7
04**
−.7
85**
−.7
46**
−.2
77−
.445**
−.7
96**
−.6
81**
TF D
EN
S−
.843**
−.8
43**
−.5
95**
−.5
43**
−.6
75**
−.7
04**
−.3
78*
−.4
84**
−.7
39**
−.6
65**
Table1:
Spearm
ancorrelations
betw
eenan
tipatternsan
dmaintaina
bility(C
++)
4
Method TP Rate FP Rate Precision Recall F-MeasureAntipatterns 0.658 0.342 0.670 0.658 0.653Metrics 0.711 0.289 0.712 0.711 0.711Both 0.712 0.288 0.712 0.712 0.712
Table 2: The results of the bug prediction experiments
the revisions that introduced patterns changes, and reviewing the related literature. On the otherhand, the entire antipattern-related research was the author’s own work including the prepara-tion and analysis of the subject systems, implementing and extracting the relevant static sourcecode metrics, calculating the corresponding maintainability values, – along with overseeing thecreation of the C++ specific quality model – implementing the antipattern mining tool and ex-tracting antipattern matches, considering program fault information, as well as conducting andevaluating the empirical experiments. The publications related to this thesis point are:
♦ Péter Hegedűs, Dénes Bán, Rudolf Ferenc, and Tibor Gyimóthy. Myth or Reality?Analyzing the Effect of Design Patterns on Software Maintainability. In Advanced SoftwareEngineering & Its Applications (ASEA 2012), Jeju Island, Korea, November 28 – December2, pages 138–145, CCIS, Volume 340. Springer Berlin Heidelberg, 2012.
♦ Dénes Bán and Rudolf Ferenc. Recognizing Antipatterns and Analyzing their Effects onSoftware Maintainability. In 14th International Conference on Computational Science andIts Applications (ICCSA 2014), Guimarães, Portugal, June 30 – July 3, pages 337–352,LNCS, Volume 8583. Springer International Publishing, 2014.
♦ Dénes Bán. The Connection of Antipatterns and Maintainability in Firefox. In 10th
Jubilee Conference of PhD Students in Computer Science (CSCS 2016), Szeged, Hungary,June 27 – 29, 2016.
♦ Dénes Bán. The Connection of Antipatterns and Maintainability in Firefox. Accepted forpublication in the 2016 Special Issue of Acta Cybernetica (extended version of the CSCS2016 paper above). 20 pages.
5

II A hardware platform selection framework for perfor-mance optimization based on static source code metrics
The contributions of this thesis point are related to software performance and an automatichardware platform selection methodology.
Qualitative Prediction ModelsThe goal of our qualitative research was to develop a highly generalizable methodology for build-ing prediction models that are capable of automatically determining the optimal hardware plat-form (regarding execution time, power consumption, and energy efficiency) of a given program,using static information alone. To achieve this, we collected a number of benchmark programsthat contained algorithms implemented for each targeted platform. These benchmarks are nec-essary for the training of the models, because executing and measuring the different versionsof their algorithms on their respective platforms is what highlights their differences in perfor-mance. Then, we extracted several low-level source code metrics from these algorithms thatwould capture their characteristics and would become the predictors of our models. We alsodeveloped a universal solution capable of performing accurate cross-platform time, power, andenergy consumption measurements for this purpose [11]. Lastly, we applied various machinelearning techniques to build the proposed prediction models. A brief empirical validation showedthe theoretical usefulness of such models, – demonstrating perfect accuracy at times – but thereal result of this study is the methodology – shown in Figure 3 – that led to them, and couldalso enable larger scale experiments. The steps of applying a model to a new subject system(unknown to the trained model) are depicted in Figure 4.
Figure 3: The main steps of the model creation process
Quantitative Prediction ModelsBuilding on the above-mentioned previous work, we extended our methodology to create modelsthat are quantitative, i.e., able to estimate expected improvement ratios instead of just the
Figure 4: Usage of a previously built model on a new subject system
6
best platform. Additional refinements included a significantly augmented set of source codemetrics, more precise metric extraction, – separating the cores of the benchmark algorithms, a.k.a.“kernels” – adding new benchmarks, and introducing the FPGA platform as a possible target.The improvement prediction accuracy values we achieved for the full systems and the separatedkernel regions are shown in tables 3 and 4, respectively. The three header layers represent how weaggregated dynamic measurements, which platform we targeted, and the measured aspect (Time,Power, Energy). As improvement ratios are continuous, they were predicted using regressionalgorithms (the top six rows), as well as the previously used classification algorithms paired witha discretization filter – using 5 bins in the middle five rows, and 3 bins in the bottom five. Whilethe regression models rarely proved encouraging, 94% of the classification models outperformedeither random choice or the established ZeroR baseline by at least 5% (up to 49%, at times).
Maintainability Changes of Parallelized ImplementationsThe benchmark source code already available to us also made it possible to look for maintainabil-ity changes between the CPU-based original (sequential) and the accelerator hardware specific(parallel) algorithm versions. The only other requirement was for us to compute the same sourcecode metrics for the parallel variants as well, as a suitable maintainability model would be reusedfrom a previous study [13]. The results of comparing the overall maintainability values of the twosource code variants clearly indicated that parallelized implementations had significantly lowermaintainability compared to their sequential counterparts, as shown in Table 5. This, however,did not appear nearly as strongly in the core algorithms (kernels) themselves, – as shown in Ta-ble 6 – which suggests that deterioration is mainly due to the added infrastructure (boilerplatecode) introduced by the accelerator specific frameworks they employ.
The Author’s ContributionsThe author led the effort of collecting and preparing the benchmarks for both static analysisand dynamic measurements. He implemented, extracted, and aggregated both the original andthe extended set of source code metrics, and he compiled the final machine learning tables. Heformalized and performed the actual experiments, and analyzed their results. The maintainabilitycomparison of benchmark versions and its evaluation is also the author’s work. The publicationsrelated to this thesis point are:
♦ Dénes Bán, Rudolf Ferenc, István Siket, and Ákos Kiss. Prediction Models for Perfor-mance, Power, and Energy Efficiency of Software Executed on Heterogeneous Hardware.In 13th IEEE International Symposium on Parallel and Distributed Processing with Appli-cations (IEEE ISPA-15), Helsinki, Finland, August 20 – 22, pages 178–183, IEEE Trust-com/BigDataSE/ISPA, Volume 3. IEEE Computer Society Press, 2015.
♦ Dénes Bán, Rudolf Ferenc, István Siket, Ákos Kiss, and Tibor Gyimóthy. PredictionModels for Performance, Power, and Energy Efficiency of Software Executed on Hetero-geneous Hardware. Submitted to the Journal of Supercomputing, Springer Publishing(extended version of the IEEE ISPA-15 paper above). 24 pages.
7

Sin
gle
Wit
hC
PU
All
CP
UG
PU
FP
GA
CP
UG
PU
FP
GA
CP
UG
PU
FP
GA
Alg
ori
thm
TP
ET
PE
TP
ET
PE
TP
ET
PE
TP
ET
PE
TP
E
Zer
oR0.
650.
450.
650.
390.
450.
420.
650.
390.
650.
650.
450.
650.
390.
370.
400.
650.
350.
650.
650.
440.
650.
390.
370.
400.
650.
380.
65L
inR
eg0.
650.
450.
650.
390.
190.
420.
650.
390.
650.
650.
450.
650.
390.
370.
400.
650.
350.
650.
650.
440.
650.
390.
300.
400.
650.
380.
65M
ult.
Per
c.0.
010.
370.
010.
120.
660.
440.
090.
070.
100.
010.
370.
010.
120.
420.
150.
090.
340.
120.
010.
450.
030.
120.
620.
150.
090.
150.
10R
EP
Tre
e0.
100.
450.
120.
630.
260.
830.
230.
360.
250.
100.
450.
120.
630.
390.
700.
230.
050.
020.
100.
390.
120.
630.
260.
700.
230.
080.
25M
5P0.
300.
130.
320.
650.
500.
790.
470.
100.
480.
300.
130.
320.
650.
170.
720.
470.
130.
480.
300.
120.
320.
650.
280.
710.
470.
010.
48SM
Ore
g0.
060.
250.
080.
150.
700.
100.
040.
370.
040.
060.
250.
080.
150.
650.
150.
040.
200.
040.
060.
300.
080.
150.
640.
160.
040.
200.
04
Zer
oR16
.28
16.2
816
.28
11.1
111
.11
11.1
10.
000.
000.
0016
.28
16.2
816
.28
11.1
111
.11
11.1
10.
000.
000.
0016
.28
16.2
816
.28
11.1
111
.11
11.1
10.
000.
000.
00J4
837
.21
27.9
158
.14
53.3
360
.00
53.3
334
.48
27.5
937
.93
37.2
127
.91
58.1
453
.33
51.1
160
.00
34.4
841
.38
48.2
837
.21
25.5
858
.14
53.3
328
.89
60.0
034
.48
34.4
841
.38
Nai
veB
ayes
25.5
830
.23
20.9
322
.22
28.8
922
.22
17.2
437
.93
24.1
425
.58
30.2
320
.93
22.2
217
.78
17.7
817
.24
31.0
320
.69
25.5
830
.23
20.9
322
.22
20.0
017
.78
17.2
424
.14
13.7
9L
ogis
tic
27.9
123
.26
30.2
351
.11
31.1
140
.00
27.5
937
.93
31.0
327
.91
23.2
630
.23
51.1
133
.33
46.6
727
.59
31.0
324
.14
27.9
127
.91
30.2
351
.11
33.3
346
.67
27.5
924
.14
24.1
4SM
O39
.53
27.9
127
.91
40.0
028
.89
42.2
227
.59
41.3
817
.24
39.5
327
.91
27.9
140
.00
26.6
744
.44
27.5
917
.24
3.45
39.5
323
.26
27.9
140
.00
17.7
844
.44
27.5
913
.79
10.3
4
Zer
oR23
.26
23.2
623
.26
22.2
222
.22
22.2
234
.48
34.4
834
.48
23.2
623
.26
23.2
622
.22
22.2
222
.22
34.4
834
.48
34.4
823
.26
23.2
623
.26
22.2
222
.22
22.2
234
.48
34.4
834
.48
J48
65.1
241
.86
65.1
271
.11
57.7
860
.00
55.1
737
.93
55.1
765
.12
41.8
665
.12
71.1
157
.78
71.1
155
.17
44.8
355
.17
65.1
246
.51
65.1
271
.11
44.4
471
.11
55.1
734
.48
55.1
7N
aive
Bay
es32
.56
37.2
132
.56
33.3
340
.00
40.0
058
.62
41.3
858
.62
32.5
637
.21
32.5
633
.33
44.4
433
.33
58.6
241
.38
58.6
232
.56
37.2
132
.56
33.3
346
.67
33.3
358
.62
37.9
358
.62
Log
isti
c34
.88
51.1
634
.88
66.6
746
.67
60.0
062
.07
48.2
862
.07
34.8
851
.16
34.8
866
.67
60.0
066
.67
62.0
741
.38
62.0
734
.88
53.4
934
.88
66.6
757
.78
66.6
762
.07
41.3
862
.07
SMO
39.5
346
.51
39.5
353
.33
60.0
042
.22
55.1
755
.17
55.1
739
.53
46.5
139
.53
53.3
346
.67
53.3
355
.17
55.1
755
.17
39.5
344
.19
39.5
353
.33
53.3
353
.33
55.1
741
.38
55.1
7
Table3:
Fullpredictio
naccuracies
Sin
gle
Wit
hC
PU
All
CP
UG
PU
FP
GA
CP
UG
PU
FP
GA
CP
UG
PU
FP
GA
Alg
ori
thm
TP
ET
PE
TP
ET
PE
TP
ET
PE
TP
ET
PE
TP
E
Zer
oR0.
480.
460.
480.
360.
460.
370.
650.
410.
650.
480.
460.
480.
360.
420.
360.
650.
410.
650.
480.
470.
480.
360.
440.
350.
650.
410.
65L
inR
eg0.
480.
460.
480.
360.
320.
370.
650.
410.
650.
480.
460.
480.
360.
420.
360.
650.
410.
650.
480.
470.
480.
360.
230.
350.
650.
410.
65M
ult.
Per
c.0.
010.
130.
020.
630.
630.
560.
070.
160.
160.
010.
130.
020.
630.
460.
670.
070.
390.
130.
010.
140.
020.
630.
500.
610.
070.
480.
06R
EP
Tre
e0.
080.
100.
080.
740.
270.
700.
190.
180.
210.
080.
100.
080.
740.
000.
770.
190.
070.
130.
080.
470.
080.
740.
210.
740.
190.
190.
21M
5P0.
010.
040.
010.
670.
050.
670.
430.
160.
440.
010.
040.
010.
670.
020.
640.
430.
160.
440.
010.
040.
010.
670.
110.
670.
430.
160.
44SM
Ore
g0.
040.
070.
050.
000.
530.
000.
070.
120.
070.
040.
070.
050.
000.
620.
010.
070.
040.
060.
040.
120.
050.
000.
630.
010.
070.
080.
06
Zer
oR16
.28
16.2
816
.28
11.1
111
.11
11.1
10.
000.
000.
0016
.28
16.2
816
.28
11.1
111
.11
11.1
10.
000.
000.
0016
.28
16.2
816
.28
11.1
111
.11
11.1
10.
000.
000.
00J4
832
.56
18.6
044
.19
48.8
935
.56
46.6
768
.97
20.6
968
.97
32.5
618
.60
44.1
948
.89
22.2
248
.89
68.9
717
.24
68.9
732
.56
34.8
837
.21
48.8
948
.89
48.8
968
.97
48.2
868
.97
Nai
veB
ayes
18.6
020
.93
13.9
526
.67
31.1
122
.22
34.4
824
.14
34.4
818
.60
20.9
313
.95
26.6
720
.00
33.3
334
.48
17.2
434
.48
18.6
013
.95
6.98
26.6
728
.89
33.3
334
.48
27.5
934
.48
Log
isti
c41
.86
25.5
844
.19
33.3
337
.78
40.0
041
.38
27.5
941
.38
41.8
625
.58
44.1
933
.33
33.3
335
.56
41.3
824
.14
41.3
841
.86
25.5
825
.58
33.3
331
.11
35.5
641
.38
27.5
941
.38
SMO
32.5
620
.93
20.9
333
.33
28.8
940
.00
34.4
820
.69
34.4
832
.56
20.9
320
.93
33.3
320
.00
42.2
234
.48
17.2
434
.48
32.5
623
.26
20.9
333
.33
28.8
942
.22
34.4
810
.34
34.4
8
Zer
oR30
.23
23.2
630
.23
22.2
222
.22
22.2
234
.48
34.4
834
.48
30.2
323
.26
30.2
322
.22
22.2
222
.22
34.4
834
.48
34.4
830
.23
23.2
630
.23
22.2
222
.22
22.2
234
.48
34.4
834
.48
J48
55.8
132
.56
55.8
153
.33
62.2
253
.33
55.1
748
.28
55.1
755
.81
32.5
655
.81
53.3
346
.67
48.8
955
.17
41.3
855
.17
55.8
132
.56
55.8
153
.33
35.5
648
.89
55.1
737
.93
55.1
7N
aive
Bay
es37
.21
39.5
337
.21
44.4
444
.44
57.7
834
.48
31.0
334
.48
37.2
139
.53
37.2
144
.44
40.0
048
.89
34.4
817
.24
34.4
837
.21
39.5
337
.21
44.4
442
.22
48.8
934
.48
17.2
434
.48
Log
isti
c65
.12
37.2
165
.12
48.8
955
.56
53.3
368
.97
37.9
368
.97
65.1
237
.21
65.1
248
.89
57.7
853
.33
68.9
727
.59
68.9
765
.12
37.2
165
.12
48.8
953
.33
53.3
368
.97
34.4
868
.97
SMO
53.4
946
.51
53.4
948
.89
55.5
651
.11
44.8
341
.38
44.8
353
.49
46.5
153
.49
48.8
940
.00
55.5
644
.83
17.2
444
.83
53.4
946
.51
53.4
948
.89
44.4
455
.56
44.8
327
.59
44.8
3
Table4:
Kernelp
redictionaccuracies
8

Benchmark Analy
sability
Modifiab
ility
Modulari
ty
Reusab
ility
Testab
ility
Maintain
ability
mri-q −0.388 −0.405 −0.448 −0.432 −0.360 −0.407spmv −0.667 −0.685 −0.653 −0.676 −0.658 −0.668stencil −0.225 −0.237 −0.428 −0.325 −0.199 −0.283atax −0.338 −0.354 −0.472 −0.406 −0.298 −0.375bicg −0.342 −0.358 −0.471 −0.412 −0.308 −0.379conv2d −0.332 −0.346 −0.469 −0.405 −0.296 −0.370doitgen −0.372 −0.388 −0.582 −0.476 −0.324 −0.429gemm −0.269 −0.283 −0.435 −0.352 −0.237 −0.315gemver −0.325 −0.343 −0.494 −0.417 −0.294 −0.375gesummv −0.290 −0.304 −0.384 −0.343 −0.262 −0.317jacobi2d −0.420 −0.433 −0.560 −0.491 −0.373 −0.456mvt −0.339 −0.353 −0.444 −0.396 −0.304 −0.368bfs −0.352 −0.367 −0.497 −0.431 −0.319 −0.393hotspot −0.226 −0.235 −0.371 −0.308 −0.167 −0.261lavaMD −0.271 −0.276 −0.352 −0.315 −0.244 −0.292nn −0.429 −0.434 −0.560 −0.485 −0.364 −0.456
Table 5: Maintainability changes at the system level
Benchmark Analy
sability
Modifiab
ility
Modulari
ty
Reusab
ility
Testab
ility
Maintain
ability
mri-q −0.234 −0.240 −0.395 −0.321 −0.225 −0.282spmv 0.139 0.135 −0.308 −0.069 0.188 0.019stencil 0.145 0.144 −0.617 −0.205 0.220 −0.059atax −0.109 −0.136 −0.435 −0.283 −0.087 −0.208bicg −0.200 −0.222 −0.449 −0.329 −0.162 −0.272conv2d −0.065 −0.075 −0.431 −0.228 −0.002 −0.161doitgen 0.147 0.131 −0.653 −0.228 0.226 −0.072gemm 0.120 0.110 −0.391 −0.123 0.175 −0.019gemver −0.161 −0.187 −0.708 −0.429 −0.119 −0.319gesummv −0.041 −0.055 −0.341 −0.199 −0.033 −0.131jacobi2d −0.035 −0.057 −0.691 −0.347 0.019 −0.220mvt −0.148 −0.174 −0.443 −0.302 −0.115 −0.236bfs 0.067 0.063 −0.408 −0.150 0.095 −0.064hotspot −0.035 −0.041 −0.774 −0.390 0.043 −0.235lavaMD −0.158 −0.165 −0.434 −0.303 −0.150 −0.239nn 0.015 0.017 0.007 0.006 0.013 0.012
Table 6: Maintainability changes at the kernel level
9
SummaryOur contributions can be grouped into two major thesis points.
The main results of the first thesis point are the empirical studies mentioned in Section I,which support the intuitive expectations about the relations between well-known source codepatterns and software maintainability with objective, definite data. To our knowledge, thesefindings are among the first that were performed on subject systems of such volume, size, andvariance, while also avoiding all subjective factors like developer surveys, time tracking, andinterviews.
The main results of the second thesis point are (a) the empirical proof that static sourcecode metrics are suitable for improvement estimation, and (b) a universal process for creatingqualitative and quantitative hardware platform prediction models, as described in Section II. Akey difference between our approach and other available solutions is that, once they are built,our models operate based on static information alone. Also, their accuracy depends primarily onthe number of training benchmarks. These properties make the methodology easy to enhance,and its output models easy to apply.
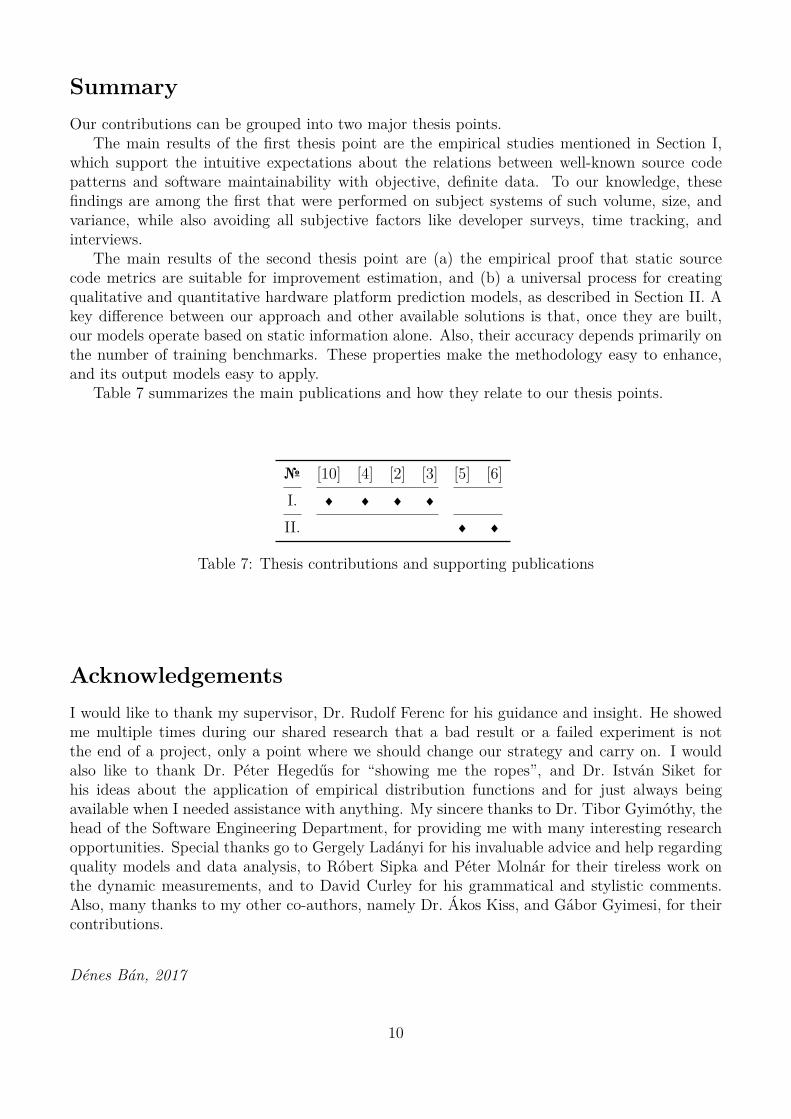
Table 7 summarizes the main publications and how they relate to our thesis points.
№ [10] [4] [2] [3] [5] [6]I. ♦ ♦ ♦ ♦
II. ♦ ♦
Table 7: Thesis contributions and supporting publications
AcknowledgementsI would like to thank my supervisor, Dr. Rudolf Ferenc for his guidance and insight. He showedme multiple times during our shared research that a bad result or a failed experiment is notthe end of a project, only a point where we should change our strategy and carry on. I wouldalso like to thank Dr. Péter Hegedűs for “showing me the ropes”, and Dr. István Siket forhis ideas about the application of empirical distribution functions and for just always beingavailable when I needed assistance with anything. My sincere thanks to Dr. Tibor Gyimóthy, thehead of the Software Engineering Department, for providing me with many interesting researchopportunities. Special thanks go to Gergely Ladányi for his invaluable advice and help regardingquality models and data analysis, to Róbert Sipka and Péter Molnár for their tireless work onthe dynamic measurements, and to David Curley for his grammatical and stylistic comments.Also, many thanks to my other co-authors, namely Dr. Ákos Kiss, and Gábor Gyimesi, for theircontributions.
Dénes Bán, 2017
10

References[1] Tibor Bakota, Péter Hegedűs, Péter Körtvélyesi, Rudolf Ferenc, and Tibor Gyimóthy. A
Probabilistic Software Quality Model. In Proceedings of the 27th IEEE International Confer-ence on Software Maintenance, ICSM 2011, pages 368–377, Williamsburg, VA, USA, 2011.IEEE Computer Society.
[2] Dénes Bán. The connection of antipatterns and maintainability in firefox. In 10th JubileeConference of PhD Students in Computer Science (CSCS 2016), Szeged, Hungary, June 27– 29, 2016.
[3] Dénes Bán. The connection of antipatterns and maintainability in firefox. Accepted forpublication in the 2016 Special Issue of Acta Cybernetica (extended version of [2]). 20pages.
[4] Dénes Bán and Rudolf Ferenc. Recognizing antipatterns and analyzing their effects onsoftware maintainability. In 14th International Conference on Computational Science andIts Applications (ICCSA 2014), Guimarães, Portugal, June 30 – July 3, pages 337–352.Springer International Publishing, 2014.
[5] Dénes Bán, Rudolf Ferenc, István Siket, and Ákos Kiss. Prediction models for performance,power, and energy efficiency of software executed on heterogeneous hardware. In 13th IEEEInternational Symposium on Parallel and Distributed Processing with Applications (IEEEISPA-15), Helsinki, Finland, August 20 – 22, volume 3, pages 178–183, 2015.
[6] Dénes Bán, Rudolf Ferenc, István Siket, Ákos Kiss, and Tibor Gyimóthy. Prediction mod-els for performance, power, and energy efficiency of software executed on heterogeneoushardware. Submitted to the Journal of Supercomputing (extended version of [5]). 24 pages.
[7] William J. Brown, Raphael C. Malveau, Hays W. McCormick, III, and Thomas J. Mowbray.AntiPatterns: Refactoring Software, Architectures, and Projects in Crisis. John Wiley &Sons, Inc., New York, NY, USA, 1998.
[8] D. Coleman, D. Ash, B. Lowther, and P. Oman. Using metrics to evaluate software systemmaintainability. Computer, 27(8):44–49, Aug 1994.
[9] Erich Gamma, Richard Helm, Ralph Johnson, and John Vlissides. Design Patterns : Ele-ments of Reusable Object-Oriented Software. Addison-Wesley Pub Co, 1995.
[10] Péter Hegedűs, Dénes Bán, Rudolf Ferenc, and Tibor Gyimóthy. Myth or reality? analyzingthe effect of design patterns on software maintainability. In Advanced Software Engineering& Its Applications (ASEA 2012), Jeju Island, Korea, November 28 – December 2, pages138–145. Springer Berlin Heidelberg, 2012.
[11] Ákos Kiss, Péter Molnár, and Róbert Sipka. Rmeasure performance and energy monitoringlibrary. https://github.com/sed-szeged/RMeasure, 2017.
[12] Tim Menzies, Bora Caglayan, Zhimin He, Ekrem Kocaguneli, Joe Krall, Fayola Peters, andBurak Turhan. The promise repository of empirical software engineering data, June 2012.
[13] Rudolf Ferenc et al. REPARA deliverable D7.4: Maintainability models of heterogeneousprogramming models. 2015.
11