statistical analysis of concrete...
TRANSCRIPT
STATISTICAL ANALYSIS OF CONCRETE STRENGTH VERSUS AIR ENTRAINMENT Richard M. Weed, New Jersey Department of Transportation
A series of structural-grade concrete test cylinders was cast and tested in the laboratory to determine the decrease in compressive strength to be expected with increasing levels of air entrainment. Regression analysis of these data shows the decrease of strength to be about 400 psi for each 1 percent increase of air entrainment within the range of interest between 3 and 10 percent. Additional techniques are applied to construct a curve to predict probable rejection rates with various air entrainment levels that might be specified in the future. These results , combined with engineering judgment, led to the adoption of a new air specification of 6.0 ± 1.5 percent. Operating characteristic curves are developed to predict probable rejection rates for different lot sizes with the new specification. A logarithmic transformation of the data is used in a second regression analysis to further explore the fundamental relation between air entrainment and strength.
•BECAUSE of a demonstrated scaling problem on concrete bridge structures in New Jersey, a research project was undertaken to test various protective materials and methods. The preliminary test results, supported by a thorough literature review, indicate that the most effective means to prevent scaling continues to be adequate air entrainment. The literature search also produced the rule-of-thumb that increased air entrainment is accompanied by a loss of compressive strength of approximately 5 percent for each additional 1 percent of entrained air. It was desired to determine the maximum level of air entrainment that could be specified without risking too great a loss of compressive strength.
Because certain construction practices are believed to reduce the amount of air entrainment at the surface of the concrete where it is most needed , an increase from the current specification of 4.5 percent up to levels as high as 8 percent were being considered to provide a measure of safety. However, because of the known strength loss with increasing air content, it was suspected that this might result in too great a decrease in strength.
It was decided to cast a series of test cylinders using normal structural concrete with varying amounts of entrained air to determine the loss of strength to be expected. Several laboratory batches of structural grade concrete were prepared with a cement factor of 6. 7 sacks per cubic yard and the water-cement ratio controlled as closely as possible at 5.25 gallons per sack. The air content of the fresh concrete was measured by the pressure method and was varied from 3 to 12 percent. This resulted in a total of 67 cylinders being used for the analysis.
Because these batches were carefully controlled and the cylinders were cured in an optimum manner, the resulting strengths represent the potential of field concrete under the best conditions. Because this is rarely the case, the strengths actually obtained in the field would be expected to be somewhat lower.
Sponsored by Committee on Performance of Concrete-Physical Aspects and Committee on Quality Assurance and Acceptance Procedures.
35
36
The American Concrete Institute (ACI 318-63) has suggested that adequate control of a concrete project is achieved if not more than 20 percent of the strength tests fall below the design strength when working stress design is used. Although this indicates that it would be perfectly normal for up to 20 percent of the cylinders to be below the design strength, for the purposes of this paper these cylinders will be called rejects, and the actual percentage of cylinders below design strength will be referred to as the reject rate. In our case, the design strength is 3 ,000 psi. The overall reject rate ran about 2 percent with the current air specification of 4.5 percent so there appeared to be considerable latitude to increase the air level.
The recommendation that 20 percent of the total (large) number of tests may be allowed to be rejects is the same as saying that the probability that a single cylinder will be a reject may be as high as 20 percent. (If the overall population of test cylinders has 20 percent rejects , any one cylinder taken at random from this population would have a 20 percent chance of being a reject.) In order to use this recommendation as a guideline, it was necessary to find a method to predict expected rejection rates for the higher levels of air entrainment under consideration.
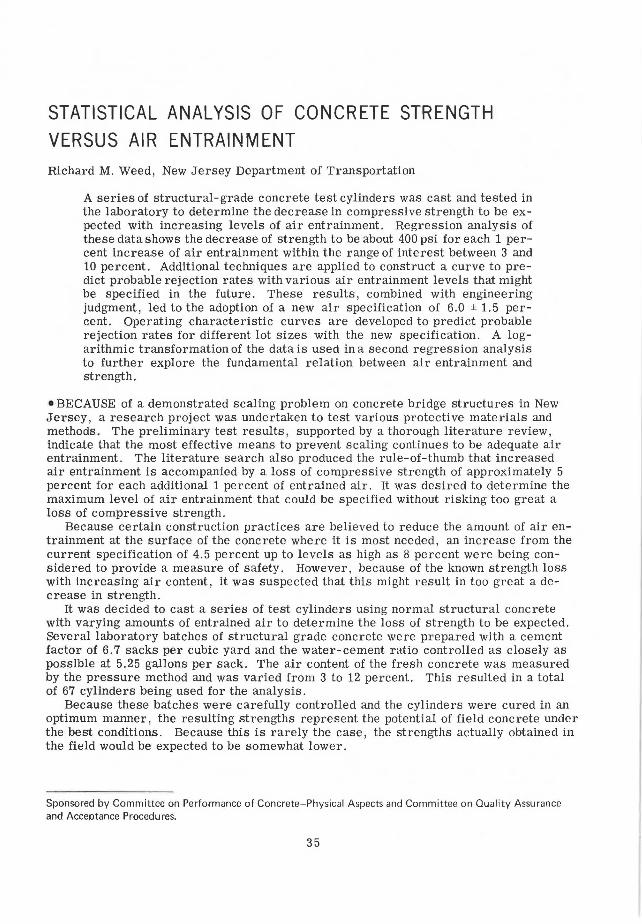
The method to be used involves the calculation of the regression line for compressive strength versus level of air entrainment. This line is then plotted with its associated confidence bands for a single, future predicted value. Because we are concerned only with strengths that fall below the 3 ,000-psi minimum, one-tailed student-t values are used in the calculation of these confidence lines, and they are plotted only on the lower side of the regression line as shown in Figure 1.
These confidence lines directly provide the probability of rejection for a single , future laboratory test cylinder at any particular air level. For example , a future cylinder with an air level of 8 percent has a 95 percent chance of being above 3 ,000 psi because the point (X = 8 percent , Y = 3,000 psi) in Figure 1 is crossed by the 95 percent confidence line. The probability of rejection (being below 3 ,000 psi) is 5 percent ( 100 percent minus 95 percent).
Generally speaking, it is not statistically correct to make multiple predictions from these confidence lines because they are intended only for the prediction of a single , future value. However, these lines will be used in a unique manner, one that will permit their application to any number of future values. Briefly, this involves accepting the regression line and its associated confidence lines as a true and correct description of the physical situation. As such, these lines would not change no matter how many additional data points might be obtained. As would be expected, the validity of the conclusions will be dependent on the accuracy with which the regression line has been established .
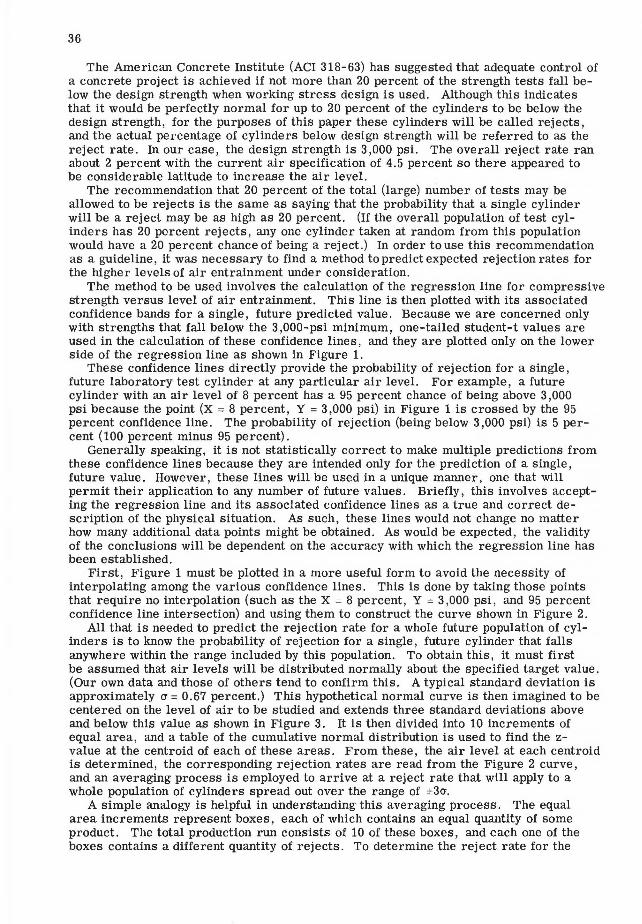
First, Figure 1 must be plotted in a more useful form to avoid the necessity of interpolating among the various confidence lines . This is done by taking those points that require no interpolation (such as the X = 8 percent, Y = 3 ,000 psi, and 95 percent confidence line intersection) and using them to construct the curve shown in Figure 2.
All that is needed to predict the rejection rate for a whole future population of cylinders is to know the probability of rejection for a single, future cylinder that falls anywhere within the range included by this population. To obtain this, it must first be assumed that air levels will be distributed normally about the specified target value. (Our own data and those of others tend to confirm this. A typical standard deviation is approximately a= 0.67 percent .) This hypothetical normal curve is then imagined to be centered on the level of air to be studied and extends three standard deviations above and below this value as shown in Figure 3. It is then divided into 10 increments of equal area, and a table of the cumulative normal distribution is used to find the zvalue at the centroid of each of these areas. From these , the air level at each centroid is determined, the corresponding rejection rates are read from the Figure 2 curve, and an averaging process is employed to arrive at a reject rate that will apply to a whole population of cylinders spread out over the range of ±3cr.
A simple analogy is helpful in understanding this averaging process. The equal area increments represent boxes, each of which contains an equal quantity of some product. The total production run consists of 10 of these boxes, and each one of the boxes contains a different quantity of rejects. To determine the reject rate for the
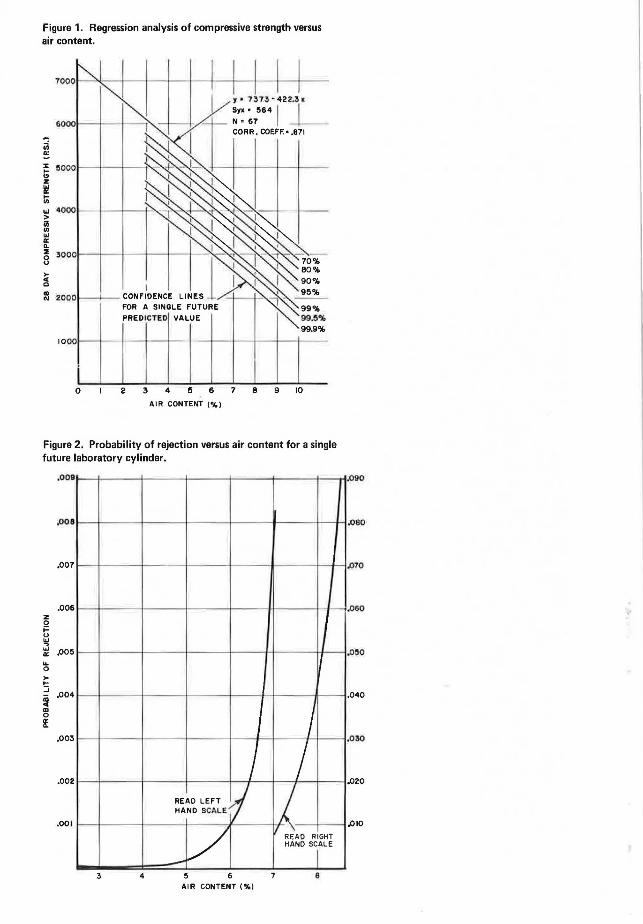
Figure 1. Regression analysis of compressive strength versus air content.
-ui 0.:
t; !1000
z II! Iii
?( c I :I 2000t-_,,___ CONFIOENCE
0
FOR A SINGLE FUTURE PREDICTED VALUE
2 3 4 !i 6
AIR CONTENT ('%)
7 8 9 10
Figure 2. Probability of rejection versus air content for a single future laboratory cylinder.
z 0 ;:: u Ill
,009
,001
,007
,006
~ .005 ... 0 ,.. .... :::; ~ ,004
m 0
If ,003
.002
.00 1
J READ LEFT ,.!f HANO SCALE
~/ 3 4 5 6
AIR CONTENT ('%)
I I
/ I ~
READ RIGHT HANO SCALE
I 7 8
090
.080
/J70
060
0!10
040
030
020
/JIO
38
entire production run, we add up the number of rejects in each box and divide by the total number of items in all 10 boxes.
Table 1 illustrates this procedure for an air level of 6.5 ± 2.0 percent. The 10 equal area increments are given in column 1, the z-values at the centroids of these increments are given in column 2, and the products of the z-values multiplied by the standard deviation are given in column 3. Although the calculation given in this table will be repeated for different levels of air, this is not as laborious as it might seem because these first three columns always remain the same. If this procedure were to be used for some other study, columns 1 and 2 would still remain the same.
The values given in column 4 are obtained by adding the column 3 values to the particular air specification for which the calculation is being made. The column 4 values then represent the actual air levels at the centroids of the 10 increments.
The values in column 5 are obtained from the curve shown in Figure 2. The reject rates are determined at each of the column 4 air levels and then entered in column 5. All that remains is to sum and average column 5 to arrive at an average rejection pr obability. This rejection probability can be thought of as the expected "percent defective" of the entire future population of lalboratory cylinders that would result from this particular air specification.
This procedure is repeated for several different possible specified air levels, and the results are plotted as the right-hand (laboratory) cur ve shown in Figure 4. It is now necessary to make an approximation to construct a curve in Figure 4 t hat will apply to field concrete . This is accomplished by plotting the one known field point (the current reject rate of 2 percent with the current air specification of 4.5 ± 1.5 percent) and drawing a curve through this point parallel to the laboratory curve . At a later date , after sufficient data have been obtained with a new specification so that another known field point can be plotted, it will be possible to determine this curve more accurately.
Two minor assumptions should be noted. Although the current air specification requires a tole rance of ±1.5 percent, it is assumed that the variability actually achieved in t he field is ±2.0 percent (±3a) as was used in the calculations for t he laboratory cylinders . Also, the laboratory cylinders we1·e cast in groups of four, whereas field concrete cylinders are taken in groups of three. Because the overall variability of field concrete consists primarily of batch-to-batch variation and is influenced to a much lesser degree by sampling, testing, and within-batch variability , this difference would have little effect on the overall variance. Because the effects of these two assumptions are small, they have been ignored.
Remembering that the ACI recommended maximum limit for rejection probability is 20 percent , we shall now use this curve t o predict the probable result of different air specifications. For example , a specified level of 8 percent would have an overall expected refection rate well in excess of the 20 percent limit. Even a 7 percent specification would be slightly above the 20 percent rejection level. At the other extreme, a specification of 5 percent would have an expected rejection rate of about 4 percent, which is unnecessarily conservative.
At this point , engineering judgment had to be exercised. The literature survey had shown that nearly half the states were using an air specification of 6 percent or more for bridge decks. Furthermore, our cu1Tent mix design was producing consistently high strengths with the mean strength above 4, 700 psi. Therefore, it was decided to adopt a specification of 6 percent, for which the predicted rejection rate is 14 percent, somewhat high but well within the limits prescribed by the AC!. This specification is just now being adopted , and the resulting strengths will be watched carefully to determine whether fur the r changes are warranted.
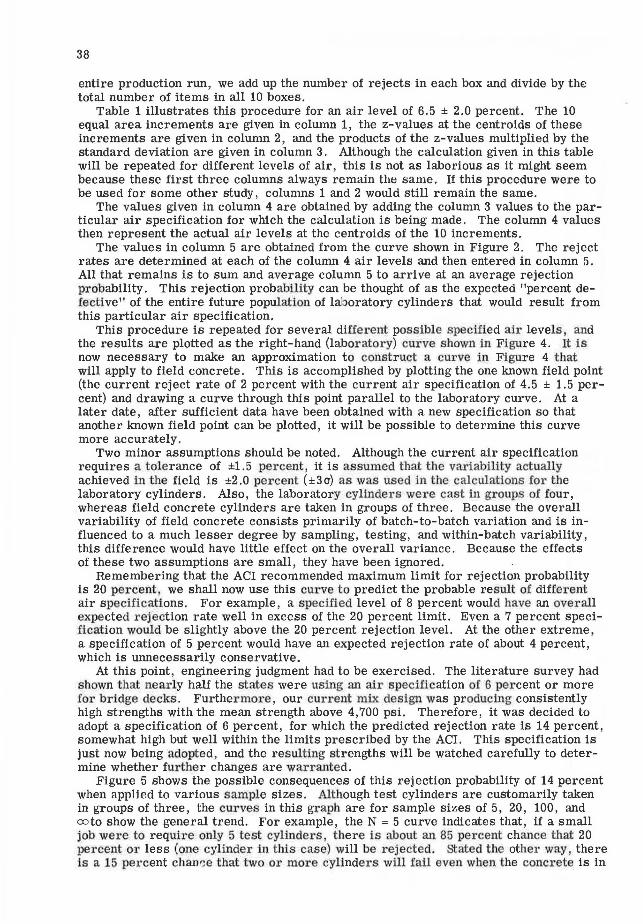
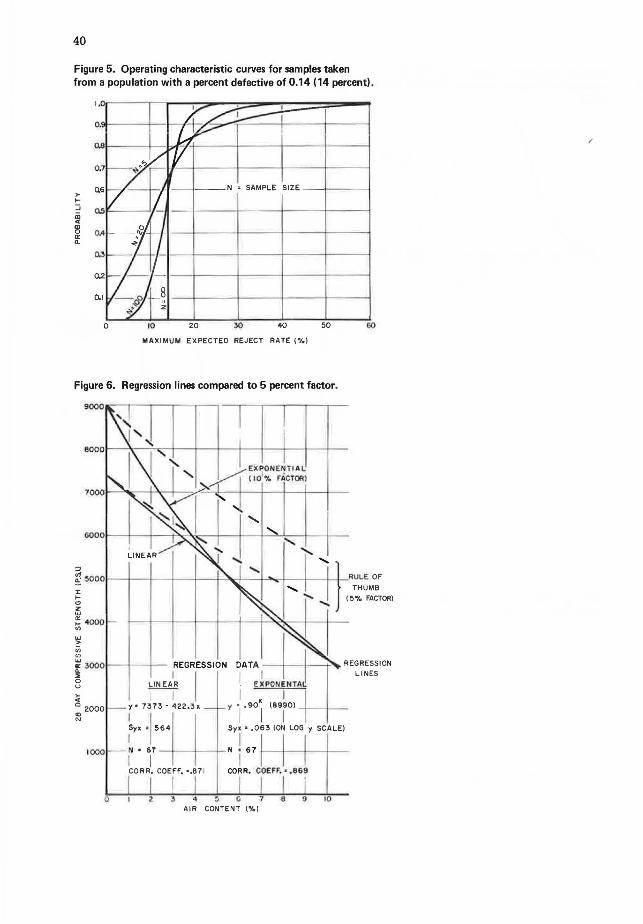
Figure 5 shows the possible consequences of this rejection probability of 14 percent when applied to various sample sizes. Although test cylinders are customarily taken in groups of three, the curves in this gr aph are for sample sizes of 5, 20, 100, and co to show the general trend. For example, the N = 5 curve indicates that, if a small job we1·e to require only 5 test cylinder s, there is about an 85 percent chance that 20 percent or less (one cylinder i n thi s case) will be rejected. stated the other way, there is a 15 percent chanr.e t hat two or more cylinders will fail even when the concrete is in
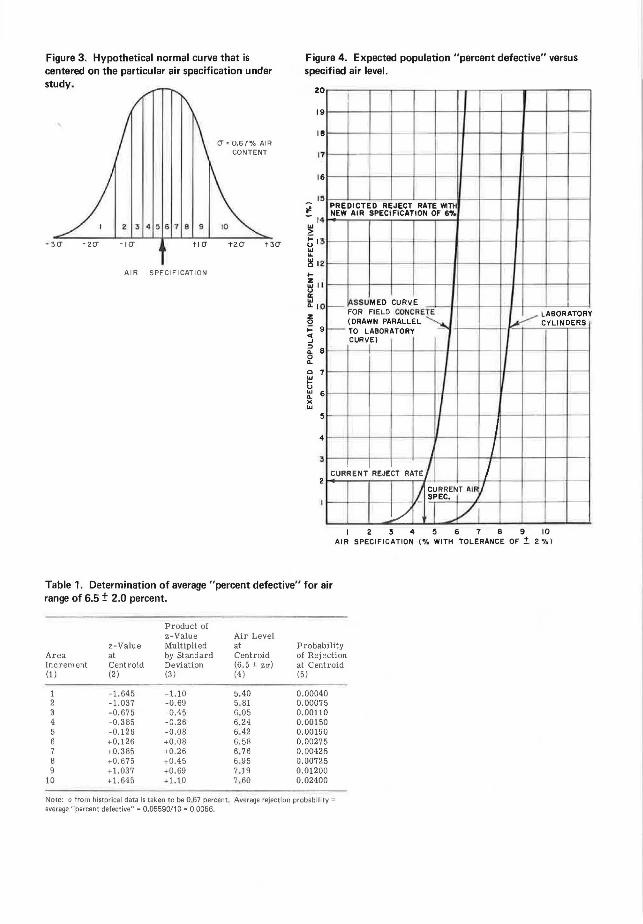
Figure 3. Hypothetical normal curve that is centered on the particular air specification under study.
-2(J
AIR SPECIFICATION
(J ~ 0.67% AIR CONTENT
t 3CJ
Figure 4. Expected population "percent defective" versus specified air level.
20
19
18
17
16
15
I~
~ t; 13
"' ~ 12 I-
~ II u a:
"' "-1 0 z 0 ;:: 9 .. .J
~ 8 0 ll.
0 7
~ ~ 6 )(
OJ
4
3
2
I
_,_ - --
PREDICTED REJECT RATE wrn~ NEW AIR SPECIFICATION OF 6,,,
~SSUMED CURVE - FOR FIELD CONCRETE ~LABORATORY (DRAWN PARALLEL ~ CYLINDERS
-- TO LABORATORY -CURVE)
j -
I
' I CURRENT REJECT RATE I I
IL ~~RRENT AIF I SPEC. I
l/ Y 1 2 3 4 5 6 7 8 9 10
AIR SPECIFICATION ( % WITH TOLERANCE OF !. 2 % )
Table 1. Determination of average "percent defective" for air range of 6.5 ± 2.0 percent.
Product of z-Value Air Level
z-Value Multiplied at Probability Area at by Standard Centroid of Rejection Increment Centroid Deviation (6.5 ± za) at Centroid (1) (2) (3) (4) (5)
1 - 1.645 -1.10 5.40 0.00040 2 -1. 037 -0.69 5. 81 0.00075 3 -0 .675 -0.45 6.05 0.00110 4 -0. 385 -0.26 6.24 0.00150 5 -0.126 -0.08 6.42 0.00190 6 +0.126 +0.08 6.58 0.00275 7 +0.385 +0.26 6. 76 0.00425 8 +0 .675 +0.45 6.95 0.00725 9 +1.037 +0.69 7. 19 0.01200
10 +1.645 +1.10 7.60 0.02400
Note: o from historical data is taken to be 0.67 percent. Average rejecti on probability= average "percent defective"= 0.05590/10 = 0.0056.
40
Figure 5. Operating characteristic curves for samples taken from a population with a percent defective of 0.14 (14 percent) .
0.7
0.6 - --N • SAMPLE SIZE - - 1-----1 ,.. ... ::; Q.5 iii ... ~ a: 4.
0.1
0 20 30 40 50
MAXIMUM EXPECTED REJECT RATE (%)
Figure 6. Regression lines compared to 5 percent factor.
"' ~~000't--t-_,t--_, _ _,_-t_.~--+......_rl---+---+-~-J·ULEOF :r ... "' z UJ
:: 4000 V)
~ iii
~ 30001--1--+-- REGRESSION
~ I [ u LIN EAR ~ ---1 o 2000 y • B73 - 422.3 x
~ rr· .1
5 64
N • 67 -+--1---4-
1 I 1000
CORR. COEFF, •.671 CORR. COEFF. • . 669
I I 3 ll ::; G 7 e 0
AIR CONTENT ("lo)
10
41
perfect control. What may occasionally seem like bad concrete could very well be within specification. The curves shown in Figure 5 do not tell us which is actually the case, but they do provide insight as to what sample reject rates may be expected.
Another interesting outcome of this study is the determination of the rate of decrease of strength as air entrainment is increased. The rule-of-thumb that the strength could be expected to decrease by about 5 percent for each additional 1 percent of air is an exponential expression of the form y = 0.95xY0 • In this expression, y stands for the predicted strength, the constant 0.95 pertains to the 5 percent factor, xis the level of air, and Yo is the theoretical strength that would be achieved if there were absolutely no air in the concrete.
Unlike the regression line used thus far in the study, an exponential curve of this type would tend to level off as higher levels of air are approached (dashed lines in Fig. 6). From a fundamental standpoint, it is quite logical that the true relation would be described by such a curve because (a) additional air should have a diminishing effect as more and more air is added and (b) zero strength theoretically should not be reached until 100 percent air is approached.
Because y = KxYo can be expressed as logy = x log K + log Yo, the regression program was run with a logarithmic transformation of y to fit a curve of this type to the data. The first-order regression constants (slope and intercept) provide the values for log Kand log Yo, from which Kand Yo can be found. This relation is then plotted (Fig. 6). From this, the following three conclusions can be drawn:
1. Throughout the range of interest, between 3 and 10 percent air content, the two regression lines almost coincide. This serves to justify the use of the linear model in this study.
2. The value of K obtained from the computer for the exponential regression line is 0.90. This indicates a decrease of strength of 10 percent for each 1 percent of air, exactly double the rule-of-thumb value.
3. Whichever regression line is used, the decrease in strength predicted by the experiment is substantially greater than that predicted by the rule-of-thumb.
There may be an explanation for the difference noted in the third conclusion. The water-cement ratio is a critical factor that has an inverse effect on the strength of concrete. In the laboratory tests, the water-cement ratio was held as constant as possible at 5.25 gallons per sack. The 5 percent rule-of-thumb may allow for the fact that higher levels of air entrainment provide greater workability of the mix, thereby lowering the water requirement and regaining some of the lost strength. If this is so, then the curves developed for this study will be somewhat conservative and would predict rejection rates somewhat higher than would actually be experienced in the field. Therefore, any error in this particular case can be expected to be on the safe side.
The particular combination of statistical techniques employed in this paper was developed in an attempt to make the best possible choice for a new air-entrainment specification. To the best of the author's knowledge, this is an original approach that provides a valid method for estimating a large quantity of future values when the regression line is well established. With a computerized regression program and the appropriate statistical tables, these steps can be performed quite rapidly and could readily be applied to other studies concerning the relation between two variables.