statistical approaches to environmental study data · statistical approaches to environmental study...
TRANSCRIPT

Statistical Approaches to Environmental Study Data
A 1-day workshop

Outline: Environmental study design – principles and examples
A. Principles of study design, with examples1. Spatial pattern, statistical assumptions, and transformation
of variables2. Choice of sampling method and sample unit size3. Hypothesis testing4. Estimating necessary number of samples5. Allocation of sampling effort in space and time6. Criteria for choice of response variable(s)7. ANOVA designs – random, paired, nested, factorial8. Reference sites, reference conditions9. BACI designs
10. Specialized methods
B. Closing remarks – some personal prejudices

Statistical approaches to environmental study data
1. Introduction2. General principles and review of environmental study designsa. Logical flow: Question => Hypotheses => Model => Study design
=> Tests of hypotheses => Interpretationb. Reference sites, reference conditions (see section 4 on MV analysis)c. Hypothesis testing - why & howd. Choice of sampling method and sample unit sizee. Estimating necessary number of samplesf. Allocation of sampling effort in space and timeg. Spatial pattern, statistical assumptions & transformation of variablesh. ANOVA designs - random, paired, nested, factorial (e.g. BACI designs)i. Criteria for choice of response variable(s)j. Specialized methods: sequential sampling; mark-recapture and removal
estimates; artificial substrates; field transplant experiments; EMAP; Bayesian methods and other fads

3. Statistical analysis by univariate modelsa. Review of regression analysis models and General Linear Modelsb. Linear and nonlinear models in biology and ecologyc. Applications of Analysis of Covariance (ANCOVA) modelsd. How to do ANOVA and ANCOVA by regression, with dummy variablese. Interpretation of results, especially of interactions in ANOVA & ANCOVA
4. Statistical analysis by multivariate (MV) modelsa. Overview of MV statisticsb. Search for structure (no a priori sample or variable structure)c. Samples fall into a priori groupsd. Variables fall into a priori groups (responses, predictors, covariates, - -)e. Interpretation of MV data and analyses of themf. Interesting new methods from the Plymouth-Auckland-Montreal
-Netherlands networkg. Interesting new methods – the UK, Canada, Australia Reference
Condition Approach

5. Wrap-up of statistical analysis in environmental studies:a. Examples (RHG’s)b. Case Studies (attendees’)c. Discussion


Statistical approaches to environmental study data
1. Introduction2. General principles and review of environmental study designsa. Logical flow: Question => Hypotheses => Model => Study design
=> Tests of hypotheses => Interpretationb. Reference sites, reference conditions (see section 4 on MV analysis)c. Hypothesis testing - why & howd. Choice of sampling method and sample unit sizee. Estimating necessary number of samplesf. Allocation of sampling effort in space and timeg. Spatial pattern, statistical assumptions & transformation of variablesh. ANOVA designs - random, paired, nested, factorial (e.g. BACI designs)i. Criteria for choice of response variable(s)j. Specialized methods: sequential sampling; mark-recapture and removal
estimates; artificial substrates; field transplant experiments; EMAP; Bayesian methods and other fads

Robust tests of hypotheses

Concern about validity of hypothesis testing using standard parametric statistical methods on real data is widespread. To some extent this is mistaken, as is the emphasis on non-normality as the violation of assumptions that is of greatest concern. The Central Limit Theorem says that the means of random samples from most non-normal distributions

will tend to be normally distributed, and in any case moderate non-normality is not the biggest concern. Correlated errors (non-independent observations) are the most serious but random sampling will usually prevent it. Heterogeneity of variance is the next biggest concern and non-normality is of least concern.

According to Harris (1985) you needn’t worry about moderate violations of the normality and heterogeneity of variance assumptions in overall ANOVA F-tests as long as sampling was random, you have a balanced design, and at least 10 error df. To be safe I like to have 20 error df, myself.

For those who are concerned with the effects of violations of assumptions on parametric tests, the old nonparametric tests (which had to be derived for each design e.g. 2-group t-tests) have largely been replaced by randomization or permutation tests which are simple in principle and more general in application.

In essence one generates a null hypothesis distribution by randomizing one’s own data across all or part of the design and calculating the test statistic (e.g. an F-value), then doing this many times. The only problem has to do with exactly what is randomized and what is held fixed in a given design, and this arises especially in tests of interaction.

There have been several “false starts” in the application of such tests for testing interactions in factorial ANOVA designs – such as the BACI design. Recent work by M.J. Anderson and co-workers (e.g.Legendre and Anderson 1999; Anderson 2001a, 2001b; McArdle and Anderson 2001; Anderson and ter Braak 2003) have solved this problem

and more generally opened up the potential for linear model analyses based on distance matrices, including both univariate and multivariate analyses and tests. A particularly interesting new approach is the use of multivariate control charts for ecological and environmental monitoring (Anderson and Thompsonin Ecological Applications).

Statistical approaches to environmental study data
1. Introduction2. General principles and review of environmental study designsa. Logical flow: Question => Hypotheses => Model => Study design
=> Tests of hypotheses => Interpretationb. Reference sites, reference conditions (see section 4 on MV analysis)c. Hypothesis testing - why & howd. Choice of sampling method and sample unit sizee. Estimating necessary number of samplesf. Allocation of sampling effort in space and timeg. Spatial pattern, statistical assumptions & transformation of variablesh. ANOVA designs - random, paired, nested, factorial (e.g. BACI designs)i. Criteria for choice of response variable(s)j. Specialized methods: sequential sampling; mark-recapture and removal
estimates; artificial substrates; field transplant experiments; EMAP; Bayesian methods and other fads

Proof that sampling an aggregated spatial distribution with a smaller sample unit sizecauses the sample distribution to approach a random (non-aggregated) distribution
1. Use the negative binomial distribution as a model of spatial distributions ranging from very aggregated to random.
2. The negative binomial distribution fits most organism spatial distributions very well.
3. In the negative binomial distribution the relationship between the variance and the mean is: s2 = m + m2 , or re-arranged, s2 = 1 + m
k m k 4. Thus s2/m = 1 (random i.e. Poisson distribution) if m/k = 0 ,
which will be true if k → ∞ (it really is a random variable)or if m → 0 (e.g. sample unit size is very small)
5. Therefore, given an aggregated distribution to be sampled (k is small i.e. less than 10), the way to reduce the s2/m ratio (to get it down toward s2/m = 1 which characterizes a random distribution) is to reduce m by using a small sample unit size, and taking lots of samples so the total area sampled is what you want it to be.

Statistical approaches to environmental study data
1. Introduction2. General principles and review of environmental study designsa. Logical flow: Question => Hypotheses => Model => Study design
=> Tests of hypotheses => Interpretationb. Reference sites, reference conditions (see section 4 on MV analysis)c. Hypothesis testing - why & howd. Choice of sampling method and sample unit sizee. Estimating necessary number of samplesf. Allocation of sampling effort in space and timeg. Spatial pattern, statistical assumptions & transformation of variablesh. ANOVA designs - random, paired, nested, factorial (e.g. BACI designs)i. Criteria for choice of response variable(s)j. Specialized methods: sequential sampling; mark-recapture and removal
estimates; artificial substrates; field transplant experiments; EMAP; Bayesian methods and other fads


Environmental study design and the ability
to detect impacts:Studies after the
Exxon Valdezoil spill
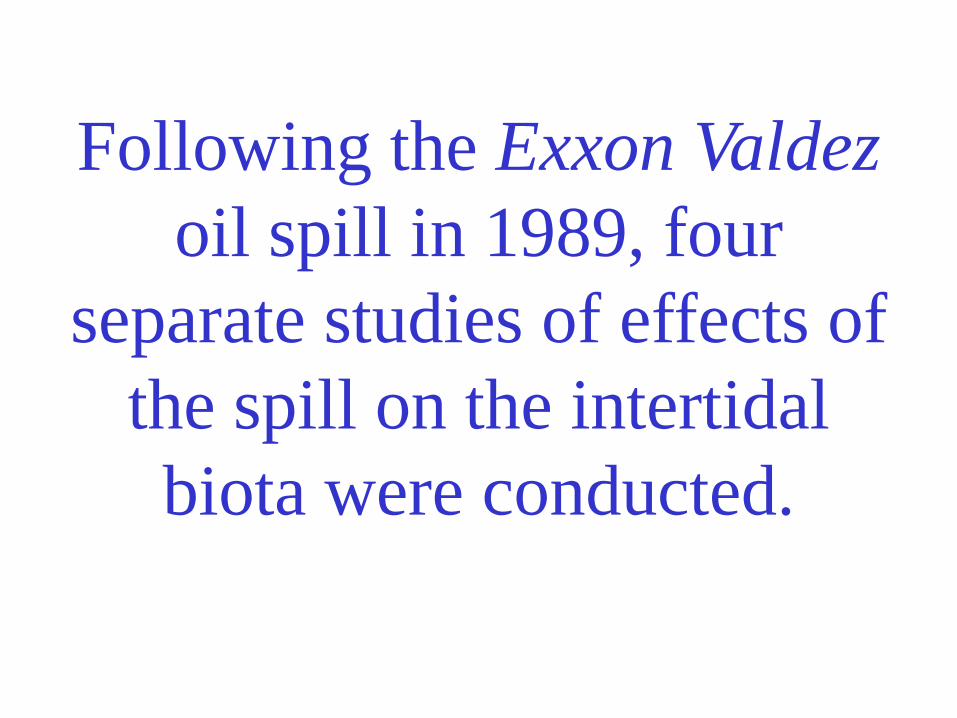
Following the Exxon Valdezoil spill in 1989, four
separate studies of effects of the spill on the intertidal biota were conducted.

SEP (Shoreline Ecology Program) Exxon- stratified random design
GOA (Gulf of Alaska shores) Exxon- subjective choice of sites
CHIA (Coastal Habitat Injury Assessment)- stratified random design Trustee
Council
NOAA (NOAA Hazmat Program) NOAA- subjective choice of sites

Despite many common goals, the studies differed in:
1. Sampling effort
2. Analytical methodology, and
3. Choice of biological response variables

Peterson, C. H., L. L. McDonald, R. H. Green, and W. P. Erickson. 2001. Sampling design begets conclusions: the statistical basis for detection of injury to and recovery of shore-line communities after the ‘Exxon Valdez’ oil spill. Mar. Ecol. Progr. Ser. 210: 255-283.
Gilfillan, E. S. 2002. Comment on Peterson et al. ‘Sampling design begets conclusions’ (COMMENT). Mar. Ecol. Progr. Ser. 231: 303-308.
Peterson, C. H., L. L. McDonald, R. H. Green, and W. P. Erickson. 2002. The joint consequences of multiple components of statistical sampling designs (REPLY COMMENT). Mar. Ecol. Progr. Ser. 231: 309-314.

(Outline: Environmental study design – principles and examples)
A. Principles of study design, with examples5. Allocation of sampling effort in space and time
a. Importance of balanced designs
b. Importance of avoiding confounding with natural spatial and temporal pattern
c. The problem of spatial or temporal autocorrelation

Statistical approaches to environmental study data
1. Introduction2. General principles and review of environmental study designsa. Logical flow: Question => Hypotheses => Model => Study design
=> Tests of hypotheses => Interpretationb. Reference sites, reference conditions (see section 4 on MV analysis)c. Hypothesis testing - why & howd. Choice of sampling method and sample unit sizee. Estimating necessary number of samplesf. Allocation of sampling effort in space and timeg. Spatial pattern, statistical assumptions & transformation of variablesh. ANOVA designs - random, paired, nested, factorial (e.g. BACI designs)i. Criteria for choice of response variable(s)j. Specialized methods: sequential sampling; mark-recapture and removal
estimates; artificial substrates; field transplant experiments; EMAP; Bayesian methods and other fads

Confounding is a problem in all observational studies. That is, levels of design components which are intended to represent impact effects or degree of impact may coincide with natural differences or gradients. When this occurs an apparent impact effect may be due to natural variation.

Confounding may occur with a spatial component (impacted sites may differ from unimpacted sites on natural environmental variables) or a temporal component (the climate may change over the same time when the impact begins). In each of the three cases examples of confounding will be given.

Exxon Valdez oilspill

Caribbean oilspill -coast of Panama

Gulf of Mexico offshore oil & gas


Depth and Historicaldistance contaminant Biological
Platform from shore * Longitude discharges impacts___________________________________________________________________
MAI-686 Shallow/Near Western-most Least Least
MU-A85 Mid/Mid Mid Mid Mid
HI-A389 Deep/Far Eastern-most Most Most
___________________________________________________________________
* and related sediment, temperature, current, etc.
Confounding of among-Platform component of GOOMEX design

Statistical approaches to environmental study data
1. Introduction2. General principles and review of environmental study designsa. Logical flow: Question => Hypotheses => Model => Study design
=> Tests of hypotheses => Interpretationb. Reference sites, reference conditions (see section 4 on MV analysis)c. Hypothesis testing - why & howd. Choice of sampling method and sample unit sizee. Estimating necessary number of samplesf. Allocation of sampling effort in space and timeg. Spatial pattern, statistical assumptions & transformation of variablesh. ANOVA designs - random, paired, nested, factorial (e.g. BACI designs)i. Criteria for choice of response variable(s)j. Specialized methods: sequential sampling; mark-recapture and removal
estimates; artificial substrates; field transplant experiments; EMAP; Bayesian methods and other fads

The use of Taylor’s Power Law (TPL) to choose a transformation
1. Why transform?a. To linearize bivariate relationshipsb. To reduce heterogeneity of variance
2. Can heterogeneity be reduced? Yes, if the within-group variance is a function of the within-group mean.
3. What transformation should be used? If you know the functional relationshipbetween the variance and the mean, then you can determine whattransformation would eliminate that relationship. For example, if the varianceis proportional to the mean apply the square root transformation. If the varianceis proportional to the square of the mean apply the log transformation.
4. How can the functional relationship between the variance s2 and the mean m in aset of data be determined? Apply the TPL model: s2 = A mb => log s2 = a + b log m , where a = log A. Calculate s2 and m for each group. Plot log s2 vs.log m , do the linear regression to estimate b . The appropriate transformation is Z = X1-½b , unless b=2 in which case use the Z = log X transformation.

Statistical approaches to environmental study data
1. Introduction2. General principles and review of environmental study designsa. Logical flow: Question => Hypotheses => Model => Study design
=> Tests of hypotheses => Interpretationb. Reference sites, reference conditions (see section 4 on MV analysis)c. Hypothesis testing - why & howd. Choice of sampling method and sample unit sizee. Estimating necessary number of samplesf. Allocation of sampling effort in space and timeg. Spatial pattern, statistical assumptions & transformation of variablesh. ANOVA designs - random, paired, nested, factorial (e.g. BACI designs)i. Criteria for choice of response variable(s)j. Specialized methods: sequential sampling; mark-recapture and removal
estimates; artificial substrates; field transplant experiments; EMAP; Bayesian methods and other fads

(Outline: Environmental study design – principles and examples)
A. Principles of study design, with examples7. ANOVA designs – random, paired, nested, factorial
a. Building designs & determining appropriate errors for tests
b. Approaches to matching sites in paired designs
c. Repeated measures designs
d. One reference group of sites – testing “outliers”


3000m
1000m
500m
250mEW
N
S
•

Gulf of Mexico oil/gas platforms: 3 Platforms, 4 Times, 5 Distances, 5 Radii
Model: Y = P T R(P) T*R D T*P P*D D*R D*T P*D*T D*T*RR is random (R); P, T and D are fixed (F).
Row Source Degrees of freedom F or R Test vs. row
1 P (3-1) = 2 F 22 R(P) (5-1)3 = 12 R (7+8) - 113 D 5-1 = 4 F 74 T 4-1 = 3 F 85 P*D (3-1)(5-1) = 8 F 76 P*C (3-1)(4-1) = 6 F 87 D*R(P) (5-1)(5-1)3 = 48 R 118 T*R(P) (4-1)(5-1)3 = 36 R 119 D*T (5-1)(4-1) = 12 F 1110 P*D*T (3-1)(5-1)(4-1) = 24 F 1111 D*T*R(P) (5-1)(4-1)(5-1)3 = 144 R 1212 Rep. error 3*4*5*5*(1-1) = 0
Total 3*4*5*5*1 - 1 = 299
Comments:* For one Platform rows with P (rows #1, 5, 6,10) drop out* This example is with no replication, so D*T*R(P) (row #11) can't be tested.* Anything with R in it is a Random effect and can be used as an error term* Highest level interactions must be tested first, I.e. rows # 10 & 11, then 5-9, then 1-4.

GULF OF MEXICO OFFSHORE OPERATIONS MONITORING EXPERIMENT
8 papers in Can. J. Fish. Aquat. Sci. 53(11), Nov 1996
- Kennicutt et al “ - - (GOOMEX), Phase I: Sublethalresponses to contaminant exposure – introduction andoverview” pp.2540-2553
- Kennicutt et al “Geochemical patterns in sediments near offshore production platforms” pp.2554-2566
- Montagna and Harper “Benthic infaunal long-termresponse to offshore production platforms in the Gulf ofMexico” pp.2567-2588
- Ellis et al “Effects of gas-producing platforms on continental shelf macroepifauna in the northwestern Gulf of Mexico: abundance and size structure” pp.2589-2605

- McDonald et al “Sublethal detoxification responses tocontaminant exposure associated with offshore productionplatforms” pp.2606-2617
- Carr et al “Sediment porewater toxicity assessment studiesin the vicinity of offshore oil and gas production platformsin the Gulf of Mexico” pp.2618-2628
- Green and Montagna “Implications for monitoring: study designs and interpretation of results” pp.2629-2636
- Peterson et al “Ecological consequences of environmentalperturbations associated with off shore hydrocarbon production: a perspective on long-term exposures in the Gulf of Mexico” pp.2637-2654

Spatial and temporal componentsinteract slightly e.g. seasonalvariation in current direction orspeed.
For example in the GOOMEXstudy current directions variedseasonally, and at any given time differed among platforms. Thus R is nested within P, not crossed withP, and random since directions arearbitrary like spokes on a wheel.


Pooling field samples• Benefits from pooling field samples• What’s lost in pooling field samples• How much does what’s lost matter?• Two examples:
- Exxon Valdez oil spill study- Alberta tar sands project

Hierarchical designs• Examples• Rules for testing hypotheses• Sokal & Rohlf’s criterion for
pooling variances

Repeated measures designs
• Rationale and history• Two approaches• Power of hypothesis tests• Examples and complex RM designs

A simple repeated measures design example
Suppose two treatment levels (oiled and unoiled) with three replicates (patch reefs) at each level. No doubt there is replicate quadrat sampling within each reef, but that level of replication provides a characterization of each reef (reef = the statistical replicate) and doesn’t otherwise enter the statistical analysis. Sampling is repeated at two times. The response variable data, in tabular and graphical form, follow.
Trt. Level time 1 time 2 differenceunoiled 2 1 -1unoiled 1 0 -1unoiled 3 1 -2oiled 2 4 2oiled 1 3 2oiled 3 4 1

The repeated measures ANOVA on the response variable Y
Source df SS MS FAmong reefsOiled vs. unoiled 1 6.75 6.75 5.79 ns
(trts)Among reefs 4 4.67 1.17 Error 1
within trtsWithin reefs
Times 1 0.08 0.08 0.050 nsTrts x times 1 6.75 6.75 40.50 **Times x reefs 4 0.67 0.17 Error 2
within trts
A 1-way ANOVA (or could be a t-test) on the response variable “difference”
Source df SS MS F tOiled vs. unoiled diff. 1 13.50 13.50 40.50 ** sqrt(40.50)Among reefs w. trts diff. 4 1.33 0.33 Error

(Outline: Environmental study design – principles and examples)
A. Principles of study design, with examples9. BACI designs
a. Origin and basics
b. The subsequent history including diversions
c. BACI designs for special cases
d. Beyond BACI

Interaction of spatial and temporal components in
environmental monitoring designs
Roger H. Green

Detection of spatial x temporal interaction is fundamental to impact assessment and monitoring. A simple example would be a change for the worse in environment and biological community near a coastal outfall, with no such change in similar areas away from the outfall.

From a design and statistical point of view this implies some kind of BACI design (Green 1979), a factorial design representing Before vs After impact times crossed with one or more Control areas vs an Impacted area. The next slide shows a diagrammatic representation of a BACI design.

n=5 n=5
n=5 n=5
Before
After
Impact Control(s)
- - -
- - -
Space
Time

It is the statistical test for interaction (where the Y variable is a pollutant concentration or an indicator species) that provides evidence of impact. The following ANOVA table illustrates the design and the test for interaction in the situation where there is 1 Control area.

Between B & Atimes
2-1=1
BetweenC & I areas
2-1=1
C-I x B-A interaction
(2-1)(2-1)= 1
To be tested
Among sampleswithin areas ×
2x2(5-1)= 16 Error
Total 2x2x5 - 1= 19
Source df SS MS F
2 times (B & A), 2 areas (C & I), n=5 samples in eacharea at each time

Significant main effects do not provide such evidence. A change between times that occurs in both Control and Impact areas suggests a general change in the natural environment, perhaps a climatic change. For example a 1980s monitoring study of California offshore oil & gas drilling was confounded with a climate change (wet to dry) at the time drilling began.

Thus a Before-to-After change near an outfall means little unless there are Control (often called Reference) areas away from the outfall which do not show the change. Natural variation over time would be a sufficient explanation.

Similarly, a difference between the Control areas and the Impact area at both times suggests natural environment differences that were not apparent when the areas were assigned to the Control and Impact categories.

Therefore it is the spatial-temporal interaction that tells the tale.
Statistically significant main effects mean nothing beyond the obvious fact that the natural world is variable in space and in time.

Hurlbert (1984) criticized Green’s (1979) simplest BACI design as an example of what he called “pseudo-replication”. Statisticians had in fact been aware of the problem without having bothered to invent a new term for it, instead saying things like “it is the wrong design scale from which to derive an appropriate error term for testing the interaction term”.

Hurlbert and others focused on Green’s worked example for a BACI design, which was for the simplest case (2 times and 2 areas leading to a 2 x 2 factorial ANOVA with the only possible error being the sample variation). They ignored or didn’t read the text of the chapter which emphasized the desirability of having more than one Control area.

With more than one Control area it is possible to estimate variation on the scale of “among Control areas”. Since this is the same spatial scale as that for Control vs. Impact areas, an error term can be derived which is commensurate with the effect being tested (the impact-related spatial x temporal interaction).

The following ANOVA table illustrates the design and the test for interaction in the situation where there are 3 Control areas. The rows marked with an asterisk are the same as the rows in the ANOVA table for the “1 Control area” design.

Between times 2-1= 1
Among areas 4-1= 3
Between C & I areas 2-1= 1
Among C areas 3-1= 2 Areas x times int’n 1x3= 3
C-I x B-A int’n 1x1= 1 To betested
Among C areas x B-A int’n 2x1= 2 Error 2
Among samples - - - 2x4x4= 32
“ “ within B-A x C-I 2x2x4= 16 Error 1
“ “ within B-A x C areas 2(4-2)(5-1) = 16
Total 2x4x5-1= 39
Source df SS MS F
*
*
*
*
With 3 C areas

Statistical approaches to environmental study data
1. Introduction2. General principles and review of environmental study designsa. Logical flow: Question => Hypotheses => Model => Study design
=> Tests of hypotheses => Interpretationb. Reference sites, reference conditions (see section 4 on MV analysis)c. Hypothesis testing - why & howd. Choice of sampling method and sample unit sizee. Estimating necessary number of samplesf. Allocation of sampling effort in space and timeg. Spatial pattern, statistical assumptions & transformation of variablesh. ANOVA designs - random, paired, nested, factorial (e.g. BACI designs)i. Criteria for choice of response variable(s)j. Specialized methods: sequential sampling; mark-recapture and removal
estimates; artificial substrates; field transplant experiments; EMAP; Bayesian methods and other fads

Choose appropriate response variables
• should clearly and directly relate to the question and hypotheses
• accurate measurements should be easy, cheap, fast, and reliable
• should not be much influenced by extraneous factors

Kinds of response variables
• a variable which is important itself
• a surrogate variable for an important but hard-to-measure variable
• a synthetic variable representing an abstract concept

(Outline: Environmental study design – principles and examples)
A. Principles of study design, with examples10. Specialized methods
a. Sequential sampling decision making
b. Mark-recapture and removal estimates
c. Using more than one sampler type
d. Artificial substrates
e. Field transplant experiments
f. EMAP, Risk Analysis, and other current fads

Biotic indicesAuclair 1971Bergen et al 2000Engle & Summers 1999Fore et al 1994Grassle & Smith 1976Hilsenhoff 1987, 1988Hurlbert 1971Jackson 1997Karr 1991, 1993Karr & Chu 1999
Kerans & Karr 1994Maznah & Mansor 1999Maurer et al 1999Macauley et al 1999Patrick 1963Royer etal 2001Smith et al 2001Smith 2002Smith & Grassle 1977Wilm & Dorris 1968

Smith, RW, et al
In: Benthic response index for assessing infaunal communities on the southern California mainland shelf. Ecological Applications 11: 1073-1087, 2001
- - We present an objective, quantitative index for application throughout the southern California coastal shelf environment that measures the condition of a benthic assemblage, with defined thresholds for levels of environmental disturbance. The index was calculated using a two-step process in which ordination analysis was employed to quantify a pollution gradient within a 717-sample calibration data set. The pollution tolerance of each species was determined based upon its distribution of abundance along the gradient. The index is calculated as the abundance-weighted average pollution tolerance of species in a sample. Thresholds were established for reference condition as well as for four levels of biological response.

Statistical approaches to environmental study data
1. Introduction2. General principles and review of environmental study designsa. Logical flow: Question => Hypotheses => Model => Study design
=> Tests of hypotheses => Interpretationb. Reference sites, reference conditions (see section 4 on MV analysis)c. Hypothesis testing - why & howd. Choice of sampling method and sample unit sizee. Estimating necessary number of samplesf. Allocation of sampling effort in space and timeg. Spatial pattern, statistical assumptions & transformation of variablesh. ANOVA designs - random, paired, nested, factorial (e.g. BACI designs)i. Criteria for choice of response variable(s)j. Specialized methods: sequential sampling; mark-recapture and removal
estimates; artificial substrates; field transplant experiments; EMAP; Bayesian methods and other fads


Bayesians / risk assessment
Dennis 1996Suter 1996


Dennis, Brian. 1996. Discussion: Should ecologists become Bayesians? Ecol. Appl. 6 (4):1095-1103.
Bayesian statistics involve substantial changes in the methods and philosophy of science. Before adopting Bayesian approaches, ecologists should consider carefully whether or not scientific understanding will be enhanced. Frequentist statistical methods, while imperfect, have made an unquestioned contribution to scientific progress and are a workhorse of day-to-day research. Bayesian statistics, by contrast, have a largely untested track record. The papers in this special section on Bayesian statistics exemplify the difficulties inherent in making convincing scientific arguments with Bayesian reasoning.


3. Statistical analysis by univariate modelsa. Review of regression analysis models and General Linear Modelsb. Linear and nonlinear models in biology and ecologyc. Applications of Analysis of Covariance (ANCOVA) modelsd. How to do ANOVA and ANCOVA by regression, with dummy variablese. Interpretation of results, especially of interactions in ANOVA & ANCOVA
4. Statistical analysis by multivariate (MV) modelsa. Overview of MV statisticsb. Search for structure (no a priori sample or variable structure)c. Samples fall into a priori groupsd. Variables fall into a priori groups (responses, predictors, covariates, - -)e. Interpretation of MV data and analyses of themf. Interesting new methods from the Plymouth-Auckland-Montreal
-Netherlands networkg. Interesting new methods – the UK, Canada, Australia Reference
Condition Approach

Bernstein, B.B. and R.W. Smith
In: Community approaches to monitoring. Marine Technology Society. 3:934-939, 1986. Washington, D.C. (Oceans ’86)
“Actual marine monitoring data show that the variability of single species can be so great that very high numbers of samples are often required to detect even very large changes. Derived variables can also be ambiguous indicators of the direction of biological change. In contrast, multivariate techniques directly compare species composition across all samples. They contain more information about community patterns, and can be more sensitive and statistically powerful indicators of change than the parameters described above.”

Can multivariate statistical methods be used effectively & unambiguously for describing effects e.g. at the level of the biological community?
Multivariate statistical analysis is often more powerful than univariate statistics with correlated response variables. However the results require more careful interpretation and it is sometimes too easy to see what you are looking for. Detection of effects using descriptive MV techniques should be convincing to you and also to your most skeptical colleague.

3. Statistical analysis by univariate modelsa. Review of regression analysis models and General Linear Modelsb. Linear and nonlinear models in biology and ecologyc. Applications of Analysis of Covariance (ANCOVA) modelsd. How to do ANOVA and ANCOVA by regression, with dummy variablese. Interpretation of results, especially of interactions in ANOVA & ANCOVA
4. Statistical analysis by multivariate (MV) modelsa. Overview of MV statisticsb. Search for structure (no a priori sample or variable structure)c. Samples fall into a priori groupsd. Variables fall into a priori groups (responses, predictors, covariates, - -)e. Interpretation of MV data and analyses of themf. Interesting new methods from the Plymouth-Auckland-Montreal
-Netherlands networkg. Interesting new methods – the UK, Canada, Australia Reference
Condition Approach

3000m
1000m
500m
250mEW
N
S
•

Gulf of Mexico oil/gas platforms: 3 Platforms, 4 Times, 5 Distances, 5 Radii
Model: Y = P T R(P) T*R D T*P P*D D*R D*T P*D*T D*T*RR is random (R); P, T and D are fixed (F).
Row Source Degrees of freedom F or R Test vs. row
1 P (3-1) = 2 F 22 R(P) (5-1)3 = 12 R (7+8) - 113 D 5-1 = 4 F 74 T 4-1 = 3 F 85 P*D (3-1)(5-1) = 8 F 76 P*C (3-1)(4-1) = 6 F 87 D*R(P) (5-1)(5-1)3 = 48 R 118 T*R(P) (4-1)(5-1)3 = 36 R 119 D*T (5-1)(4-1) = 12 F 1110 P*D*T (3-1)(5-1)(4-1) = 24 F 1111 D*T*R(P) (5-1)(4-1)(5-1)3 = 144 R 1212 Rep. error 3*4*5*5*(1-1) = 0
Total 3*4*5*5*1 - 1 = 299
Comments:* For one Platform rows with P (rows #1, 5, 6,10) drop out* This example is with no replication, so D*T*R(P) (row #11) can't be tested.* Anything with R in it is a Random effect and can be used as an error term* Highest level interactions must be tested first, I.e. rows # 10 & 11, then 5-9, then 1-4.

3. Statistical analysis by univariate modelsa. Review of regression analysis models and General Linear Modelsb. Linear and nonlinear models in biology and ecologyc. Applications of Analysis of Covariance (ANCOVA) modelsd. How to do ANOVA and ANCOVA by regression, with dummy variablese. Interpretation of results, especially of interactions in ANOVA & ANCOVA
4. Statistical analysis by multivariate (MV) modelsa. Overview of MV statisticsb. Search for structure (no a priori sample or variable structure)c. Samples fall into a priori groupsd. Variables fall into a priori groups (responses, predictors, covariates, - -)e. Interpretation of MV data and analyses of themf. Interesting new methods from the Plymouth-Auckland-Montreal
-Netherlands networkg. Interesting new methods – the UK, Canada, Australia Reference
Condition Approach

Linking biota with environment
Green & Vascotto 1978Green et al 1993Jackson 1995Jackson & Harvey 1993Legendre & Gallagher 2001Long & Chapman 1985Makarenkov & Legendre 2002Mantel 1967, 1970Schoneman & Carol 1979Ter Braak 1986
Chapman et al 1987Chapman 1996Chapman et al 1997Clarke & Ainsworth 1993Clarke & Warwick 1994aDouglas & Endler 1982Field et al 1982Green 1979, 1993aGreen & Montagna 1996

Non-parametric MV
Anderson 2001Clarke & Warwick 1994a&bLegendre & Anderson 1999McArdle & Anderson 2001

3. Statistical analysis by univariate modelsa. Review of regression analysis models and General Linear Modelsb. Linear and nonlinear models in biology and ecologyc. Applications of Analysis of Covariance (ANCOVA) modelsd. How to do ANOVA and ANCOVA by regression, with dummy variablese. Interpretation of results, especially of interactions in ANOVA & ANCOVA
4. Statistical analysis by multivariate (MV) modelsa. Overview of MV statisticsb. Search for structure (no a priori sample or variable structure)c. Samples fall into a priori groupsd. Variables fall into a priori groups (responses, predictors, covariates, - -)e. Interpretation of MV data and analyses of themf. Interesting new methods from the Plymouth-Auckland-Montreal
-Netherlands networkg. Interesting new methods – the UK, Canada, Australia Reference
Condition Approach

Below-MDL values:- what they are- how should datasets including
them be treated?
Roger H. Green (presenting) PWSRCACJohn M. Kennish “John S. French (present) “Joseph W. Banta “

Prince William Sound Regional Citizens’ Advisory Council (PWSRCAC) conducts a long term environmental monitoring program mandated by the US Oil Pollution Act of 1990 (aka “OPA90”). The analytical data from this study are often above instrumental detection limits but are near or below the method detection limits (MDL).

Other studies suggest the possible environmental relevance of PAH contaminants at these levels. This has prompted PWSRCAC to consider the use of “below-MDL” data in both univariate analysis and multivariate pattern recognition.

These considerations include:
- What value should be used in place of “below-MDL” for calculation of means and other summary statistics and for doing hypothesis-testing univariate statistics?

- Is descriptive statistics, e.g. patternrecognition by multivariate analysis,valid with data which include “below-MDL” values? Might this lead tomisinterpretation of low concentrationPAH frequencies in a pattern analysis? How is such a multivariate analysis best done?

- What is “standard practice” regarding all of this, for the US and Canada?
- What has been suggested by statisticians that is not (yet) adopted as standard practice?

What is the Method Detection Limit (MDL)?U.S. EPA (40 CFR Part 136 Appendix B)
A minimum of seven spiked blanks are prepared and taken through the entire preparation and analysis method. Spikes for each target analyte are added at concentrations of one to five times the estimated MDL for each target analyte. The MDL is calculated as the standard deviation for the analyzed value times the Students’ t-value (3.14 for seven spiked samples).
Note that MDLs are intended for analysis of individual analytes

Some questions I have:- The logic is apparently that MDL should be significantly different from 0.- But why is N “at least 7”? Why not more? Why not >7 sufficient to give “large” df for t, so that t => sigma (i.e. the st.dev. Is “known”)?- Why isn’t the t evaluated 1-tailed? Shouldn’t it be? If the H0 is that the value is 0 and the HAis that it is >0, then isn’t that 1-tailed.?

Above MDL levelsRelative PAH concentrations in
four environmental samples
mg/
kgm
g/kg
Fresh Alaska North Slope Crude (ANS)
Weathered ANS from LTEMP
Particulate/oil droplet signal in mussel tissue
Dissolved phase signal in mussel tissue

Near MDL levels
Similarities and differences in relative PAH concentrations found in mussel tissue from two nearby LTEMP sites (Valdez Marine Terminal & Gold Creek) taken two months after a “sheening incident” at the Valdez Marine Terminal-BWTF.
Blue diamonds indicate the MDL for each PAH.
Note the patterns are similar but not identical.

Below MDL levels
Similarities and differences in relative PAH concentrations during 2004 & 2005 at the LTEMP Disk Island site.
The blue diamonds represent the MDL for each of the PAHs.
Are these patterns the same or different?
How should the data be treated?

EPA guidelines (1989, 1996):It says there is no real standard protocol for
below-MDL values, to use judgment, consult a statistician. You can’t just leave out below-MDL values and use the above-MDL values (bias). Some guidelines are given (applying to both univariate and multivariate statistics). MLE methods are biased if N<20.

- For <15% below-MDL values substitute MDL/2 and proceed with ordinary parametric statistics. Maybe use Cohen’s MLE method.
- For 15-50% below-MDL values use nonparametric (e.g. rank-based) statistics. Maybe use Cohen’s MLE method.
- For >50% below-MDL values just determinedetectable or not, test proportions, use stats for binary data (+/-, 1/0 etc.)

For simple substitution, is MDL/2 the best value to substitute for below-MDL values? Substituting MDL would be conservative (yield high mean values) whereas making all below-MDL values 0 would yield low mean values. Is MDL/2 the best compromise? I suggest that 0.71*MDL is a good choice – see next two slides.

f
00 [conc]MDLS
fMDL
fS
Find S as a fn of MDL such that the area of the 0-MDL-fMDLright triangle is divided in half.
Answer:S = sqrt(½) * MDL
= 0.707107 * MDL S = 0.71 * MDL

f
00 [conc]MDLS
fMDL
fS
If the trend of f at < MDL is concave instead of linear (e.g. like the left tail of a normal distribution), then S will be > 0.71
If the trend of f at < MDL is convex instead of linear (e.g. like the left side of a Poisson distribution piled up against 0), then S will be < 0.71

3. Statistical analysis by univariate modelsa. Review of regression analysis models and General Linear Modelsb. Linear and nonlinear models in biology and ecologyc. Applications of Analysis of Covariance (ANCOVA) modelsd. How to do ANOVA and ANCOVA by regression, with dummy variablese. Interpretation of results, especially of interactions in ANOVA & ANCOVA
4. Statistical analysis by multivariate (MV) modelsa. Overview of MV statisticsb. Search for structure (no a priori sample or variable structure)c. Samples fall into a priori groupsd. Variables fall into a priori groups (responses, predictors, covariates, - -)e. Interpretation of MV data and analyses of themf. Interesting new methods from the Plymouth-Auckland-Montreal
-Netherlands networkg. Interesting new methods – the UK, Canada, Australia Reference
Condition Approach

Design and Analysis of Monitoring and Experiments for Environmental Scientists
Ravenna, March 2003
Dr Marti Jane AndersonDepartment of Statistics, University of Auckland
Multivariate control charts forecological and environmental monitoring

Sequential methods andcontrol charts
• Used historically in industrial and engineering applications.
• General idea is to take repeated measurements through time of a system’s output (e.g. the diameter on a spool of thread being produced in a factory).
• Provide a way of identifying when a system is going “out of control” – trigger alarm – stop the system – employ remedial measures.

Plot a measure of a random process through time. Compare with lower and upper bounds (e.g. mean from a “run in” period + 3σ).
Time
“target” value
Varia
ble
X
lower bound
upper bound
Control Chart(Shewart 1931, Wald 1947, Wetherill 1975, Montgomery 1996)
CUSUM = plot the sum of deviations of successive observations from the target value.

Sequential methods in environmental monitoring
• Green (1979) suggested the use of sequential methods for environmental monitoring.
• Sequential methods have been used with physical or chemical environmental variables– Vaughan and Russell 1983, Manly and Gonzalez 1994,
MacNally and Hart 1997, Manly and Mackenzie 2000.• Very few examples of their use with biological
populations or communities– Schipper et al. 1997– Pettersson 1998 (Hotelling’s T2)

Why not use control charts for monitoring communities?
• Species abundances are rarely (if ever) normally distributed.
• Ecologists often monitor whole sets of species simultaneously – sequential methods not generally designed for use with multivariate data.
• Traditional multivariate statistical criteria are not robust to departures from assumptions of normality.
• YET - Monitoring whole communities can give insights into consequences of pollution (Underwood and Peterson 1988) and is more sensitive than indicator variables or other univariate measures (such as diversity indices, e.g. Clarke 1993).

Clarke & Warwick’s structural redundancy/tax. distinctiveness
Clarke & Warwick 1998a, 1998bWarwick & Clarke 1995, 1998

3. Statistical analysis by univariate modelsa. Review of regression analysis models and General Linear Modelsb. Linear and nonlinear models in biology and ecologyc. Applications of Analysis of Covariance (ANCOVA) modelsd. How to do ANOVA and ANCOVA by regression, with dummy variablese. Interpretation of results, especially of interactions in ANOVA & ANCOVA
4. Statistical analysis by multivariate (MV) modelsa. Overview of MV statisticsb. Search for structure (no a priori sample or variable structure)c. Samples fall into a priori groupsd. Variables fall into a priori groups (responses, predictors, covariates, - -)e. Interpretation of MV data and analyses of themf. Interesting new methods from the Plymouth-Auckland-Montreal
-Netherlands networkg. Interesting new methods – the UK, Canada, Australia Reference
Condition Approach


Reference sitesBailey et al June 1996Bailey et al 1998Bailey et al 2004 Charvet et al 2000Green 1979 p.201-205Hartig et al 1997Reynoldson 1997Reynoldson et al 1995Reynoldson et al 2001

5. Wrap-up of statistical analysis in environmental studies:a. Examples (RHG’s)b. Case Studies (attendees’)c. Discussion