statistical inference for masked data
TRANSCRIPT

Nonlinear Analysts. Theory. Methods &Applications, Vol. 30, No. 7. pp. 4425-4432. 1997 Proc. 2nd World Congress of Nonlinear Analysts
0 1997 Elsevier Science Ltd
PII: SO362.546X(W)OO322-2
Printed in Great Britain. All rights reserved 0362-546X197 $17.00 + 0.00
STATISTICAL INFERENCE FOR MASKED DATA
BENJAMIN REISERt, EMMANUEL YASHCHINI and BETTY J. FLEHINGERS
tDepartment of Statistics, University of Haifa, Haifa, Israel SIBM Research Division, Mathematical Sciences Department, Thomas J. Watson Research Ctr.,
P.O. Box 218, Yorktown Heights, NY 10598, USA
Key words and phrases: Competing causes, Kaplan-Meier, Proportional Hazards, Reliability
1. INTRODUCTION
Consider a computing module consisting of k components (chips), mounted on a ceramic substrate. The leads of each chip are attached to pads on the substrate and electrical connection is obtained between chips through wires running in the substrate. Each device is subject to an extensive test. A defect in any component causes the module to fail. I f a module fails, test procedures restrict the cause to some subset of the components. If this subset consists of more than one component, it is called a masking group. This occurs due to lack of proper diagnostic equipment, cost and time constraints and the destructive nature of certain component failures making exact diagnosis difficult. Standard procedure is to perform a “multiple pull” that replaces the entire masking group. This is costly; leading to waste of chips and labor. Given such masked data we would like to: provide inference on the component reliabilities and for a given masked set try to infer which component is the culprit. Analogous problems relate to diagnosis of disease when observed symptoms might be due to different physical conditions or to determining which automobile part should be replaced when a malfunction is observed.
Masking can arise for both lifetime and pass/fail data. Examples in both reliability and biomedical contexts can be found in Reiser et al [l], Dinse [2], Flehinger, Reiser and Yashchin [3]. Parametric modeling for masked data has mainly focused on exponentially distributed lifetimes (cf.[3-61) and has made the strong symmetry assumption that the probability of masking does not depend on the true failure cause.
The nonparametric approaches which attempt to generalized Kaplan-Meier estimates generally make this symmetry assumption (cf. [7-lo]), sometimes only implicitly. The dangers in this assump- tion are emphasized by Guttman et al. [ll] and Lin and Guess [12].
Frequently, engineering or medical practice requires that some subset of masked failures be sub- jected to a second stage of study to arrive at a definitive diagnosis. This occurs in failure analysis laboratories and on autopsy tables. This stage-2 data, appropriately collected, can be used to analyze masked data without making arL:vy assumptions on symmetry or other structural properties. The use of a a-stage experimental procedure was proposed in [3], [13-141 and is reviewed in this paper.
4425

4426 Second World Congress of Nonlinear Analysts
2. PASS/FAIL CASE: NOTATION AND DEFINITIONS
We first consider the case of success/failure data so that lifetime is not a consideration. We require the following notation:
g indexes each masked group
i c g means that component i is contained in masked group g
N is the number of systems tested
Ic is the number of components in a system
X is the number of systems that do not malfunction
ni is the number of malfunctioning systems that are diagnosed to have component i defective
n9 is the number of malfunctioning systems with masked defects restricted to group g
The parameters of interest are:
The defect probability Fi is the probability that a component of type i induces a system malfunction.
The identification probability Pi is the probability that a component of type a is identified if it is defective.
The masking probability P,l; is the probability that the defect is restricted to masking group g when a component of type i is defective.
The diagnostic probability nilg is the probability that the component of type i is the defective one, given that the defect is restricted to masking group g.
By Bayes Theorem FiPgli
xi’g = Cjcg FjPglj
For simplicity we assume that a system is malfunctioning due to one and only one defective compo- nent, i.e., FiFj z 0, V&j.
3. PASS/FAIL CASE: 2 COMPONENTS
For 2 components the only possible masked group is g = {1,2}; for this group P,li = P~zji = 1 -Pi. Let X, nr, nz, 7112 be the observed counts (IV = X + rzr + n2 + 1212). Then the likelihood function is
(1 - Fl - Fz)X(F~P~)n’(FzP2)nz[Fl(1 - PI) + Fz(l - f’2)ln*‘- (3.1)
We would like to use (3.1) to estimate the unknown parameters 4, F2, PI and P2. However (3.1) is a multinomial likelihood with 4 categories and allows the estimation of only 3 parameters. This can be generalized to the k-component case. Thus, our problem is fundamentally over-parametrized. There are several ways to resolve this problem. One can introduce an arbitrary assumption such as symmetry, i.e. PI = P2. A conservative approach is feasible by assigning rile first to component 1 ,nd then to component 2 and analyzing the resulting binomial data to obtain conservative &erence

Second World Congress of Nonlinear Analysts 4427
on 4 and Fz. It will often be possible to diagnose some of the 9~12 masked cases. This diagnosis takes place in a failure analysis laboratory or analogously on an autopsy table.
4. PASS/FAIL CASE: 2-STAGE EXPERIMENTS
In stage-l, test procedures restrict the possible causes of failure to a subset of causes. In stage-a, a representative sample of each masked group found in stage-l is definitively diagnosed. We require some additional notation:
n9,i is the number of system failures restricted to masking group g in stage-l and identified with component i in stage-2.
n$ = CL”=, ng,i is the total number of system failures restricted to masking group g in stage-l that are identified in stage-2.
fig is the number of system failures restricted to masking group g in stage-l that are not taken to stage-2 for further identification and n$ + tig = ng.
In [3] the likelihood function for the data obtained in this 2-stage procedure is shown to be
(4.1)
where nf=ni+Cn,,i,
g>i
is the number of systems in which the defect was proven to have ocurred in component i and
Furthermore, the maximum likelihood estimators (MLE) of the parameters are obtained in [3] as:
pi= $ ( +-pg %i
g>i Cjcg %j ) = gn; + T&i), i=l,...,k,
where fir is the number of masked system malfunctions that were not resolved but that are allocated to the ith component by the maximum likelihood procedure.
Identification probability:
Masking probability:
4 = ?Zi/(nt + I?:) (4.3)
pgli = ̂ (
Xi + figcj:~‘~g,j )
-* /Cnf + Ni 1 . (4.4)
Diagnostic probability: i?. 119 = ng,il Cng,j . (4.5)
jCg 5. PASS/FAIL CASE: STATISTICAL INFERENCE
For inference on the Fi (defect probabilities), likelihood ratio tests based on the likelihood (4.1) can be obtained and profile likelihoods can be computed and numerically inverted to provide approximate

4428 Second World Congress of Nonlinear Analysts
confidence bounds. Table 1 presents the data discussed in [3].
Test Results Stage-l Functional Systems 4560
Defective Component 1 2 3 4 5
Masking Group
172 173 495
16 22 53 58 57
31 28
143 32
Stage-2 Resolution No Stage-2 1 234 5 25-- - 24 4 -2- - 22
- 10 19 114 1 07- - 24 1,2,3
Table 1: Data from a two stage experiment of 5000 systems of 5 components.
Inference on the F; is summarized in Table 2. The MLEs are computed from (4.2). The ap- proximate upper confidence bounds are obtained numerically as described in [3]. The conservative bounds are obtained by assigning all masked data to each of the appropriate components in turn. A comparison of the last two columns in Table 2 indicates the gain in information obtained from stage-2 information. Estimation of the Fi is primarily of use in monitoring and improving product quality. Estimation of the diagnostic probabilities is useful in examining possible repair policies. [3] discusses this point in some detail.
Parameter MLE Upper 95% Bound Conservative 95% Upper Bound Based on 1st Stage
FI .0095 .0131 .0251 F2 .0088 .0116 .0203 F3 .0181 .0219 .0264 F4 .0215 .0268 .0451 FE .0301 .0357 .0450
Table 2: Estimates of defect probabilities based on data of Table 1.
The above analysis assumes that at most only one of the k components can be defective. If more than one component can be defective the likelihood function is much more complicated with many more parameters but analogous computations can be carried out. In this case the MLEs are not available explicitly but can be obtained numerically [13].
6. LIFETIME DATA
We modify the structtire discussed above by associating with each system a corresponding failure or censoring time. We require the following additional notation:

Second World Congress of Nonlinear Analysts 4429
tyl,j = 1, . n; are the lifetimes of the n; failures which are identified at stage-l to have cause i.
t(y) j = 1, . . , n9 3 ’ are the lifetimes of the ns failures which are identified at stage-l to be associated with the masking group g.
t!“’ j = 1 . 3’ ’ . , nC are the censored lifetimes.
t j , j = l,..., N - n, are the failed lifetimes, identified or masked where N - n, = & n; + X&n,.
fi(t), Si(t) are the probability density functions and survival functions associated with cause i.
f(t), s(t) are the probability density function and survival function associated with the system.
We consider the problem in the framework of k independent competing risks and thus assume that
S(t) = fJ Si(t) i=l
and proportional hazards for competing risks, i.e.
Si(t) = [S(t)]@‘, i = 1,. , k
and .fi(t) = &[S(t)]“‘-‘f(t)
where
g#%=l.
The exponent $i can be interpreted as the probability that a failure is caused by risk i: di does not depend on time and measures the relative importance of the competing risks. It can be shown [14] that the over-parametrization problem discussed in Section 3 also holds under the above assumptions. Our major interest is in estimating the Si(t) in the presence of masking given stage-l and 2 data. Flehinger, Reiser and Yashchin [14] h s ow that the likelihood function is
L = L1 x Lz (6.1)
B, = CiC, P,ji~i is the probability that a failure is masked and is restricted to group g in stage-l.
II+ = P&i/B, is the diagnostic probability, i.e. the probability that a failure restricted to group g in stage-l is actually caused by risk i.
Note that CF=, yi + C, B, = 1 and for every g, CiC, IIiis = 1.
4.430 Second World Congress of Nonlinear Analysts
which is just the likelihood of the lifetime data at the system level and is the usual likelihood associated with Kaplan-Meier estimation. Lz is available based only on stage-l data and can be used to compute s(t) the usual Kaplan-Meier estimate of S(t).
Optimizing L1 gives: ni A
-ri = N-n,,bg = n9 fi. - n9+
N-N,’ ‘lg nz (6.2)
Since di = -yi + Cgci B,q,
& = ni + Cg3jngng,i/ng+
N - n, (6.3)
and consequently estimates for the survival function of risk i are:
Profile likelihoods can be obtained for the di and Si(t) which can be inverted numerically to provide approximate confidence intervals. Algorithms for these computations and examples on data can be found in [14]. These computations indicate that only a small proportion of masked cases are required to be taken to stage-2 in order to provide effective inference.
7. AN EXAMPLE
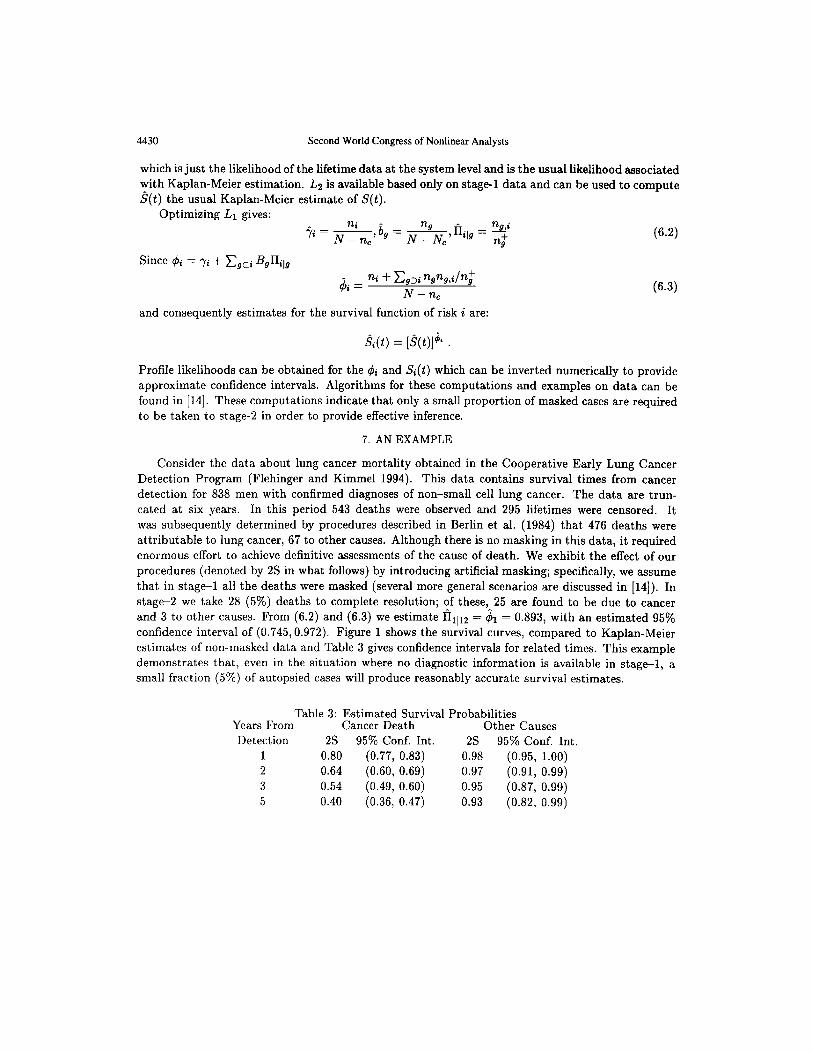
Consider the data about lung cancer mortality obtained in the Cooperative Early Lung Cancer Detection Program (Flehinger and Kimmel 1994). This data contains survival times from cancer detection for 838 men with confirmed diagnoses of non-small cell lung cancer. The data are trun- cated at six years. In this period 543 deaths were observed and 295 lifetimes were censored. It was subsequently determined by procedures described in Berlin et al. (1984) that 476 deaths were attributable to lung cancer, 67 to other causes. Although there is no masking in this data, it required enormous effort to achieve definitive assessments of the cause of death. We exhibit the effect of our
procedures (denoted by 2s in what follows) by introducing artificial masking; specifically, we assume that in stage-l all the deaths were masked (several more general scenarios are discussed in [14]). In stage-2 we take 28 (5%) deaths to complete resolution; of these, 25 are found to be due to cancer and 3 to other causes. From (6.2) and (6.3) we estimate B1/i2 = $1 = 0.893, with an estimated 95% confidence interval of (0.745,0.972). Figure 1 shows the survival curves, compared to Kaplan-Meier estimates of non-masked data and Table 3 gives confidence intervals for related times. This example demonstrates that, even in the situation where no diagnostic information is available in stage-l, a small fraction (5%) of autopsied cases will produce reasonably accurate survival estimates.
Table 3: Estimated Survival Probabilities Years From Cancer Death Other Causes Detection 2s 95% Conf. Int. 2s 95% Conf. Int.
1 0.80 (0.77, 0.83) 0.98 (0.95, 1.00) 2 0.64 (0.60, 0.69) 0.97 (0.91, 0.99) 3 0.54 (0.49, 0.60) 0.95 (0.87, 0.99) 5 0.40 (0.36, 0.47) 0.93 (0.82, 0.99)

Second World Congress of Nonlinear Analysts 4431
Survival Plots
0.6
- 23 th-
0.4
.:
:
0.2
O-
.._........_....
. . ..-....-..--......-...--.--.--. ,......--...-...-,.-----.-.-.-.-.-,-.--------.-.---;..-....-.......-1
0 2 4 6 t
--- - Cancer(KM) __.. - Other Causes(KM)
Cancer(PS) -. - . _ - Other Causes(Z)
Figure 1. Survival Estimates for the Example
8. CONCLUSIONS
This paper has reviewed and discussed some recent results on statistical inference for masked data. We have focused on the use of a-stage experimentation and shown that this is an effective tool not limited by restrictive and unrealistic structural assumptions.
REFERENCES
1. REISER, B., GUTTMAN, I., LIN, D.K.J., USHER, J.S. & GUESS, F.M., Bayesian inference for masked system life time data, Applied Statistics 44, 79-90 (1995).
2. DINSE, G.E., Nonparametric prevalence and mortality estimators for animal experiments with incom- plete cause-of-death data, J. Amer. Statist. Assoc. 81, 328-336 (1986).
3. FLEHINGER, B.J., REISER, B. & YASHCHIN, E., Inference about defects in the presence of masking, Technometrics 38, 247-256 (1996).
4. GUESS, F.M., USHER, J.S. & HODGSON, T.J., Estimating system and component reliabilities under partial information on the cause of failure, J. Statist. Plann. Inference 29, 75-85 (1991).
5. MIYAKAWA, M., Analyses of incomplete data in competing risk model, IEEE Trans. Reliability 33, 293-296 (1984).
4432 Second World Congress of Nonlinear Analysts
6. USHER, J.S. & GUESS, F.M., An iterative approach for estimating component reliability from masked system life data, Qual. Reliab. Engineering Intnl. 5, 257-261 (1989).
7. GOETGHEBEUR, E. & RYAN, L., A modified log rank test for competing risks with missing failure type, Biometrika 77, 207-211 (1990).
8. DEWANJI, A., A note on a test for competing risks with missing failure type, Biomettika 79, 855-857 (1992).
9. KODELL, R.K. & CHEN, J.J., Handling cause of death in equivocal cases using the EM algorithm”, Commun. Statist. A - Theory Methods 16, 2565-2603 (1987).
10. LO, S.-H., Estimating a survival function with incomplete cause-of-death data”, ,I. Multivariate Anal. 39, 2 17-235 (1991).
II. GUTTMAN, I., LIN, D.K., RAISER, B. & USHER, J.S., Dependent masking and system life data analysis: Bayesian inference for two-component systems, Lifetime Data Analysis 1, 87-100 (1995).
12. LIN D.K.J. & GUESS, F.M., System life data analysis with dependent partial knowledge on the exact cause of system failure, Microelectron. Reliability 34, 535-544 (1994).
13. REISER, B., FLEHINGER, B.J. & CONN, A.R., Estimating component defect probability from masked system success/failure data, IEEE Bans. Reliability 45, 238-243 (1996).
14. FLEHINGER, B.J., REISER, B. & YASHCHIN, E., Survival with competing risks and masked causes of failures, IBM Research Report, RC20373, Yorktown Heights, New York (1996).
15. FLEHINGER, B.J. & KIMMEL, M., Early Lung Cancer Detection Studies, ‘in Case Studies in Biometry, eds. N. Lange, L. Ryan, L. Ballard, D. Brillinger, L. Conquest and J. Greenhouse, Wiley, New York, 301-321 (1994).
16. BERLIN, N.I., BUNCHER, C.R., FONTANA, R.S., FROST, J.K. & MELAMED, M.R., The National Cancer Institute Cooperative Early Lung Cancer Detection Program, Results of the Initial Screen (Preva- lence), American Review of Respiratory Diseases, 130, 545-549 (1984).