statistical methods in microarray data analysis mark reimers, genomics and bioinformatics,...
Post on 19-Dec-2015
223 views
TRANSCRIPT

Statistical Methods in Microarray Data Analysis
Mark Reimers,
Genomics and Bioinformatics,
Karolinska Institute

Four Recent Contributions
• Exploratory graphics
• Multiple comparisons corrections– Randomization-based significance tests
• Normalization– loess normalization for cDNA microarray
• Models for probe-level Affymetrix data– Robust estimation

Multiple comparisons
• Each gene has a 5% chance of exceeding the threshold at a p-value of .05– Type I error
• 10,000 genes on a chip
• 500 genes should exceed .05 threshold

Corrections to p-Value
• Bonferroni correction– pi* = Npi, if Npi < 1, otherwise 1
– Too conservative!
• Sidak– pi* = 1 – (1 – pi)N
– Still conservative if genes are co-regulated (correlated)

Step-Down p-Values
• p-values for many genes: p1, …, pN
• Order the smallest k as p(1), …, p(k)
• How likely are we to get k p-values this small by chance?
• An improvement in power over single-step procedures

Quantile Plot
• Plot sample t-scores against t-scores under random hypothesis
• Statistically significant genes stand out
Corresponding quantiles of t-distribution
Sam
ple
t-sc
ores
Changed genes

Volcano Plot
• Displays both biological importance and statistical significance
log2(fold change)
log2(p-value) or t-score

Normalization: Comparing Chips
• Measures differ consistently between chips due to:– Different amounts of RNA– Hybridization conditions– Scanner settings– Murphy’s Law
• Normalization: compensate for systematic technical differences in measurement process
• Re-scaling to mean or median leaves strong evidence of systematic technical variation

Normalization: Signal Distributions• Distributions of log intensity of all probes among a set of 21
replicate chips
Each color represents probe density on one chip
Re-scaling would shift distribution shape to right or left on this plot

Density function
Distribution functionF1(x)
Raw dataReferencedistribution F2(x)
Formula: xnorm = F2
-1(F1(x))
Quantile Normalization
Assumes:gene distributionchanges little

Visible Effect of Quantile Norm.
• Ratio-Intensity plots are straightened as by-product

Current Work
• Hybridization reaction varies across some chips
• Very common on cDNA
• 10%-20% of well-done Affy chips
Synthetic image of ratio of individual probes to their median across chips:Yellow areas show ratios more than twice those of red areas

Models: Many Probes for One Gene
GeneGeneSequenceSequence
Multiple Multiple oligo probesoligo probes
Perfect MatchPerfect MatchMismatchMismatch
5´5´ 3´3´
How to combine signals from multiple probes into a single gene abundance estimate?

Probe Variation
• Individual probes don’t agree on fold changes
• Probes vary by two orders of magnitude on each chip– CG content is most important factor in signal strength
Signal from 16 probes along one gene on one chip

Models for Multiple Probes
• Issues:– Accuracy – does the model give accurate
estimates of relative gene expression, when this is known?
– Noise – what is the variance of replicates?– Theoretical basis – do we understand why we
are doing what we do?• Statistical experience with methodology
• Theory of hybridization process underlying observations

Three Competing Models
• Affymetrix MicroArray Suite – versions 4, and 5
• dChip – Li and Wong, HSPH
• Bioconductor: affy package (RMA)– Bolstad, Irizarry, Speed, et al

Model 1: MicroArray Suite – Version 4
• GeneChip® older software uses Avg.diff
with A a set of suitable pairs chosen by software– 30%-40-% of probe differences can be negative
j
jj MMPMdiffAvg )(1
.

Model 2: MicroArray Suite – Version 5
• MicroArray Suite version 5 uses
• MM* is an adjusted MM that is never bigger than PM
• Tukey biweight is a robust average procedure
with weights: f(x)=c2/6[1-(1-x2/s2) 3]; |x|<c
)}{log( *jj MMPMghtTukeyBiweisignal
For this (typical) example, it is not clear what the average would mean
PM-MM values for probe pairs

Linear Models
• Extension of linear regression• Essential features:
– variance constant – errors independent– Small number of factors combine in algebraic
form to give levels• frequently additive
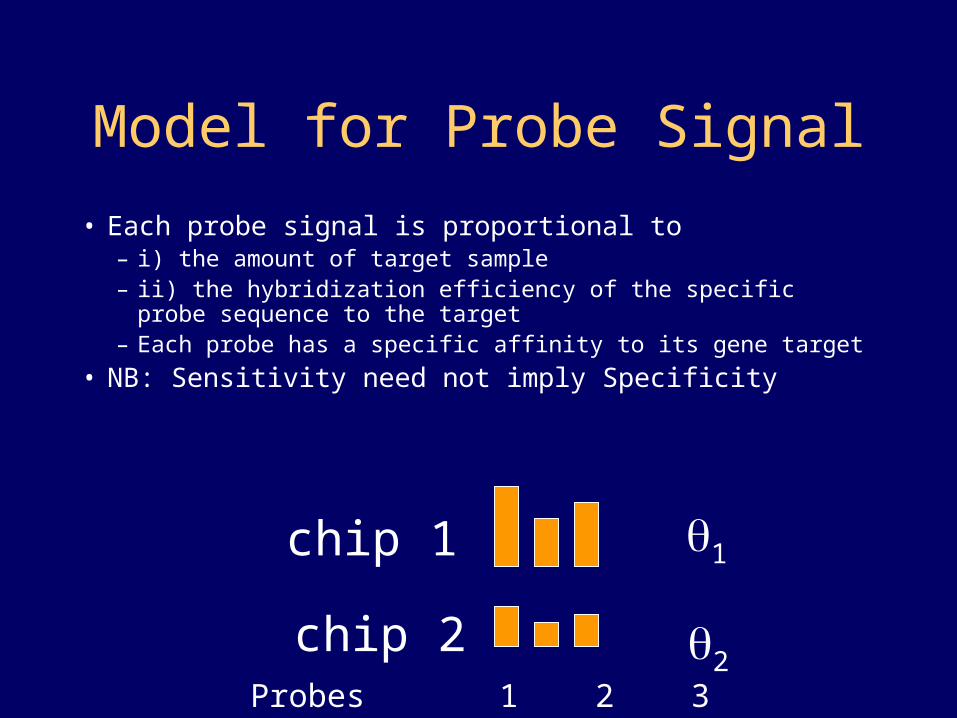
Model for Probe Signal
• Each probe signal is proportional to – i) the amount of target sample– ii) the hybridization efficiency of the specific probe sequence to the
target– Each probe has a specific affinity to its gene target
• NB: Sensitivity need not imply Specificity
1
2Probes 1 2 3
chip 1
chip 2
Robust Statistics
• Outlier: a measure that is far beyond the typical random variation– common in biological measures– 10-15% in Affy probe sets
• Robust methods try to fit the majority of data points – Issue is to identify which points to down-weight or ignore
• Median is very robust – but inefficient– Trimmed means are almost as robust and much more
efficient

Robust Linear Models
• Criterion of fit– Least median squares– Sum of weighted squares– Least squares and throw out outliers
• Method for finding fit– High-dimensional search – Iteratively re-weighted least squares– Median Polish

Why Robust Models for GeneChips?
• 10% - 15% of individual signals in a probe set deviate greatly from pattern
• Often outliers lie close together
• Causes: – Scratches – Proximity to heating elements– Uneven fluid flow

Why Robust Models for GeneChips?
• 10% - 15% of individual signals in a probe set deviate greatly from pattern
• Often outliers lie close together
• Causes: – Scratches – Proximity to heating elements– Uneven fluid flow

Li & Wong (dChip)• Model: PMij = ij + ij
- Original model (dChip 1.0) used PMij - MMij = ij + ij
by analogy with Affy MAS 4
• Outlier removal:– Identify extreme residuals– Remove– Re-fit– Iterate
• Distribution of errors ij assumed
independent of signal strength

Robust Multi-chip Analysis
• Each probe responds roughly linearly – over a moderate range
– some probes are outliers
• Linear Model: – signal = ij +
• i amount of transcript in sample i;
• j amplification of probe j
• Robust Fit:– identify outliers by heuristic – remove
– standard robust method – iteratively re-weighted least squares
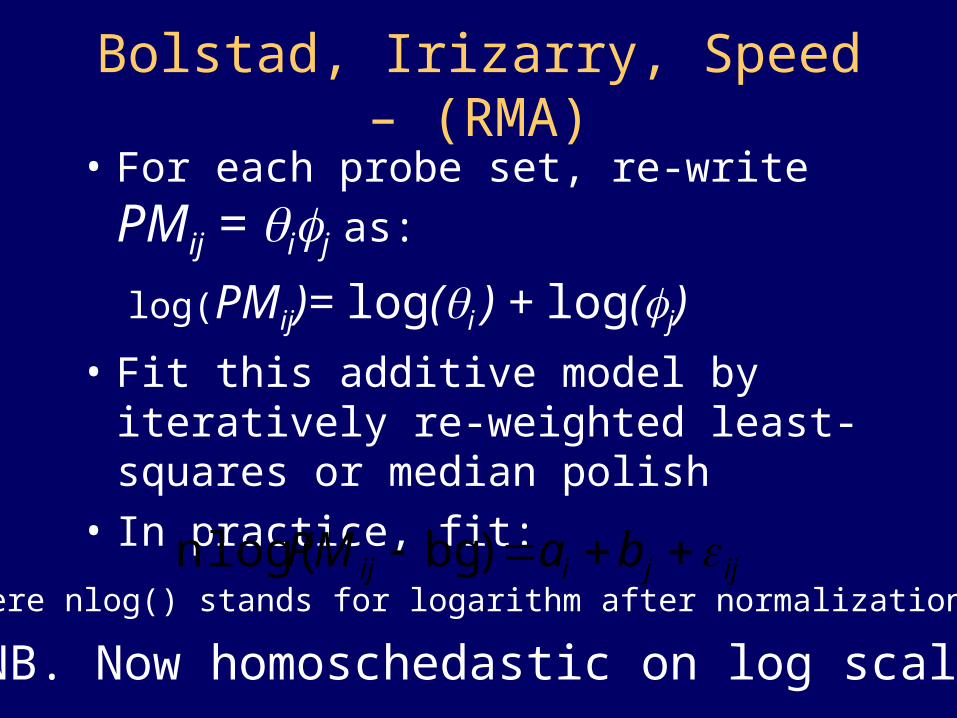
• For each probe set, re-write PMij = ij as:
log(PMij)= log(i ) + log(j)• Fit this additive model by iteratively re-
weighted least-squares or median polish
• In practice, fit:
ijjiij baPM )bglog(n
Bolstad, Irizarry, Speed – (RMA)
Where nlog() stands for logarithm after normalization
NB. Now homoschedastic on log scale

It Makes a DifferenceTwo fairly consistent genes in each of 71 samples
MAS 5 values
dChi
p va
lues

Models Compared on Gene Variance
Std Dev of gene measures from 20 replicate arrays
Green: MAS5.0; Black: Li-Wong; Blue, Red: RMACourtesy of Terry Speed
LowAbundance: High

Improvement in Models
• Affymetrix Suite gets better every year– MAS 7 is expected to be a multi-chip model
• MAS 5.0 estimation does a reasonable job on probe sets that are bright – Metabolic and structural genes– These are most often reported in papers
• dChip and RMA do better on genes that are less abundant – Signalling proteins– transcription factors

Expression Comparison 1 – MAS 4
Courtesy of Terry Speed
Ratio-Intensity Plot comparing two chips from spike-in experiment
White dots represent unchanged genesRed numbers flag spike-in genes
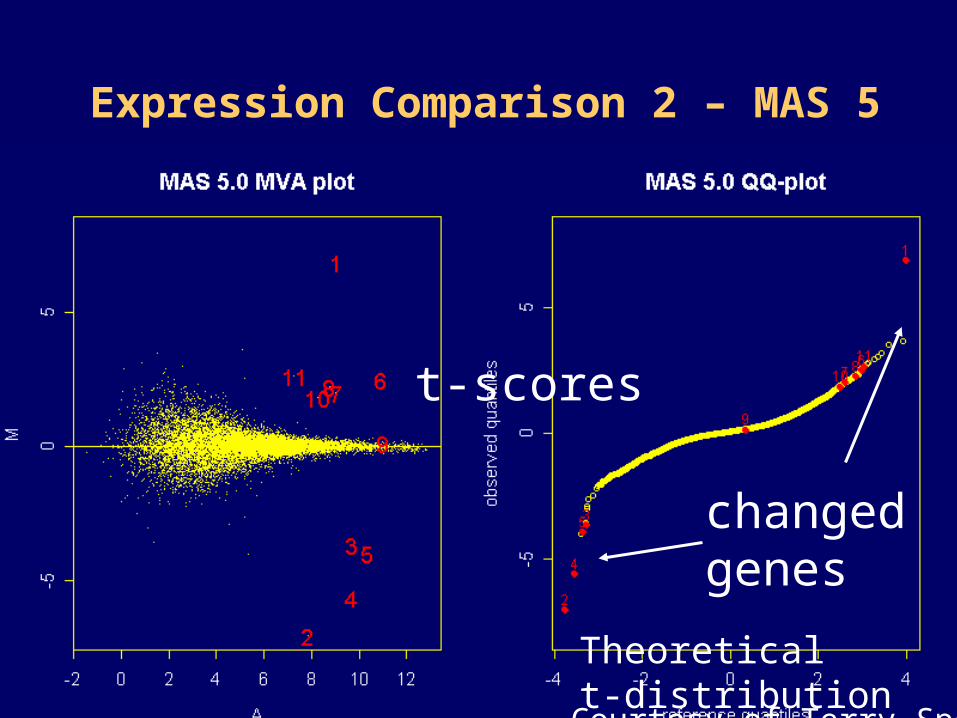
Expression Comparison 2 – MAS 5
Courtesy of Terry Speed
t-scores
Theoretical t-distribution
changed genes

Expression Comparison 3 – Li-Wong
Courtesy of Terry Speed

Expression Comparison 4 - RMA
Courtesy of Terry Speed

Current Work: Improving the Model
• How to use the MM information profitably– Combine estimates from PM and MM probes?
• Assessments of probe quality
• Accurate estimates of probe background
• Normalization method based on 2-d loess to correct spatial inhomogeneity

Relation Between PM and MM Across One Experiment Set
Colored symbols are one probe
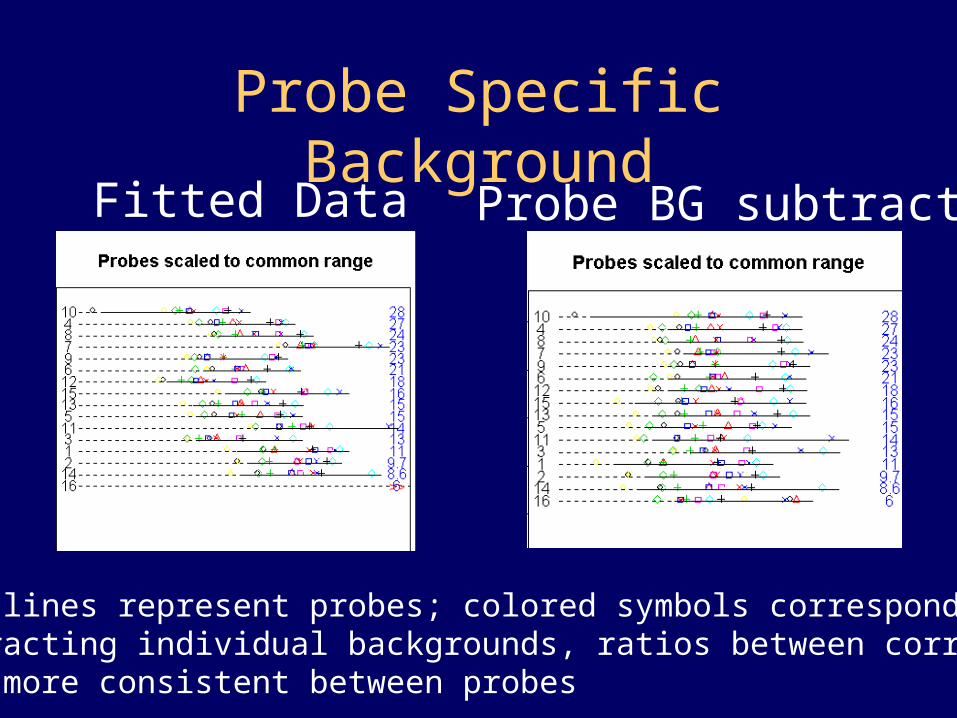
Probe Specific Background
Horizontal lines represent probes; colored symbols correspond to arraysAfter subtracting individual backgrounds, ratios between corresponding arrays are more consistent between probes
Fitted Data Probe BG subtracted

Where Are We?
• Affymetrix almost finished?– Probe variation ~40% => gene variation ~ 10% – RMA gives ~20%
• Work to be done: – Systematic biases for cDNA arrays– Platform reconciliation– Using QC and variation measures for individual probes
in combined expression measures
• Frontiers:– Image analysis

Near Term Work to be Done
• New hybridization technologies for measuring gene expression
• Protein chips– More complex cross-hybridization
• Other high-throughput technologies – eg RNAi chips– Cell arrays
• Using sequence information to understand cross-hybridization

Integrated Analysis
• Integrating statistical measures of data uncertainty in machine-learning techniques for network analysis
• Statistical inference for pathways and gene ontology categories
• Robust data analysis to mine for genome-scale patterns in expression

Acknowledgements
• KI– Karin Dahlman
– Yudi Pawitan
– Arief Gusnanto
– Lennie Fredriksson
• Berkeley– Terry Speed
– Ben Bolstad
• Johns Hopkins– Rafael Irizarry


Affymetrix Arrays
Single stranded, fluorescentlySingle stranded, fluorescentlylabeled DNA targetlabeled DNA target
20µm20µm
Each probe cell or feature containsEach probe cell or feature containsmillions of copies of a specificmillions of copies of a specificoligonucleotide probeoligonucleotide probe
Image of Hybridized Probe ArrayImage of Hybridized Probe Array
Over 400,000 different probes Over 400,000 different probes complementary to geneticcomplementary to geneticinformation of interestinformation of interest
Oligonucleotide probeOligonucleotide probe
**
**
*
1.28cm1.28cm
GeneChipGeneChip Probe ArrayProbe ArrayHybridized Probe CellHybridized Probe Cell

Evidence for Spatial Variation
SyntheticImage ofAffy chip

Loess Normalization for Areas
Fit two-parameter loess smootherWith 5-10 df