statistical problem solving for non- specialists john marriott rss centre for statistical education...
TRANSCRIPT

Statistical Problem Solving for non-
specialists
John Marriott
RSS Centre for Statistical EducationUniversity of Plymouth
Summary
i. Introductory statistics modules
ii. Engaging students
iii. Using a problem solving approach
iv. Some examples
v. Concluding remarks

Introductory statistics modules
• EDA
• Graphical presentation of data
The usual suspects
• Descriptive statistics
Location
spread
The first semester

Attention and attendance
The lectures
Why?

Students talking in lectures (if they are there)
1. Why are they talking
2. What are they talking about ……………
if it isn’t about statistics?
Two crucial questions
Why are they talking?
• EDA
• Graphical presentation of data
The usual suspects
• Descriptive statistics
Location
spread
Introductory statistics modules
Why are they talking?
• Not intellectually challenging
They have been doing this since they were 11!
Boredom
• The result?
Poor attendance
Both lectures and classes/labs
Introductory statistics modules
• If we must cover this material how can we make it more interesting?
Why are they talking?
• Include relevant context? Parachuting in ‘context’??
It doesn’t work for introductory courses!
Students say it appears contrived to them
• What do students want to talk about?
A solution?

Engaging students
• What are they talking about?
Themselves and their friends
• What topics interest them?
Their accommodation
The neighbourhood that live in/crime
• Can we use this to get students to talk about statistics?
Engaging students
• We should ask them to talk about
Themselves and their friends
• We could choose as topics
How good is their accommodation
How safe is the place they live in?
Engaging students
• Can we use this to get students to learn introductory statistics?
• YES
if we use real data that is relevant to the students
• YES
if we use a problem solving approach (PSA)
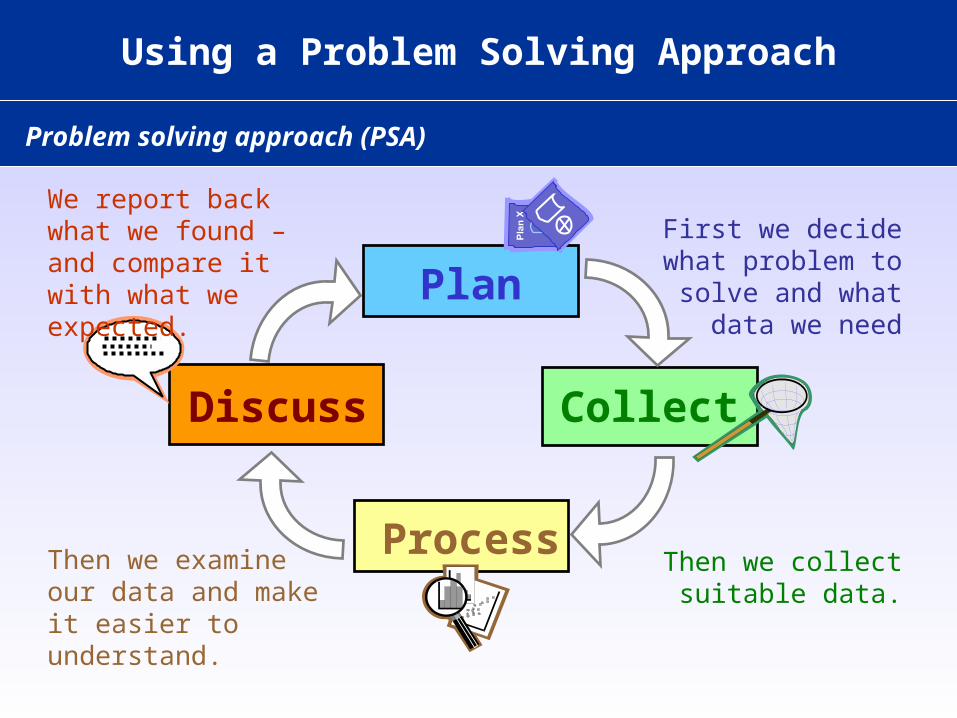
Problem solving approach (PSA)
Using a Problem Solving Approach
First we decide what problem to
solve and what data we need
Discuss
Process
Plan
Collect
Then we collect suitable data.
Then we examine our data and make it easier to understand.
We report back what we found – and compare it with what we expected.
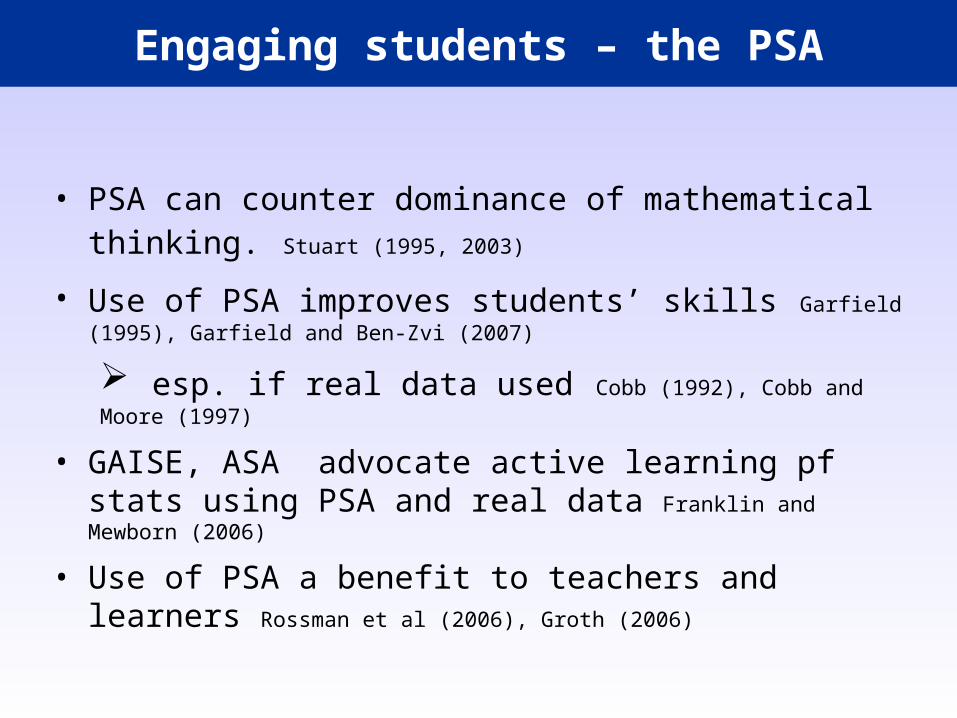
Engaging students – the PSA
• PSA can counter dominance of mathematical thinking. Stuart (1995, 2003)
• Use of PSA improves students’ skills Garfield (1995), Garfield and Ben-Zvi (2007)
esp. if real data used Cobb (1992), Cobb and Moore (1997)
• GAISE, ASA advocate active learning pf stats using PSA and real data Franklin and Mewborn (2006)
• Use of PSA a benefit to teachers and learners Rossman et al (2006), Groth (2006)

Economic and Social Research Council Response

Economic and Social Research Council Response
In 2006 there were calls for proposals to develop
undergraduate curricula that:
• use real data to show the value of quantitative methods
• show students they have the foundation skills that can build
on their school experience
• encourage students to collect their own data and analyse
them
• encourage students to carry out their own research projects
using data

Motivating/engaging new undergraduates
• New undergraduates will be concerned about the town where they are attending university
• Social Science students will, at some stage, consider the social effects of crime
• A ‘How safe is your neighbourhood?’ problem will be of interest to all undergraduates :– Mathematics; statistics; biosciences;
medicine; health sciences; business/finance; economics; sociology/social admin; psychology; geography; built environment; engineering; leisure and sport; legal studies; …..

The first introductory stats lecture
• Introduce the problem• Discussion• Student questions• Discuss choice of data• Reminder of the PSA

The Second and Subsequent Lectures
• From the start the students have been involved in– the formulation of the problem being investigated– their own data being collected
• The impetus is maintained by – reminding the students of the PSA – using their data to illustrate the Process and
Discuss stages of the PSA– introducing the statistical tools/techniques they
need in the context of their data and at the time it is required
Some examples
1. Introductory statistics
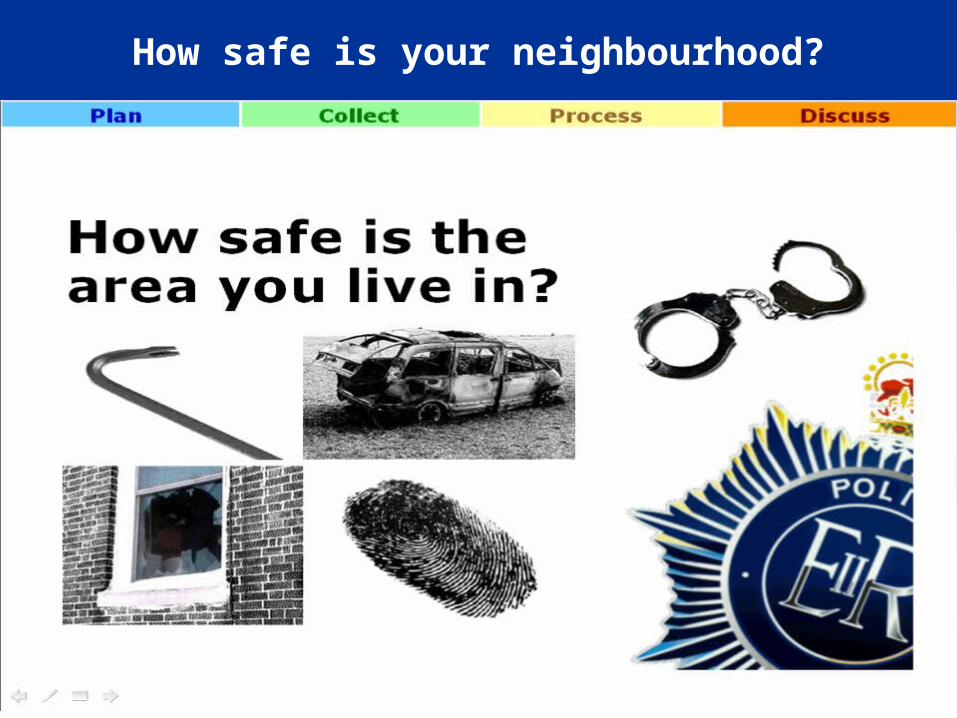
How safe is your neighbourhood?
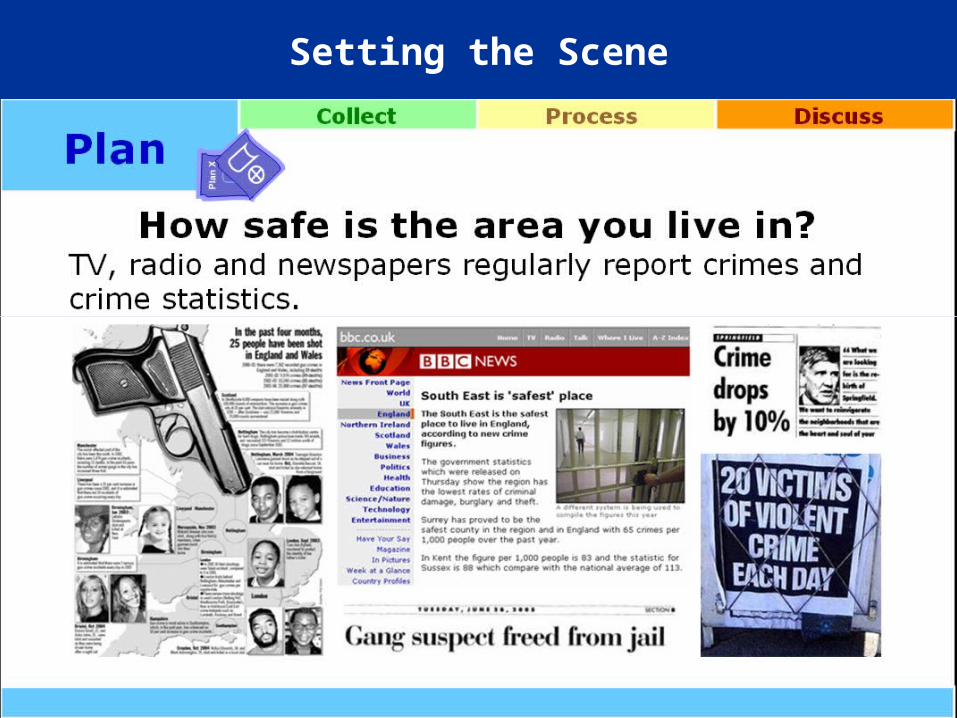
Setting the Scene
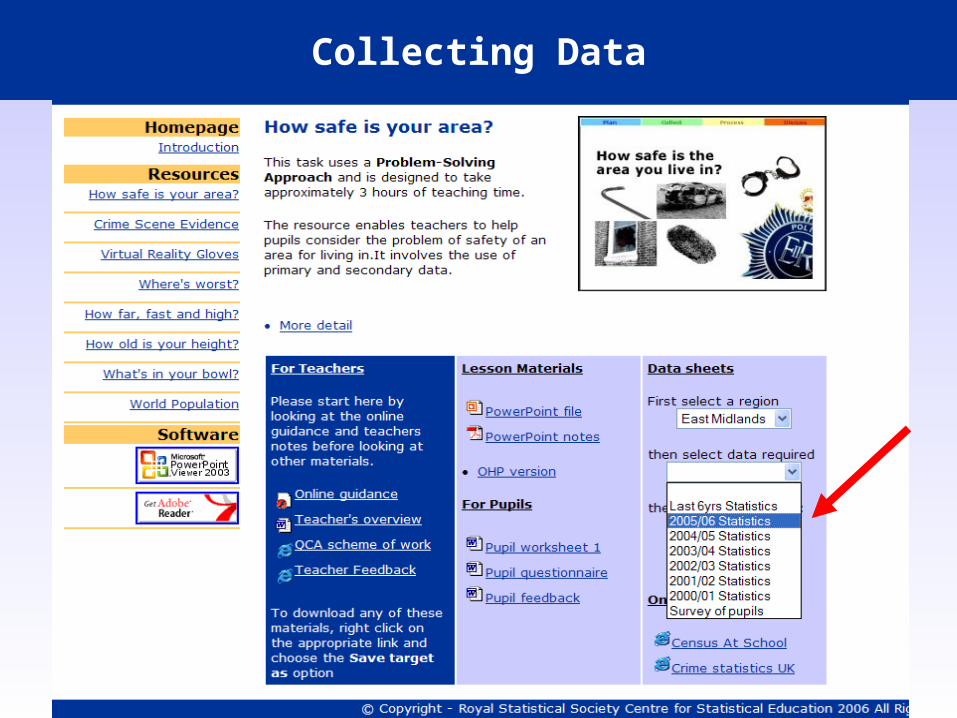
Collecting Data

Data Downloaded from Website

Processing the Data

Discussing the Results

The First Seminar/Workshop - Collect
• The students complete a short questionnaire (online)• The questionnaire comprises?
– Three demographic questions including date of birth– Four questions taken from the British Crime Survey(www.statistics.gov.uk/ssd/surveys/british_crime_survey.asp)

The First Seminar/Workshop – Process and Discuss
• Students revise data summary presentation – use their collective seminar data for this– summarise their seminar group’s perceptions
• Students draw tentative conclusions – limitations of the seminar ‘sample’ discussed– possibility of using the whole module group’s
responses in next seminar session discussed

The Second and Subsequent Lectures
• From the start the students have been involved in– the formulation of the problem being investigated– their own data being collected
• The impetus is maintained by – reminding the students of the PSA – using their data to illustrate the Process and
Discuss stages of the PSA– just introducing the statistical tools/techniques
they need in the context of their data and at the time it is required

Some examples
1. For introductory statistics
2. For two sample topics1. Chi-squared test 2. ANOVA

Where now?
• Online survey tools– SNAP http://www.snapsurveys.com/software/
– Limesurvey http://www.limesurvey.org/
– SurveyMonkey http://www.surveymonkey.com/
• Fast turnaround of data– Real time results to stats lab/class
Conclusions
• Engage students – using what they want to talk about
• Use the PSA– Evidence this works– It is what statisticians ‘do’
• Online survey tools• Need exemplar resources
– 3 available– PSA PowerPoint template

The last slide

Really the last slide!