statistical variance analysis
DESCRIPTION
business administration subjectTRANSCRIPT
Analysis of Variance 291
CHAPTER 11: ANALYSIS OF VARIANCE
1. In a one-way ANOVA, if the computed F statistic exceeds the critical F value, we maya) reject H0 since there is evidence all the means differ. b) reject H0 since there is evidence of a treatment effect.c) not reject H0 since there is no evidence of a difference.d) not reject H0 because a mistake has been made.
ANSWER:bTYPE: MC DIFFICULTY: Easy KEYWORDS: one-way analysis of variance, decision
2. Which of the following components in an ANOVA table are not additive?a) sum of squaresb) degrees of freedomc) mean squaresd) It is not possible to tell.
ANSWER:cTYPE: MC DIFFICULTY: Easy KEYWORDS: one-way analysis of variance, sum of squares, properties
3. Why would you use the Tukey-Kramer procedure?a) to test for normalityb) to test for homogeneity of variancec) to test independence of errorsd) to test for differences in pairwise means
ANSWER:dTYPE: MC DIFFICULTY: Easy KEYWORDS: Tukey-Kramer procedure
4. A completely randomized design a) has only one factor, with several treatment groups.b) can have more than one factor, each with several treatment groups.c) has one factor and one block.d) has one factor, one block, and multiple values.
ANSWER:aTYPE: MC DIFFICULTY: Moderate KEYWORDS: completely randomized design
292 Analysis of Variance
5. The F test statistic in a one-way ANOVA is a) MSW/MSA.b) SSW/SSA.c) MSA/MSW.d) SSA/SSW.
ANSWER:cTYPE: MC DIFFICULTY: Easy KEYWORDS: one-way analysis of variance, F test for factor
6. The degrees of freedom for the F test in a one-way ANOVA area) (n – c) and (c – 1).b) (c – 1) and (n – c).c) (c – n) and (n – 1).d) (n – 1) and (c – n).
ANSWER:bTYPE: MC DIFFICULTY: Easy KEYWORDS: degrees of freedom, F test for factor
7. In a one-way ANOVA, the null hypothesis is alwaysa) there is no treatment effect.b) there is some treatment effect.c) all the population means are different.d) some of the population means are different.
ANSWER:aTYPE: MC DIFFICULTY: EasyKEYWORDS: one-way analysis of variance, form of hypothesis
8. In a one-way ANOVAa) an interaction term is present.b) an interaction effect can be tested.c) there is no interaction term.d) the interaction term has (c – 1)(n – 1) degrees of freedom.
ANSWER:cTYPE: MC DIFFICULTY: Moderate KEYWORDS: one-way analysis of variance, properties, interaction

Analysis of Variance 293
9. Interaction in an experimental design can be tested in a) a completely randomized model.b) a randomized block model.c) a two-factor model.d) all ANOVA models.
ANSWER:cTYPE: MC DIFFICULTY: Easy KEYWORDS: two-factor analysis of variance, interaction, properties
10. In a two-way ANOVA, the degrees of freedom for the interaction term area) (r – 1)(c – 1).b) rc(n – 1).c) (r – 1).d) rcn + 1.
ANSWER:aTYPE: MC DIFFICULTY: Easy KEYWORDS: two-factor analysis of variance, interaction, degrees of freedom
11. In a two-way ANOVA, the degrees of freedom for the "error" term area) (r – 1)(c – 1).b) rc(n – 1).c) (r – 1).d) rcn + 1.
ANSWER:bTYPE: MC DIFFICULTY: Easy KEYWORDS: two-factor analysis of variance, degrees of freedom
12. Suppose there is interest in comparing the median response time for three independent groups learning a specific task. The appropriate nonparametric procedure is the
a) Wilcoxon rank sums test.b) Wilcoxon signed ranks test.c) Kruskal-Wallis rank test for differences in medians.d) none of the above
ANSWER:cTYPE: MC DIFFICULTY: Easy KEYWORDS: Kruskal-Wallis rank test
294 Analysis of Variance
13. The Kruskal-Wallis rank test for differences in more than two medians is a nonparametric alternative to
a) Fisher's ANOVA F test for completely randomized experiments.b) Student's t test for related samples.c) Student's t test for independent samples.d) Wilcoxon's rank sum test for differences in two medians.
ANSWER:aTYPE: MC DIFFICULTY: Easy KEYWORDS: Kruskal-Wallis rank test
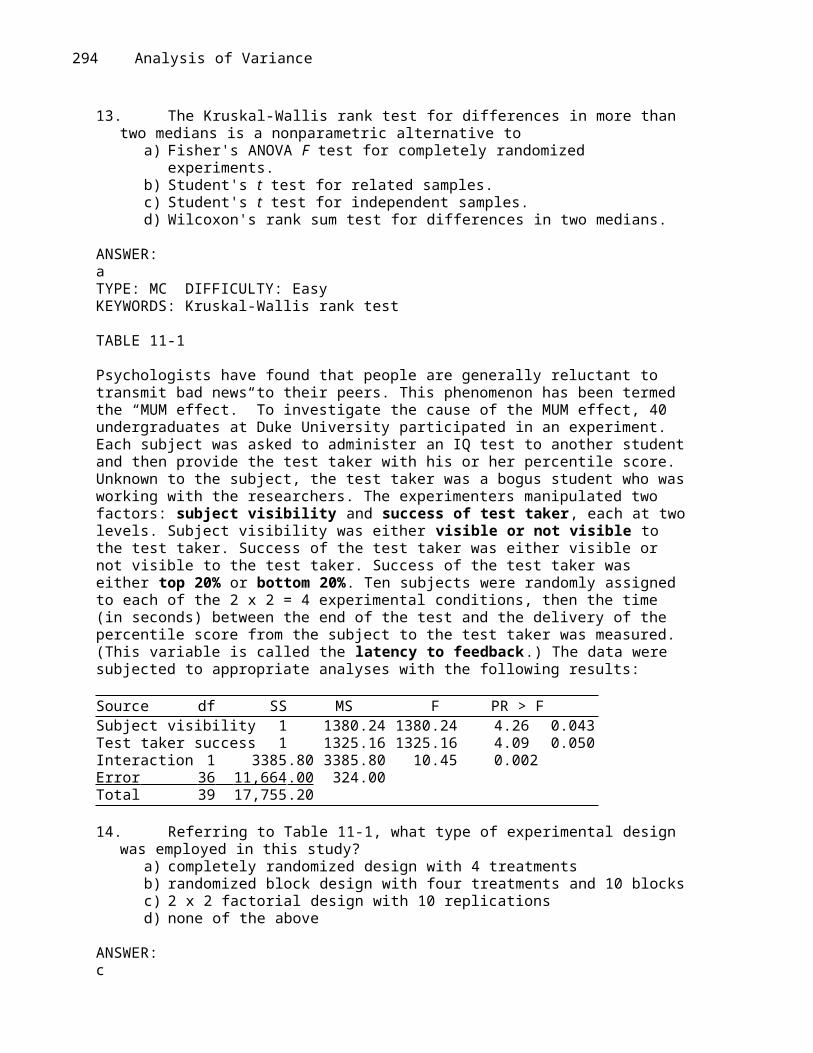
TABLE 11-1
Psychologists have found that people are generally reluctant to transmit bad news to their peers. This phenomenon has been termed the “MUM effect.” To investigate the cause of the MUM effect, 40 undergraduates at Duke University participated in an experiment. Each subject was asked to administer an IQ test to another student and then provide the test taker with his or her percentile score. Unknown to the subject, the test taker was a bogus student who was working with the researchers. The experimenters manipulated two factors: subject visibility and success of test taker, each at two levels. Subject visibility was either visible or not visible to the test taker. Success of the test taker was either visible or not visible to the test taker. Success of the test taker was either top 20% or bottom 20%. Ten subjects were randomly assigned to each of the 2 x 2 = 4 experimental conditions, then the time (in seconds) between the end of the test and the delivery of the percentile score from the subject to the test taker was measured. (This variable is called the latency to feedback.) The data were subjected to appropriate analyses with the following results:
Source df SS MS F PR > FSubject visibility 1 1380.24 1380.24 4.26 0.043Test taker success 1 1325.16 1325.16 4.09 0.050Interaction 1 3385.80 3385.80 10.45 0.002Error 36 11,664 .00 324.00Total 39 17,755.20
14. Referring to Table 11-1, what type of experimental design was employed in this study?a) completely randomized design with 4 treatmentsb) randomized block design with four treatments and 10 blocksc) 2 x 2 factorial design with 10 replicationsd) none of the above
ANSWER:cTYPE: MC DIFFICULTY: ModerateKEYWORDS: two-factor analysis of variance, two-factor factorial design

Analysis of Variance 295
15. Referring to Table 11-1, at the 0.01 level, what conclusions can you draw from the analyses?a) At the 0.01 level, subject visibility and test taker success are significant predictors of
latency feedback.b) At the 0.01 level, the model is not useful for predicting latency to feedback.c) At the 0.01 level, there is evidence to indicate that subject visibility and test taker
success interact.d) At the 0.01 level, there is no evidence of interaction between subject visibility and test
taker success.
ANSWER:cTYPE: MC DIFFICULTY: ModerateKEYWORDS: two-factor analysis of variance, F test for interaction, decision, conclusion, interaction
16. Referring to Table 11-1, in the context of this study, interpret the statement: “Subject visibility and test taker success interact.”
a) The difference between the mean feedback time for visible and nonvisible subjects depends on the success of the test taker.
b) The difference between the mean feedback time for test takers scoring in the top 20% and bottom 20% depends on the visibility of the subject.
c) The relationship between feedback time and subject visibility depends on the success of the test taker.
d) All of the above are correct interpretations.
ANSWER:dTYPE: MC DIFFICULTY: DifficultKEYWORDS: two-factor analysis of variance, interaction, conclusion
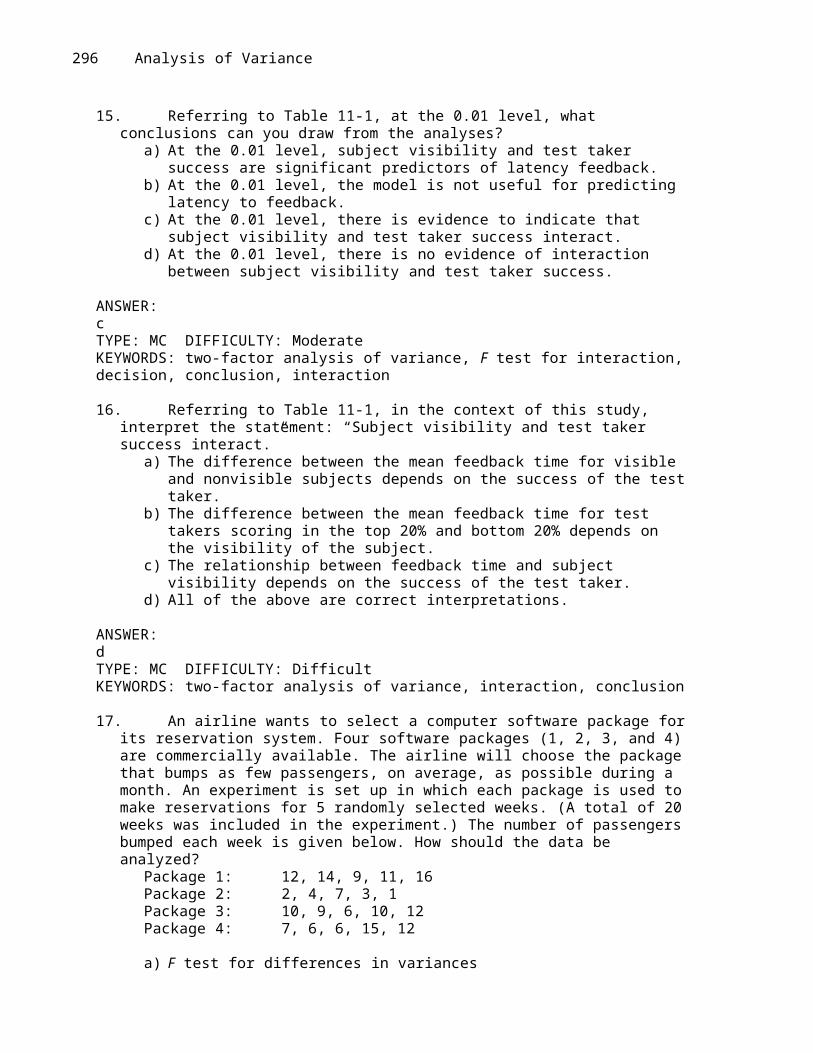
17. An airline wants to select a computer software package for its reservation system. Four software packages (1, 2, 3, and 4) are commercially available. The airline will choose the package that bumps as few passengers, on average, as possible during a month. An experiment is set up in which each package is used to make reservations for 5 randomly selected weeks. (A total of 20 weeks was included in the experiment.) The number of passengers bumped each week is given below. How should the data be analyzed?
Package 1: 12, 14, 9, 11, 16Package 2: 2, 4, 7, 3, 1Package 3: 10, 9, 6, 10, 12Package 4: 7, 6, 6, 15, 12
a) F test for differences in variancesb) one-way ANOVA F testc) t test for the differences in meansd) t test for the mean difference
ANSWER:bTYPE: MC DIFFICULTY: EasyKEYWORDS: one-way analysis of variance, F test for factor
296 Analysis of Variance
TABLE 11-2
An airline wants to select a computer software package for its reservation system. Four software packages (1, 2, 3, and 4) are commercially available. The airline will choose the package that bumps as few passengers, on average, as possible during a month. An experiment is set up in which each package is used to make reservations for 5 randomly selected weeks. (A total of 20 weeks was included in the experiment.) The number of passengers bumped each week is obtained, which gives rise to the following Excel output:
ANOVASource of Variation SS df MS F p-value F critBetween Groups 212.4 3 8.304985 0.001474 3.238867Within Groups 136.4 8.525
Total 348.8
18. Referring to Table 11-2, the within groups degrees of freedom isa) 3.b) 4.c) 16.d) 19.
ANSWER:cTYPE: MC DIFFICULTY: EasyKEYWORDS: one-way analysis of variance, degrees of freedom
19. Referring to Table 11-2, the total degrees of freedom isa) 3.b) 4.c) 16.d) 19.
ANSWER:dTYPE: MC DIFFICULTY: EasyKEYWORDS: one-way analysis of variance, degrees of freedom
20. Referring to Table 11-2, the among group mean squares isa) 8.525.b) 70.8.c) 212.4.d) 637.2.
ANSWER:bTYPE: MC DIFFICULTY: EasyKEYWORDS: one-way analysis of variance, mean squares

Analysis of Variance 297
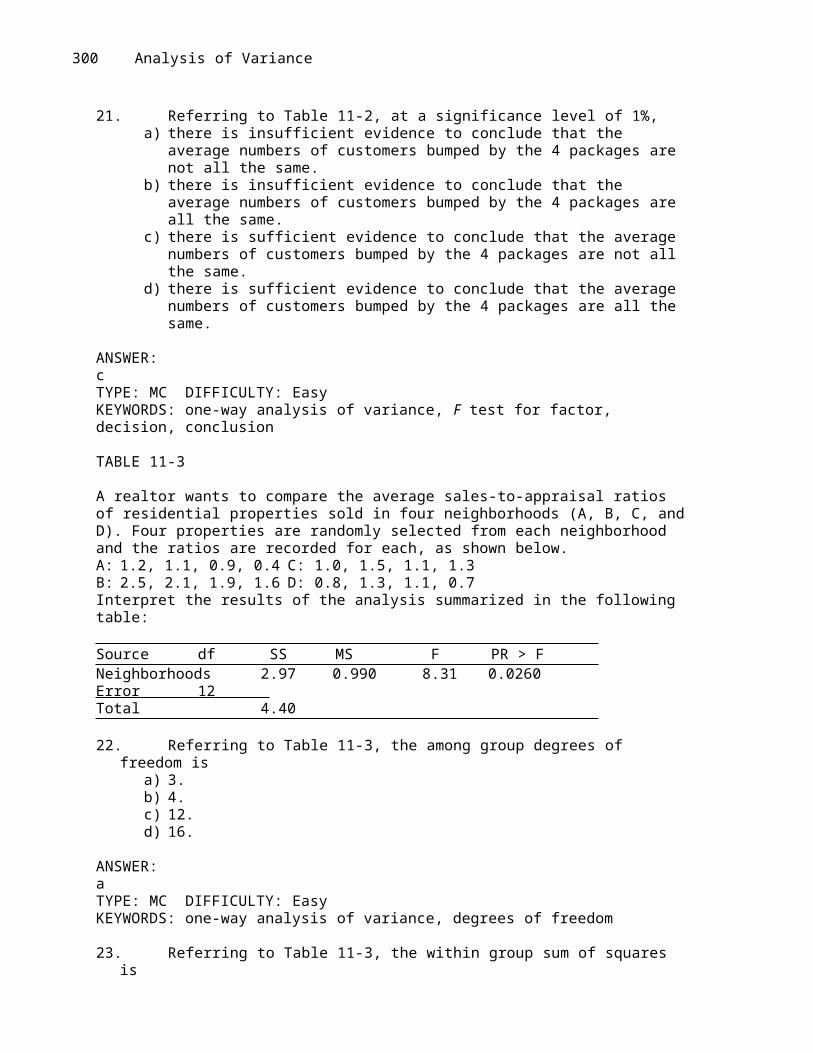
21. Referring to Table 11-2, at a significance level of 1%,a) there is insufficient evidence to conclude that the average numbers of customers bumped
by the 4 packages are not all the same.b) there is insufficient evidence to conclude that the average numbers of customers bumped
by the 4 packages are all the same. c) there is sufficient evidence to conclude that the average numbers of customers bumped
by the 4 packages are not all the same.d) there is sufficient evidence to conclude that the average numbers of customers bumped
by the 4 packages are all the same.
ANSWER:cTYPE: MC DIFFICULTY: EasyKEYWORDS: one-way analysis of variance, F test for factor, decision, conclusion
TABLE 11-3
A realtor wants to compare the average sales-to-appraisal ratios of residential properties sold in four neighborhoods (A, B, C, and D). Four properties are randomly selected from each neighborhood and the ratios are recorded for each, as shown below.A: 1.2, 1.1, 0.9, 0.4 C: 1.0, 1.5, 1.1, 1.3B: 2.5, 2.1, 1.9, 1.6 D: 0.8, 1.3, 1.1, 0.7Interpret the results of the analysis summarized in the following table:
Source df SS MS F PR > FNeighborhoods 2.97 0.990 8.31 0.0260Error 12 Total 4.40
22. Referring to Table 11-3, the among group degrees of freedom isa) 3.b) 4.c) 12.d) 16.
ANSWER:aTYPE: MC DIFFICULTY: EasyKEYWORDS: one-way analysis of variance, degrees of freedom
23. Referring to Table 11-3, the within group sum of squares isa) 0.119.b) 1.43.c) 2.97.d) 4.40.
ANSWER:bTYPE: MC DIFFICULTY: EasyKEYWORDS: one-way analysis of variance, sum of squares

298 Analysis of Variance
24. Referring to Table 11-3, the within group mean squares isa) 0.119.b) 0.990.c) 1.109.d) 8.31.
ANSWER:aTYPE: MC DIFFICULTY: EasyKEYWORDS: one-way analysis of variance, mean squares
25. Referring to Table 11-3, a) at the 0.05 level of significance, the mean ratios for the 4 neighborhoods are not all the
same.b) at the 0.01 level of significance, the mean ratios for the 4 neighborhoods are not all the
same.c) at the 0.10 level of significance, the mean ratios for the 4 neighborhoods are not
significantly different.d) at the 0.05 level of significance, the mean ratios for the 4 neighborhoods are not
significantly different from 0.
ANSWER:aTYPE: MC DIFFICULTY: EasyKEYWORDS: one-way analysis of variance, F test for factor, decision, conclusion
26. A campus researcher wanted to investigate the factors that affect visitor travel time in a complex, multilevel building on campus. Specifically, he wanted to determine whether different building signs (building maps versus wall signage) affect the total amount of time visitors require to reach their destination, and whether that time depends on whether the starting location is inside or outside the building. Three subjects were assigned to each of the combinations of signs and starting locations, and travel times in seconds from beginning to destination were recorded. How should the data be analyzed?
Starting Room Interior Exterior
Wall Signs 141, 119, 238 224, 339, 139Map 85, 94, 126 226, 129, 130
a) completely randomized designb) randomized block designc) 2 x 2 factorial designd) Kruskal-Wallis rank test
ANSWER:cTYPE: MC DIFFICULTY: ModerateKEYWORDS: two-factor factorial design
Analysis of Variance 299
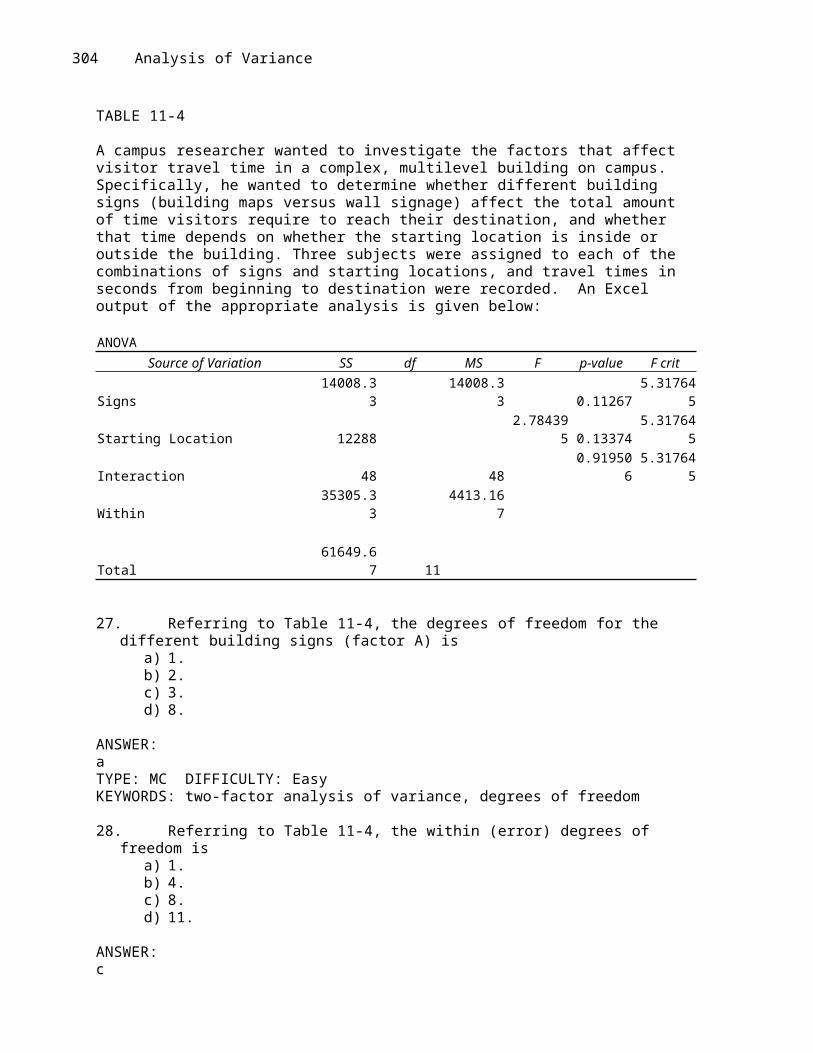
TABLE 11-4
A campus researcher wanted to investigate the factors that affect visitor travel time in a complex, multilevel building on campus. Specifically, he wanted to determine whether different building signs (building maps versus wall signage) affect the total amount of time visitors require to reach their destination, and whether that time depends on whether the starting location is inside or outside the building. Three subjects were assigned to each of the combinations of signs and starting locations, and travel times in seconds from beginning to destination were recorded. An Excel output of the appropriate analysis is given below:
ANOVASource of Variation SS df MS F p-value F crit
Signs 14008.33 14008.33 0.11267 5.317645Starting Location 12288 2.784395 0.13374 5.317645Interaction 48 48 0.919506 5.317645Within 35305.33 4413.167
Total 61649.67 11
27. Referring to Table 11-4, the degrees of freedom for the different building signs (factor A) isa) 1.b) 2.c) 3.d) 8.
ANSWER:aTYPE: MC DIFFICULTY: EasyKEYWORDS: two-factor analysis of variance, degrees of freedom
28. Referring to Table 11-4, the within (error) degrees of freedom isa) 1.b) 4.c) 8.d) 11.
ANSWER:cTYPE: MC DIFFICULTY: EasyKEYWORDS: two-factor analysis of variance, degrees of freedom
300 Analysis of Variance
29. Referring to Table 11-4, the mean squares for starting location (factor B) isa) 48.b) 4,413.17.c) 12,288.d) 14,008.3.
ANSWER:cTYPE: MC DIFFICULTY: EasyKEYWORDS: two-factor analysis of variance, mean squares
30. Referring to Table 11-4, the F test statistic for testing the main effect of types of signs isa) 0.0109.b) 2.7844.c) 3.1742.d) 5.3176.
ANSWER:cTYPE: MC DIFFICULTY: EasyKEYWORDS: two-factor analysis of variance, F test for factor
31. Referring to Table 11-4, the F test statistic for testing the interaction effect between the types of signs and the starting location is
a) 0.0109.b) 2.7844.c) 3.1742.d) 5.3176.
ANSWER:aTYPE: MC DIFFICULTY: EasyKEYWORDS: two-factor analysis of variance, F test for interaction, interaction
32. Referring to Table 11-4, at 1% level of significance,a) there is insufficient evidence to conclude that the difference between the average
traveling times for the different starting locations depends on the types of signs.b) there is insufficient evidence to conclude that the difference between the average
traveling times for the different types of signs depends on the starting locations.c) there is insufficient evidence to conclude that the relationship between traveling times
and the types of signs depends on the starting locations.d) all of the above
ANSWER:dTYPE: MC DIFFICULTY: EasyKEYWORDS: two-factor analysis of variance, F test for factor, F test for interaction, decision, conclusion
Analysis of Variance 301
33. Referring to Table 11-4, at 10% level of significance,a) there is sufficient evidence to conclude that the difference between the average traveling
times for the different starting locations depends on the types of signs.b) there is insufficient evidence to conclude that the difference between the average
traveling times for the different types of signs depends on the starting locations.c) there is sufficient evidence to conclude that the difference between the average traveling
times for the different starting locations does not depend on the types of signs.d) none of the above
ANSWER:bTYPE: MC DIFFICULTY: EasyKEYWORDS: two-factor analysis of variance, F test for factor, decision, conclusion
34. The Journal of Business Venturing reported on the activities of entrepreneurs during the organization creation process. As part of a designed study, a total of 71 entrepreneurs were interviewed and divided into 3 groups: those that were successful in founding a new firm (n1 = 34), those still actively trying to establish a firm (n2 = 21), and those who tried to start a new firm but eventually gave up (n3 = 16). The total number of activities undertaken (e.g., developed a business plan, sought funding, looked for facilities) by each group over a specified time period during organization creation was measured. The objective is to compare the mean number of activities of the 3 groups of entrepreneurs. Because of concerns over necessary assumption of the parametric analysis, it was decided to use a nonparametric analysis. Identify the nonparametric method that would be used to analyze the data.
a) Wilcoxon rank sums testb) Wilcoxon signed ranks testc) Kruskal-Wallis rank test for differences in mediansd) one-way ANOVA F test
ANSWER:cTYPE: MC DIFFICULTY: EasyKEYWORDS: Kruskal-Wallis rank test

302 Analysis of Variance
TABLE 11-5
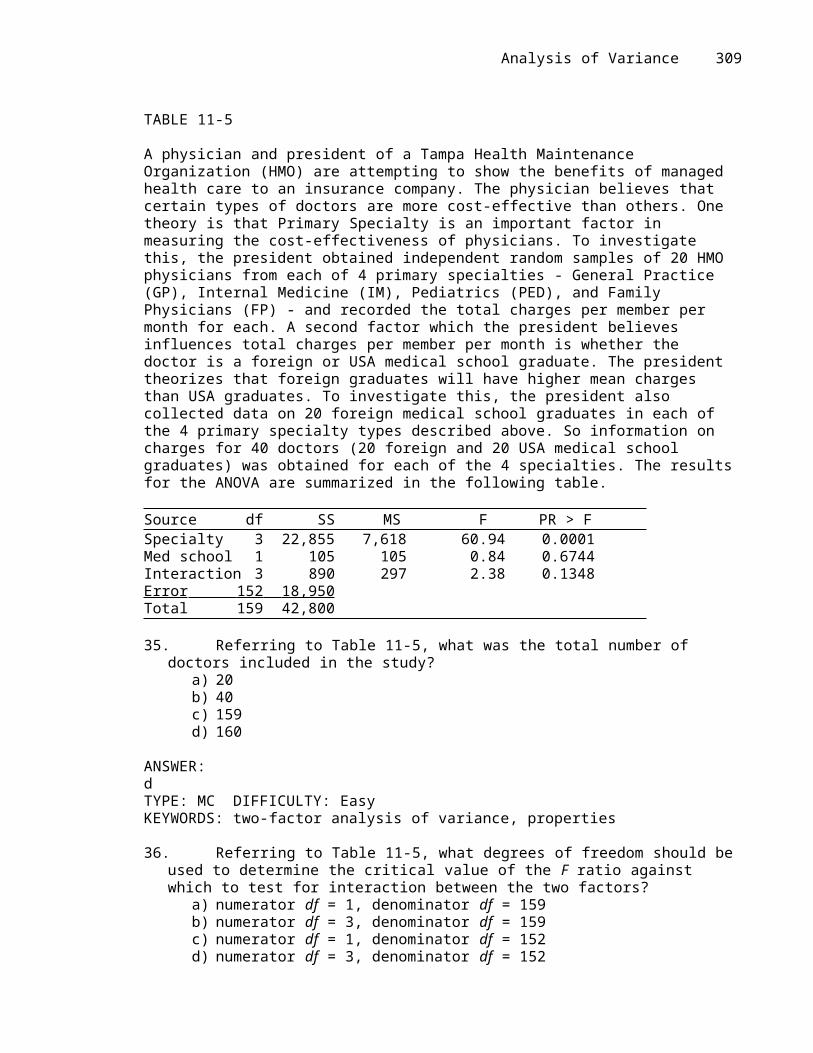
A physician and president of a Tampa Health Maintenance Organization (HMO) are attempting to show the benefits of managed health care to an insurance company. The physician believes that certain types of doctors are more cost-effective than others. One theory is that Primary Specialty is an important factor in measuring the cost-effectiveness of physicians. To investigate this, the president obtained independent random samples of 20 HMO physicians from each of 4 primary specialties - General Practice (GP), Internal Medicine (IM), Pediatrics (PED), and Family Physicians (FP) - and recorded the total charges per member per month for each. A second factor which the president believes influences total charges per member per month is whether the doctor is a foreign or USA medical school graduate. The president theorizes that foreign graduates will have higher mean charges than USA graduates. To investigate this, the president also collected data on 20 foreign medical school graduates in each of the 4 primary specialty types described above. So information on charges for 40 doctors (20 foreign and 20 USA medical school graduates) was obtained for each of the 4 specialties. The results for the ANOVA are summarized in the following table.
Source df SS MS F PR > FSpecialty 3 22,855 7,618 60.94 0.0001Med school 1 105 105 0.84 0.6744Interaction 3 890 297 2.38 0.1348Error 152 18,950 Total 159 42,800
35. Referring to Table 11-5, what was the total number of doctors included in the study?a) 20b) 40c) 159d) 160
ANSWER:dTYPE: MC DIFFICULTY: EasyKEYWORDS: two-factor analysis of variance, properties
36. Referring to Table 11-5, what degrees of freedom should be used to determine the critical value of the F ratio against which to test for interaction between the two factors?
a) numerator df = 1, denominator df = 159b) numerator df = 3, denominator df = 159c) numerator df = 1, denominator df = 152d) numerator df = 3, denominator df = 152
ANSWER:dTYPE: MC DIFFICULTY: EasyKEYWORDS: two-factor analysis of variance, F test for interaction, degrees of freedom

Analysis of Variance 303
37. Referring to Table 11-5, interpret the test for interaction.a) There is insufficient evidence to say at the 0.10 level of significance that the difference
between the mean charges for foreign and USA graduates depends on primary specialty.b) There is sufficient evidence to say at the 0.10 level of significance that the difference
between the mean charges for foreign and USA graduates depends on primary specialty.c) There is sufficient evidence at the 0.10 level of significance of a difference between the
mean charges for foreign and USA medical graduates.d) There is sufficient evidence to say at the 0.10 level of significance that mean charges
depend on both primary specialty and medical school.
ANSWER:aTYPE: MC DIFFICULTY: DifficultKEYWORDS: two-factor analysis of variance, interaction, interpretation
38. Referring to Table 11-5, what degrees of freedom should be used to determine the critical value of the F ratio against which to test for differences in the mean charges for doctors among the four primary specialty areas?
a) numerator df = 1, denominator df = 159b) numerator df = 3, denominator df = 159c) numerator df = 1, denominator df = 152d) numerator df = 3, denominator df = 152
ANSWER:dTYPE: MC DIFFICULTY: EasyKEYWORDS: two-factor analysis of variance, F test for factor, degrees of freedom
39. Referring to Table 11-5, what degrees of freedom should be used to determine the critical value of the F ratio against which to test for differences between the mean charges of foreign and USA medical school graduates?
a) numerator df = 1, denominator df = 159b) numerator df = 3, denominator df = 159c) numerator df = 1, denominator df = 152d) numerator df = 3, denominator df = 152
ANSWER:cTYPE: MC DIFFICULTY: EasyKEYWORDS: two-factor analysis of variance, F test for factor, degrees of freedom
304 Analysis of Variance
40. Referring to Table 11-5, is there evidence of a difference between the mean charges of foreign and USA medical school graduates?
a) Yes, the test for the main effect for primary specialty is significant at = 0.10.b) No, the test for the main effect for medical school is not significant at = 0.10.c) No, the test for the interaction is not significant at = 0.10.d) Maybe, but we need information on the -estimates to fully answer the question.
ANSWER:bTYPE: MC DIFFICULTY: EasyKEYWORDS: two-factor analysis of variance, F test for factor, decision, conclusion
41. Referring to Table 11-5, what assumption(s) need(s) to be made in order to conduct the test for differences between the mean charges of foreign and USA medical school graduates?
a) There is no significant interaction effect between the area of primary specialty and the medical school on the doctors’ mean charges.
b) The charges in each group of doctors sampled are drawn from normally distributed populations.
c) The charges in each group of doctors sampled are drawn from populations with equal variances.
d) All of the above are necessary assumptions.
ANSWER:dTYPE: MC DIFFICULTY: ModerateKEYWORDS: two-factor analysis of variance, assumptions
42. True or False: The analysis of variance (ANOVA) tests hypotheses about the population variance.
ANSWER:FalseTYPE: TF DIFFICULTY: Easy KEYWORDS: one-way analysis of variance
43. True or False: The F test, in a completely randomized model, is just an expansion of the t test for independent samples.
ANSWER:TrueTYPE: TF DIFFICULTY: Easy KEYWORDS: completely randomized design, F test for factor
44. True or False: When the F test is used for ANOVA, the rejection region is always in the right tail.
ANSWER:TrueTYPE: TF DIFFICULTY: Easy KEYWORDS: F test for factor, rejection region

Analysis of Variance 305
45. True or False: A completely randomized design with 4 groups would have 6 possible pairwise comparisons.
ANSWER:TrueTYPE: TF DIFFICULTY: Moderate KEYWORDS: completely randomized design, properties
46. True or False: If you are comparing the average sales among 3 different brands, you are dealing with a three-way ANOVA design.
ANSWER:FalseTYPE: TF DIFFICULTY: Easy KEYWORDS: one-way analysis of variance, properties
47. True or False: The MSE must always be positive.
ANSWER:TrueTYPE: TF DIFFICULTY: Easy KEYWORDS: mean squares, properties
48. True or False: In a two-way ANOVA, it is easier to interpret main effects when the interaction component is not significant.
ANSWER:TrueTYPE: TF DIFFICULTY: Moderate KEYWORDS: two-factor analysis of variance, interpretation
49. True or False: In a one-factor ANOVA analysis, the among sum of squares and within sum of squares must add up to the total sum of squares.
ANSWER:TrueTYPE: TF DIFFICULTY: EasyKEYWORDS: one-way analysis of variance, sum of squares, properties
50. True or False: In a two-factor ANOVA analysis, the sum of squares due to both factors, the interaction sum of squares, and the within sum of squares must add up to the total sum of squares.
ANSWER:TrueTYPE: TF DIFFICULTY: EasyKEYWORDS: two-factor analysis of variance, sum of squares, properties
306 Analysis of Variance
TABLE 11-6
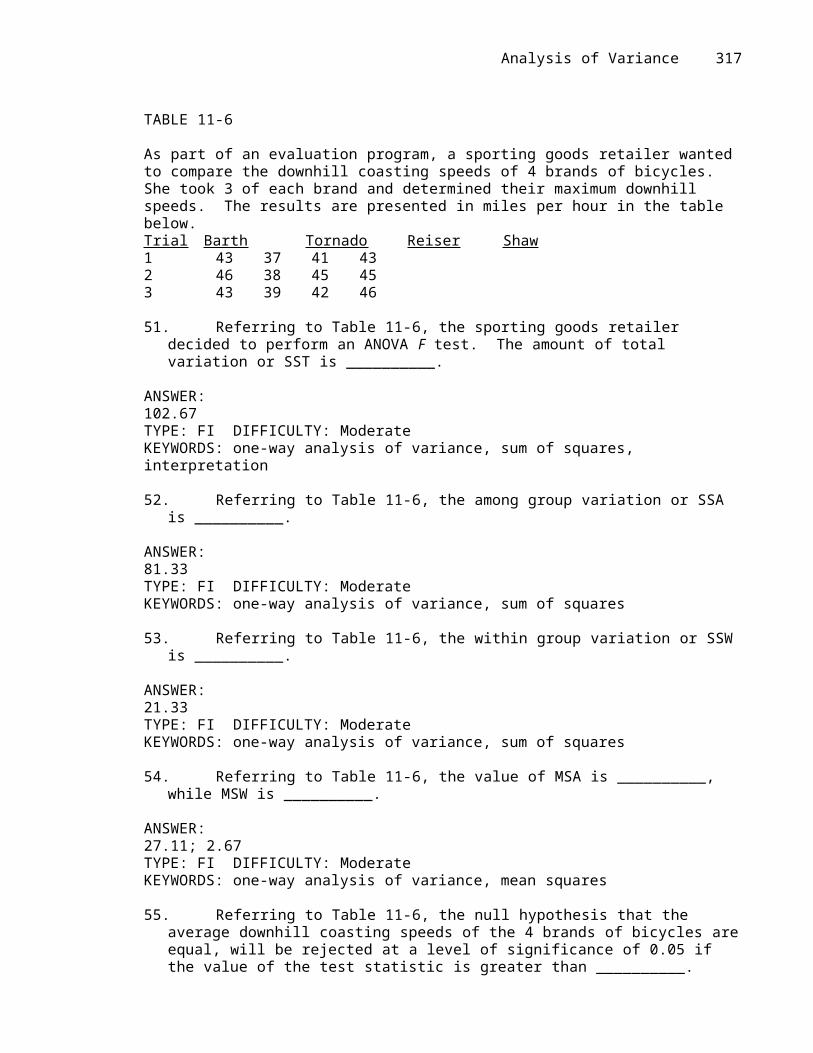
As part of an evaluation program, a sporting goods retailer wanted to compare the downhill coasting speeds of 4 brands of bicycles. She took 3 of each brand and determined their maximum downhill speeds. The results are presented in miles per hour in the table below.Trial Barth Tornado Reiser Shaw1 43 37 41 432 46 38 45 453 43 39 42 46
51. Referring to Table 11-6, the sporting goods retailer decided to perform an ANOVA F test. The amount of total variation or SST is __________.
ANSWER:102.67TYPE: FI DIFFICULTY: Moderate KEYWORDS: one-way analysis of variance, sum of squares, interpretation
52. Referring to Table 11-6, the among group variation or SSA is __________.
ANSWER:81.33TYPE: FI DIFFICULTY: Moderate KEYWORDS: one-way analysis of variance, sum of squares
53. Referring to Table 11-6, the within group variation or SSW is __________.
ANSWER:21.33TYPE: FI DIFFICULTY: Moderate KEYWORDS: one-way analysis of variance, sum of squares
54. Referring to Table 11-6, the value of MSA is __________, while MSW is __________.
ANSWER:27.11; 2.67TYPE: FI DIFFICULTY: Moderate KEYWORDS: one-way analysis of variance, mean squares
55. Referring to Table 11-6, the null hypothesis that the average downhill coasting speeds of the 4 brands of bicycles are equal, will be rejected at a level of significance of 0.05 if the value of the test statistic is greater than __________.
ANSWER:4.07TYPE: FI DIFFICULTY: Easy KEYWORDS: one-way analysis of variance, F test for factor, decision
Analysis of Variance 307
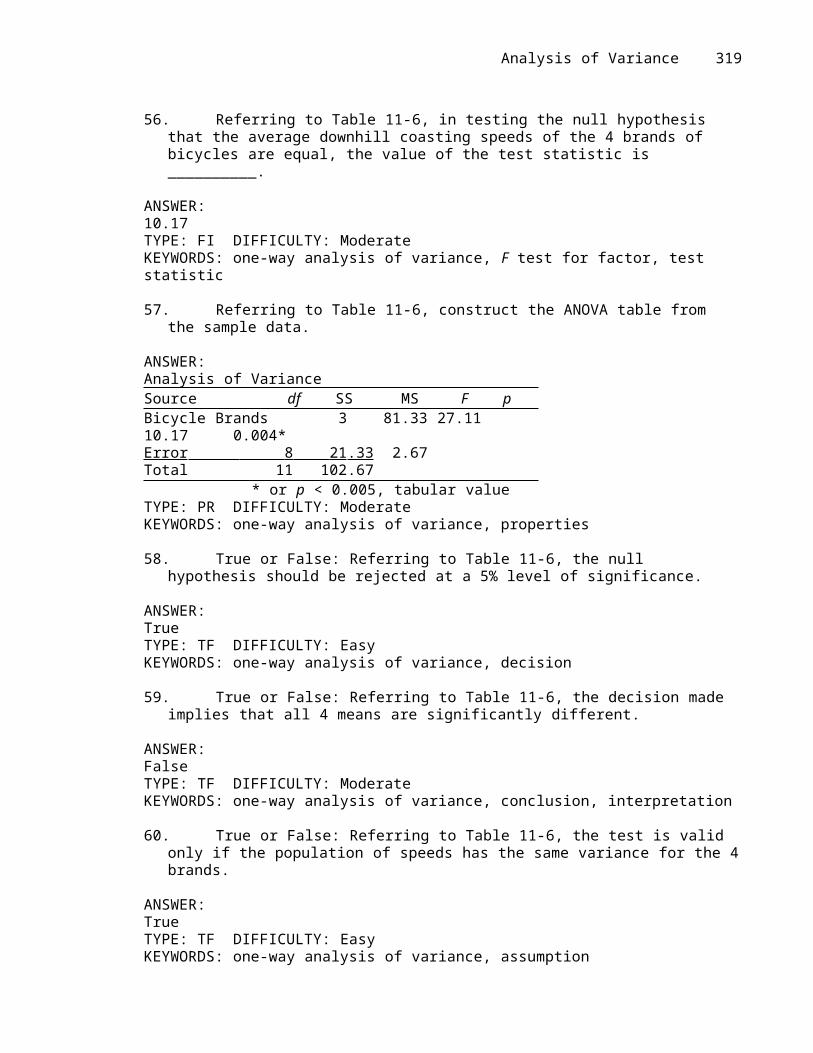
56. Referring to Table 11-6, in testing the null hypothesis that the average downhill coasting speeds of the 4 brands of bicycles are equal, the value of the test statistic is __________.
ANSWER:10.17TYPE: FI DIFFICULTY: Moderate KEYWORDS: one-way analysis of variance, F test for factor, test statistic
57. Referring to Table 11-6, construct the ANOVA table from the sample data.
ANSWER:Analysis of VarianceSource df SS MS F pBicycle Brands 3 81.33 27.11 10.17 0.004*Error 8 21 .33 2.67Total 11 102.67
* or p < 0.005, tabular valueTYPE: PR DIFFICULTY: Moderate KEYWORDS: one-way analysis of variance, properties
58. True or False: Referring to Table 11-6, the null hypothesis should be rejected at a 5% level of significance.
ANSWER:TrueTYPE: TF DIFFICULTY: Easy KEYWORDS: one-way analysis of variance, decision
59. True or False: Referring to Table 11-6, the decision made implies that all 4 means are significantly different.
ANSWER:FalseTYPE: TF DIFFICULTY: Moderate KEYWORDS: one-way analysis of variance, conclusion, interpretation
60. True or False: Referring to Table 11-6, the test is valid only if the population of speeds has the same variance for the 4 brands.
ANSWER:TrueTYPE: TF DIFFICULTY: Easy KEYWORDS: one-way analysis of variance, assumption
308 Analysis of Variance
61. True or False: Referring to Table 11-6, the test is less sensitive to the assumption that the population of speeds has the same variance for the 4 brands if the sample sizes of the 4 brands are equal.
ANSWER:TrueTYPE: TF DIFFICULTY: Easy KEYWORDS: one-way analysis of variance, assumption
62. True or False: Referring to Table 11-6, the test is valid only if the population of speeds is normally distributed.
ANSWER:TrueTYPE: TF DIFFICULTY: Easy KEYWORDS: one-way analysis of variance, assumption
63. True or False: Referring to Table 11-6, the test is robust to the violation of the assumption that the population of speeds is normally distributed.
ANSWER:TrueTYPE: TF DIFFICULTY: Easy KEYWORDS: one-way analysis of variance, assumption
64. Referring to Table 11-6, the sporting goods retailer decided to compare the 4 treatment means by using the Tukey-Kramer procedure with an overall level of significance of 0.05. There are ________ pairwise comparisons that can be made.
ANSWER:6TYPE: FI DIFFICULTY: Moderate KEYWORDS: one-way analysis of variance, Tukey-Kramer procedure
65. Referring to Table 11-6, using an overall level of significance of 0.05, the critical value of the Studentized range Q used in calculating the critical range for the Tukey-Kramer procedure is ________.
ANSWER:4.53TYPE: FI DIFFICULTY: Moderate KEYWORDS: one-way analysis of variance, Tukey-Kramer procedure, critical value
66. Referring to Table 11-6, using an overall level of significance of 0.05, the critical range for the Tukey-Kramer procedure is ________.
ANSWER:4.27TYPE: FI DIFFICULTY: Easy KEYWORDS: one-way analysis of variance, Tukey-Kramer procedure, critical value
Analysis of Variance 309
67. True or False: Referring to Table 11-6, based on the Tukey-Kramer procedure with an overall level of significance of 0.05, the retailer would decide that there is a significant difference between all pairs of mean speeds.
ANSWER:FalseTYPE: TF DIFFICULTY: Moderate KEYWORDS: one-way analysis of variance, Tukey-Kramer procedure, decision, conclusion
68. True or False: Referring to Table 11-6, based on the Tukey-Kramer procedure with an overall level of significance of 0.05, the retailer would decide that there is no significant difference between any pair of mean speeds.
ANSWER:FalseTYPE: TF DIFFICULTY: Moderate KEYWORDS: one-way analysis of variance, Tukey-Kramer procedure, decision, conclusion
69. True or False: Referring to Table 11-6, based on the Tukey-Kramer procedure with an overall level of significance of 0.05, the retailer would decide that the mean speed for the Tornado brand is significantly different from each of the mean speeds for other brands.
ANSWER:TrueTYPE: TF DIFFICULTY: Moderate KEYWORDS: one-way analysis of variance, Tukey-Kramer procedure, decision, conclusion
70. True or False: Referring to Table 11-6, based on the Tukey-Kramer procedure with an overall level of significance of 0.05, the retailer would decide that the 3 means other than the mean for Tornado are not significantly different from each other.
ANSWER:TrueTYPE: TF DIFFICULTY: Moderate KEYWORDS: one-way analysis of variance, Tukey-Kramer procedure, decision, conclusion
71. Referring to Table 11-6, the sporting goods retailer decided to perform a Kruskal-Wallis test. The null hypothesis of the test is ________.
ANSWER:H0: M1 = M2 = M3 = M4
TYPE: FI DIFFICULTY: Easy KEYWORDS: one-way analysis of variance, Kruskal-Wallis rank test, form of hypothesis
72. Referring to Table 11-6, the alternative hypothesis of the Kruskal-Wallis test is that ________.
ANSWER:not all the medians are equalTYPE: FI DIFFICULTY: Easy KEYWORDS: one-way analysis of variance, Kruskal-Wallis rank test, form of hypothesis
310 Analysis of Variance
73. Referring to Table 11-6, the decision rule for a level of significance of 0.05 using the Kruskal-Wallis test is to reject the null hypothesis if the test statistic H is ________.
ANSWER:greater than 7.815TYPE: FI DIFFICULTY: Easy KEYWORDS: one-way analysis of variance, Kruskal-Wallis rank test, critical value, decision
74. Referring to Table 11-6, the calculation of the Kruskal-Wallis test statistic H involves ranking the observations. Construct a table containing these ranks.
ANSWER:Barth Tornado Reiser Shaw7.0 1.0 4.0 7.011.5 2.0 9.5 9.57.0 3.0 5.0 11.5TYPE: PR DIFFICULTY: Moderate KEYWORDS: one-way analysis of variance, Kruskal-Wallis test, test statistic
75. Referring to Table 11-6, the calculation of the Kruskal-Wallis test statistic H involves obtaining the total of the ranks for each sample. These totals are ________, ________, ________, and ________.
ANSWER:25.5, 6.0, 18.5, 28.0TYPE: FI DIFFICULTY: Moderate KEYWORDS: one-way analysis of variance, Kruskal-Wallis rank test, test statistic
76. Referring to Table 11-6, the calculated value of the Kruskal-Wallis test statistic H is ________.
ANSWER:7.47TYPE: FI DIFFICULTY: Moderate KEYWORDS: one-way analysis of variance, Kruskal-Wallis rank test, test statistic
Analysis of Variance 311
TABLE 11-7
An agronomist wants to compare the crop yield of 3 varieties of chickpea seeds. She plants 15 fields, 5 with each variety. She then measures the crop yield in bushels per acre. Treating this as a completely randomized design, the results are presented in the table that follows.Trial Smith Walsh Trevor1 11.1 19.0 14.62 13.5 18.0 15.73 15.3 19.8 16.84 14.6 19.6 16.75 9.8 16.6 15.2
77. Referring to Table 11-7, the agronomist decided to perform an ANOVA F test. The amount of total variation or SST is __________.
ANSWER:114.82TYPE: FI DIFFICULTY: Moderate KEYWORDS: one-way analysis of variance, sum of squares
78. Referring to Table 11-7, the among group variation or SSA is __________.
ANSWER:82.39TYPE: FI DIFFICULTY: Moderate KEYWORDS: one-way analysis of variance, sum of squares
79. Referring to Table 11-7, the within group variation or SSW is __________.
ANSWER:32.43TYPE: FI DIFFICULTY: Moderate KEYWORDS: one-way analysis of variance, sum of squares
80. Referring to Table 11-7, the value of MSA is __________, while MSW is __________.
ANSWER:41.19; 2.70TYPE: FI DIFFICULTY: Moderate KEYWORDS: one-way analysis of variance, mean squares
81. Referring to Table 11-7, the null hypothesis will be rejected at a level of significance of 0.01 if the value of the test statistic is greater than __________.
ANSWER:6.93TYPE: FI DIFFICULTY: Easy KEYWORDS: one-way analysis of variance, F test for factor, critical value
312 Analysis of Variance
82. Referring to Table 11-7, the value of the test statistic is __________.
ANSWER:15.24TYPE: FI DIFFICULTY: Moderate KEYWORDS: one-way analysis of variance, F test for factor, test statistic
83. Referring to Table 11-7, construct the ANOVA table from the sample data.
ANSWER:Analysis of VarianceSource df SS MS F pSeed Varieties 2 82.39 41.19 15.24 0.000508*Error 12 32 .43 2.70Total 14 114.82
* or p < 0.005, tabular valueTYPE: PR DIFFICULTY: Moderate KEYWORDS: one-way analysis of variance, F test for factor, properties
84. Referring to Table 11-7, state the null hypothesis that can be tested.
ANSWER:H0: Smith Walsh Trevor
TYPE: PR DIFFICULTY: EasyKEYWORDS: one-way analysis of variance, F test for factor, form of hypothesis
85. True or False: Referring to Table 11-7, the null hypothesis should be rejected at 0.005 level of significance.
ANSWER:TrueTYPE: TF DIFFICULTY: Moderate KEYWORDS: one-way analysis of variance, F test for factor, decision
86. True or False: Referring to Table 11-7, the decision made at 0.005 level of significance implies that all 3 means are significantly different.
ANSWER:FalseTYPE: TF DIFFICULTY: Moderate KEYWORDS: one-way analysis of variance, F test for factor, conclusion
87. True or False: Referring to Table 11-7, the test is valid only if the population of crop yields has the same variance for the 3 varieties.
ANSWER:TrueTYPE: TF DIFFICULTY: Easy KEYWORDS: one-way analysis of variance, F test for factor, assumption

Analysis of Variance 313
88. True or False: Referring to Table 11-7, the test is valid only if the population of crop yields is normally distributed for the 3 varieties.
ANSWER:TrueTYPE: TF DIFFICULTY: Easy KEYWORDS: one-way analysis of variance, F test for factor, assumption
89. Referring to Table 11-7, the agronomist decided to compare the 3 treatment means by using the Tukey-Kramer procedure with an overall level of significance of 0.01. There are ________ pairwise comparisons that can be made.
ANSWER:3TYPE: FI DIFFICULTY: Moderate KEYWORDS: one-way analysis of variance, Tukey-Kramer procedure, properties
90. Referring to Table 11-7, using an overall level of significance of 0.01, the critical value of the Studentized range Q used in calculating the critical range for the Tukey-Kramer procedure is ________.
ANSWER:5.04TYPE: FI DIFFICULTY: Easy KEYWORDS: one-way analysis of variance, Tukey-Kramer procedure, critical value
91. Referring to Table 11-7, using an overall level of significance of 0.01, the critical range for the Tukey-Kramer procedure is ________.
ANSWER:3.70TYPE: FI DIFFICULTY: Moderate KEYWORDS: one-way analysis of variance, Tukey-Kramer procedure, critical value
92. True or False: Referring to Table 11-7, based on the Tukey-Kramer procedure with an overall level of significance of 0.01, the agronomist would decide that there is a significant difference between the crop yield of Smith and Walsh seeds.
ANSWER:TrueTYPE: TF DIFFICULTY: Moderate KEYWORDS: one-way analysis of variance, Tukey-Kramer procedure, decision, conclusion
93. True or False: Referring to Table 11-7, based on the Tukey-Kramer procedure with an overall level of significance of 0.01, the agronomist would decide that there is a significant difference between the crop yield of Smith and Trevor seeds.
ANSWER:FalseTYPE: TF DIFFICULTY: Moderate
314 Analysis of Variance
KEYWORDS: one-way analysis of variance, Tukey-Kramer procedure, decision, conclusion94. True or False: Referring to Table 11-7, based on the Tukey-Kramer procedure with an overall
level of significance of 0.01, the agronomist would decide that there is a significant difference between the crop yield of Walsh and Trevor seeds.
ANSWER:FalseTYPE: TF DIFFICULTY: Moderate KEYWORDS: one-way analysis of variance, Tukey-Kramer procedure, decision, conclusion
TABLE 11-8
A hotel chain has identically sized resorts in 5 locations. The data that follow resulted from analyzing the hotel occupancies on randomly selected days in the 5 locations. ROW Caymen Pennkamp California Mayaguez Maui1 28 40 21 37 222 33 35 21 47 193 41 33 27 45 25
Analysis of VarianceSource df SS MS F pLocation 4 963.6 11.47 0.001Error 10 210 .0 Total
95. Referring to Table 11-8, the value of the element in the ANOVA table that always provides an estimate of the population variance is ________.
ANSWER:21.0TYPE: FI DIFFICULTY: Difficult KEYWORDS: one-way analysis of variance, properties
96. Referring to Table 11-8, the test ratio involves the ratio of 2 elements of the ANOVA table. Of these elements, the value of the one that provides an estimate of the population variance only when the null hypothesis is true is ________.
ANSWER:240.9TYPE: FI DIFFICULTY: Difficult KEYWORDS: one-way analysis of variance, properties
97. True or False: Referring to Table 11-8, if a level of significance of 0.05 is chosen, the null hypothesis should be rejected.
ANSWER:TrueTYPE: TF DIFFICULTY: Easy KEYWORDS: one-way analysis of variance, F test for factor, decision

Analysis of Variance 315
98. True or False: Referring to Table 11-8, if a level of significance of 0.05 is chosen, the decision made indicates that all 5 locations have different mean occupancy rates.
ANSWER:FalseTYPE: TF DIFFICULTY: Easy KEYWORDS: one-way analysis of variance, F test for factor, conclusion
99. True or False: Referring to Table 11-8, if a level of significance of 0.05 is chosen, the decision made indicates that at least 2 of the 5 locations have different mean occupancy rates.
ANSWER:TrueTYPE: TF DIFFICULTY: Easy KEYWORDS: one-way analysis of variance, F test for factor, conclusion
100. Referring to Table 11-8, the among group variation or SSA is _________.
ANSWER:963.6TYPE: FI DIFFICULTY: EasyKEYWORDS: one-way analysis of variance, sum of squares
101. Referring to Table 11-8, the within group variation or SSW is _________.
ANSWER:210.0TYPE: FI DIFFICULTY: EasyKEYWORDS: one-way analysis of variance, sum of squares
102. Referring to Table 11-8, the total variation or SST is ________.
ANSWER:1,173.6TYPE: FI DIFFICULTY: EasyKEYWORDS: one-way analysis of variance, sum of squares
103. Referring to Table 11-8, the value of MSA is ______ while MSW is _______.
ANSWER: 240.9; 21.0TYPE: FI DIFFICULTY: EasyKEYWORDS: one-way analysis of variance, mean squares
104. Referring to Table 11-8, the numerator and denominator degrees of freedom of the test ratio are ________ and ________, respectively.
ANSWER:4; 10TYPE: FI DIFFICULTY: Easy
316 Analysis of Variance
KEYWORDS: one-way analysis of variance, degrees of freedom105. True or False: Referring to Table 11-8, the total mean squares is 261.90.
ANSWER:FalseTYPE: TF DIFFICULTY: EasyKEYWORDS: one-way analysis of variance, sum of squares
TABLE 11-9
The marketing manager of a company producing a new cereal aimed for children wants to examine the effect of the color and shape of the box's logo on the approval rating of the cereal. He combined 4 colors and 3 shapes to produce a total of 12 designs. Each logo was presented to 2 different groups (a total of 24 groups) and the approval rating for each was recorded and is shown below. The manager analyzed these data using the = 0.05 level of significance for all inferences.
COLORSSHAPES Red Green Blue Yellow
Circle 54 67 36 4544 61 44 41
Square 34 56 36 2136 58 30 25
Diamond 46 60 34 3148 60 38 33
Analysis of VarianceSource df SS MS F pColors 3 2711.17 903.72 72.30 0.000Shapes 2 579.00 289.50 23.16 0.000Interaction 6 150.33 25.06 2.00 0.144Error 12 150 .00 12.50Total 23 3590.50
106. Referring to Table 11-9, the mean square for the factor color is ________.
ANSWER:903.72TYPE: FI DIFFICULTY: Easy KEYWORDS: two-factor analysis of variance, mean squares
107. Referring to Table 11-9, the mean square for the factor shape is ________.
ANSWER:289.50TYPE: FI DIFFICULTY: Easy KEYWORDS: two-factor analysis of variance, mean squares
Analysis of Variance 317
108. Referring to Table 11-9, the mean square for the interaction of color and shape is ________.
ANSWER:25.06TYPE: FI DIFFICULTY: Easy KEYWORDS: two-factor analysis of variance, mean squares
109. Referring to Table 11-9, the mean square for error is ________.
ANSWER:12.50TYPE: FI DIFFICULTY: Easy KEYWORDS: two-factor analysis of variance, mean squares
110. Referring to Table 11-9, the critical value of the test for significant differences between colors is ________.
ANSWER:3.49TYPE: FI DIFFICULTY: Easy KEYWORDS: two-factor analysis of variance, F test for factor, critical value
111. Referring to Table 11-9, the value of the statistic used to test for significant differences between colors is ________.
ANSWER:72.30TYPE: FI DIFFICULTY: Easy KEYWORDS: two-factor analysis of variance, F test for factor, test statistic
112. True or False: Referring to Table 11-9, based on the results of the hypothesis test, it appears that there is a significant effect on the approval rating associated with the color of the logo.
ANSWER:TrueTYPE: TF DIFFICULTY: Easy KEYWORDS: two-factor analysis of variance, F test for factor, decision, conclusion
113. Referring to Table 11-9, the critical value in the test for significant differences between shapes is ________.
ANSWER:3.89TYPE: FI DIFFICULTY: Easy KEYWORDS: two-factor analysis of variance, F test for factor, critical value
318 Analysis of Variance
114. Referring to Table 11-9, the value of the statistic used to test for significant differences between shapes is ________.
ANSWER:23.16TYPE: FI DIFFICULTY: Easy KEYWORDS: two-factor analysis of variance, F test for factor, test statistic
115. True or False: Referring to Table 11-9, based on the results of the hypothesis test, it appears that there is a significant effect associated with the shape of the logo.
ANSWER:TrueTYPE: TF DIFFICULTY: Easy KEYWORDS: two-factor analysis of variance, F test for factor, decision, conclusion
116. Referring to Table 11-9, the critical value in the test for a significant interaction is ________.
ANSWER:3.00TYPE: FI DIFFICULTY: Easy KEYWORDS: two-factor analysis of variance, F test for interaction, critical value
117. Referring to Table 11-9, the value of the statistic used to test for an interaction is ________.
ANSWER:2.00TYPE: FI DIFFICULTY: Easy KEYWORDS: two-factor analysis of variance, F test for interaction, test statistic
118. True or False: Referring to Table 11-9, based on the results of the hypothesis test, it appears that there is a significant interaction.
ANSWER:FalseTYPE: TF DIFFICULTY: Easy KEYWORDS: two-factor analysis of variance, F test for interaction, decision, conclusion
Analysis of Variance 319
TABLE 11-10
An agronomist wants to compare the crop yield of 3 varieties of chickpea seeds. She plants all 3 varieties of the seeds on each of 5 different patches of fields. She then measures the crop yield in bushels per acre. Treating this as a randomized block design, the results are presented in the table that follows:Fields Smith Walsh Trevor1 11.1 19.0 14.62 13.5 18.0 15.73 15.3 19.8 16.84 14.6 19.6 16.75 9.8 16.6 15.2
119. Referring to Table 11-10, the agronomist decided to perform a randomized block F test for the difference in the means. The amount of total variation or SST is __________.
ANSWER:114.82TYPE: FI DIFFICULTY: Moderate KEYWORDS: randomized block design, sum of squares
120. Referring to Table 11-10, the among group variation or SSA is __________.
ANSWER:82.39TYPE: FI DIFFICULTY: Moderate KEYWORDS: randomized block design, sum of squares
121. Referring to Table 11-10, the among block variation or SSBL is __________.
ANSWER:24.46TYPE: FI DIFFICULTY: Moderate KEYWORDS: randomized block design, sum of squares
122. Referring to Table 11-10, the value of MSA is __________, while MSBL is __________.
ANSWER:41.19; 6.11TYPE: FI DIFFICULTY: Moderate KEYWORDS: randomized block design, mean squares

320 Analysis of Variance
123. Referring to Table 11-10, the null hypothesis for the randomized block F test for the difference in the means is
a)
b)
c)
d)
ANSWER:bTYPE: MC DIFFICULTY: EasyKEYWORDS: randomized block design, F test for factor, form of hypothesis
124. Referring to Table 11-10, what are the degrees of freedom of the randomized block F test for the difference in the means at a level of significance of 0.01?
ANSWER:2 numerator and 8 denominator degrees of freedomTYPE: PR DIFFICULTY: Easy KEYWORDS: randomized block design, F test for factor, degrees of freedom
125. Referring to Table 11-10, what is the critical value of the randomized block F test for the difference in the means at a level of significance of 0.01?
ANSWER:8.65TYPE: PR DIFFICULTY: Easy KEYWORDS: randomized block design, F test for factor, critical value
126. Referring to Table 11-10, what is the value of the test statistic for the randomized block F test for the difference in the means?
ANSWER:41.32TYPE: PR DIFFICULTY: Moderate KEYWORDS: randomized block design, F test for factor, test statistic
127. Referring to Table 11-10, what is the p-value of the test statistic for the randomized block F test for the difference in the means?
ANSWER:6.07E-05TYPE: PR DIFFICULTY: Moderate KEYWORDS: randomized block design, F test for factor, p-value
Analysis of Variance 321
128. True or False: Referring to Table 11-10, the null hypothesis for the randomized block F test for the difference in the means should be rejected at a 0.01 level of significance.
ANSWER:TrueTYPE: TF DIFFICULTY: EasyKEYWORDS: randomized block design, F test for factor, decision
129. True or False: Referring to Table 11-10, the decision made at a 0.01 level of significance on the randomized block F test for the difference in means implies that all 3 means are significantly different.
ANSWER:FalseTYPE: TF DIFFICULTY: Moderate KEYWORDS: randomized block design, F test for factor, conclusion
130. True or False: Referring to Table 11-10, the randomized block F test is valid only if the population of crop yields has the same variance for the 3 varieties.
ANSWER:TrueTYPE: TF DIFFICULTY: Easy KEYWORDS: randomized block design, F test for factor, assumption
131. True or False: Referring to Table 11-10, the randomized block F test is valid only if the population of crop yields is normally distributed for the 3 varieties.
ANSWER:TrueTYPE: TF DIFFICULTY: Easy KEYWORDS: randomized block design, F test for factor, assumption
132. True or False: Referring to Table 11-10, the randomized block F test is valid only if there is no interaction between the variety of seeds and the patches of fields.
ANSWER:TrueTYPE: TF DIFFICULTY: Easy KEYWORDS: randomized block design, F test for factor, assumption
133. Referring to Table 11-10, the agronomist decided to compare the 3 treatment means by using the Tukey multiple comparison procedure with an overall level of significance of 0.01. How many pairwise comparisons can be made?
ANSWER:3TYPE: PR DIFFICULTY: Moderate KEYWORDS: randomized block design, Tukey procedure, properties

322 Analysis of Variance
134. Referring to Table 11-10, using an overall level of significance of 0.01, what is the critical value of the Studentized range Q used in calculating the critical range for the Tukey multiple comparison procedure?
ANSWER:5.63TYPE: PR DIFFICULTY: Easy KEYWORDS: randomized block design, Tukey procedure, critical value
135. Referring to Table 11-10, using an overall level of significance of 0.01, what is the critical range for the Tukey multiple comparison procedure?
ANSWER:2.51TYPE: PR DIFFICULTY: Moderate KEYWORDS: randomized block design, Tukey procedure, critical value
136. True or False: Referring to Table 11-10, based on the Tukey multiple comparison procedure with an overall level of significance of 0.01, the agronomist would decide that there is a significant difference between the crop yield of Smith and Walsh seeds.
ANSWER:TrueTYPE: TF DIFFICULTY: Moderate KEYWORDS: randomized block design, Tukey procedure, decision, conclusion
137. True or False: Referring to Table 11-10, based on the Tukey-Kramer procedure with an overall level of significance of 0.01, the agronomist would decide that there is a significant difference between the crop yield of Smith and Trevor seeds.
ANSWER:TrueTYPE: TF DIFFICULTY: Moderate KEYWORDS: randomized block design, Tukey procedure, decision, conclusion
138. True or False: Referring to Table 11-10, based on the Tukey multiple comparison procedure with an overall level of significance of 0.01, the agronomist would decide that there is a significant difference between the crop yield of Walsh and Trevor seeds.
ANSWER:TrueTYPE: TF DIFFICULTY: Moderate KEYWORDS: randomized block design, Tukey procedure, decision, conclusion

Analysis of Variance 323
139. Referring to Table 11-10, what is the null hypothesis for testing the block effects?a)
b)
c)
d)
ANSWER:aTYPE: MC DIFFICULTY: EasyKEYWORDS: randomized block design, F test for block effects, form of hypothesis
140. Referring to Table 11-10, what are the degrees of freedom of the F test statistic for testing the block effects?
ANSWER:4 numerator and 8 denominator degrees of freedomTYPE: PR DIFFICULTY: EasyKEYWORDS: randomized block design, F test for block effects, degrees of freedom
141. Referring to Table 11-10, what is the value of the F test statistic for testing the block effects?
ANSWER:6.13TYPE: PR DIFFICULTY: ModerateKEYWORDS: randomized block design, F test for block effects, test statistic
142. Referring to Table 11-10, what is the critical value for testing the block effects at a 0.01 level of significance?
ANSWER:7.01TYPE: PR DIFFICULTY: ModerateKEYWORDS: randomized block design, F test for block effects, critical value
143. Referring to Table 11-10, what is the p-value of the F test statistic for testing the block effects?
ANSWER:0.015 or between 0.01 and 0.025TYPE: PR DIFFICULTY: ModerateKEYWORDS: randomized block design, F test for block effects, p-value
144. True or False: Referring to Table 11-10, the null hypothesis for the F test for the block effects should be rejected at a 0.01 level of significance.
ANSWER:FalseTYPE: TF DIFFICULTY: EasyKEYWORDS: randomized block design, F test for block effects, decision
324 Analysis of Variance
145. True or False: Referring to Table 11-10, the decision made at a 0.01 level of significance on the F test for the block effects implies that the blocking has been advantageous in reducing the experiment error.
ANSWER:FalseTYPE: TF DIFFICULTY: Moderate KEYWORDS: randomized block design, F test for block effects, conclusion
146. Referring to Table 11-10, what is the estimated relative efficiency?
ANSWER:2.47TYPE: PR DIFFICULTY: ModerateKEYWORDS: randomized block design, F test for block effects, relative efficiency
147. True or False: Referring to Table 11-10, the relative efficiency means that 2.47 times as many observations in each variety group would be needed in a one-way ANOVA design, as compared to the randomized block design in order to obtain the same precision for comparison of the variety means.
ANSWER:TrueTYPE: TF DIFFICULTY: ModerateKEYWORDS: randomized block design, F test for block effects, relative efficiency, interpretation