statistics 04 anova. analysis of variance (anova) z test or t test is used to test whether two...
Post on 20-Dec-2015
231 views
TRANSCRIPT
Statistics 04
ANOVA
Analysis of Variance (ANOVA)
• Z test or t test is used to test whether two sample means are sufficiently different to indicate the samples are from populations with different population means.
• When more than two different groups are involved, we need to depend on ANOVA for the inference.
Cases of more than two groups
• Vocabulary test of candidates from four different regions (Europe, South America, North Africa, Far East)
• Different parts of a test (listening, reading, vocabulary, Cloze, translation)
• Different teaching methods (three textbooks)
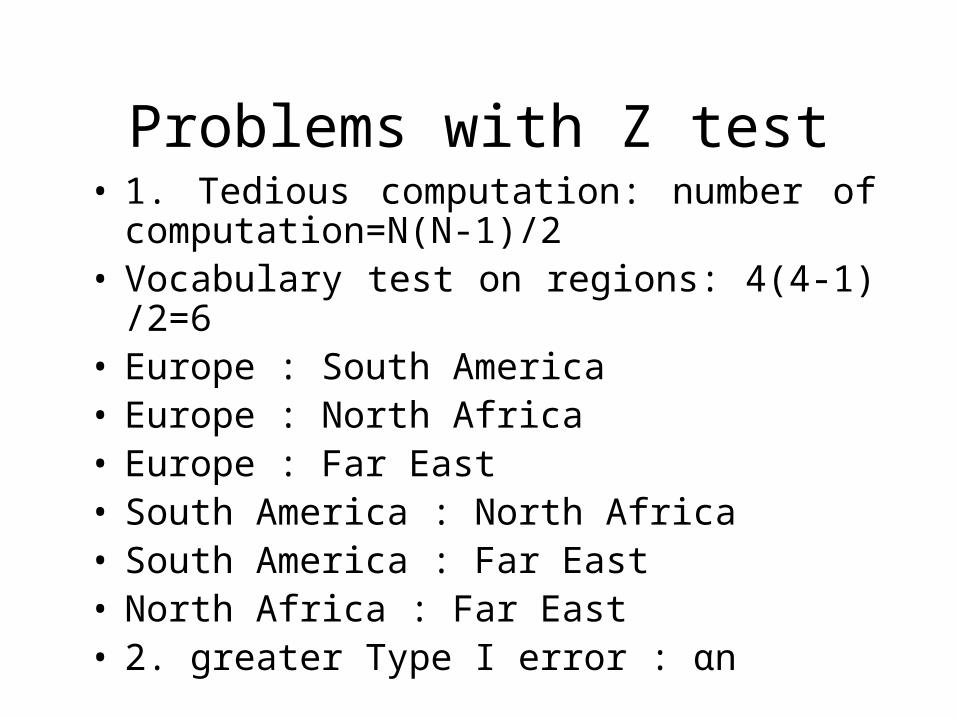
Problems with Z test• 1. Tedious computation: number of computation=
N(N-1)/2• Vocabulary test on regions: 4(4-1)/2=6• Europe : South America• Europe : North Africa• Europe : Far East• South America : North Africa• South America : Far East• North Africa : Far East• 2. greater Type I error : αn

Principles of ANOVA• Two kinds of differences in a test: systematic differences and random
errors• Systematic differences are caused by different experimental conditions.• Random errors are caused by any factors other than experimental
conditions.• The total variance between different groups represents systematic
differences• The total variance within the group is random errors.• The ratio of these two variances follows the F distribution.• F=Sb
2/Sw2
• Null hypothesis: Sb2 is not larger than Sw
2
• Large values of the F statistic throw doubt on the validity of the null hypothesis.
Principles of ANOVA
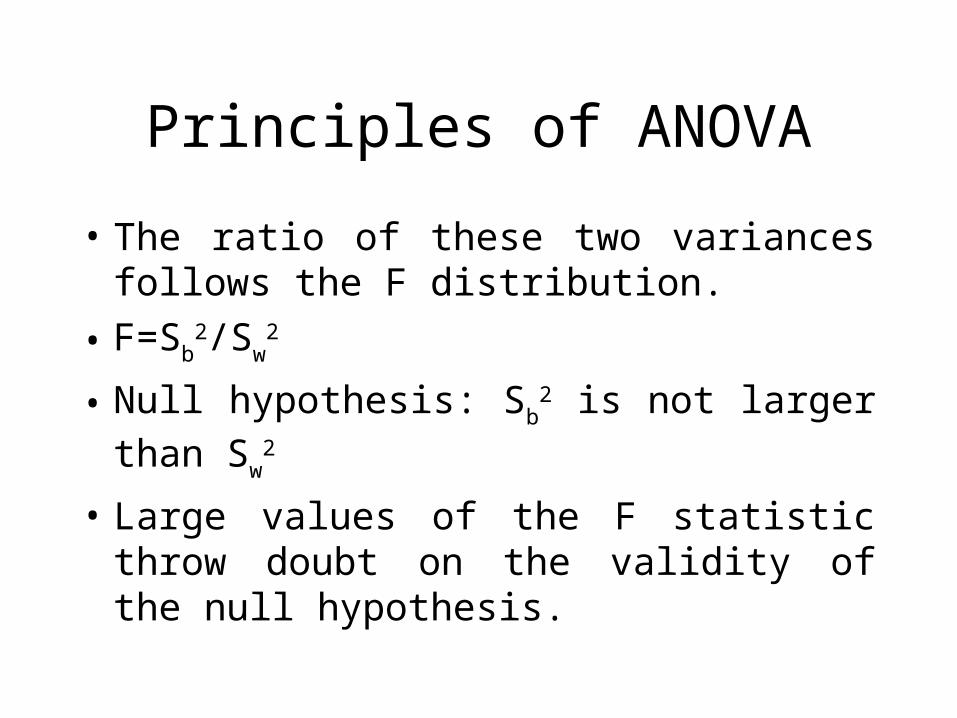
• The ratio of these two variances follows the F distribution.
• F=Sb2/Sw
2
• Null hypothesis: Sb2 is not larger than Sw
2
• Large values of the F statistic throw doubt on the validity of the null hypothesis.
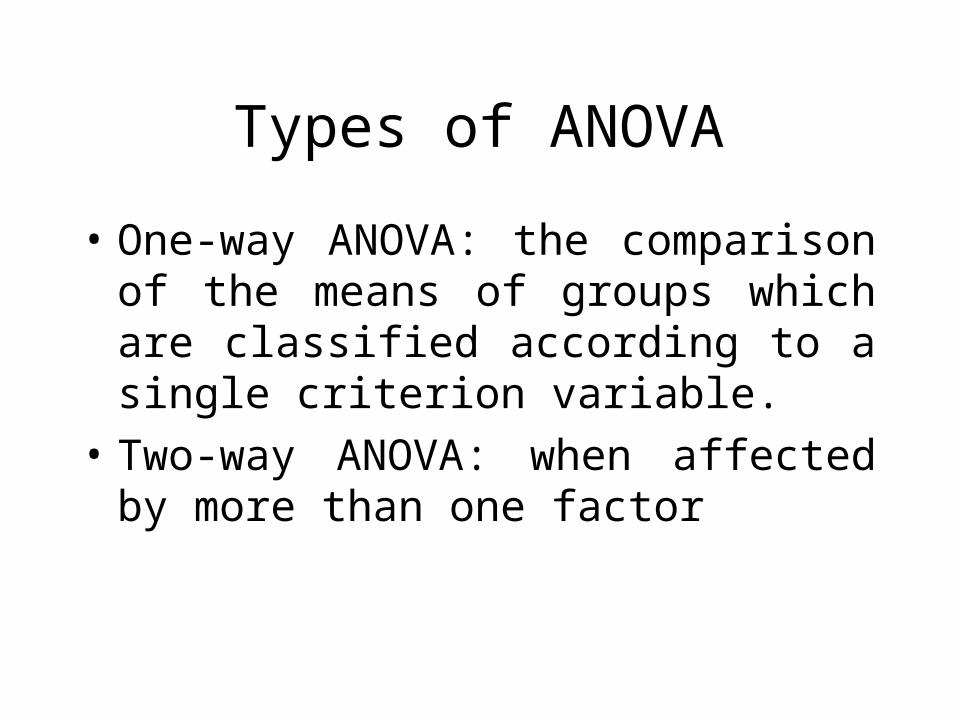
Types of ANOVA
• One-way ANOVA: the comparison of the means of groups which are classified according to a single criterion variable.
• Two-way ANOVA: when affected by more than one factor
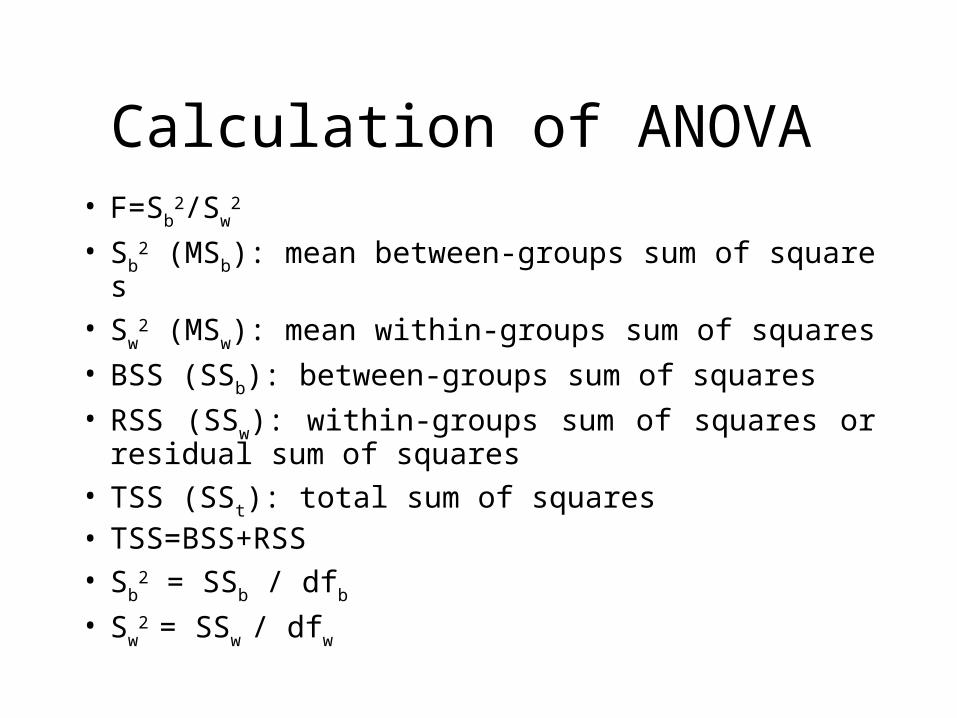
Calculation of ANOVA • F=Sb
2/Sw2
• Sb2 (MSb): mean between-groups sum of squares
• Sw2 (MSw): mean within-groups sum of squares
• BSS (SSb): between-groups sum of squares
• RSS (SSw): within-groups sum of squares or residual sum of squares
• TSS (SSt): total sum of squares• TSS=BSS+RSS• Sb
2 = SSb / dfb
• Sw2 = SSw / dfw
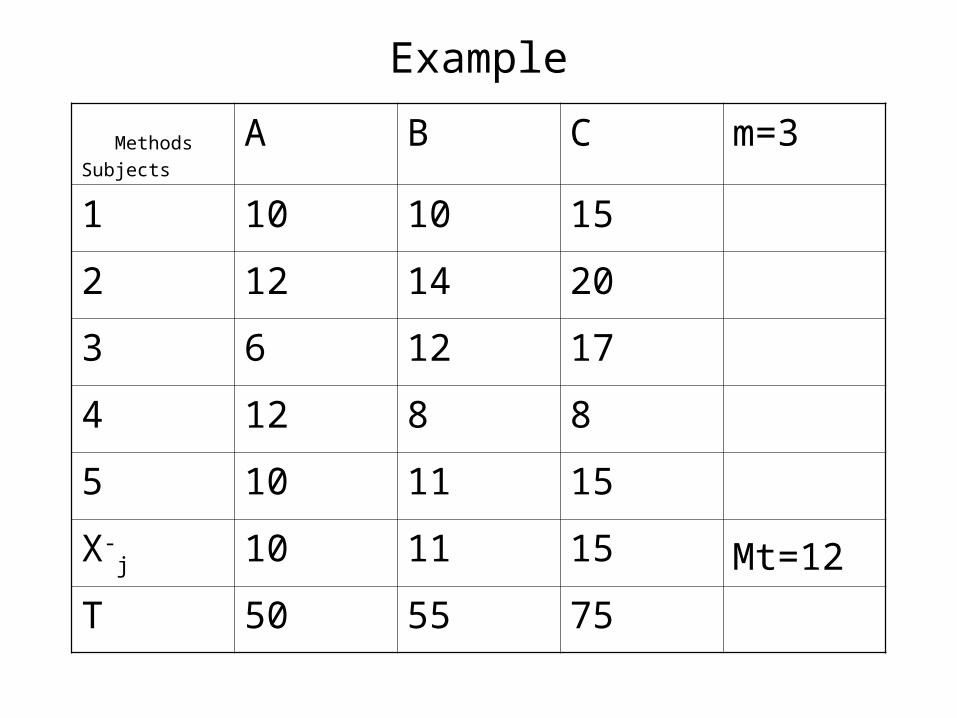
Example Methods
Subjects A B C m=3
1 10 10 15
2 12 14 20
3 6 12 17
4 12 8 8
5 10 11 15
X-j 10 11 15 Mt=12
T 50 55 75
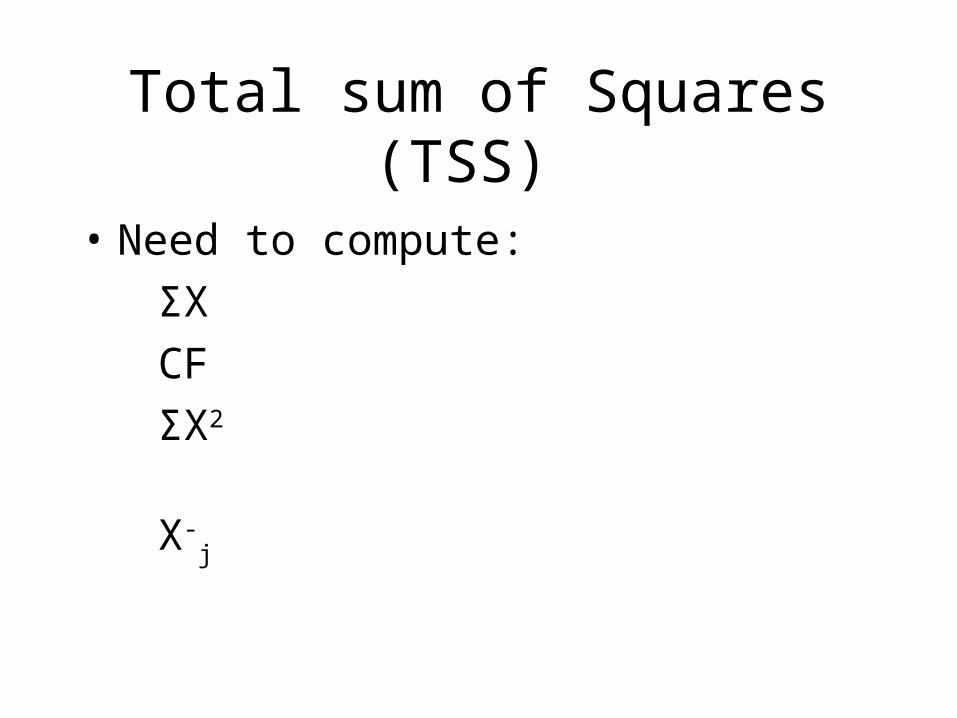
Total sum of Squares (TSS)
• Need to compute:
ΣX
CF
ΣX2
X-j

Computation of ΣX
• ΣX: the sum of the all observations
• ΣX = X1,1+X2,1+ … X1,2+X2,2+ … + Xi,j
• Example
• ΣX = 10+12+ … +10+14+ … + 8+15 =180

Computation of Correction Factor (CF)
• CF=(ΣX)2/mn
• m: the number of samples
• n: the size of each sample
• Example:
• (ΣX)2=1802= 32400• CF= 32400/(3*5)= 2160
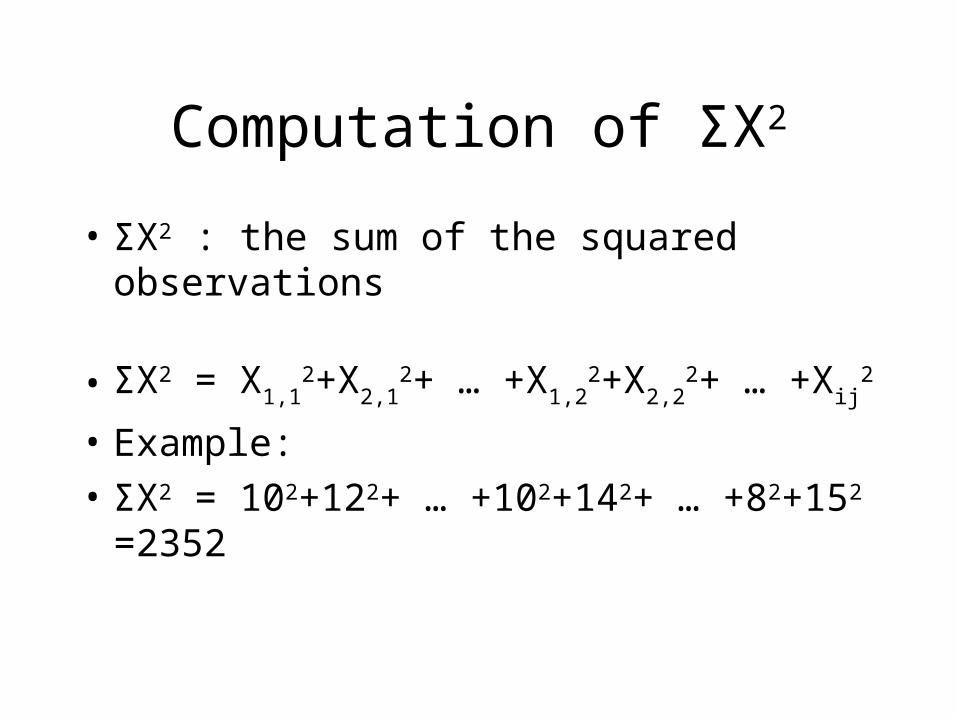
Computation of ΣX2
• ΣX2 : the sum of the squared observations
• ΣX2 = X1,12+X2,1
2+ … +X1,22+X2,2
2+ … +Xij2
• Example:
• ΣX2 = 102+122+ … +102+142+ … +82+152 =2352
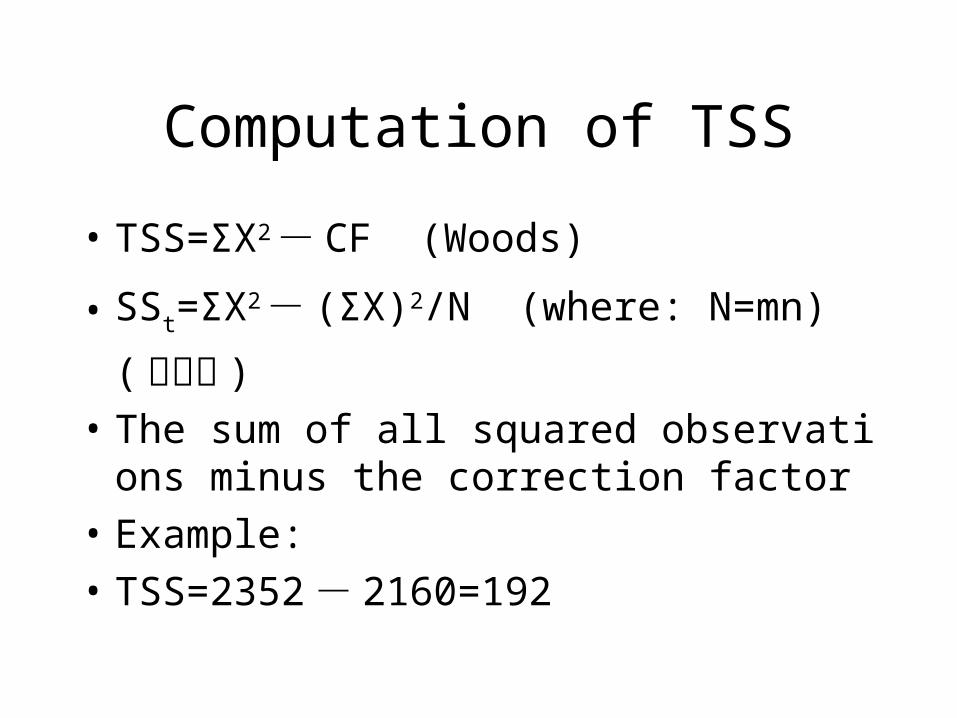
Computation of TSS
• TSS=ΣX2 - CF (Woods)
• SSt=ΣX2 - (ΣX)2/N (where: N=mn) ( 韩宝成 )
• The sum of all squared observations minus the correction factor
• Example:
• TSS=2352 - 2160=192

Computation of BSS
• BSS=ΣXj2/n - CF (Woods)
• SSb=ΣT2/n - (ΣX)2/N (where: T=total of a group,
N=mn) ( 韩宝成 )• The sum of the totals of each group divided by the
size of the sample (all samples are of the same size), then minus the correction factor
• Example:• BSS=(502+552+752)/5 - 2160=11150/5 - 2160=
2230 - 2160=70

Computation of RSS
• RSS=TSS-BSS
• Example
• RSS=192 - 70=122
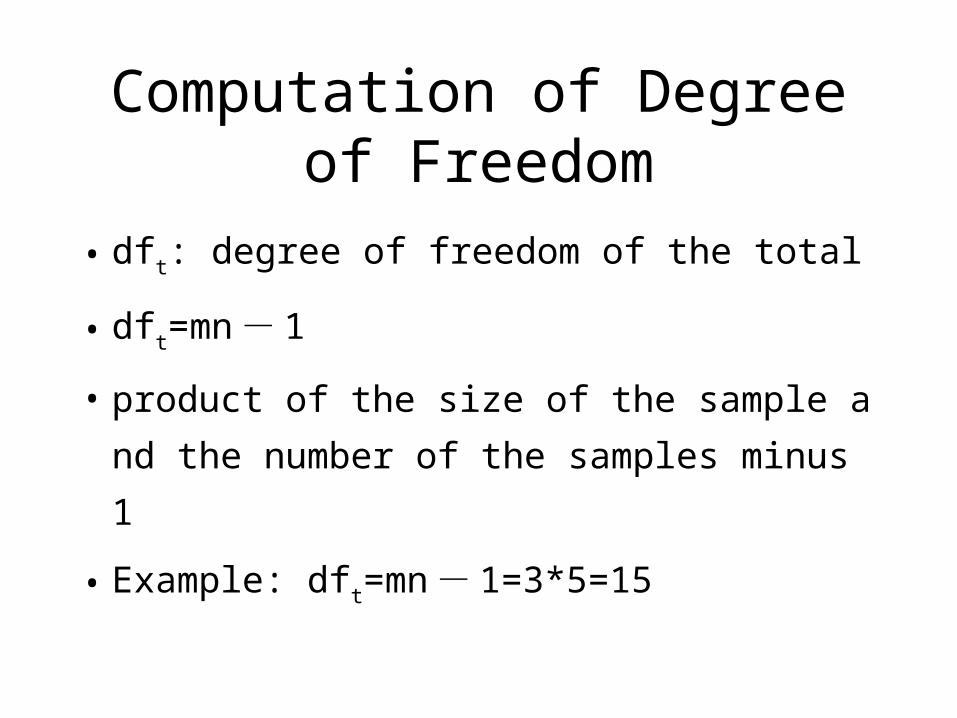
Computation of Degree of Freedom
• dft: degree of freedom of the total
• dft=mn - 1
• product of the size of the sample and the nu
mber of the samples minus 1
• Example: dft=mn - 1=3*5=15
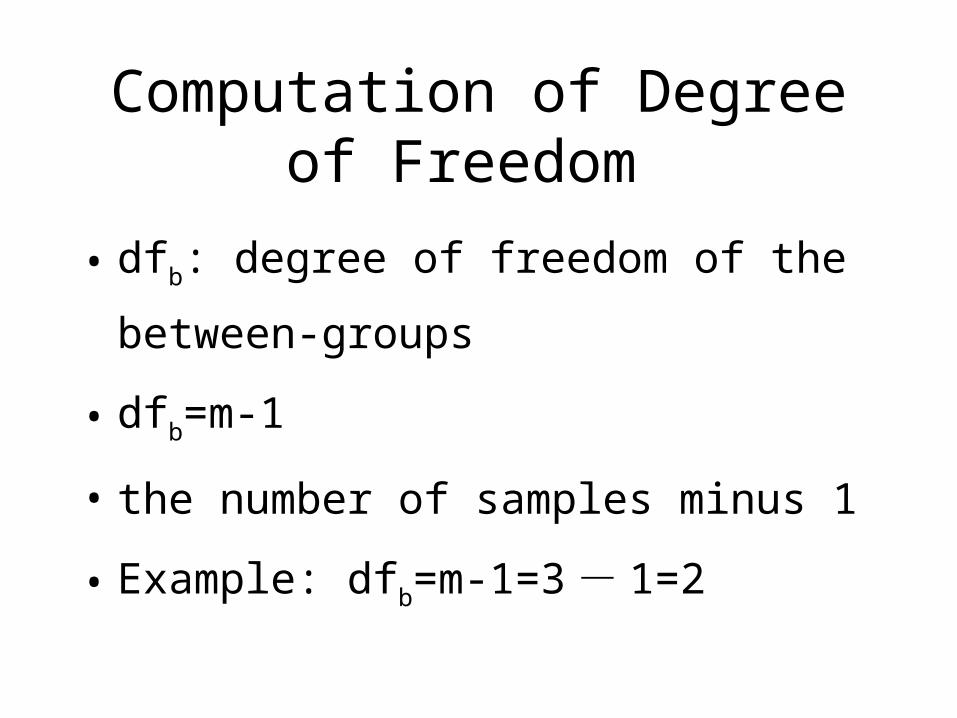
Computation of Degree of Freedom
• dfb: degree of freedom of the between-grou
ps
• dfb=m-1
• the number of samples minus 1
• Example: dfb=m-1=3 - 1=2
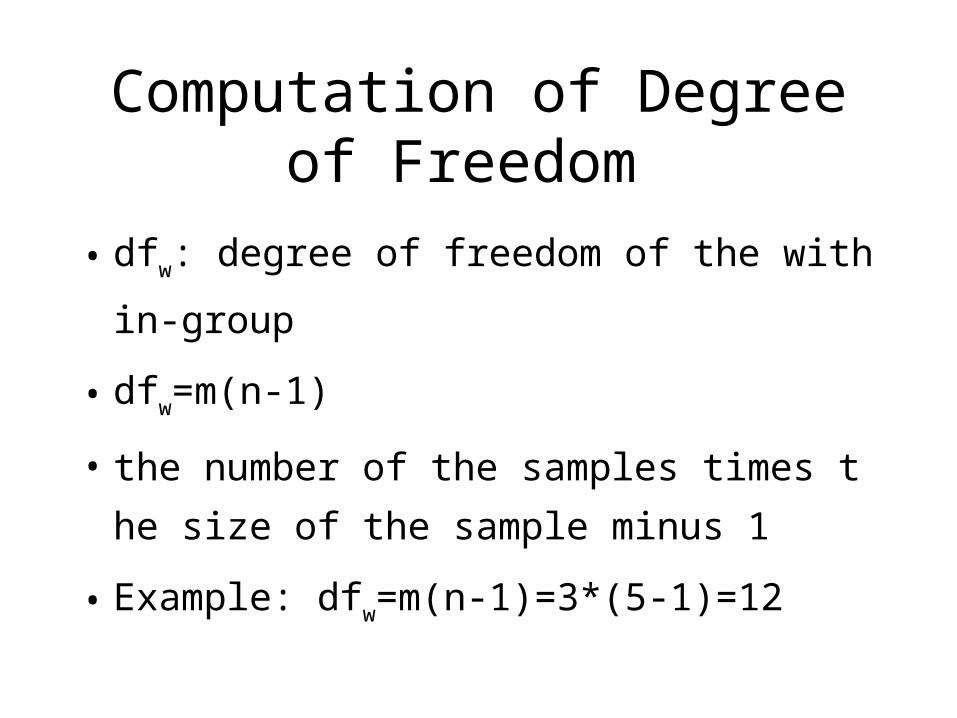
Computation of Degree of Freedom
• dfw: degree of freedom of the within-group
• dfw=m(n-1)
• the number of the samples times the size of
the sample minus 1
• Example: dfw=m(n-1)=3*(5-1)=12
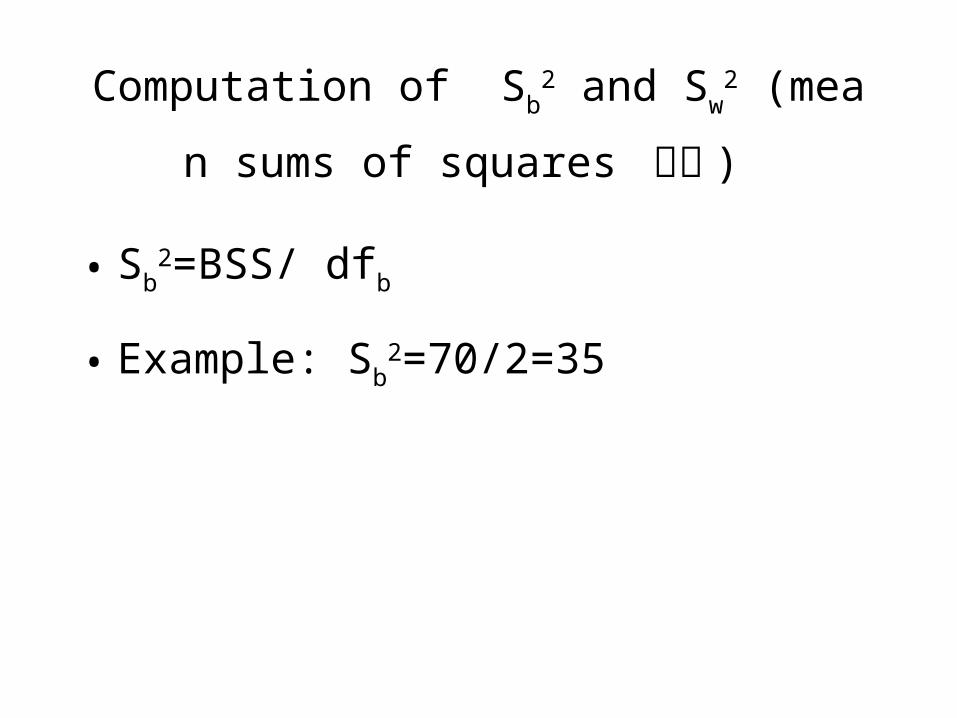
Computation of Sb2 and Sw
2 (mean sums of sq
uares 均方 )
• Sb2=BSS/ dfb
• Example: Sb2=70/2=35

Computation of Sb2 and Sw
2 (mean sums of sq
uares 均方 )
• Sw2=RSS/ dfw
• Example: Sw2=122/12=10.17
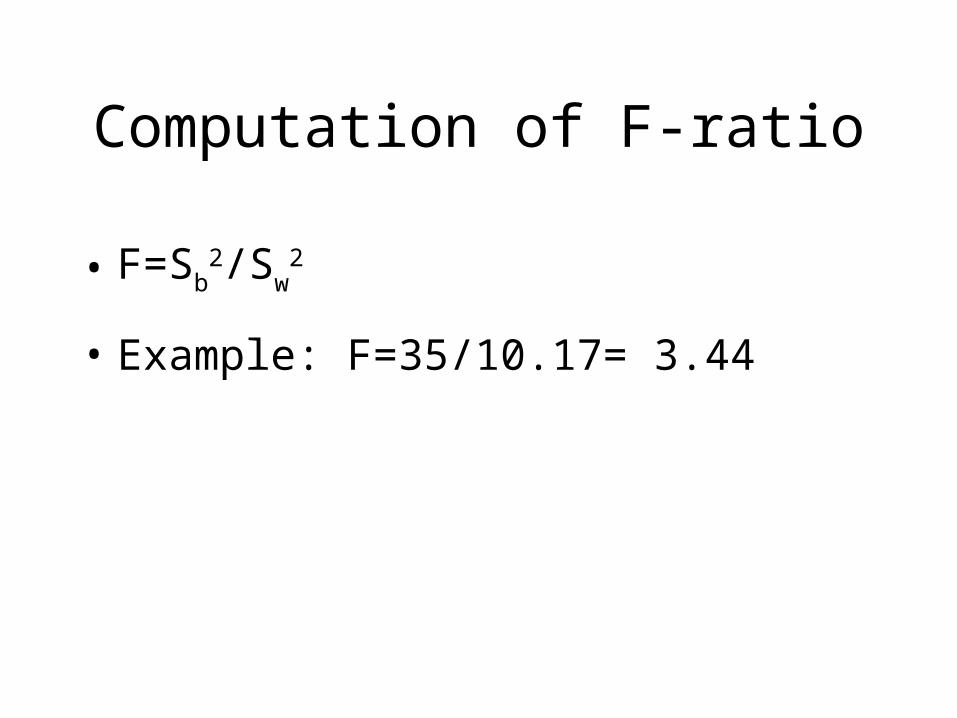
Computation of F-ratio
• F=Sb2/Sw
2
• Example: F=35/10.17= 3.44
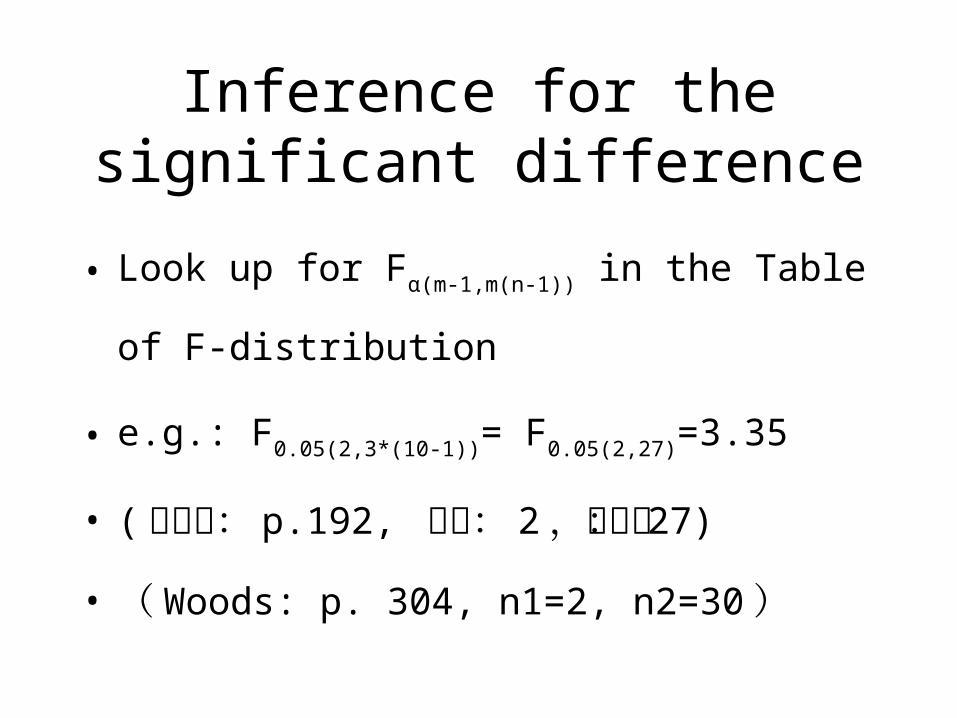
Inference for the significant difference
• Look up for Fα(m-1,m(n-1)) in the Table of F-distributi
on
• e.g.: F0.05(2,3*(10-1))= F0.05(2,27)=3.35
• ( 韩宝成: p.192, 分子: 2 ,分母: 27)
• ( Woods: p. 304, n1=2, n2=30 )

Compare F with Fα(m-1,m(n-1))
• e.g. F=3.44
• F0.05(2,27)=3.35
• F> F0.05(2,27)
• Conclusion: p<0.05 (H0 rejected)
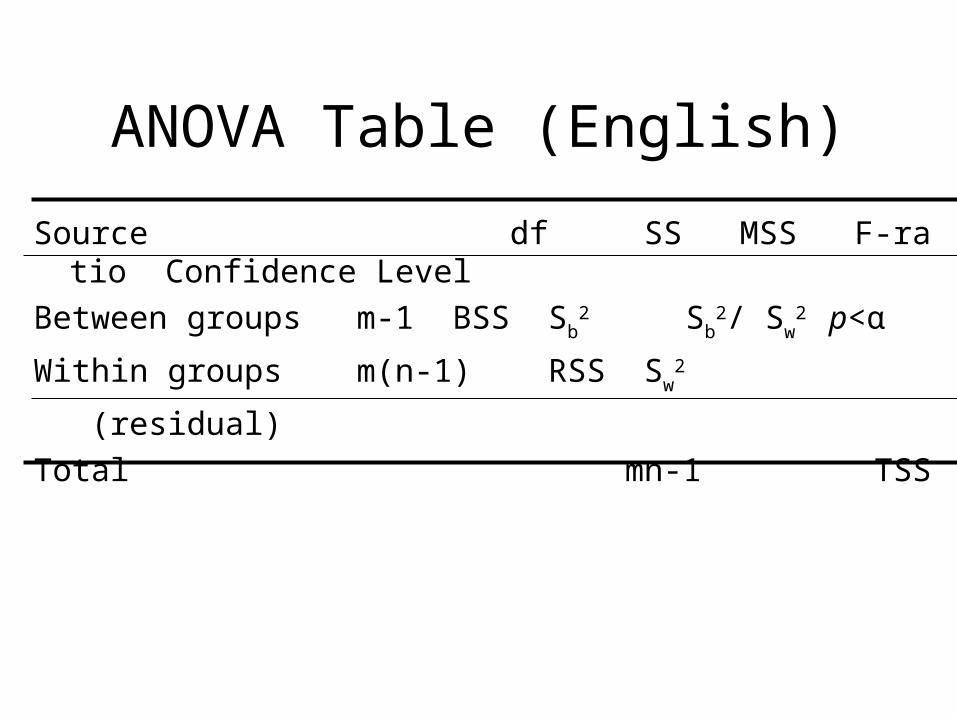
ANOVA Table (English)
Source df SS MSS F-ratio Confidence Level
Between groups m-1 BSS Sb2 Sb
2/ Sw2 p<α
Within groups m(n-1) RSS Sw2
(residual)
Total mn-1 TSS

ANOVA Table (Chinese)
变异来源 平方和 自由度 均方 F 显著性水平
组间 BSS m-1 Sb2 Sb
2/ Sw2 p<α
组内 RSS m(n-1) Sw2
总变异 TSS mn-1

ANOVA Table (Example)
Source df SS MSS F-ratio Confidence Level
Between groups 2 70 35 3.44 p<0.05Within groups 27 122 10.17
(residual)
Total 14 192

Steps of the Computation
• 1. Computation of sums of squares: TSS, BSS, RSS
• 2. Determination of degrees of freedom: dft, dfb, dfw
• 3. Computation of mean sums of squares: Sb2, Sw
2
• 4. F testing: F, Fα(m-1,m(n-1))
• 5. Output an ANOVA table

Consistence of variances • Fmax=S2
max/S2min
• Check the Table of Critical Value of Fmax
( 韩宝成: p.198)
• If Fmax > Fmaxα, there is inconsistency among
the variances.
• If Fmax < Fmaxα, there is no significant differe
nce among the variances

• 完全随机化设计的方差分析( complete randomized design )
• 随机区组实验设计的方差分析 (randomized block design)
• 多个平均数之间的比较

完全随机化设计的方差分析( complete randomized desig
n ) • 样本容量相同 • 样本容量不同

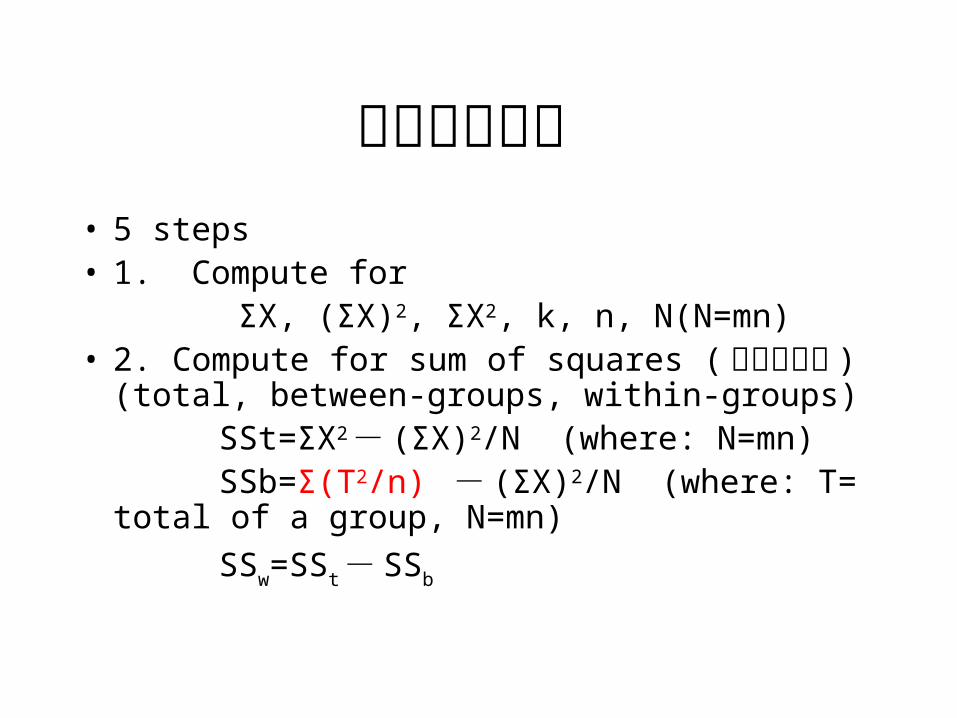
样本容量相同 • 5 steps• 1. Compute for ΣX, (ΣX)2, ΣX2, k, n, N(N=mn)
• 2. Compute for sum of squares ( 离差平方和 ) (total, between-groups, within-groups)
SSt=ΣX2 - (ΣX)2/N (where: N=mn) SSb=ΣT2/n - (ΣX)2/N (where: T=total of a gr
oup, N=mn)
SSw=SSt - SSb
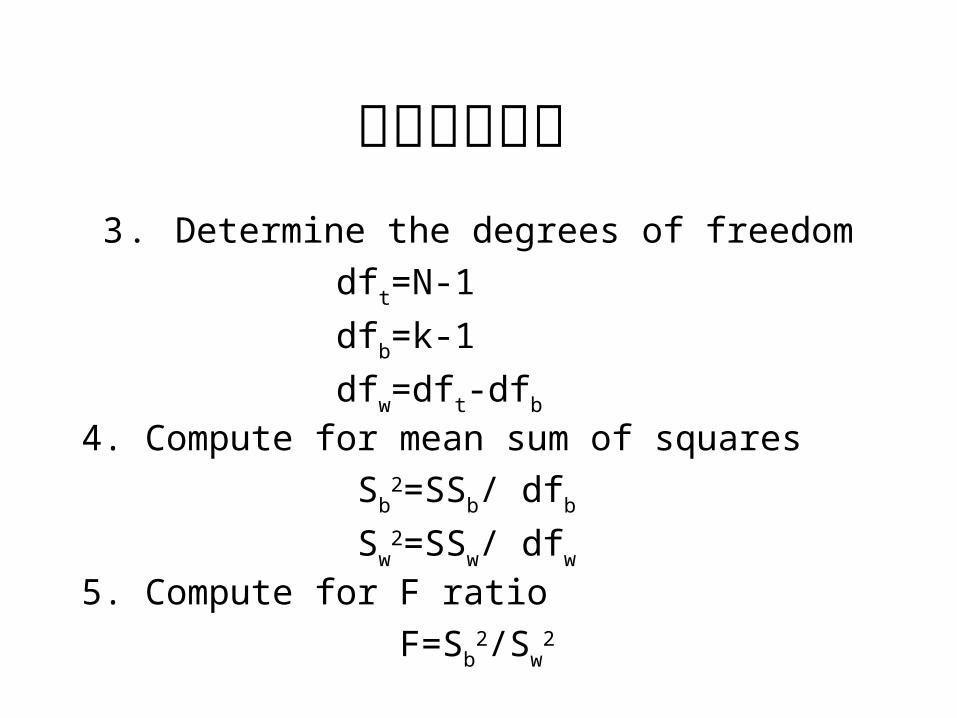
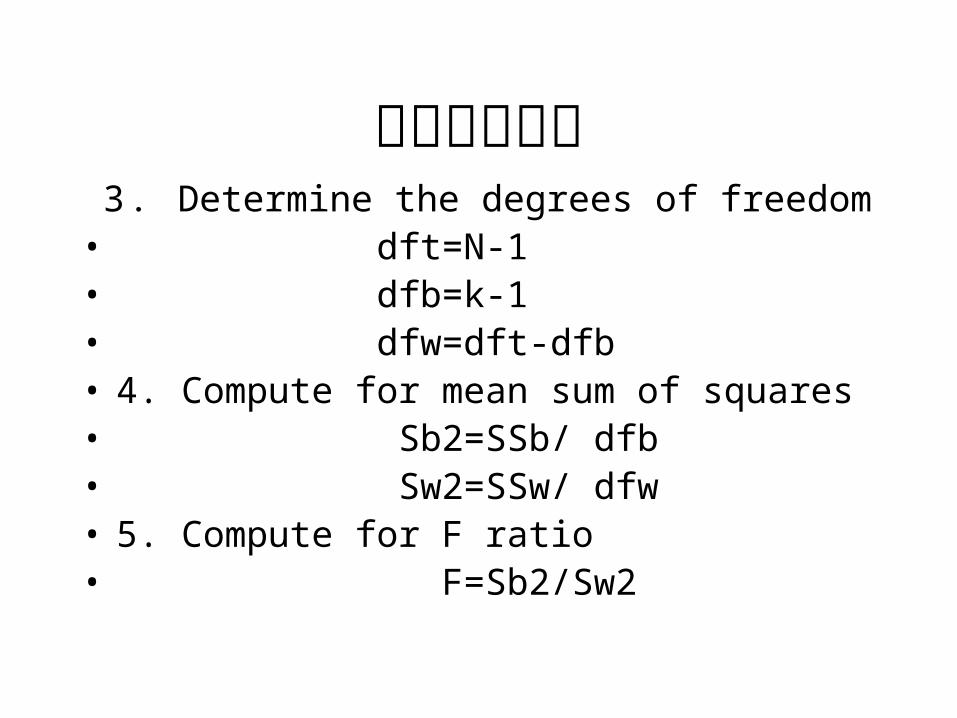
样本容量相同 3 . Determine the degrees of freedom
dft=N-1
dfb=k-1
dfw=dft-dfb
4. Compute for mean sum of squares
Sb2=SSb/ dfb
Sw2=SSw/ dfw
5. Compute for F ratio
F=Sb2/Sw
2
样本容量不同 • 5 steps• 1. Compute for ΣX, (ΣX)2, ΣX2, k, n, N(N=mn)• 2. Compute for sum of squares ( 离差平方和 ) (to
tal, between-groups, within-groups) SSt=ΣX2 - (ΣX)2/N (where: N=mn) SSb=Σ(T2/n) - (ΣX)2/N (where: T=total of a g
roup, N=mn)
SSw=SSt - SSb
样本容量不同 3 . Determine the degrees of freedom• dft=N-1• dfb=k-1• dfw=dft-dfb• 4. Compute for mean sum of squares• Sb2=SSb/ dfb• Sw2=SSw/ dfw• 5. Compute for F ratio• F=Sb2/Sw2
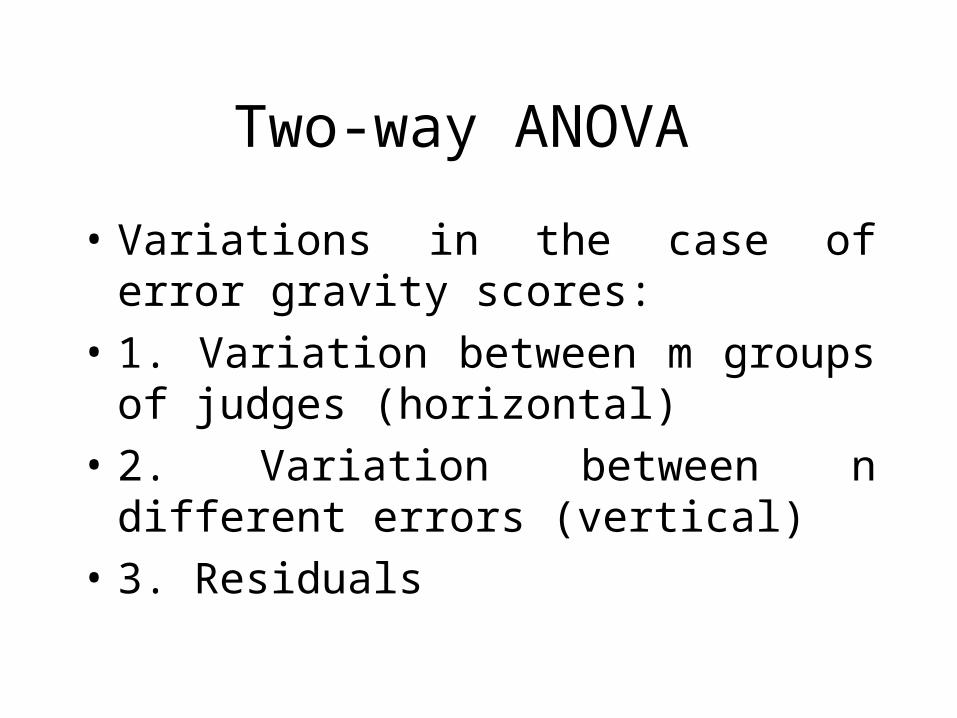
Two-way ANOVA
• Variations in the case of error gravity scores:
• 1. Variation between m groups of judges (horizontal)
• 2. Variation between n different errors (vertical)
• 3. Residuals
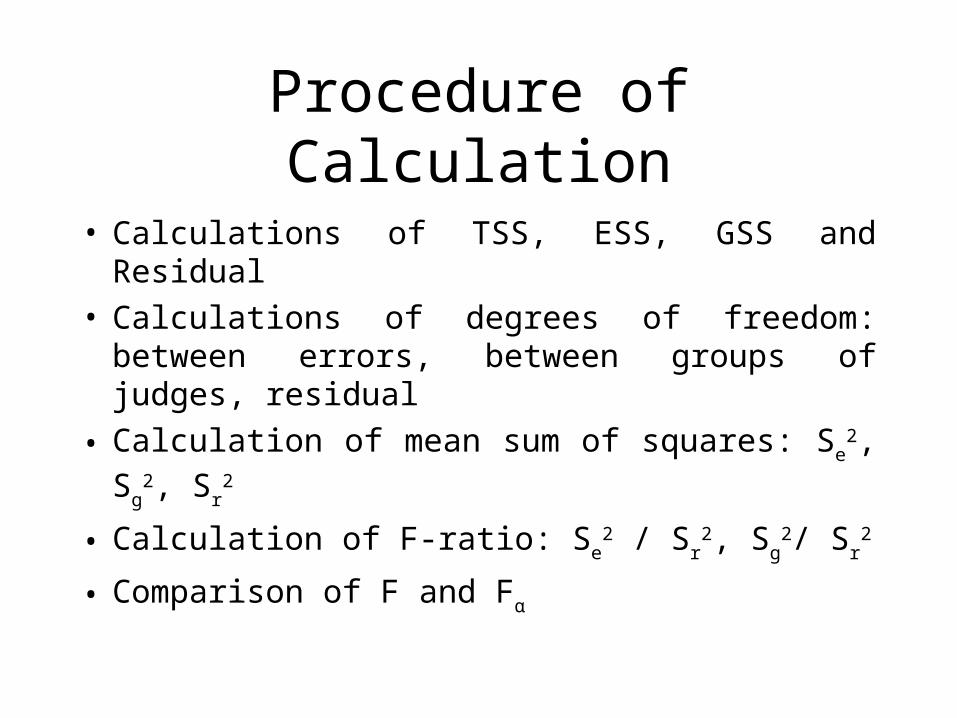
Procedure of Calculation
• Calculations of TSS, ESS, GSS and Residual• Calculations of degrees of freedom: between
errors, between groups of judges, residual
• Calculation of mean sum of squares: Se2, Sg
2, Sr2
• Calculation of F-ratio: Se2 / Sr
2, Sg2/ Sr
2
• Comparison of F and Fα
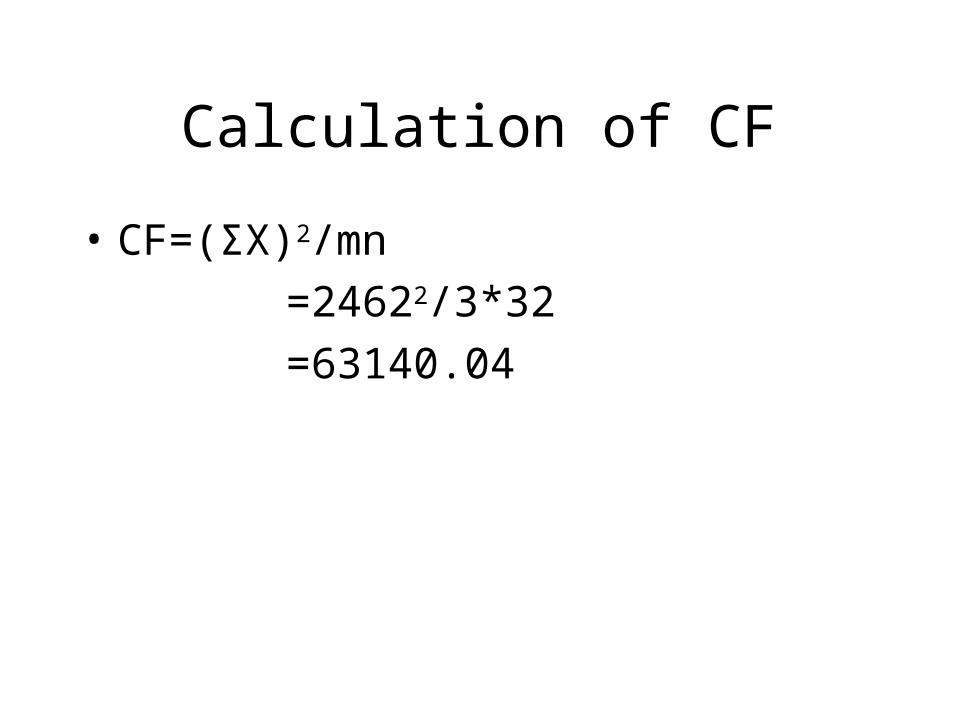
Calculation of CF
• CF=(ΣX)2/mn
=24622/3*32
=63140.04
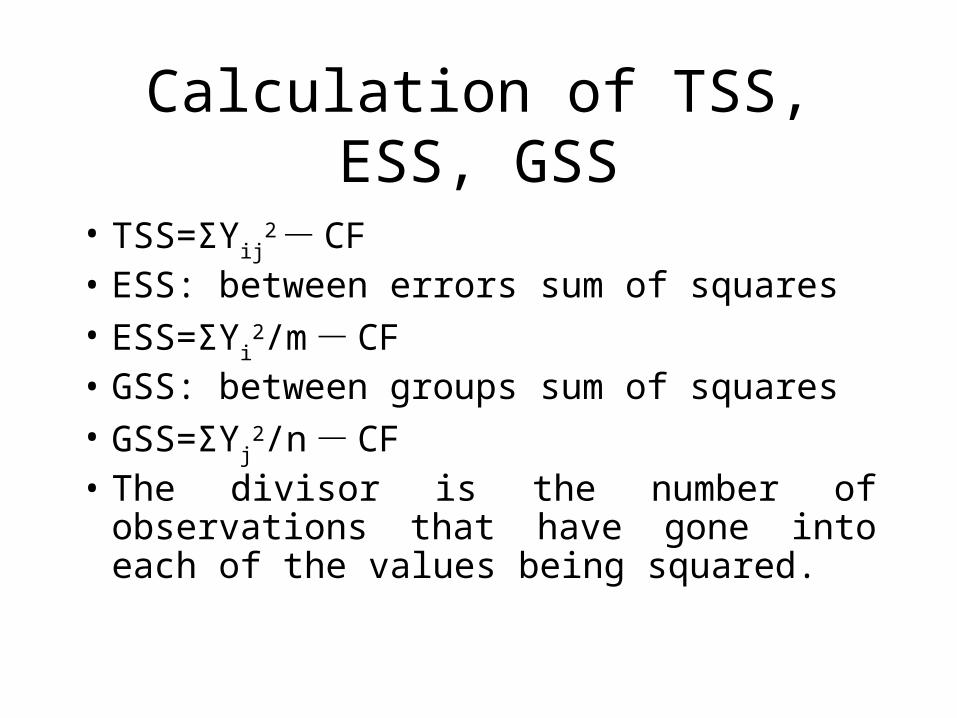
Calculation of TSS, ESS, GSS
• TSS=ΣYij2 - CF
• ESS: between errors sum of squares• ESS=ΣYi
2/m - CF• GSS: between groups sum of squares• GSS=ΣYj
2/n - CF• The divisor is the number of observations
that have gone into each of the values being squared.
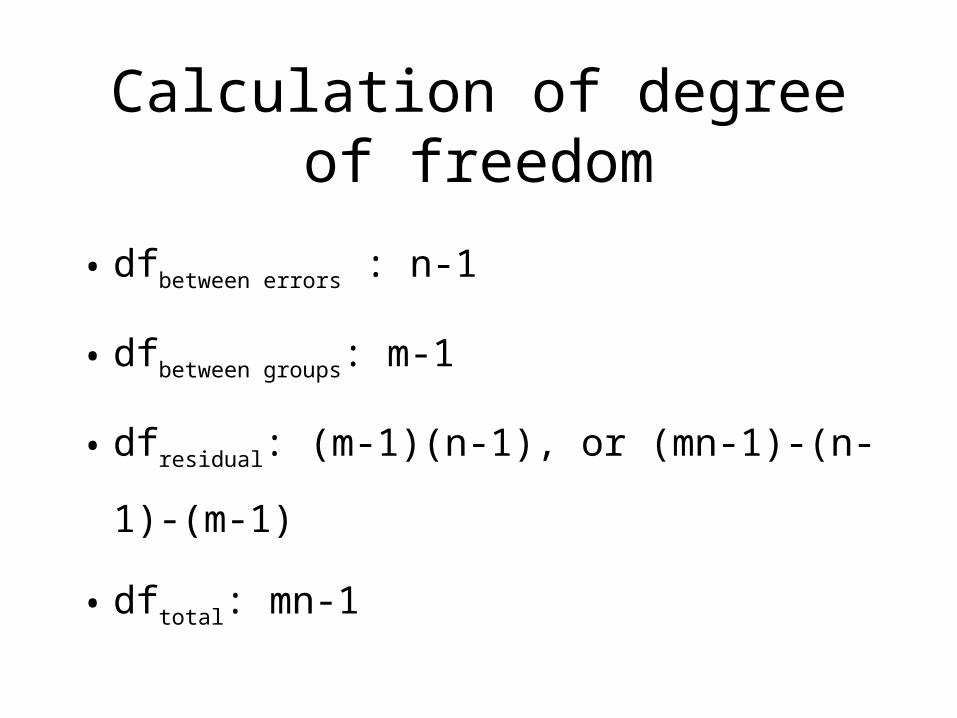
Calculation of degree of freedom
• dfbetween errors : n-1
• dfbetween groups: m-1
• dfresidual: (m-1)(n-1), or (mn-1)-(n-1)-(m-1)
• dftotal: mn-1

Calculations of MSS
• MSSbetween errors = ESS/ dfbetween errors
• MSSbetween groups = GSS / dfbetween groups
• MSSresidual = RSS/ dfresidual

Calculation of F-ratio
• Fbetween errors = MSSbetween errors / MSSresidual
• Degree of freedom: dfbetween errors, dfresidual
• Fbetween groups = MSSbetween groups / MSSresidual
• Degree of freedom: dfbetween groups, dfresidual
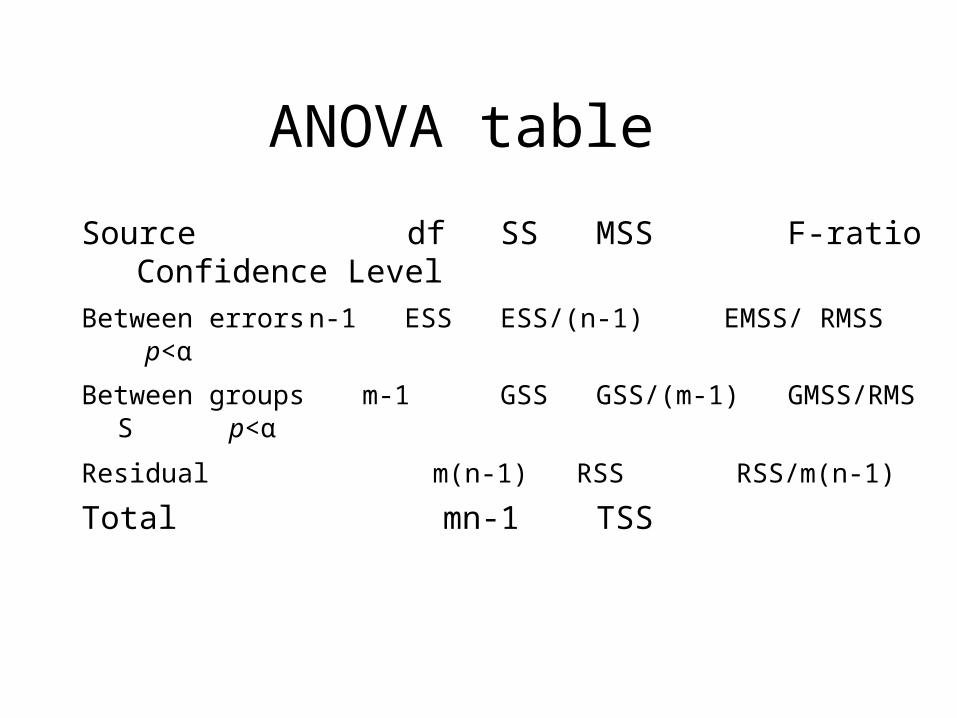
ANOVA table
Source df SS MSS F-ratio Confidence Level
Between errors n-1 ESS ESS/(n-1) EMSS/ RMSS p<αBetween groups m-1 GSS GSS/(m-1) GMSS/RMSS p<αResidual m(n-1) RSS RSS/m(n-1)
Total mn-1 TSS
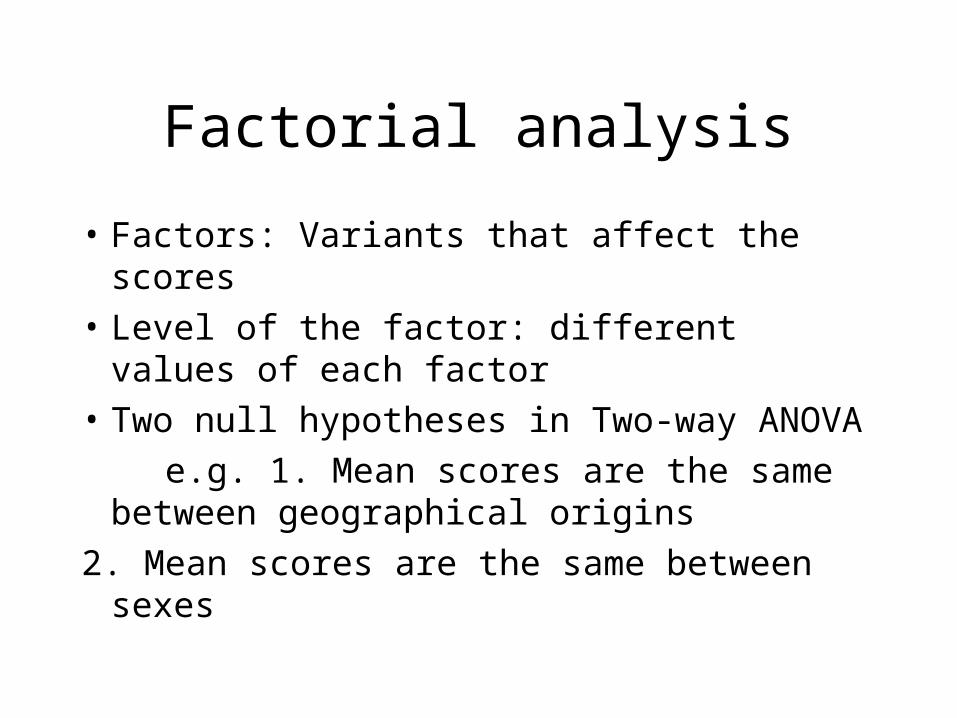
Factorial analysis
• Factors: Variants that affect the scores
• Level of the factor: different values of each factor
• Two null hypotheses in Two-way ANOVA
e.g. 1. Mean scores are the same between geographical origins
2. Mean scores are the same between sexes