statistics 303 chapter 8 inference for proportions
Post on 19-Dec-2015
222 views
TRANSCRIPT

Statistics 303
Chapter 8Inference for Proportions

Section 8.1: Confidence Interval for Proportions
• The same principles used for the confidence interval for the mean are used for the confidence interval of the population proportion.
• Here we want to obtain a plausible range of values for the population proportion, π– Keep in mind, π, should have a value between 0 and 1

Confidence Interval for Proportions
• Previously, we used p as an estimate of π, so that initially we might consider p when trying to construct confidence intervals for π
• However, using p can lead to confidence intervals which contain values outside of 0 and 1– Why would this be a problem?

Confidence Interval for Proportions
– The confidence interval has the following form:
)( merrormargin of estimate
p ))(( *pSEz
n
Xp
z* is the same as before
n
ppSEp
)1(

Confidence Interval for Proportions
• Thus, we can rewrite the confidence interval for a population proportion explicitly in this form.
n
ppzp
)1(*
This formula should be used when n is larger than 5.

Sample Size
• To get a desired margin of error (m) by adjusting the sample size n we use the following:– Determine the desired margin of error (m).
– Use the following formula:
**
2*
1 ppm
zn
where p* is a guessed value for the proportion of successes in the future sample.

Confidence Interval Example
• “A recent fire in a warehouse that contained 100,000 radios damaged an unknown number of the radios. A freight broker who purchases damaged goods offers to purchase the entire contents from the insurance company that provides coverage for the warehouse. The freight broker will eventually sort through all the radios and sell those that are not damaged. Before the broker makes an offer to the insurance company, he would like to know what proportion of the 100,000 radios are damaged and cannot be sold” (from Graybill, Iyer and Burdick, Applied Statistics, 1998).
• Find a 99% confidence interval for the proportion of the 100,000 radios which are damaged.

Confidence Interval Example• Suppose a random sample of 200 radios is taken from the warehouse
and 34 of them were damaged.
n
ppzp
)1(*
:obtain first We pn
Xp
200
34 17.0
Next we use the formula:
200
)17.01(17.0576.217.0
2.576 (99% C.I.) 200)0266.0)(576.2(17.0
0687.017.0
)239.0 , 101.0(99% Confidence Interval for the true proportion:

Confidence Interval Example
• A confidence interval of (0.101, 0.239) is not very narrow.
• How large of a sample size would be needed to have a margin of error (m) of 0.01?
**
2*
1 ppm
zn
2.576
0.01 We can use 0.17 as a good guess since it is estimated from the data.
17.0117.0
01.0
576.22
08.9363
The freight broker should use a sample of size 9,364 to achieve a margin of error of 0.01.

Tests of Significance: One Proportion
• Steps for Testing a Population Proportion (Section 8.1)
– Before using the techniques of the following slides, it is recommended that we check the following rule of thumb:
• nπ0 > 10 and
• n(1- π0) > 10
• where n is the sample size and π0 is the hypothesized proportion as shown in the following slides.

Tests of Significance: Proportions• Steps for Testing a Population Proportion
– 1. State the null hypothesis:
– 2. State the alternative hypothesis:
– 3. State the level of significance.• RECALL: we assume = 0.05 unless otherwise stated
– 4. Calculate the test statistic
00 :H
0a :H ):Hor :H be also (could 0a0a
n
pz
)1( 00
0
):Hor :H be also (could 0000

Tests of Significance: Proportions
• Steps for Testing a Population Proportion– 5. Find the P-value:
• For a two-sided test:
• For a one-sided test:
• For a one-sided test:
zZzZzZP 2Pr or Pr value-
a 0H :
a 0H :
zZP Pr value-
zZP Pr value-
0a :H

Tests of SignificanceLarge-Sample Significance Test for a Population Proportion
• Draw an SRS of size n from a large population with unknown proportion π of successes. To test the hypothesis H0: π = π0, compute the z statistic
• In terms of a standard normal random variable Z, the approximate P-value for a test of H0 against
Ha: π > π0 is P(Z > z)
Ha: π < π0 is P(Z < z)
Ha: π ≠ π0 is 2P(Z > |z|)
n
pz
)1( 00
0

Tests of Significance: Proportions
• Steps for Testing a Population Proportion– 6. Reject or fail to reject H0 based on the P-value.
• If the P-value is less than or equal to , reject H0.• It the P-value is greater than , fail to reject H0.
– 7. State your conclusion.• Your conclusion should reflect your original statement of the
hypotheses.• Furthermore, your conclusion should be stated in terms of the
alternative hypotheses• For example, if Ha: π ≠ π0 as stated previously
– If H0 is rejected, “There is significant statistical evidence that the population proportion is different than π0.”
– If H0 is not rejected, “There is not significant statistical evidence that the population mean is different than π0.”

Two Examples of Significance Tests
• Example 1: Orange Trees– The owner of an orange grove wants to determine if the
proportion of diseased trees in the grove is more than 10%. He will use this information to determine if it will be cost effective to spray the entire grove. The owner would like to know the exact value of p, but he realizes that he cannot know the exact value unless he examines every one of the 6,010 trees, which would be too expensive. He decides to take a simple random sample of 150 trees and examine them for the disease. He finds that 12 of the 150 trees are diseased. (adapted from Graybill, Iyer and Burdick, Applied Statistics, 1998).
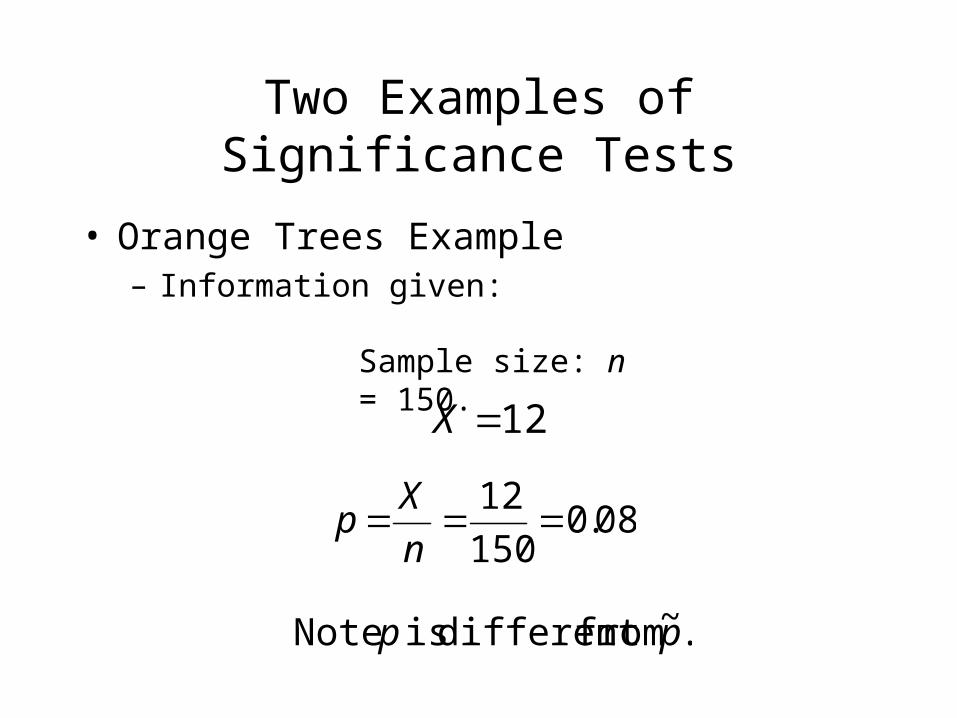
Two Examples of Significance Tests
• Orange Trees Example– Information given:
12X
Sample size: n = 150.
08.0150
12
n
Xp
.~ fromdifferent is Note pp

Two Examples of Significance Tests
• Orange Trees Example– We first check the rule of thumb:
• nπ0 = 150(0.10) = 15 > 10 and
• n(1- π0) =150(1- 0.10) = 150(0.90) = 135 > 10
• The assumptions for the following test are approximately met.
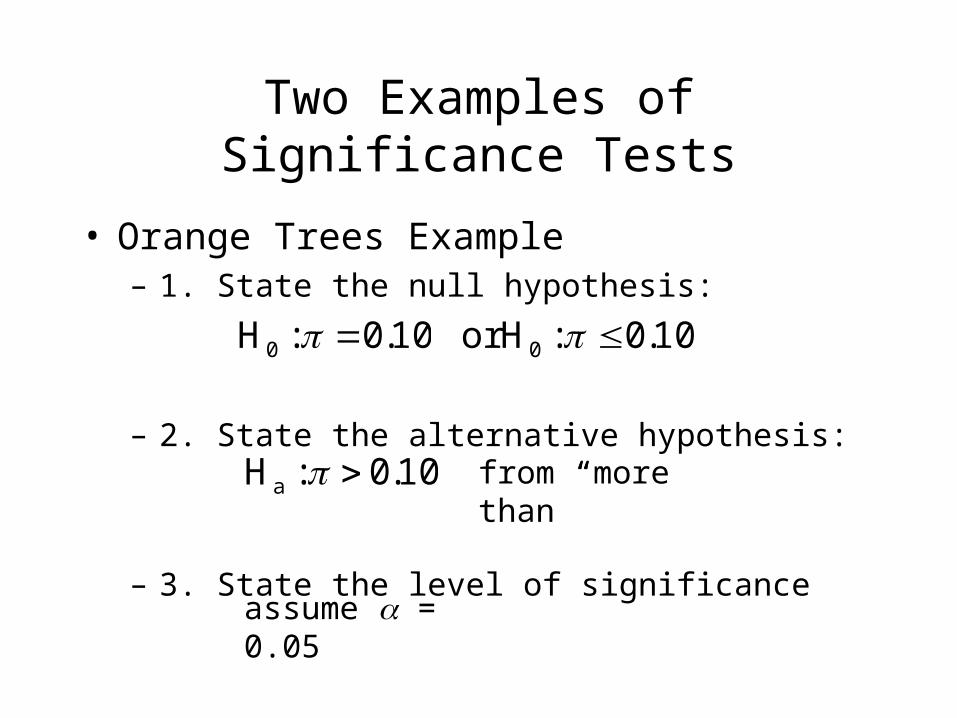
Two Examples of Significance Tests
• Orange Trees Example– 1. State the null hypothesis:
– 2. State the alternative hypothesis:
– 3. State the level of significance
10.0:H0 10.0:Hor 0
10.0:Ha from “more than”
assume = 0.05

Two Examples of Significance Tests
• Orange Trees Example– 4. Calculate the test statistic.
– 5. Find the P-value.
zZP Pr value- 82.0Pr Z
82.0Pr-1 Z 0.2061-1
0.7939
n
pz
)1( 00
0
150)10.01(10.0
10.008.0
024495.0
02.0 82.0

Two Examples of Significance Tests
• Orange Trees Example– 6. Do we reject or fail to reject H0 based on the P-
value?
– 7. State the conclusion.
P-value = 0.7939 is greater than = 0.05.
Therefore, we fail to reject H0
“There is not significant statistical evidence that the true proportion of diseased orange trees is greater than 10%.”

Two Examples of Significance Tests
• Example 2: Immunization Shots– The superintendent of a large school district
wants to know if the proportion of first graders in her district that have received their immunization shots is different from last year. Last year, 74% of the first grade children had received their immunization shots. The superintendent random selects 100 first grade students and 77 of them have received their immunization shots.

Two Examples of Significance Tests
• Immunization Shots Example– Information given:
77X
Sample size: n = 100.
77.0100
77
n
Xp

Two Examples of Significance Tests
• Immunization Shots Example– We first check the rule of thumb:
• nπ0 = 100(0.74) = 74 > 10 and
• n(1- π0) =100(1- 0.74) = 100(0.26) = 26 > 10
• The assumptions for the following test are approximately met.

Two Examples of Significance Tests
• Immunization Shots Example– 1. State the null hypothesis:
– 2. State the alternative hypothesis:
– 3. State the level of significance
74.0:H0
74.0:Ha from “is different from”
assume = 0.05

Two Examples of Significance Tests
• Immunization Shots Example– 4. Calculate the test statistic.
– 5. Find the P-value.
|| Pr*2 value- zZP |68.0| Pr*2 Z
68.0Pr*2 Z 0.68))Pr(Z-(1*2
n
pz
)1( 00
0
100)74.01(74.0
74.077.0
04386.0
03.0 68.0
0.7517)-(1*2 (0.2483)*2 0.4966

Two Examples of Significance Tests
• Immunization Shots Example– 6. Do we reject or fail to reject H0 based on the P-
value?
7. State the conclusion.
P-value = 0.4966 is greater than = 0.05.
Therefore, we fail to reject H0
“There is not significant statistical evidence that this year’s true proportion of first grade students with immunization shots is different than last years proportion of 0.74.”
Section 8.2: Comparing Two Proportions
• Examples of Comparing Two Proportions– “A national survey is conducted to compare the
percentage of clergy favoring the ordination of women to the priesthood to the percentage of nonclergy in favor of such a move.” (from Milton, McTeer, and Corbet, Introduction to Statistics, 1997)
– Comparing high school drop-out rates for two races or for gender.
– Comparing students’ to non-students’ views on a particular policy concerning parking.
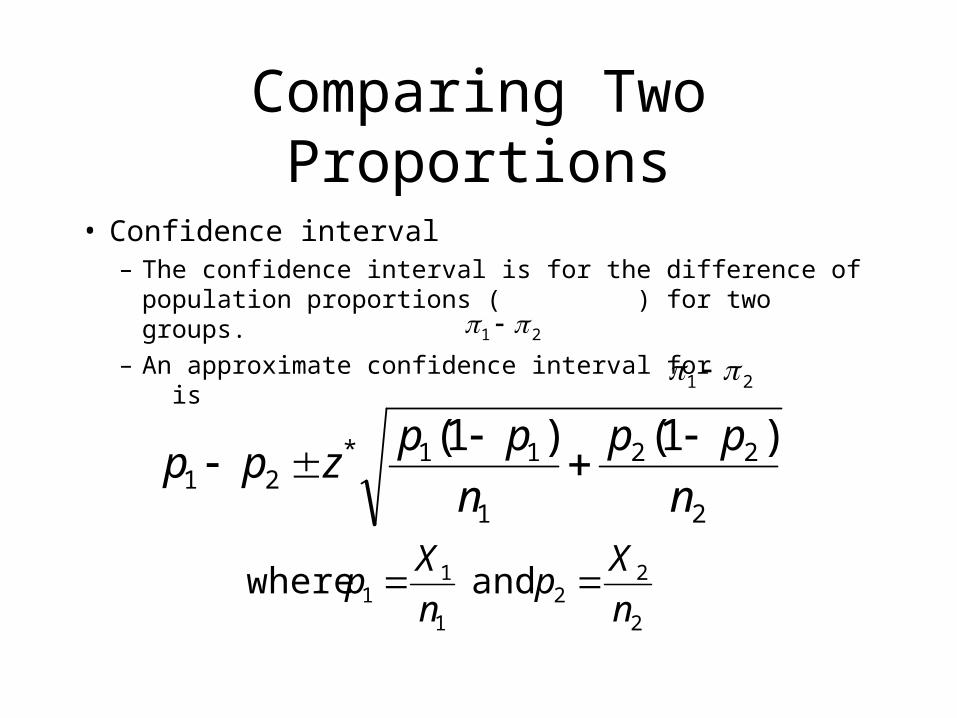
Comparing Two Proportions
• Confidence interval– The confidence interval is for the difference of
population proportions ( ) for two groups.
– An approximate confidence interval for is1 2
2
22
1
11 and where
n
Xp
n
Xp
1 2
2
22
1
11*21
)1()1(
n
pp
n
ppzpp

Comparing Two Proportions
• Example: Fear– In an experiment designed to study the effect of fear as a behavior modifier,
psychologists performed the following experiment: 400 randomly selected students were randomly divided into two groups of 200 each. Each group was urged to get flu shots. Group I was shown slides and given a gory verbal description of the effects of flu, the high degree of contagion of the disease, and the danger of death resulting from contracting the disease. The presentation was made in such a way that it was extremely frightening. Group II was simply given a brochure describing the disease, and no attempt was made to induce fear in the subjects. Of the 200 subjects in group I, 44 elected to receive the vaccine, whereas 39 of those in group II did so. (from Milton, McTeer, and Corbet, Introduction to Statistics, 1997)
– Find a 95% confidence interval for .1 2

Comparing Two Proportions
• Example: Fear– Estimated proportions:
1
11 n
Xp
200
44 22.0
2
22 n
Xp
200
38 19.0
Confidence Interval:
2
22
1
11*21
)1()1(
n
pp
n
ppzpp
200
)19.1(19.
200
)22.1(22.96.119.22.
079.03. )109. , 049.( (95% C.I. for )1 2

Comparing Two Proportions
• Significance Test– The test statistic for comparing two proportions
is
21
21
11)ˆ1(ˆ
nnpp
ppz
21
21
2
22
1
11 ˆ and , , where
nn
XXp
n
Xp
n
Xp

Comparing Two Proportions
• The null hypothesis can be any of the following:
• The alternative hypothesis can be any of the following (depending on the question being asked):
0 1 2H : 0 1 2or H : 0 1 2or H :
a 1 2H : a 1 2or H : a 1 2or H :
The other steps are the same as those used for the tests we have looked at previously.

Comparing Two Proportions
• Example:– “A child protection agency conducted a poll of adults in the
state and asked them the question, ‘Is a hard spanking sometimes necessary to discipline a child?’ The agency wants to determine whether or not there is a difference between the proportion of men who believe that a hard spanking is sometimes necessary and the proportion of women who have this belief.” Out of 571 men asked the question, 421 responded ‘Yes’. Of 611 women asked, 367 answered ‘Yes’. (from Graybill, Iyer and Burdick, Applied Statistics, 1998)
– Perform a test to see if there is any difference between the true proportions of men and women at a 0.01 significance level.

Comparing Two Proportions
• Example:
– Information given:
4211 X
Sample sizes: n1 = 571, n2 = 611.
3672 X
737.0571
421
1
11
n
Xp
601.0611
367
2
22
n
Xp
667.01182
788
611571
367421ˆ
21
21
nn
XXp
Comparing Two Proportions
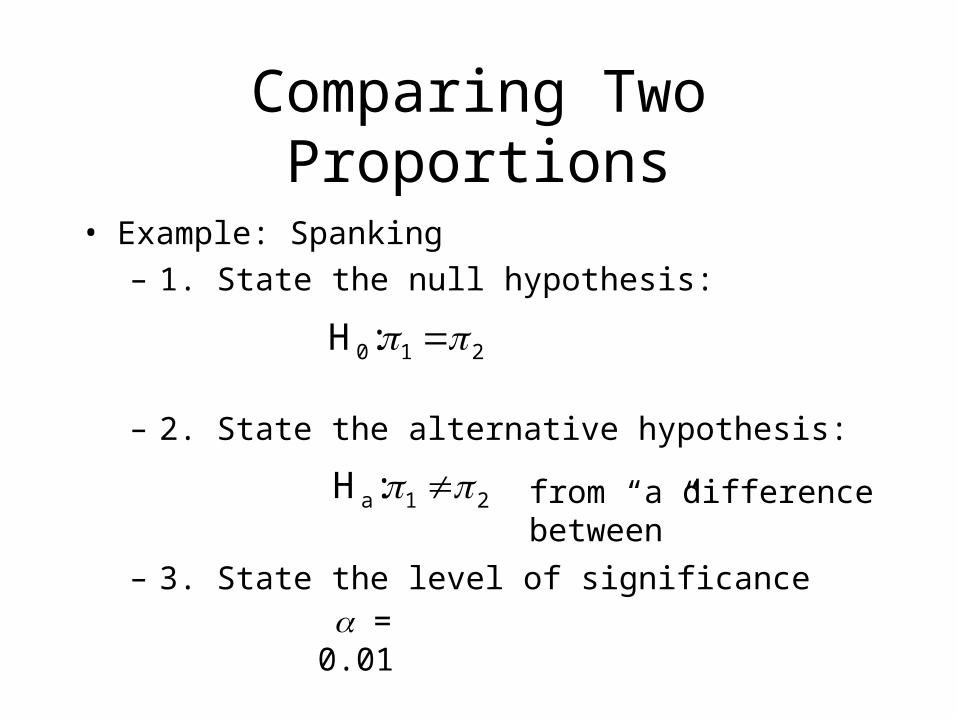
• Example: Spanking
– 1. State the null hypothesis:
– 2. State the alternative hypothesis:
– 3. State the level of significance
from “a difference between”
= 0.01
0 1 2H :
a 1 2H :

Comparing Two Proportions
• Example: Spanking
– 4. Calculate the test statistic.
– 5. Find the P-value.
||Pr*2 value- zZP
4.96))Pr(Z-1(*2
96.4Pr*2 Z
21
21
11)ˆ1(ˆ
nnpp
ppz
6111
5711
)667.1(667.
601.737.
0274.
136. 96.4
.9998)an greater th-1(*2
.0002) than less(*2 .0004 than less

Comparing Two Proportions
• Example: Spanking
– 6. Do we reject or fail to reject H0 based on the P-value?
– 7. State the conclusion.
P-value = less than .0004 is less than = 0.01.
Therefore, we reject H0
“There is significant statistical evidence (at the 0.01 level of significance) that there is a difference between the proportion of men who believe that a hard spanking is sometimes necessary and the proportion of women who have this belief.”