statistics and data analysis sicko and the us’s 37 th ranked health care system
TRANSCRIPT

Statistics and Data Analysis
Sicko and the US’s37th Ranked Health Care System

2PepperoniPlainMushroomSausagePepper and OnionMushroom and OnionGarlicMeatball
CategoryMeatball
5.0%Garlic2.3%
Mushroom and Onion9.2%
Pepper and Onion7.3%
Sausage5.8%
Mushroom16.2%
Plain32.5%
Pepperoni21.8%
Pie Chart of Percent vs Type
List
ing
900000
800000
700000
600000
500000
400000
300000
200000
100000
Boxplot of Listing
IncomePC
List
ing
3250030000275002500022500200001750015000
900000
800000
700000
600000
500000
400000
300000
200000
100000
Scatterplot of Listing vs IncomePC
Listing
Perc
ent
10000008000006000004000002000000
99
95
90
80
70
605040
30
20
10
5
1
Mean 369687StDev 156865N 51AD 0.994P-Value 0.012
Probability Plot of ListingNormal - 95% CI
IncomePC
List
ing
3250030000275002500022500200001750015000
900000
800000
700000
600000
500000
400000
300000
200000
100000
Scatterplot of Listing vs IncomePC
Listing
Frequency
900000800000700000600000500000400000300000200000
14
12
10
8
6
4
2
0
Histogram of Listing
Listing
Perc
ent
9000
00
8000
00
7000
00
6000
00
5000
00
4000
00
3000
00
2000
00
1000
000
100
80
60
40
20
0
Mean 369687StDev 156865N 51
Empirical CDF of ListingNormal
IncomePC
List
ing
30000250002000015000
1000000
800000
600000
400000
200000
Marginal Plot of Listing vs IncomePC
Where is the U.S.?

3PepperoniPlainMushroomSausagePepper and OnionMushroom and OnionGarlicMeatball
CategoryMeatball
5.0%Garlic2.3%
Mushroom and Onion9.2%
Pepper and Onion7.3%
Sausage5.8%
Mushroom16.2%
Plain32.5%
Pepperoni21.8%
Pie Chart of Percent vs Type
List
ing
900000
800000
700000
600000
500000
400000
300000
200000
100000
Boxplot of Listing
IncomePC
List
ing
3250030000275002500022500200001750015000
900000
800000
700000
600000
500000
400000
300000
200000
100000
Scatterplot of Listing vs IncomePC
Listing
Perc
ent
10000008000006000004000002000000
99
95
90
80
70
605040
30
20
10
5
1
Mean 369687StDev 156865N 51AD 0.994P-Value 0.012
Probability Plot of ListingNormal - 95% CI
IncomePC
List
ing
3250030000275002500022500200001750015000
900000
800000
700000
600000
500000
400000
300000
200000
100000
Scatterplot of Listing vs IncomePC
Listing
Frequency
900000800000700000600000500000400000300000200000
14
12
10
8
6
4
2
0
Histogram of Listing
Listing
Perc
ent
9000
00
8000
00
7000
00
6000
00
5000
00
4000
00
3000
00
2000
00
1000
000
100
80
60
40
20
0
Mean 369687StDev 156865N 51
Empirical CDF of ListingNormal
IncomePC
List
ing
30000250002000015000
1000000
800000
600000
400000
200000
Marginal Plot of Listing vs IncomePC
Still in the News

4PepperoniPlainMushroomSausagePepper and OnionMushroom and OnionGarlicMeatball
CategoryMeatball
5.0%Garlic2.3%
Mushroom and Onion9.2%
Pepper and Onion7.3%
Sausage5.8%
Mushroom16.2%
Plain32.5%
Pepperoni21.8%
Pie Chart of Percent vs Type
List
ing
900000
800000
700000
600000
500000
400000
300000
200000
100000
Boxplot of Listing
IncomePC
List
ing
3250030000275002500022500200001750015000
900000
800000
700000
600000
500000
400000
300000
200000
100000
Scatterplot of Listing vs IncomePC
Listing
Perc
ent
10000008000006000004000002000000
99
95
90
80
70
605040
30
20
10
5
1
Mean 369687StDev 156865N 51AD 0.994P-Value 0.012
Probability Plot of ListingNormal - 95% CI
IncomePC
List
ing
3250030000275002500022500200001750015000
900000
800000
700000
600000
500000
400000
300000
200000
100000
Scatterplot of Listing vs IncomePC
Listing
Frequency
900000800000700000600000500000400000300000200000
14
12
10
8
6
4
2
0
Histogram of Listing
Listing
Perc
ent
9000
00
8000
00
7000
00
6000
00
5000
00
4000
00
3000
00
2000
00
1000
000
100
80
60
40
20
0
Mean 369687StDev 156865N 51
Empirical CDF of ListingNormal
IncomePC
List
ing
30000250002000015000
1000000
800000
600000
400000
200000
Marginal Plot of Listing vs IncomePC
That Number 37 Ranking
What is the source? What is it? Ranking of what? And why are we looking at it in our class on
Statistics and Data Analysis?InterestingIt’s an application of regression analysis.

5PepperoniPlainMushroomSausagePepper and OnionMushroom and OnionGarlicMeatball
CategoryMeatball
5.0%Garlic2.3%
Mushroom and Onion9.2%
Pepper and Onion7.3%
Sausage5.8%
Mushroom16.2%
Plain32.5%
Pepperoni21.8%
Pie Chart of Percent vs Type
List
ing
900000
800000
700000
600000
500000
400000
300000
200000
100000
Boxplot of Listing
IncomePC
List
ing
3250030000275002500022500200001750015000
900000
800000
700000
600000
500000
400000
300000
200000
100000
Scatterplot of Listing vs IncomePC
Listing
Perc
ent
10000008000006000004000002000000
99
95
90
80
70
605040
30
20
10
5
1
Mean 369687StDev 156865N 51AD 0.994P-Value 0.012
Probability Plot of ListingNormal - 95% CI
IncomePC
List
ing
3250030000275002500022500200001750015000
900000
800000
700000
600000
500000
400000
300000
200000
100000
Scatterplot of Listing vs IncomePC
Listing
Frequency
900000800000700000600000500000400000300000200000
14
12
10
8
6
4
2
0
Histogram of Listing
Listing
Perc
ent
9000
00
8000
00
7000
00
6000
00
5000
00
4000
00
3000
00
2000
00
1000
000
100
80
60
40
20
0
Mean 369687StDev 156865N 51
Empirical CDF of ListingNormal
IncomePC
List
ing
30000250002000015000
1000000
800000
600000
400000
200000
Marginal Plot of Listing vs IncomePC
The Source: The Year 2000 World Health Report by WHO
http://www.who.int/whr/2000/en

6PepperoniPlainMushroomSausagePepper and OnionMushroom and OnionGarlicMeatball
CategoryMeatball
5.0%Garlic2.3%
Mushroom and Onion9.2%
Pepper and Onion7.3%
Sausage5.8%
Mushroom16.2%
Plain32.5%
Pepperoni21.8%
Pie Chart of Percent vs Type
List
ing
900000
800000
700000
600000
500000
400000
300000
200000
100000
Boxplot of Listing
IncomePC
List
ing
3250030000275002500022500200001750015000
900000
800000
700000
600000
500000
400000
300000
200000
100000
Scatterplot of Listing vs IncomePC
Listing
Perc
ent
10000008000006000004000002000000
99
95
90
80
70
605040
30
20
10
5
1
Mean 369687StDev 156865N 51AD 0.994P-Value 0.012
Probability Plot of ListingNormal - 95% CI
IncomePC
List
ing
3250030000275002500022500200001750015000
900000
800000
700000
600000
500000
400000
300000
200000
100000
Scatterplot of Listing vs IncomePC
Listing
Frequency
900000800000700000600000500000400000300000200000
14
12
10
8
6
4
2
0
Histogram of Listing
Listing
Perc
ent
9000
00
8000
00
7000
00
6000
00
5000
00
4000
00
3000
00
2000
00
1000
000
100
80
60
40
20
0
Mean 369687StDev 156865N 51
Empirical CDF of ListingNormal
IncomePC
List
ing
30000250002000015000
1000000
800000
600000
400000
200000
Marginal Plot of Listing vs IncomePC
The Source Behind the Source
http://www.who.int/entity/healthinfo/paper30.pdf

7PepperoniPlainMushroomSausagePepper and OnionMushroom and OnionGarlicMeatball
CategoryMeatball
5.0%Garlic2.3%
Mushroom and Onion9.2%
Pepper and Onion7.3%
Sausage5.8%
Mushroom16.2%
Plain32.5%
Pepperoni21.8%
Pie Chart of Percent vs Type
List
ing
900000
800000
700000
600000
500000
400000
300000
200000
100000
Boxplot of Listing
IncomePC
List
ing
3250030000275002500022500200001750015000
900000
800000
700000
600000
500000
400000
300000
200000
100000
Scatterplot of Listing vs IncomePC
Listing
Perc
ent
10000008000006000004000002000000
99
95
90
80
70
605040
30
20
10
5
1
Mean 369687StDev 156865N 51AD 0.994P-Value 0.012
Probability Plot of ListingNormal - 95% CI
IncomePC
List
ing
3250030000275002500022500200001750015000
900000
800000
700000
600000
500000
400000
300000
200000
100000
Scatterplot of Listing vs IncomePC
Listing
Frequency
900000800000700000600000500000400000300000200000
14
12
10
8
6
4
2
0
Histogram of Listing
Listing
Perc
ent
9000
00
8000
00
7000
00
6000
00
5000
00
4000
00
3000
00
2000
00
1000
000
100
80
60
40
20
0
Mean 369687StDev 156865N 51
Empirical CDF of ListingNormal
IncomePC
List
ing
30000250002000015000
1000000
800000
600000
400000
200000
Marginal Plot of Listing vs IncomePC
What Did They Study?
8PepperoniPlainMushroomSausagePepper and OnionMushroom and OnionGarlicMeatball
CategoryMeatball
5.0%Garlic2.3%
Mushroom and Onion9.2%
Pepper and Onion7.3%
Sausage5.8%
Mushroom16.2%
Plain32.5%
Pepperoni21.8%
Pie Chart of Percent vs Type
List
ing
900000
800000
700000
600000
500000
400000
300000
200000
100000
Boxplot of Listing
IncomePC
List
ing
3250030000275002500022500200001750015000
900000
800000
700000
600000
500000
400000
300000
200000
100000
Scatterplot of Listing vs IncomePC
Listing
Perc
ent
10000008000006000004000002000000
99
95
90
80
70
605040
30
20
10
5
1
Mean 369687StDev 156865N 51AD 0.994P-Value 0.012
Probability Plot of ListingNormal - 95% CI
IncomePC
List
ing
3250030000275002500022500200001750015000
900000
800000
700000
600000
500000
400000
300000
200000
100000
Scatterplot of Listing vs IncomePC
Listing
Frequency
900000800000700000600000500000400000300000200000
14
12
10
8
6
4
2
0
Histogram of Listing
Listing
Perc
ent
9000
00
8000
00
7000
00
6000
00
5000
00
4000
00
3000
00
2000
00
1000
000
100
80
60
40
20
0
Mean 369687StDev 156865N 51
Empirical CDF of ListingNormal
IncomePC
List
ing
30000250002000015000
1000000
800000
600000
400000
200000
Marginal Plot of Listing vs IncomePC
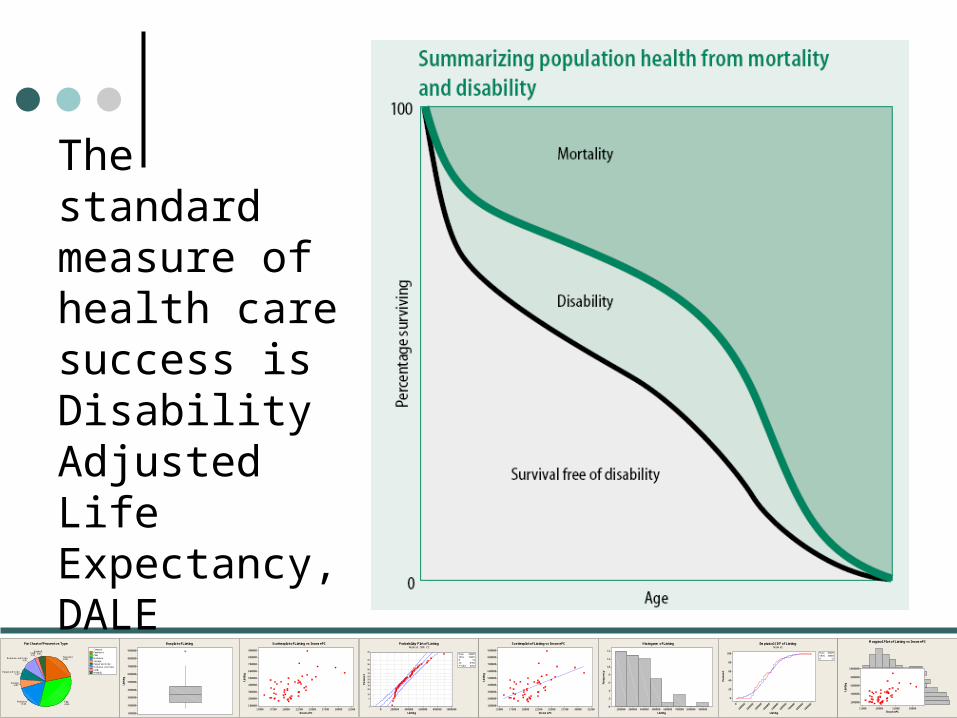
The standard measure of health care success is Disability Adjusted Life Expectancy,DALE

9PepperoniPlainMushroomSausagePepper and OnionMushroom and OnionGarlicMeatball
CategoryMeatball
5.0%Garlic2.3%
Mushroom and Onion9.2%
Pepper and Onion7.3%
Sausage5.8%
Mushroom16.2%
Plain32.5%
Pepperoni21.8%
Pie Chart of Percent vs Type
List
ing
900000
800000
700000
600000
500000
400000
300000
200000
100000
Boxplot of Listing
IncomePC
List
ing
3250030000275002500022500200001750015000
900000
800000
700000
600000
500000
400000
300000
200000
100000
Scatterplot of Listing vs IncomePC
Listing
Perc
ent
10000008000006000004000002000000
99
95
90
80
70
605040
30
20
10
5
1
Mean 369687StDev 156865N 51AD 0.994P-Value 0.012
Probability Plot of ListingNormal - 95% CI
IncomePC
List
ing
3250030000275002500022500200001750015000
900000
800000
700000
600000
500000
400000
300000
200000
100000
Scatterplot of Listing vs IncomePC
Listing
Frequency
900000800000700000600000500000400000300000200000
14
12
10
8
6
4
2
0
Histogram of Listing
Listing
Perc
ent
9000
00
8000
00
7000
00
6000
00
5000
00
4000
00
3000
00
2000
00
1000
000
100
80
60
40
20
0
Mean 369687StDev 156865N 51
Empirical CDF of ListingNormal
IncomePC
List
ing
30000250002000015000
1000000
800000
600000
400000
200000
Marginal Plot of Listing vs IncomePC
The WHO Researchers Were Interested in a Broader Measure
These are the items listed in the NYT editorial.

10PepperoniPlainMushroomSausagePepper and OnionMushroom and OnionGarlicMeatball
CategoryMeatball
5.0%Garlic2.3%
Mushroom and Onion9.2%
Pepper and Onion7.3%
Sausage5.8%
Mushroom16.2%
Plain32.5%
Pepperoni21.8%
Pie Chart of Percent vs Type
List
ing
900000
800000
700000
600000
500000
400000
300000
200000
100000
Boxplot of Listing
IncomePC
List
ing
3250030000275002500022500200001750015000
900000
800000
700000
600000
500000
400000
300000
200000
100000
Scatterplot of Listing vs IncomePC
Listing
Perc
ent
10000008000006000004000002000000
99
95
90
80
70
605040
30
20
10
5
1
Mean 369687StDev 156865N 51AD 0.994P-Value 0.012
Probability Plot of ListingNormal - 95% CI
IncomePC
List
ing
3250030000275002500022500200001750015000
900000
800000
700000
600000
500000
400000
300000
200000
100000
Scatterplot of Listing vs IncomePC
Listing
Frequency
900000800000700000600000500000400000300000200000
14
12
10
8
6
4
2
0
Histogram of Listing
Listing
Perc
ent
9000
00
8000
00
7000
00
6000
00
5000
00
4000
00
3000
00
2000
00
1000
000
100
80
60
40
20
0
Mean 369687StDev 156865N 51
Empirical CDF of ListingNormal
IncomePC
List
ing
30000250002000015000
1000000
800000
600000
400000
200000
Marginal Plot of Listing vs IncomePC
They Created a Measure – COMP = Composite Index
“In order to assess overall efficiency, the first step was to combine the individualattainments on all five goals of the health system into a single number, which we call the composite index. The composite index is a weighted average of the five component goals specified above. First, country attainment on all five indicators (i.e., health, health inequality, responsiveness-level, responsiveness-distribution, and fair-financing) were rescaled restricting them to the [0,1] interval. Then the following weights were used to construct the overall composite measure: 25% for health (DALE), 25% for health inequality, 12.5% for the level of responsiveness, 12.5% for the distribution of responsiveness, and 25% for fairness in financing. These weights are based on a survey carried out by WHO to elicit stated preferences of individuals in their relative valuations of the goals of the health system.”
(From the WHO Technical Report)

11PepperoniPlainMushroomSausagePepper and OnionMushroom and OnionGarlicMeatball
CategoryMeatball
5.0%Garlic2.3%
Mushroom and Onion9.2%
Pepper and Onion7.3%
Sausage5.8%
Mushroom16.2%
Plain32.5%
Pepperoni21.8%
Pie Chart of Percent vs Type
List
ing
900000
800000
700000
600000
500000
400000
300000
200000
100000
Boxplot of Listing
IncomePC
List
ing
3250030000275002500022500200001750015000
900000
800000
700000
600000
500000
400000
300000
200000
100000
Scatterplot of Listing vs IncomePC
Listing
Perc
ent
10000008000006000004000002000000
99
95
90
80
70
605040
30
20
10
5
1
Mean 369687StDev 156865N 51AD 0.994P-Value 0.012
Probability Plot of ListingNormal - 95% CI
IncomePC
List
ing
3250030000275002500022500200001750015000
900000
800000
700000
600000
500000
400000
300000
200000
100000
Scatterplot of Listing vs IncomePC
Listing
Frequency
900000800000700000600000500000400000300000200000
14
12
10
8
6
4
2
0
Histogram of Listing
Listing
Perc
ent
9000
00
8000
00
7000
00
6000
00
5000
00
4000
00
3000
00
2000
00
1000
000
100
80
60
40
20
0
Mean 369687StDev 156865N 51
Empirical CDF of ListingNormal
IncomePC
List
ing
30000250002000015000
1000000
800000
600000
400000
200000
Marginal Plot of Listing vs IncomePC
Did They Rank Countries by COMP? Yes, but that was not what produced the number 37 ranking!

12PepperoniPlainMushroomSausagePepper and OnionMushroom and OnionGarlicMeatball
CategoryMeatball
5.0%Garlic2.3%
Mushroom and Onion9.2%
Pepper and Onion7.3%
Sausage5.8%
Mushroom16.2%
Plain32.5%
Pepperoni21.8%
Pie Chart of Percent vs Type
List
ing
900000
800000
700000
600000
500000
400000
300000
200000
100000
Boxplot of Listing
IncomePC
List
ing
3250030000275002500022500200001750015000
900000
800000
700000
600000
500000
400000
300000
200000
100000
Scatterplot of Listing vs IncomePC
Listing
Perc
ent
10000008000006000004000002000000
99
95
90
80
70
605040
30
20
10
5
1
Mean 369687StDev 156865N 51AD 0.994P-Value 0.012
Probability Plot of ListingNormal - 95% CI
IncomePC
List
ing
3250030000275002500022500200001750015000
900000
800000
700000
600000
500000
400000
300000
200000
100000
Scatterplot of Listing vs IncomePC
Listing
Frequency
900000800000700000600000500000400000300000200000
14
12
10
8
6
4
2
0
Histogram of Listing
Listing
Perc
ent
9000
00
8000
00
7000
00
6000
00
5000
00
4000
00
3000
00
2000
00
1000
000
100
80
60
40
20
0
Mean 369687StDev 156865N 51
Empirical CDF of ListingNormal
IncomePC
List
ing
30000250002000015000
1000000
800000
600000
400000
200000
Marginal Plot of Listing vs IncomePC
So, What is Going On?
A Model: Health Care Output = a function of Health Care Inputs
OUTPUT = COMP
INPUTS = Health Care Spending and Education of the Population

13PepperoniPlainMushroomSausagePepper and OnionMushroom and OnionGarlicMeatball
CategoryMeatball
5.0%Garlic2.3%
Mushroom and Onion9.2%
Pepper and Onion7.3%
Sausage5.8%
Mushroom16.2%
Plain32.5%
Pepperoni21.8%
Pie Chart of Percent vs Type
List
ing
900000
800000
700000
600000
500000
400000
300000
200000
100000
Boxplot of Listing
IncomePC
List
ing
3250030000275002500022500200001750015000
900000
800000
700000
600000
500000
400000
300000
200000
100000
Scatterplot of Listing vs IncomePC
Listing
Perc
ent
10000008000006000004000002000000
99
95
90
80
70
605040
30
20
10
5
1
Mean 369687StDev 156865N 51AD 0.994P-Value 0.012
Probability Plot of ListingNormal - 95% CI
IncomePC
List
ing
3250030000275002500022500200001750015000
900000
800000
700000
600000
500000
400000
300000
200000
100000
Scatterplot of Listing vs IncomePC
Listing
Frequency
900000800000700000600000500000400000300000200000
14
12
10
8
6
4
2
0
Histogram of Listing
Listing
Perc
ent
9000
00
8000
00
7000
00
6000
00
5000
00
4000
00
3000
00
2000
00
1000
000
100
80
60
40
20
0
Mean 369687StDev 156865N 51
Empirical CDF of ListingNormal
IncomePC
List
ing
30000250002000015000
1000000
800000
600000
400000
200000
Marginal Plot of Listing vs IncomePC
The COMP Equation
i
1
22 3
-u
log =
= α+β log
+β log +β (log ) -
Efficiency = e
i =1,...,191 countries
i i i
i
i i i
COMP Maximum Attainable - Inefficiency
HealthExp
Educ Educ u

14PepperoniPlainMushroomSausagePepper and OnionMushroom and OnionGarlicMeatball
CategoryMeatball
5.0%Garlic2.3%
Mushroom and Onion9.2%
Pepper and Onion7.3%
Sausage5.8%
Mushroom16.2%
Plain32.5%
Pepperoni21.8%
Pie Chart of Percent vs Type
List
ing
900000
800000
700000
600000
500000
400000
300000
200000
100000
Boxplot of Listing
IncomePC
List
ing
3250030000275002500022500200001750015000
900000
800000
700000
600000
500000
400000
300000
200000
100000
Scatterplot of Listing vs IncomePC
Listing
Perc
ent
10000008000006000004000002000000
99
95
90
80
70
605040
30
20
10
5
1
Mean 369687StDev 156865N 51AD 0.994P-Value 0.012
Probability Plot of ListingNormal - 95% CI
IncomePC
List
ing
3250030000275002500022500200001750015000
900000
800000
700000
600000
500000
400000
300000
200000
100000
Scatterplot of Listing vs IncomePC
Listing
Frequency
900000800000700000600000500000400000300000200000
14
12
10
8
6
4
2
0
Histogram of Listing
Listing
Perc
ent
9000
00
8000
00
7000
00
6000
00
5000
00
4000
00
3000
00
2000
00
1000
000
100
80
60
40
20
0
Mean 369687StDev 156865N 51
Empirical CDF of ListingNormal
IncomePC
List
ing
30000250002000015000
1000000
800000
600000
400000
200000
Marginal Plot of Listing vs IncomePC
Estimated Model
β1
β2
β3
α

15PepperoniPlainMushroomSausagePepper and OnionMushroom and OnionGarlicMeatball
CategoryMeatball
5.0%Garlic2.3%
Mushroom and Onion9.2%
Pepper and Onion7.3%
Sausage5.8%
Mushroom16.2%
Plain32.5%
Pepperoni21.8%
Pie Chart of Percent vs Type
List
ing
900000
800000
700000
600000
500000
400000
300000
200000
100000
Boxplot of Listing
IncomePC
List
ing
3250030000275002500022500200001750015000
900000
800000
700000
600000
500000
400000
300000
200000
100000
Scatterplot of Listing vs IncomePC
Listing
Perc
ent
10000008000006000004000002000000
99
95
90
80
70
605040
30
20
10
5
1
Mean 369687StDev 156865N 51AD 0.994P-Value 0.012
Probability Plot of ListingNormal - 95% CI
IncomePC
List
ing
3250030000275002500022500200001750015000
900000
800000
700000
600000
500000
400000
300000
200000
100000
Scatterplot of Listing vs IncomePC
Listing
Frequency
900000800000700000600000500000400000300000200000
14
12
10
8
6
4
2
0
Histogram of Listing
Listing
Perc
ent
9000
00
8000
00
7000
00
6000
00
5000
00
4000
00
3000
00
2000
00
1000
000
100
80
60
40
20
0
Mean 369687StDev 156865N 51
Empirical CDF of ListingNormal
IncomePC
List
ing
30000250002000015000
1000000
800000
600000
400000
200000
Marginal Plot of Listing vs IncomePC
The Best a Country Could Do vs. What They Actually DoRegression Prediction
c=Regression Residual
Overall Health Care Efficiency = c/(b+c)
Country i actual outcome

16PepperoniPlainMushroomSausagePepper and OnionMushroom and OnionGarlicMeatball
CategoryMeatball
5.0%Garlic2.3%
Mushroom and Onion9.2%
Pepper and Onion7.3%
Sausage5.8%
Mushroom16.2%
Plain32.5%
Pepperoni21.8%
Pie Chart of Percent vs Type
List
ing
900000
800000
700000
600000
500000
400000
300000
200000
100000
Boxplot of Listing
IncomePC
List
ing
3250030000275002500022500200001750015000
900000
800000
700000
600000
500000
400000
300000
200000
100000
Scatterplot of Listing vs IncomePC
Listing
Perc
ent
10000008000006000004000002000000
99
95
90
80
70
605040
30
20
10
5
1
Mean 369687StDev 156865N 51AD 0.994P-Value 0.012
Probability Plot of ListingNormal - 95% CI
IncomePC
List
ing
3250030000275002500022500200001750015000
900000
800000
700000
600000
500000
400000
300000
200000
100000
Scatterplot of Listing vs IncomePC
Listing
Frequency
900000800000700000600000500000400000300000200000
14
12
10
8
6
4
2
0
Histogram of Listing
Listing
Perc
ent
9000
00
8000
00
7000
00
6000
00
5000
00
4000
00
3000
00
2000
00
1000
000
100
80
60
40
20
0
Mean 369687StDev 156865N 51
Empirical CDF of ListingNormal
IncomePC
List
ing
30000250002000015000
1000000
800000
600000
400000
200000
Marginal Plot of Listing vs IncomePC

17PepperoniPlainMushroomSausagePepper and OnionMushroom and OnionGarlicMeatball
CategoryMeatball
5.0%Garlic2.3%
Mushroom and Onion9.2%
Pepper and Onion7.3%
Sausage5.8%
Mushroom16.2%
Plain32.5%
Pepperoni21.8%
Pie Chart of Percent vs Type
List
ing
900000
800000
700000
600000
500000
400000
300000
200000
100000
Boxplot of Listing
IncomePC
List
ing
3250030000275002500022500200001750015000
900000
800000
700000
600000
500000
400000
300000
200000
100000
Scatterplot of Listing vs IncomePC
Listing
Perc
ent
10000008000006000004000002000000
99
95
90
80
70
605040
30
20
10
5
1
Mean 369687StDev 156865N 51AD 0.994P-Value 0.012
Probability Plot of ListingNormal - 95% CI
IncomePC
List
ing
3250030000275002500022500200001750015000
900000
800000
700000
600000
500000
400000
300000
200000
100000
Scatterplot of Listing vs IncomePC
Listing
Frequency
900000800000700000600000500000400000300000200000
14
12
10
8
6
4
2
0
Histogram of Listing
Listing
Perc
ent
9000
00
8000
00
7000
00
6000
00
5000
00
4000
00
3000
00
2000
00
1000
000
100
80
60
40
20
0
Mean 369687StDev 156865N 51
Empirical CDF of ListingNormal
IncomePC
List
ing
30000250002000015000
1000000
800000
600000
400000
200000
Marginal Plot of Listing vs IncomePC
The US Ranked 37th!
Countries were ranked by overall efficiency

18PepperoniPlainMushroomSausagePepper and OnionMushroom and OnionGarlicMeatball
CategoryMeatball
5.0%Garlic2.3%
Mushroom and Onion9.2%
Pepper and Onion7.3%
Sausage5.8%
Mushroom16.2%
Plain32.5%
Pepperoni21.8%
Pie Chart of Percent vs Type
List
ing
900000
800000
700000
600000
500000
400000
300000
200000
100000
Boxplot of Listing
IncomePC
List
ing
3250030000275002500022500200001750015000
900000
800000
700000
600000
500000
400000
300000
200000
100000
Scatterplot of Listing vs IncomePC
Listing
Perc
ent
10000008000006000004000002000000
99
95
90
80
70
605040
30
20
10
5
1
Mean 369687StDev 156865N 51AD 0.994P-Value 0.012
Probability Plot of ListingNormal - 95% CI
IncomePC
List
ing
3250030000275002500022500200001750015000
900000
800000
700000
600000
500000
400000
300000
200000
100000
Scatterplot of Listing vs IncomePC
Listing
Frequency
900000800000700000600000500000400000300000200000
14
12
10
8
6
4
2
0
Histogram of Listing
Listing
Perc
ent
9000
00
8000
00
7000
00
6000
00
5000
00
4000
00
3000
00
2000
00
1000
000
100
80
60
40
20
0
Mean 369687StDev 156865N 51
Empirical CDF of ListingNormal
IncomePC
List
ing
30000250002000015000
1000000
800000
600000
400000
200000
Marginal Plot of Listing vs IncomePC
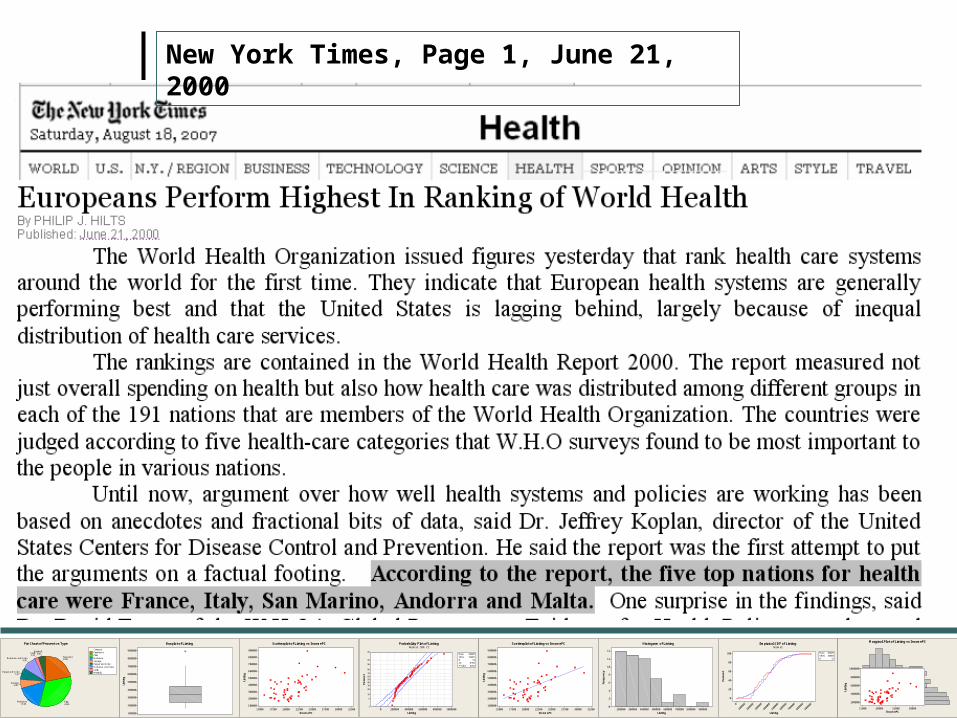
What Did The Study Find?
Did this study rank the world’s health care systems? NO. The tables in the papers ranked the efficiencies of the world’s health care systems. A country could have the best health care system (rank first), and still be inefficient.
The highest ranked country (COMP) is Japan. Japan ranked 10th in the efficiency study.
Note the front page NYT Article, 6/21/00.
19PepperoniPlainMushroomSausagePepper and OnionMushroom and OnionGarlicMeatball
CategoryMeatball
5.0%Garlic2.3%
Mushroom and Onion9.2%
Pepper and Onion7.3%
Sausage5.8%
Mushroom16.2%
Plain32.5%
Pepperoni21.8%
Pie Chart of Percent vs Type
List
ing
900000
800000
700000
600000
500000
400000
300000
200000
100000
Boxplot of Listing
IncomePC
List
ing
3250030000275002500022500200001750015000
900000
800000
700000
600000
500000
400000
300000
200000
100000
Scatterplot of Listing vs IncomePC
Listing
Perc
ent
10000008000006000004000002000000
99
95
90
80
70
605040
30
20
10
5
1
Mean 369687StDev 156865N 51AD 0.994P-Value 0.012
Probability Plot of ListingNormal - 95% CI
IncomePC
List
ing
3250030000275002500022500200001750015000
900000
800000
700000
600000
500000
400000
300000
200000
100000
Scatterplot of Listing vs IncomePC
Listing
Frequency
900000800000700000600000500000400000300000200000
14
12
10
8
6
4
2
0
Histogram of Listing
Listing
Perc
ent
9000
00
8000
00
7000
00
6000
00
5000
00
4000
00
3000
00
2000
00
1000
000
100
80
60
40
20
0
Mean 369687StDev 156865N 51
Empirical CDF of ListingNormal
IncomePC
List
ing
30000250002000015000
1000000
800000
600000
400000
200000
Marginal Plot of Listing vs IncomePC
New York Times, Page 1, June 21, 2000

20PepperoniPlainMushroomSausagePepper and OnionMushroom and OnionGarlicMeatball
CategoryMeatball
5.0%Garlic2.3%
Mushroom and Onion9.2%
Pepper and Onion7.3%
Sausage5.8%
Mushroom16.2%
Plain32.5%
Pepperoni21.8%
Pie Chart of Percent vs Type
List
ing
900000
800000
700000
600000
500000
400000
300000
200000
100000
Boxplot of Listing
IncomePC
List
ing
3250030000275002500022500200001750015000
900000
800000
700000
600000
500000
400000
300000
200000
100000
Scatterplot of Listing vs IncomePC
Listing
Perc
ent
10000008000006000004000002000000
99
95
90
80
70
605040
30
20
10
5
1
Mean 369687StDev 156865N 51AD 0.994P-Value 0.012
Probability Plot of ListingNormal - 95% CI
IncomePC
List
ing
3250030000275002500022500200001750015000
900000
800000
700000
600000
500000
400000
300000
200000
100000
Scatterplot of Listing vs IncomePC
Listing
Frequency
900000800000700000600000500000400000300000200000
14
12
10
8
6
4
2
0
Histogram of Listing
Listing
Perc
ent
9000
00
8000
00
7000
00
6000
00
5000
00
4000
00
3000
00
2000
00
1000
000
100
80
60
40
20
0
Mean 369687StDev 156865N 51
Empirical CDF of ListingNormal
IncomePC
List
ing
30000250002000015000
1000000
800000
600000
400000
200000
Marginal Plot of Listing vs IncomePC
The WHO Data Set

21PepperoniPlainMushroomSausagePepper and OnionMushroom and OnionGarlicMeatball
CategoryMeatball
5.0%Garlic2.3%
Mushroom and Onion9.2%
Pepper and Onion7.3%
Sausage5.8%
Mushroom16.2%
Plain32.5%
Pepperoni21.8%
Pie Chart of Percent vs Type
List
ing
900000
800000
700000
600000
500000
400000
300000
200000
100000
Boxplot of Listing
IncomePC
List
ing
3250030000275002500022500200001750015000
900000
800000
700000
600000
500000
400000
300000
200000
100000
Scatterplot of Listing vs IncomePC
Listing
Perc
ent
10000008000006000004000002000000
99
95
90
80
70
605040
30
20
10
5
1
Mean 369687StDev 156865N 51AD 0.994P-Value 0.012
Probability Plot of ListingNormal - 95% CI
IncomePC
List
ing
3250030000275002500022500200001750015000
900000
800000
700000
600000
500000
400000
300000
200000
100000
Scatterplot of Listing vs IncomePC
Listing
Frequency
900000800000700000600000500000400000300000200000
14
12
10
8
6
4
2
0
Histogram of Listing
Listing
Perc
ent
9000
00
8000
00
7000
00
6000
00
5000
00
4000
00
3000
00
2000
00
1000
000
100
80
60
40
20
0
Mean 369687StDev 156865N 51
Empirical CDF of ListingNormal
IncomePC
List
ing
30000250002000015000
1000000
800000
600000
400000
200000
Marginal Plot of Listing vs IncomePC
WHO Augmented Data Set