statistics review basic concepts: variability measures distributions hypotheses types of error...
Post on 18-Dec-2015
223 views
TRANSCRIPT
Statistics review
Basic concepts:
• Variability measures
• Distributions
• Hypotheses
• Types of error
Common analyses
• T-tests
• One-way ANOVA
• Randomized block ANOVA
• Two-way ANOVA
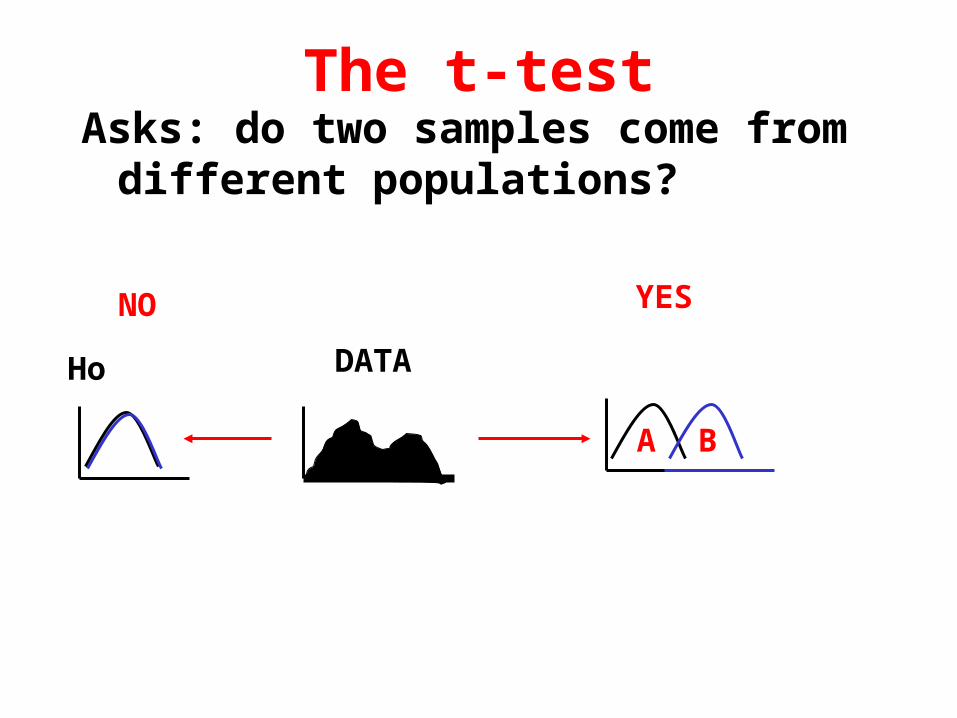
Asks: do two samples come from different populations?
The t-test
A B
DATA
NO YES
Ho
Depends on whether the difference between samples is much greater than difference
within sample.
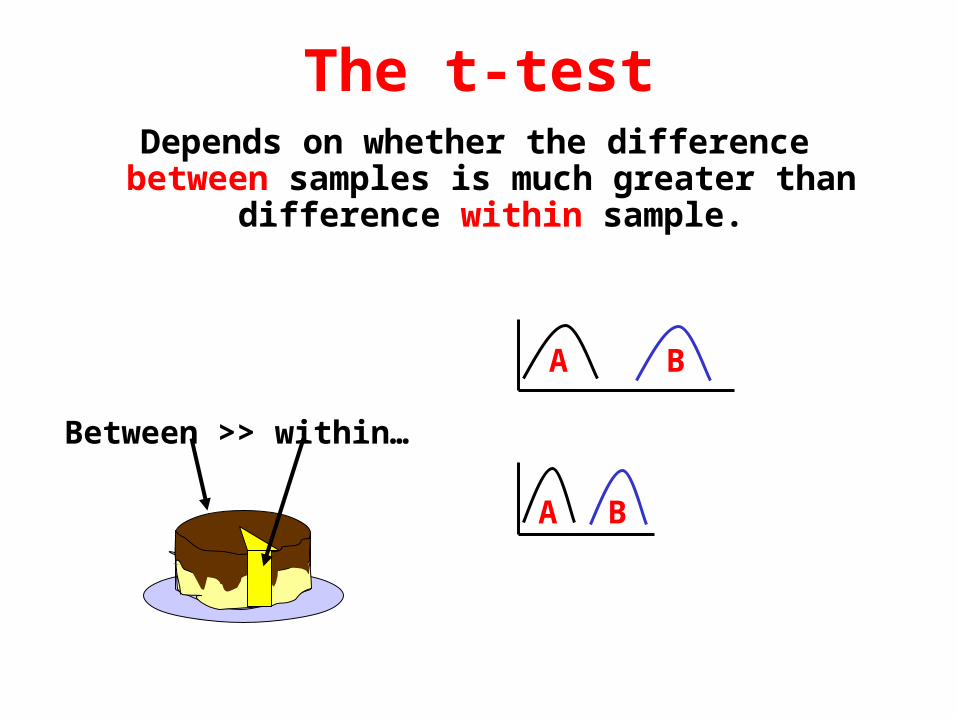
The t-test
A B
A B
Between >> within…
Depends on whether the difference between samples is much greater than difference
within sample.
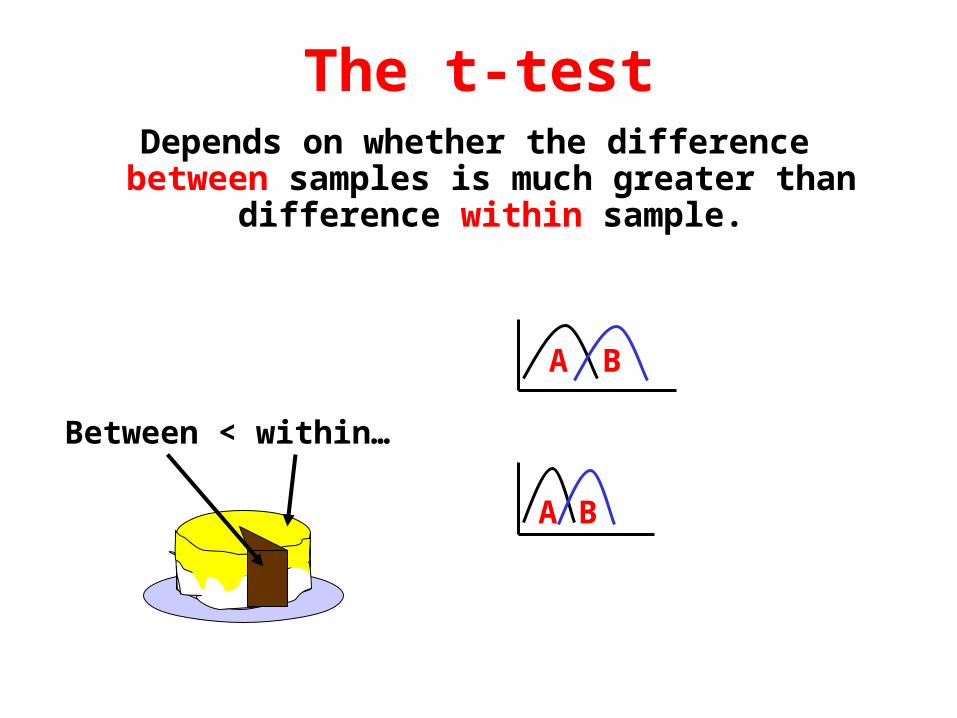
The t-test
A B
A B
Between < within…
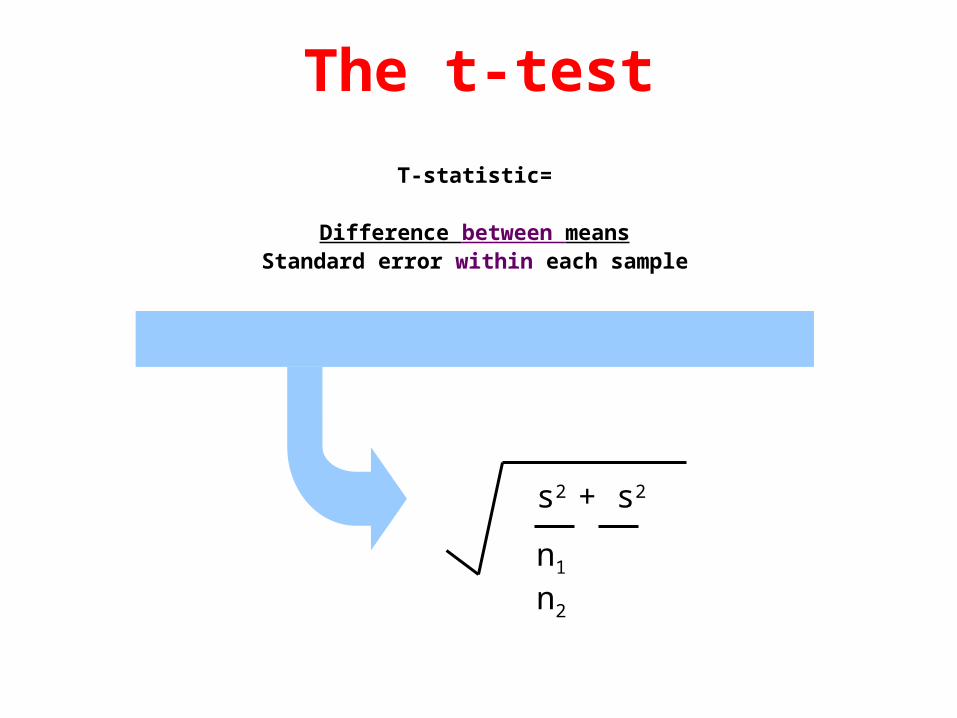
T-statistic=
Difference between meansStandard error within each sample
The t-test
s2 + s2
n1 n2
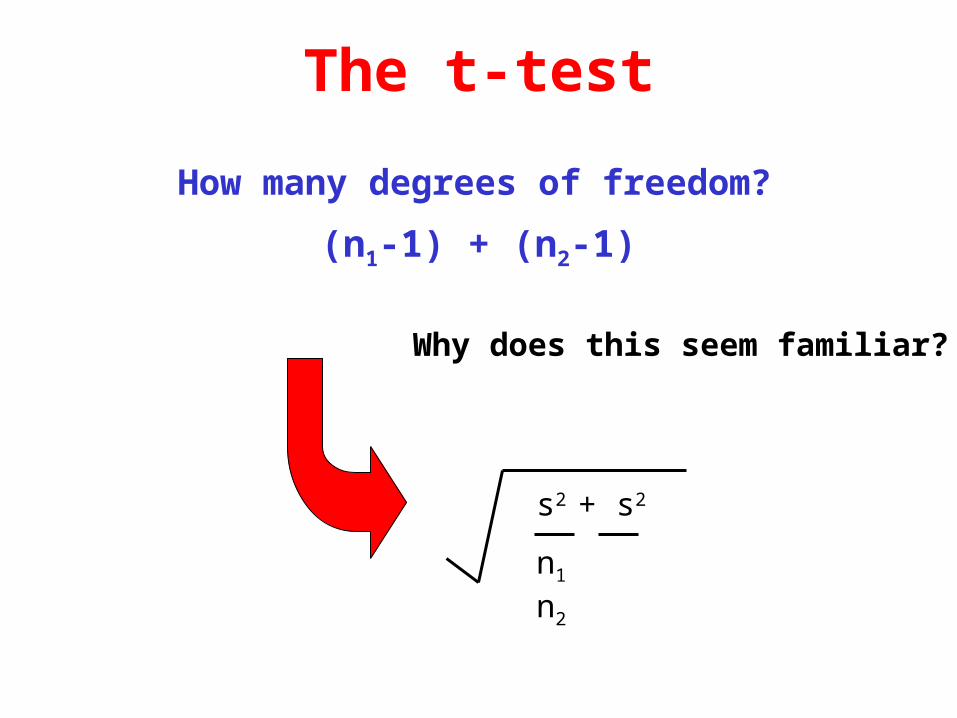
How many degrees of freedom?
The t-test
s2 + s2
n1 n2
(n1-1) + (n2-1)
Why does this seem familiar?
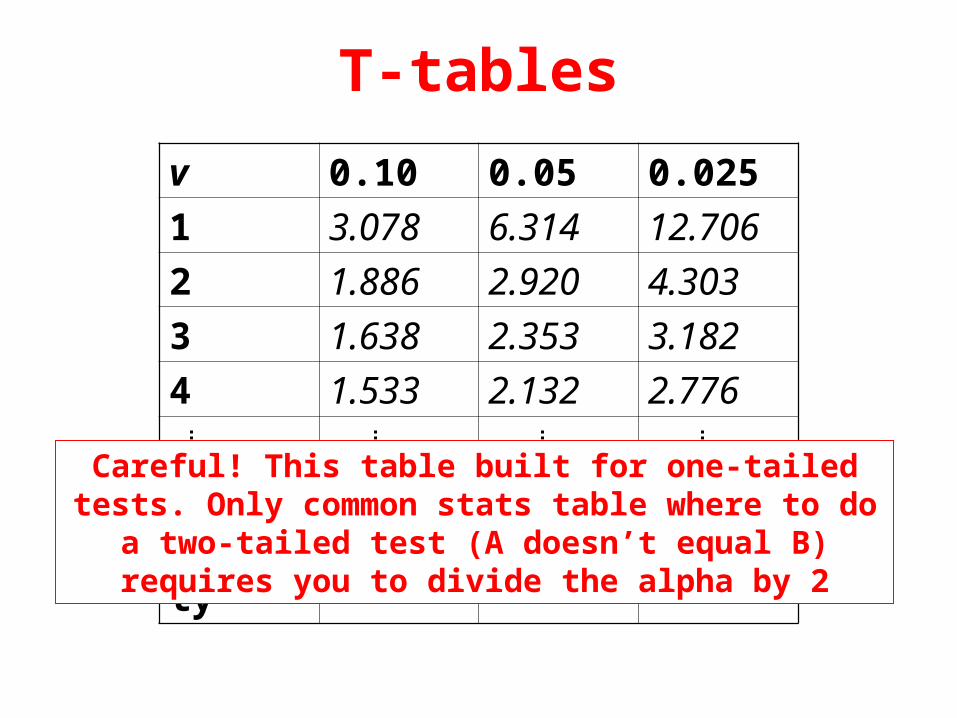
T-tables
v 0.10 0.05 0.025
1 3.078 6.314 12.706
2 1.886 2.920 4.303
3 1.638 2.353 3.182
4 1.533 2.132 2.776
infinity 1.282 1.645 1.960
Careful! This table built for one-tailed tests. Only common stats table where to do a two-tailed test (A
doesn’t equal B) requires you to divide the alpha by 2
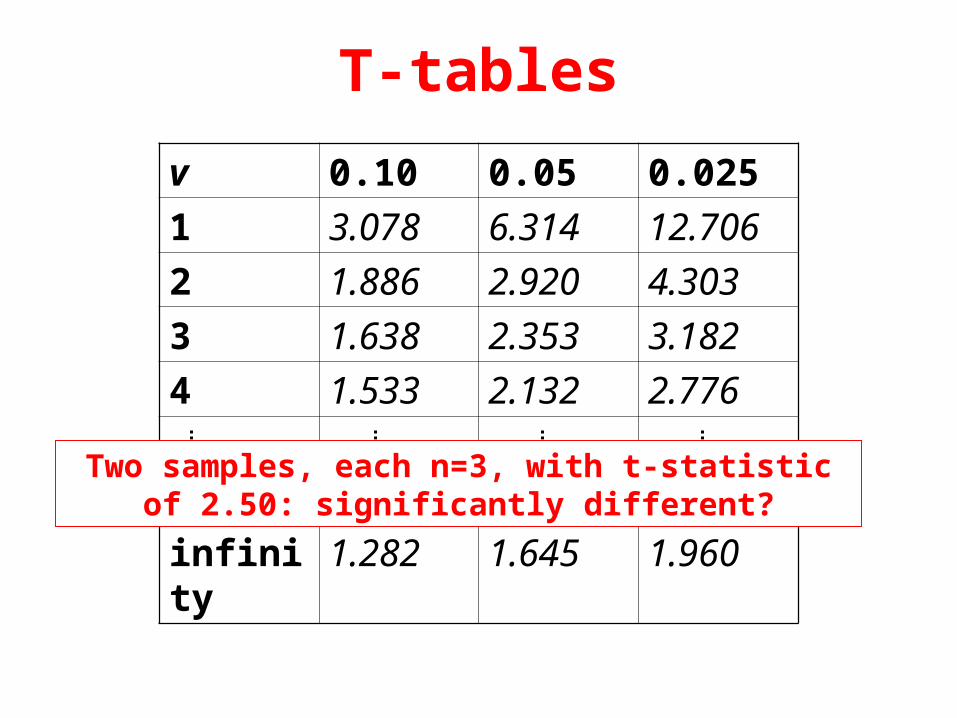
T-tables
v 0.10 0.05 0.025
1 3.078 6.314 12.706
2 1.886 2.920 4.303
3 1.638 2.353 3.182
4 1.533 2.132 2.776
infinity 1.282 1.645 1.960
Two samples, each n=3, with t-statistic of 2.50: significantly different?
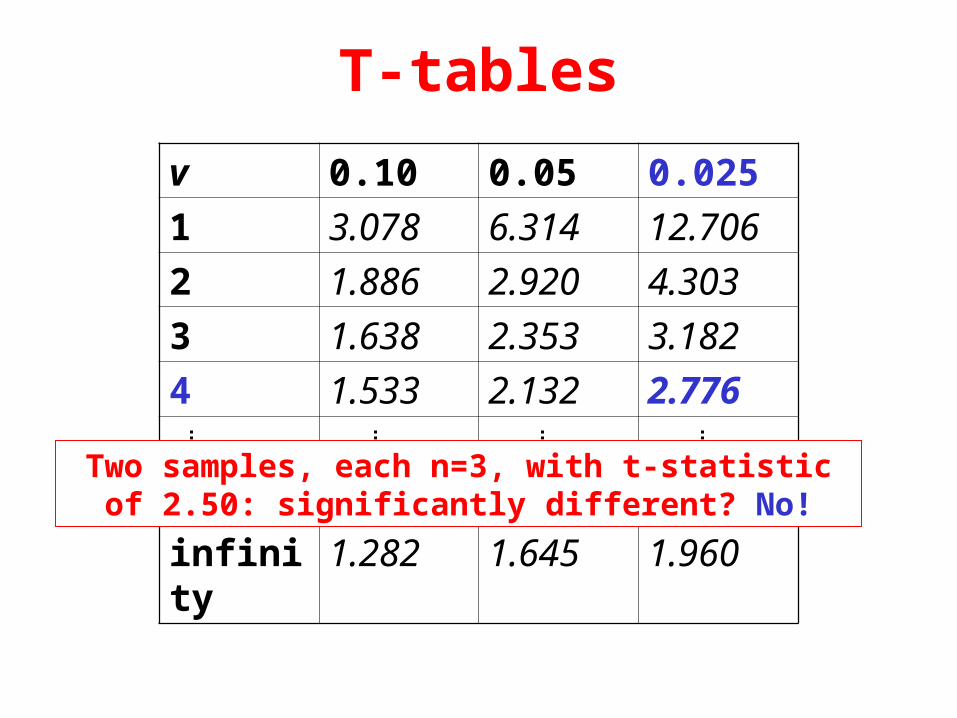
T-tables
v 0.10 0.05 0.025
1 3.078 6.314 12.706
2 1.886 2.920 4.303
3 1.638 2.353 3.182
4 1.533 2.132 2.776
infinity 1.282 1.645 1.960
Two samples, each n=3, with t-statistic of 2.50: significantly different? No!
v 0.10 0.05 0.025
1 3.078 6.314 12.706
2 1.886 2.920 4.303
3 1.638 2.353 3.182
4 1.533 2.132 2.776
infinity 1.282 1.645 1.960
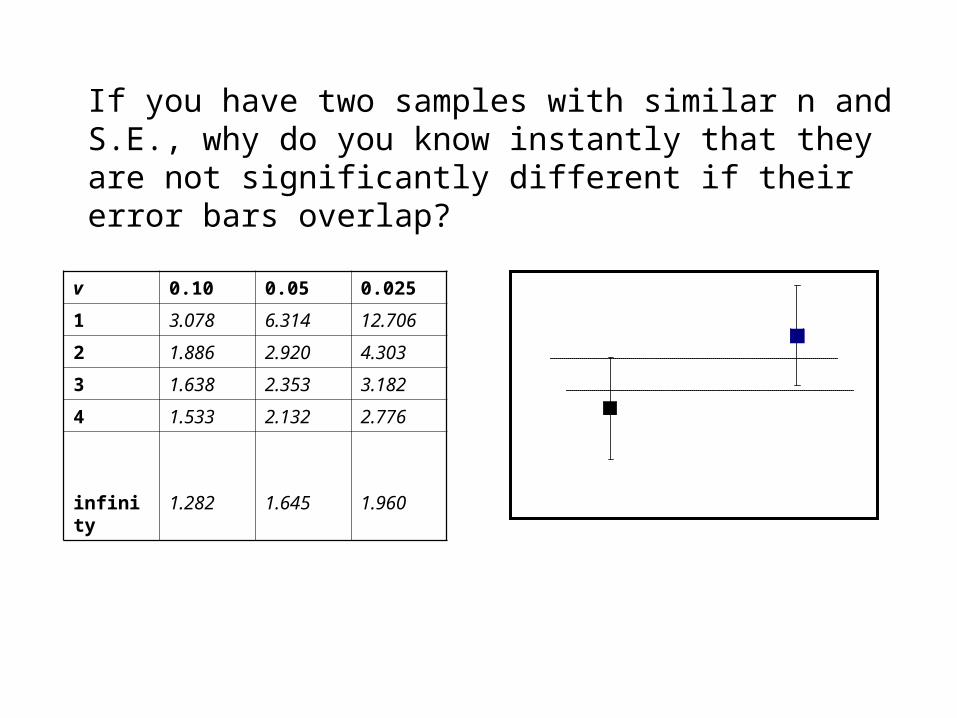
If you have two samples with similar n and S.E., why do you know instantly that they are not significantly different if their error bars overlap?
v 0.10 0.05 0.025
1 3.078 6.314 12.706
2 1.886 2.920 4.303
3 1.638 2.353 3.182
4 1.533 2.132 2.776
infinity 1.282 1.645 1.960
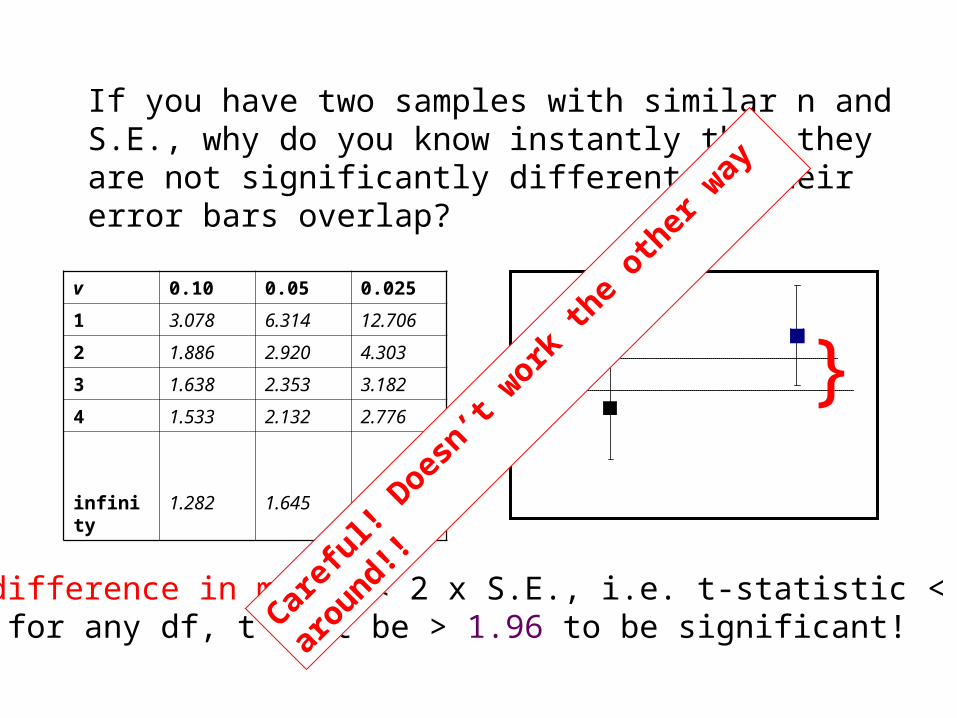
If you have two samples with similar n and S.E., why do you know instantly that they are not significantly different if their error bars overlap?
}
• the difference in means < 2 x S.E., i.e. t-statistic < 2• and, for any df, t must be > 1.96 to be significant!Car
eful!
Doesn’t
work th
e oth
er w
ay a
round!!
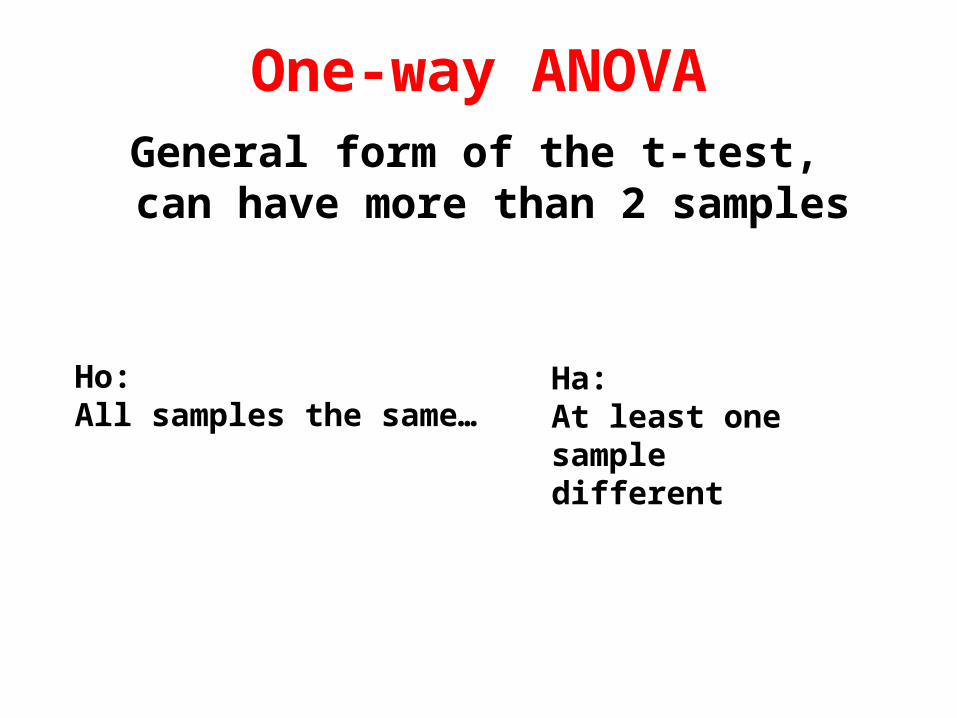
General form of the t-test, can have more than 2 samples
One-way ANOVA
Ho:All samples the same…
Ha:At least one sample different
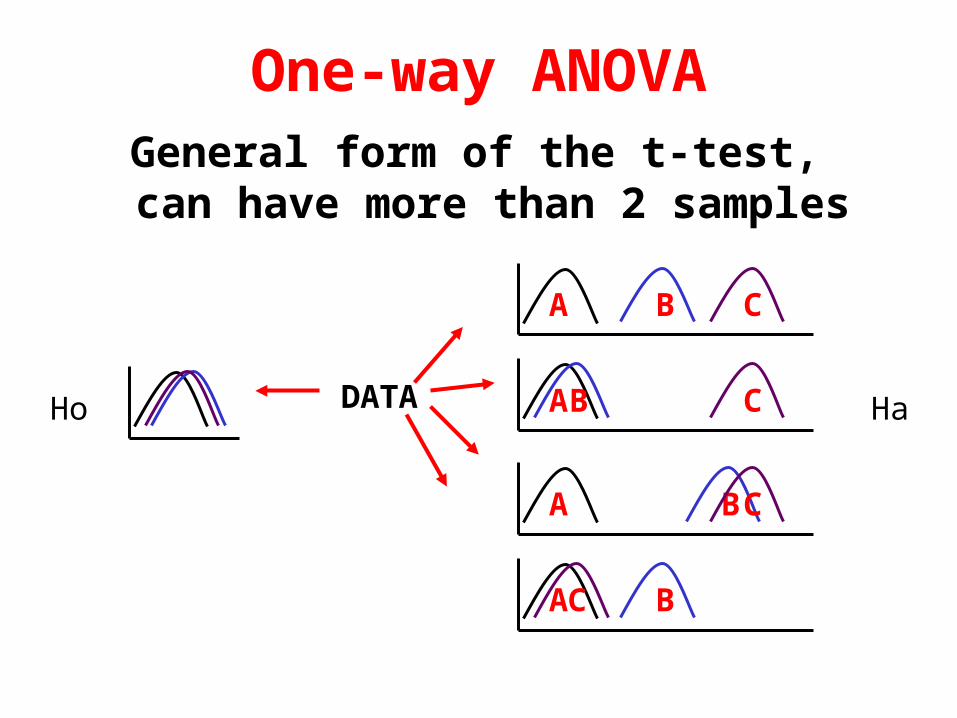
General form of the t-test, can have more than 2 samples
One-way ANOVA
A B C
AB C
A BC
A BC
DATAHo Ha
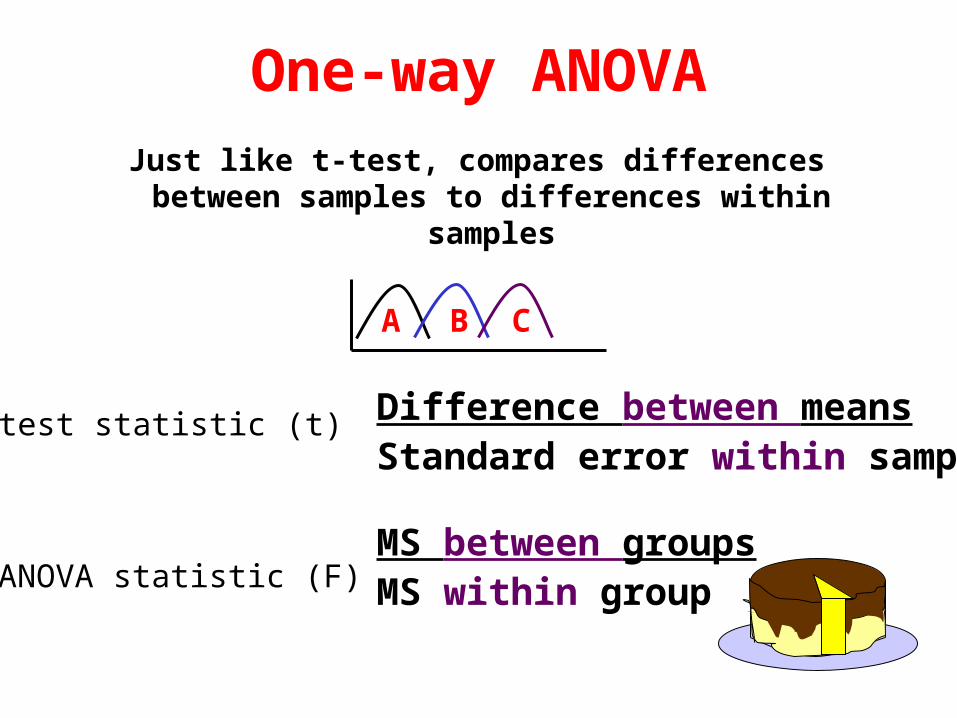
Just like t-test, compares differences between samples to differences within samples
One-way ANOVA
A B C
Difference between meansStandard error within sample
MS between groupsMS within group
T-test statistic (t)
ANOVA statistic (F)
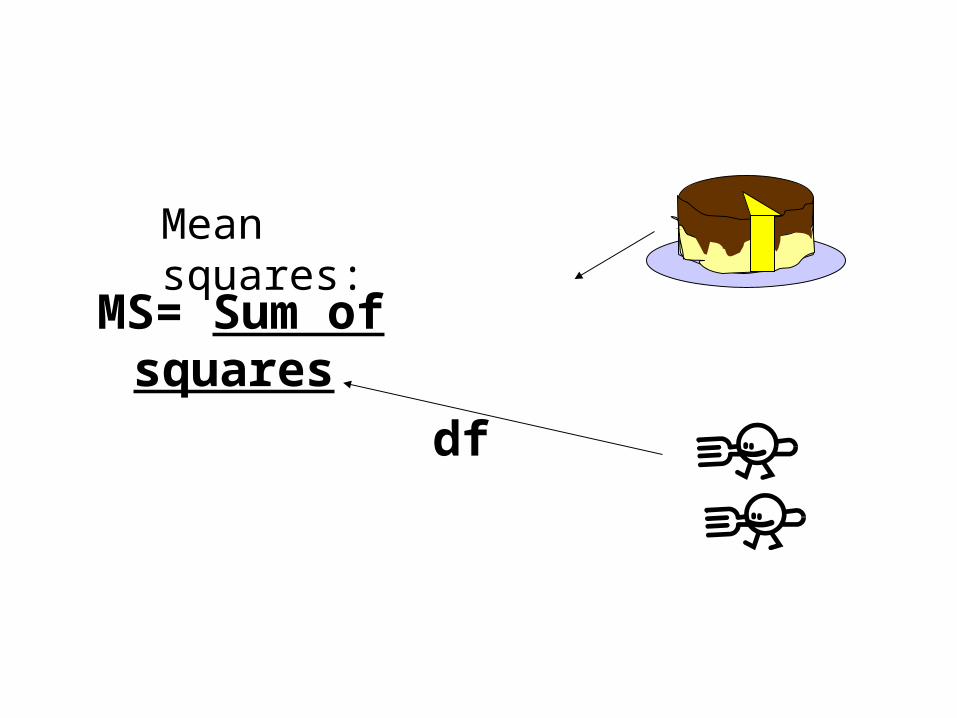
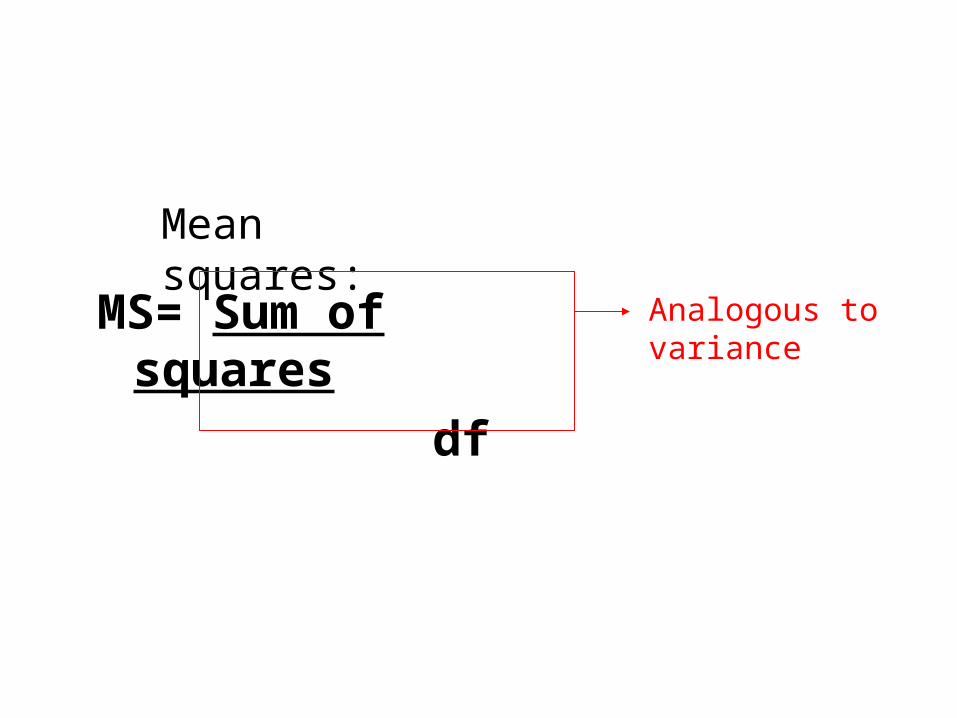
MS= Sum of squares df
Mean squares:
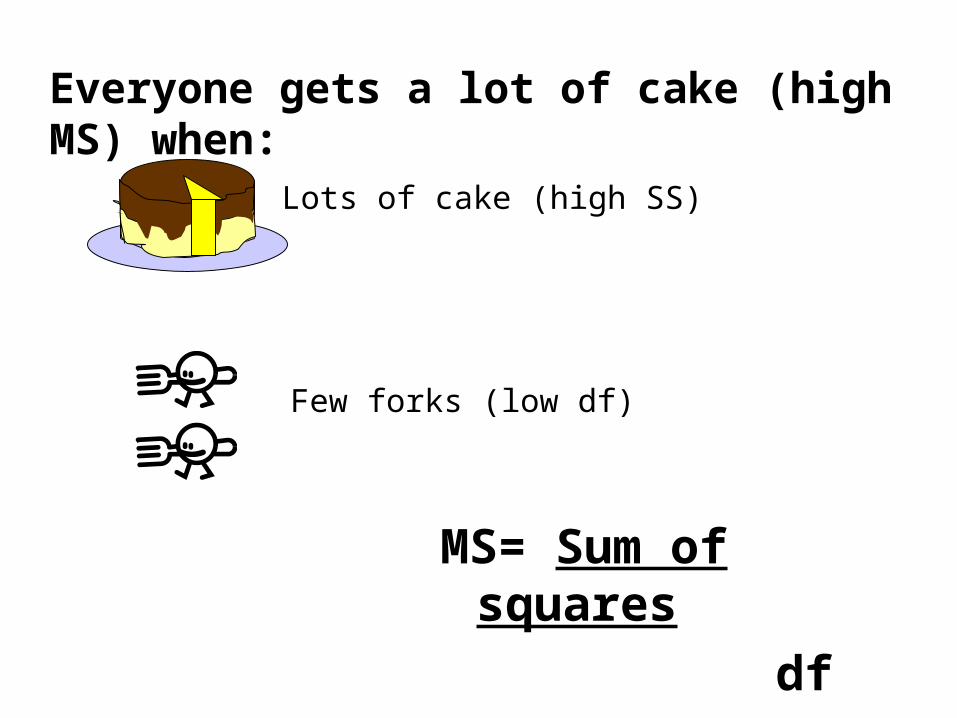
Everyone gets a lot of cake (high MS) when:
Lots of cake (high SS)
Few forks (low df)
MS= Sum of squares df
MS= Sum of squares df
Mean squares:
Analogous tovariance
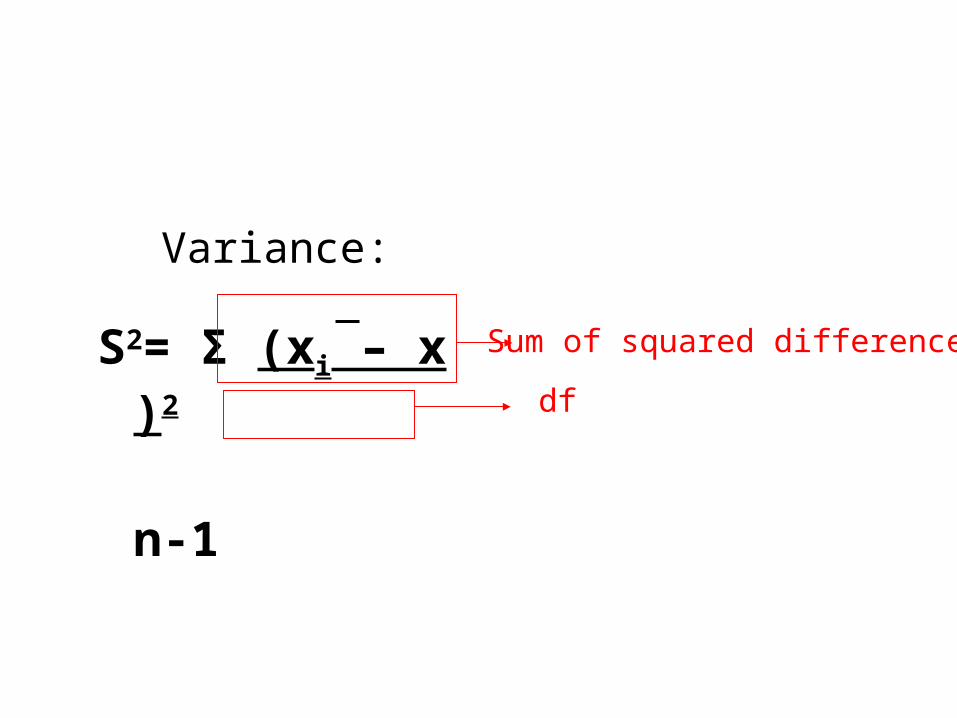
Variance:
S2= Σ (xi – x )2
n-1
Sum of squared differences
df
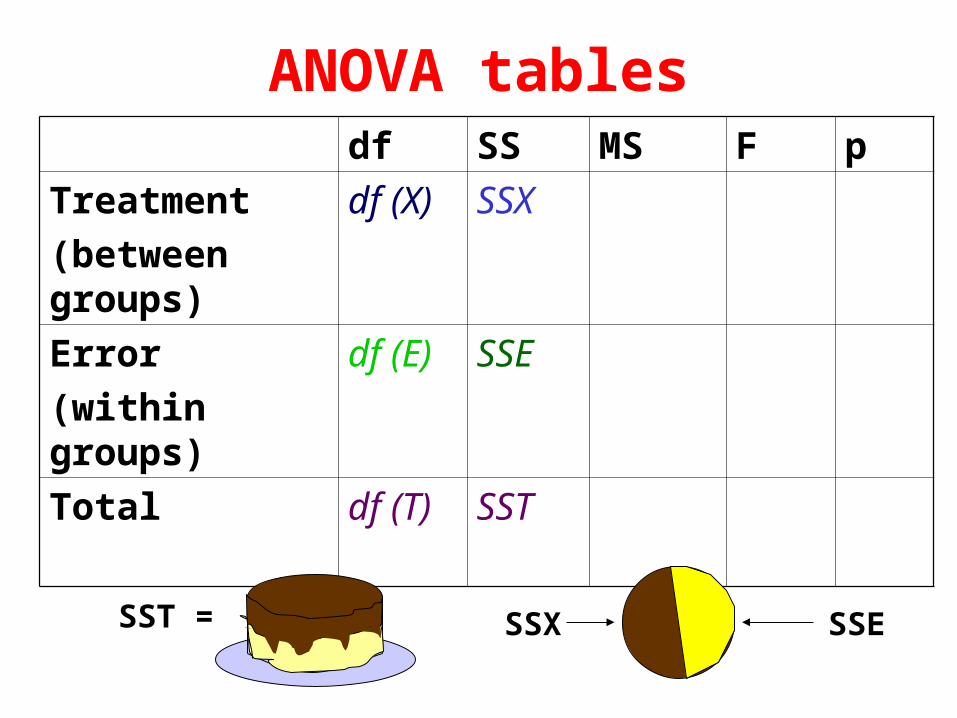
ANOVA tablesdf SS MS F p
Treatment
(between groups)
df (X) SSX
Error
(within groups)
df (E) SSE
Total df (T) SST
SST = SSX SSE
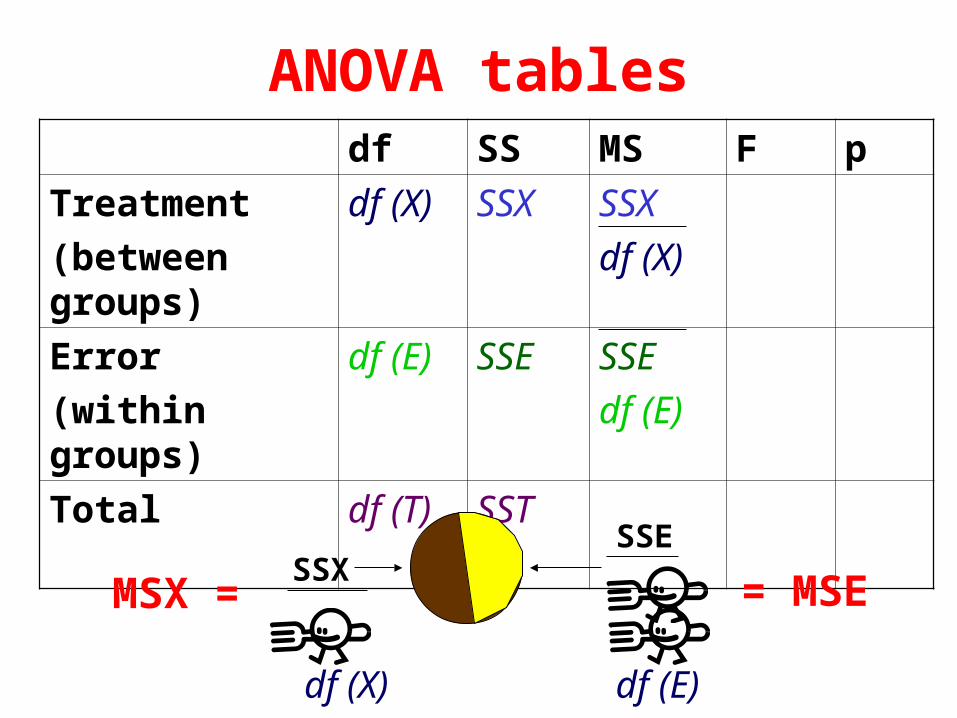
ANOVA tablesdf SS MS F p
Treatment
(between groups)
df (X) SSX SSX
df (X)
Error
(within groups)
df (E) SSE SSE
df (E)
Total df (T) SST
SSXSSE
df (X) df (E)
MSX = = MSE
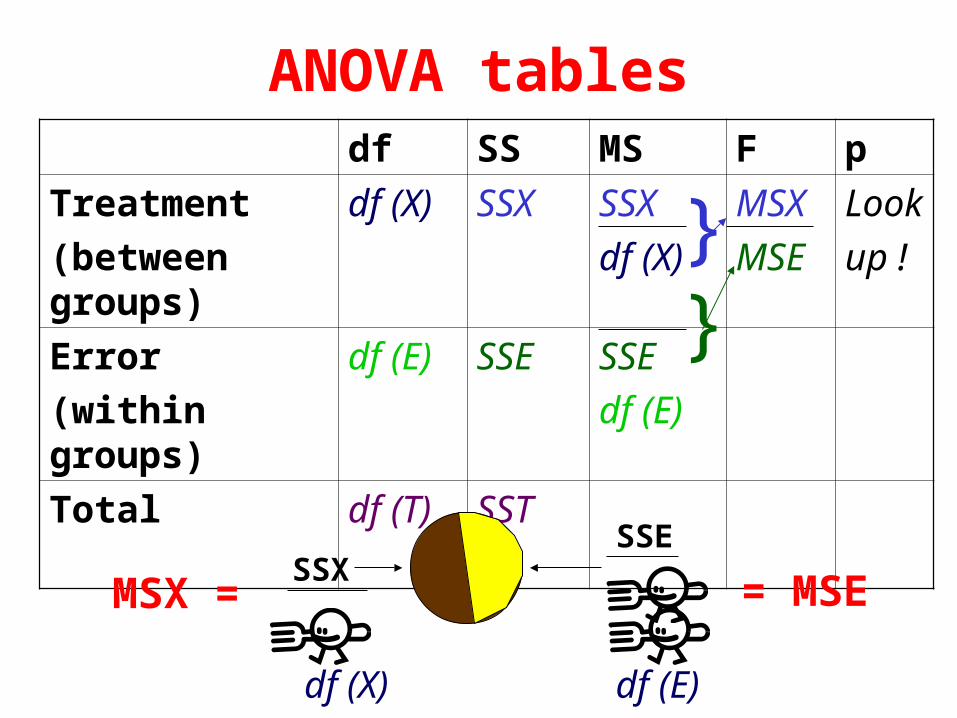
ANOVA tablesdf SS MS F p
Treatment
(between groups)
df (X) SSX SSX
df (X)
MSX
MSE
Look
up !
Error
(within groups)
df (E) SSE SSE
df (E)
Total df (T) SST
}}
SSXSSE
df (X) df (E)
MSX = = MSE
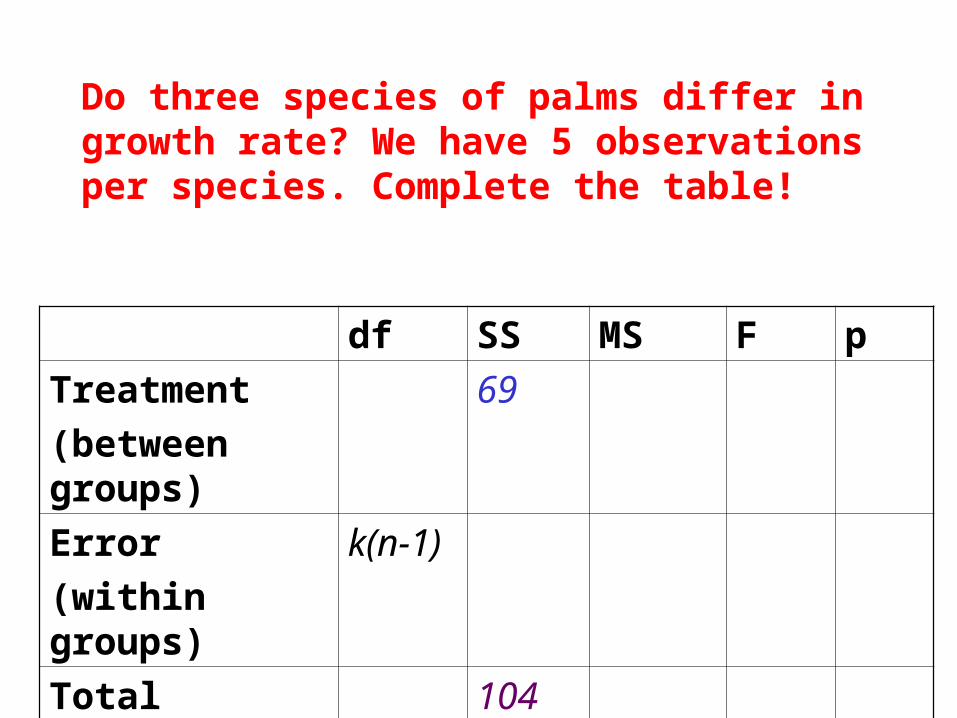
Do three species of palms differ in growth rate? We have 5 observations per species. Complete the table!
df SS MS F p
Treatment
(between groups)
69
Error
(within groups)
k(n-1)
Total 104
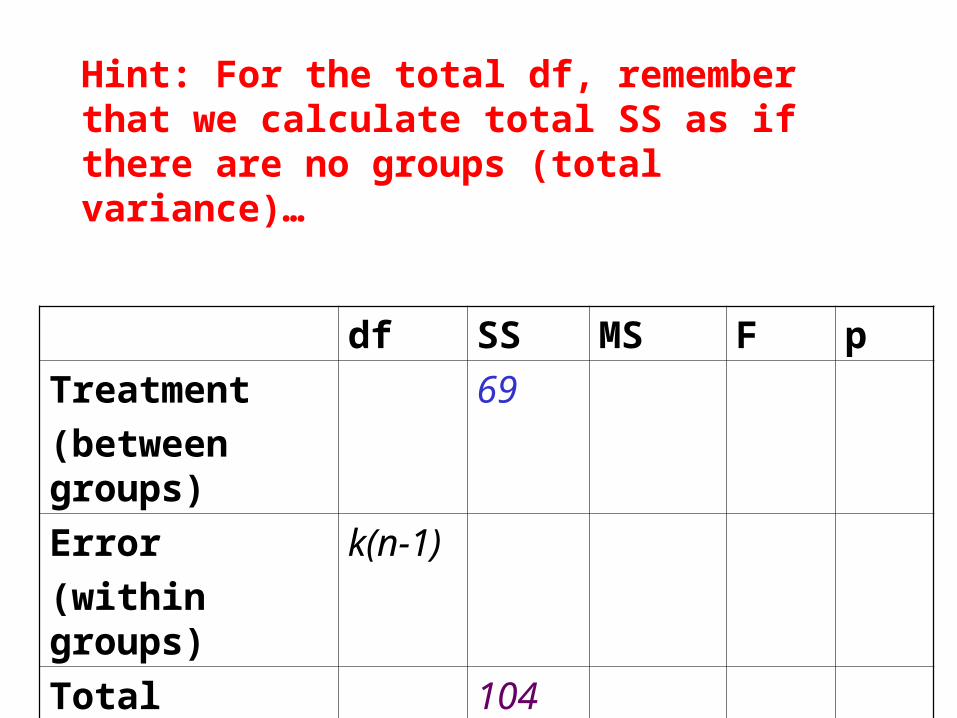
Hint: For the total df, remember that we calculate total SS as if there are no groups (total variance)…
df SS MS F p
Treatment
(between groups)
69
Error
(within groups)
k(n-1)
Total 104
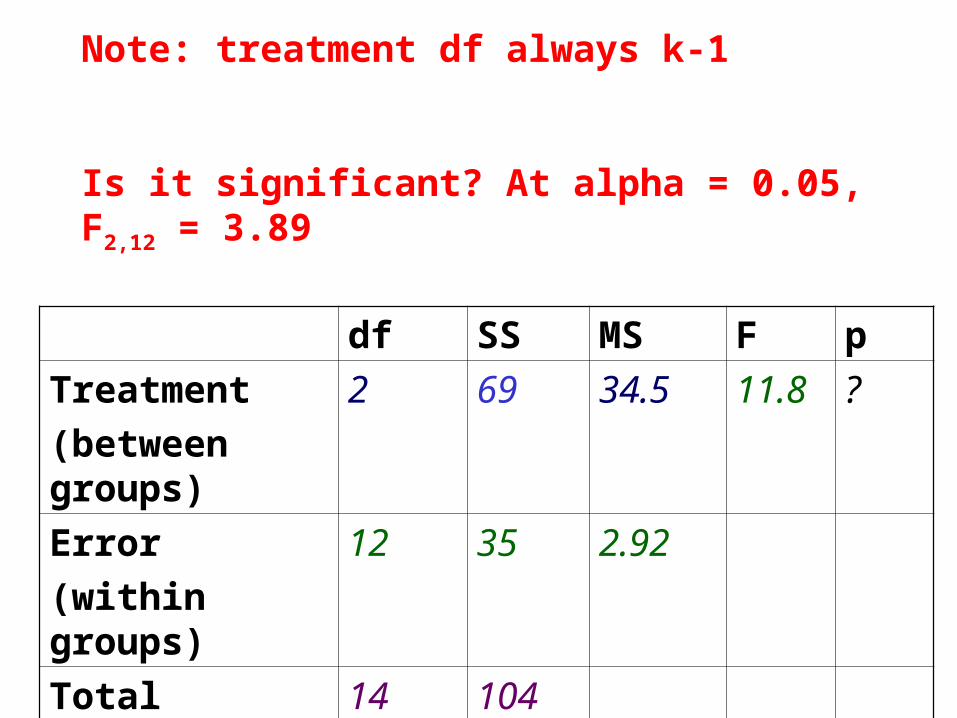
Note: treatment df always k-1
Is it significant? At alpha = 0.05, F2,12 = 3.89
df SS MS F p
Treatment
(between groups)
2 69 34.5 11.8 ?
Error
(within groups)
12 35 2.92
Total 14 104
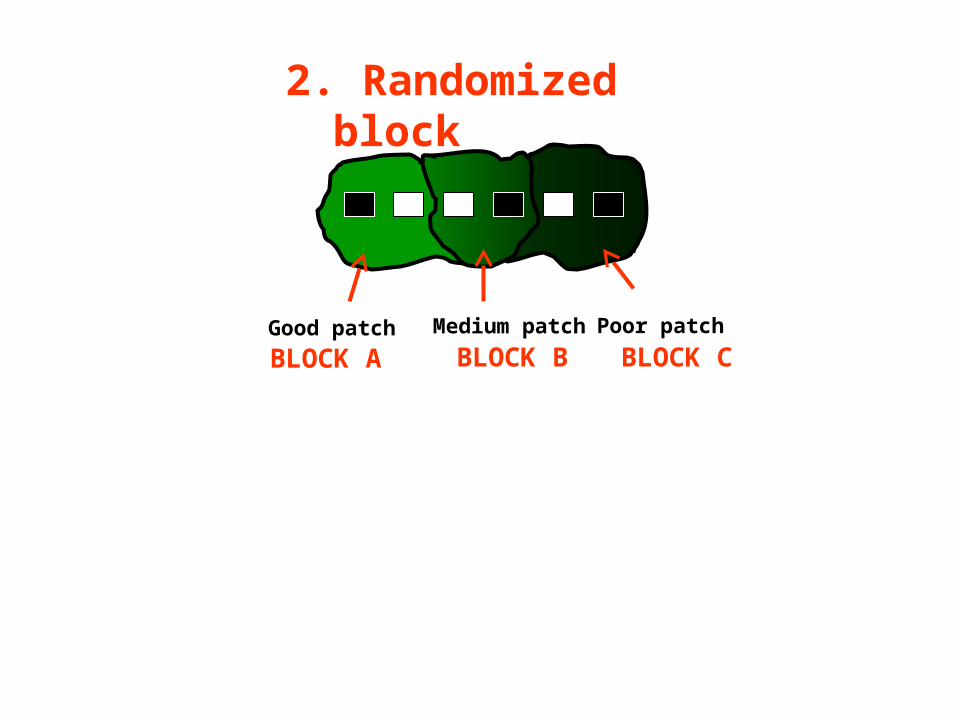
2. Randomized block
Good patch Medium patch Poor patch
BLOCK A BLOCK B BLOCK C
Error
Treatment
Error
Treatment
Block
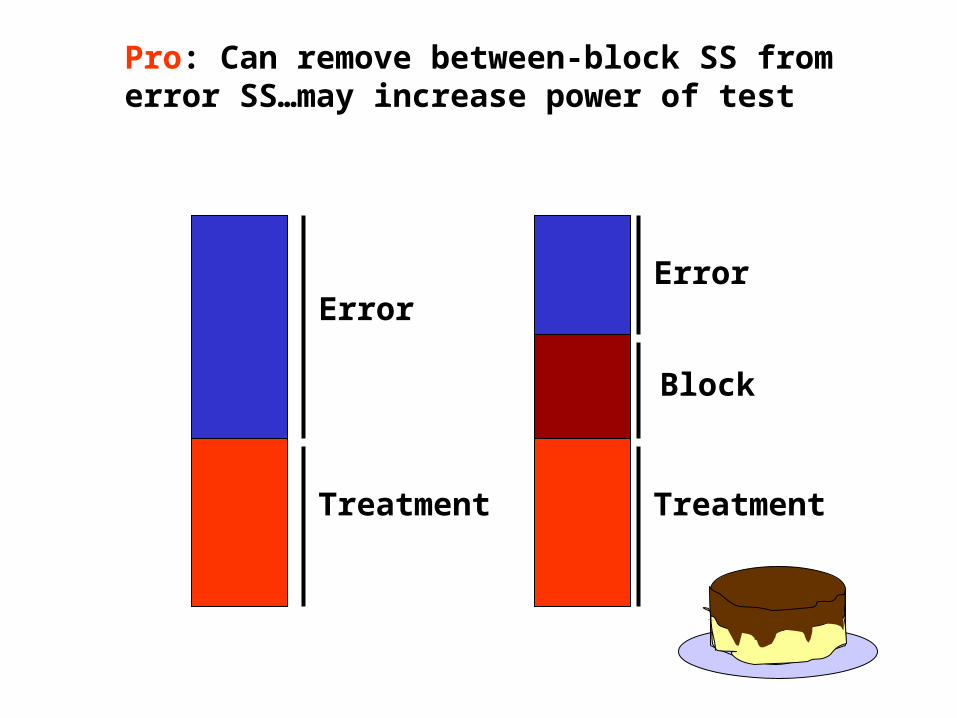
Pro: Can remove between-block SS from error SS…may increase power of test
Error
Treatment
Error
Treatment
Block
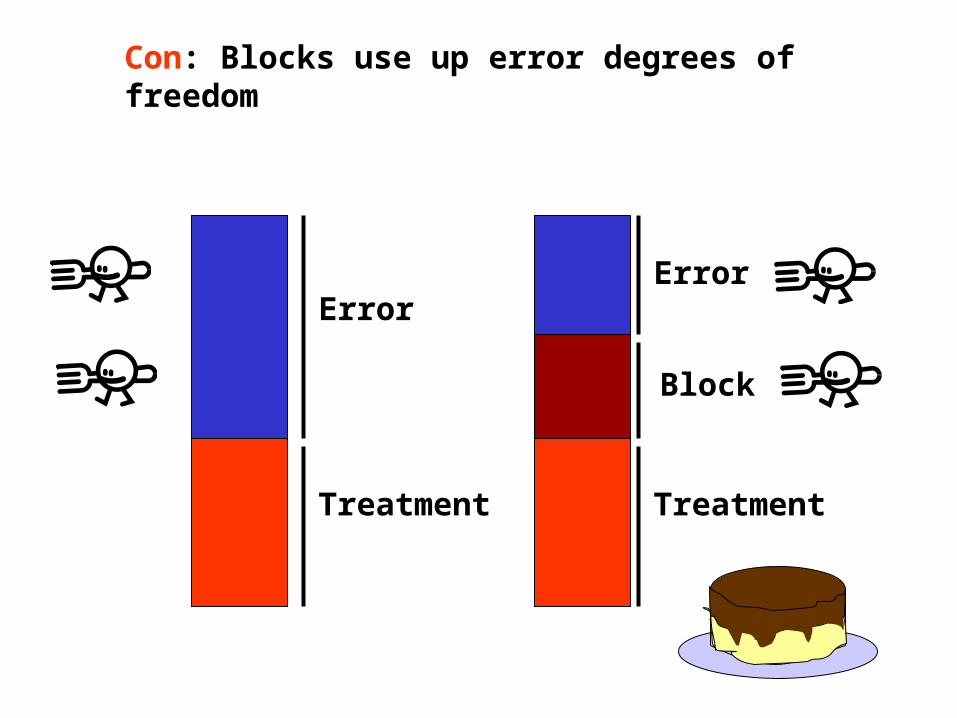
Con: Blocks use up error degrees of freedom
Error
Treatment
Error
Treatment
Block
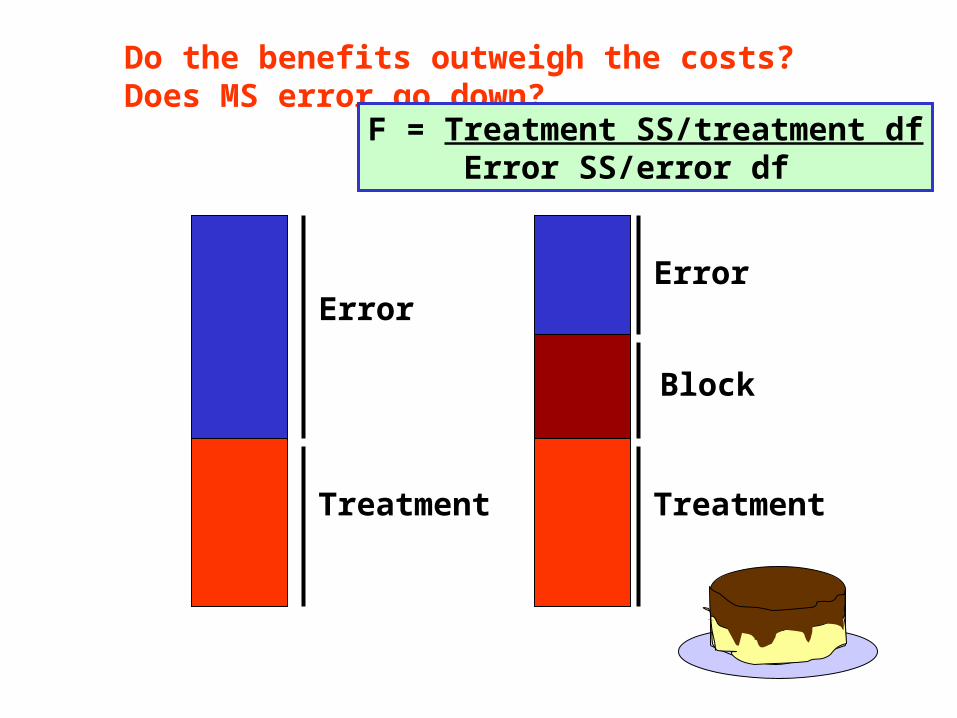
Do the benefits outweigh the costs? Does MS error go down?
F = Treatment SS/treatment dfError SS/error df
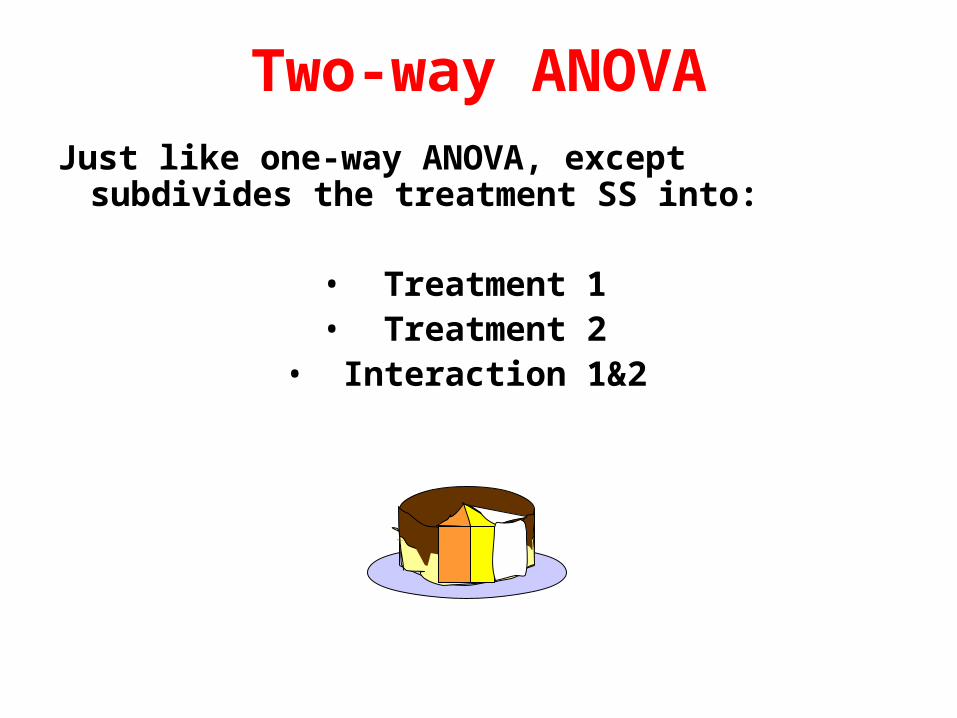
Just like one-way ANOVA, except subdivides the treatment SS into:
• Treatment 1• Treatment 2
• Interaction 1&2
Two-way ANOVA
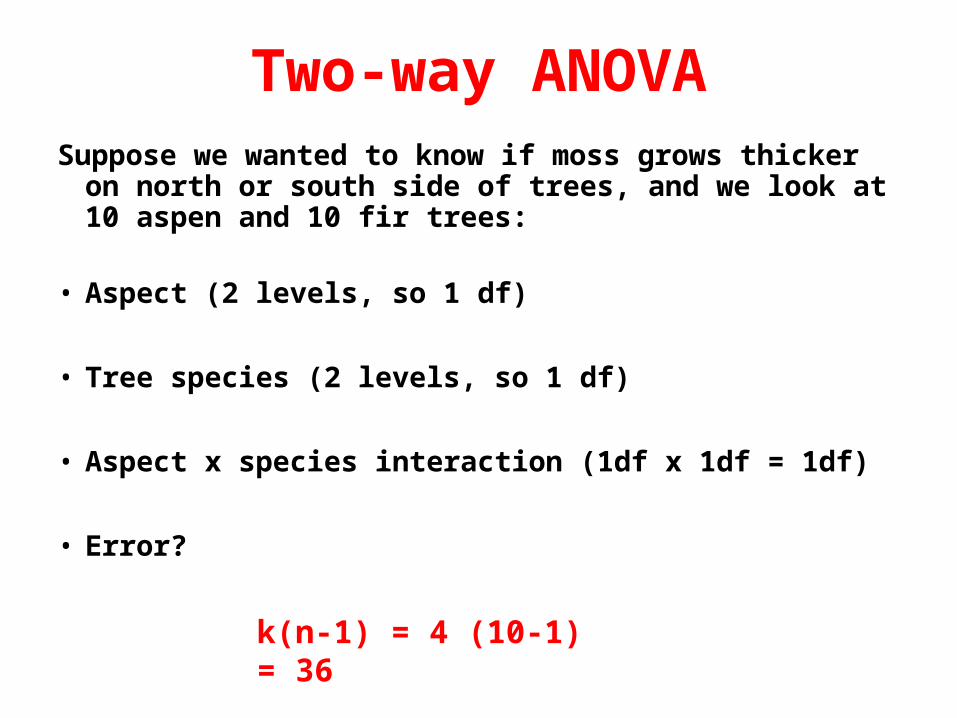
Suppose we wanted to know if moss grows thicker on north or south side of trees, and we look at 10 aspen and 10 fir trees:
• Aspect (2 levels, so 1 df)
• Tree species (2 levels, so 1 df)
• Aspect x species interaction (1df x 1df = 1df)
• Error?
Two-way ANOVA
k(n-1) = 4 (10-1) = 36
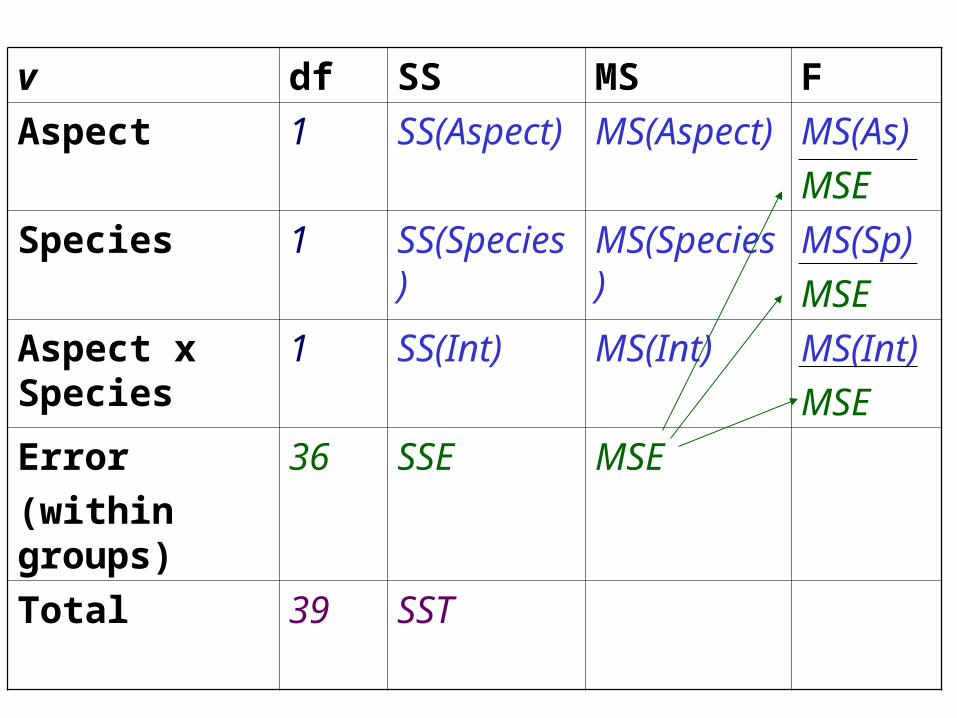
v df SS MS F
Aspect 1 SS(Aspect) MS(Aspect) MS(As)
MSE
Species 1 SS(Species) MS(Species) MS(Sp)
MSE
Aspect x Species
1 SS(Int) MS(Int) MS(Int)
MSE
Error
(within groups)
36 SSE MSE
Total 39 SST
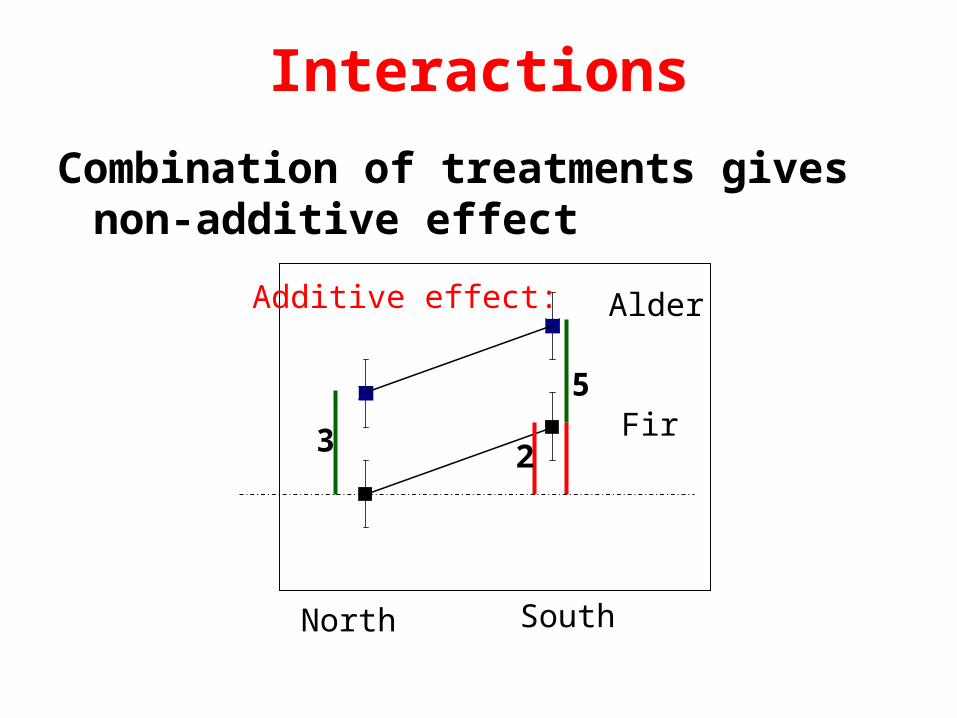
Combination of treatments gives non-additive effect
Interactions
Additive effect:
North South
Alder
Fir3 2
5
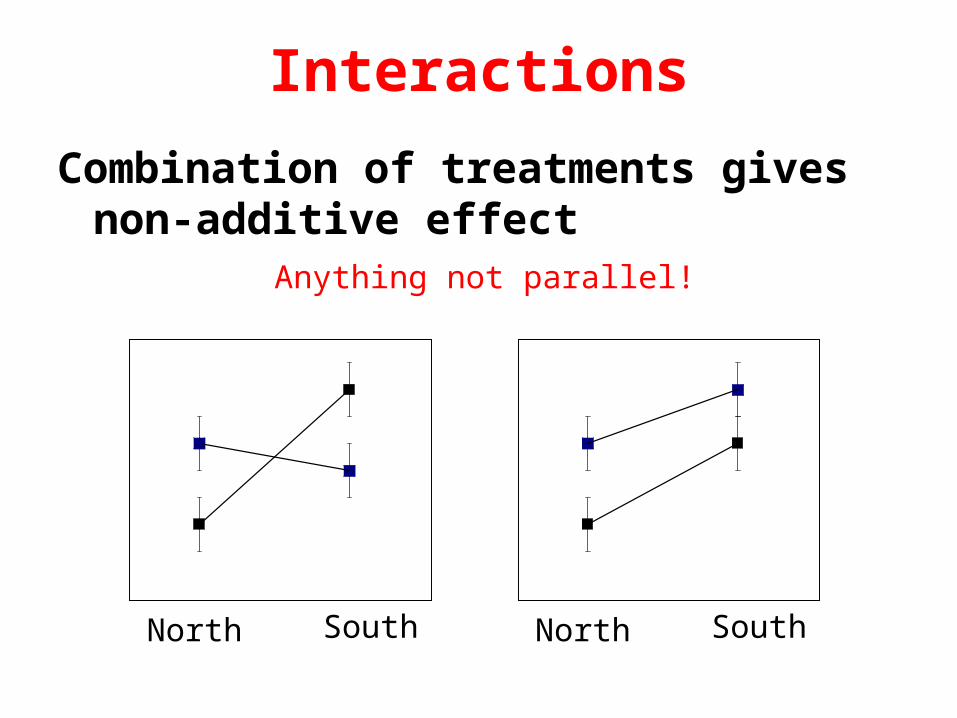
Combination of treatments gives non-additive effect
Interactions
North South North South
Anything not parallel!
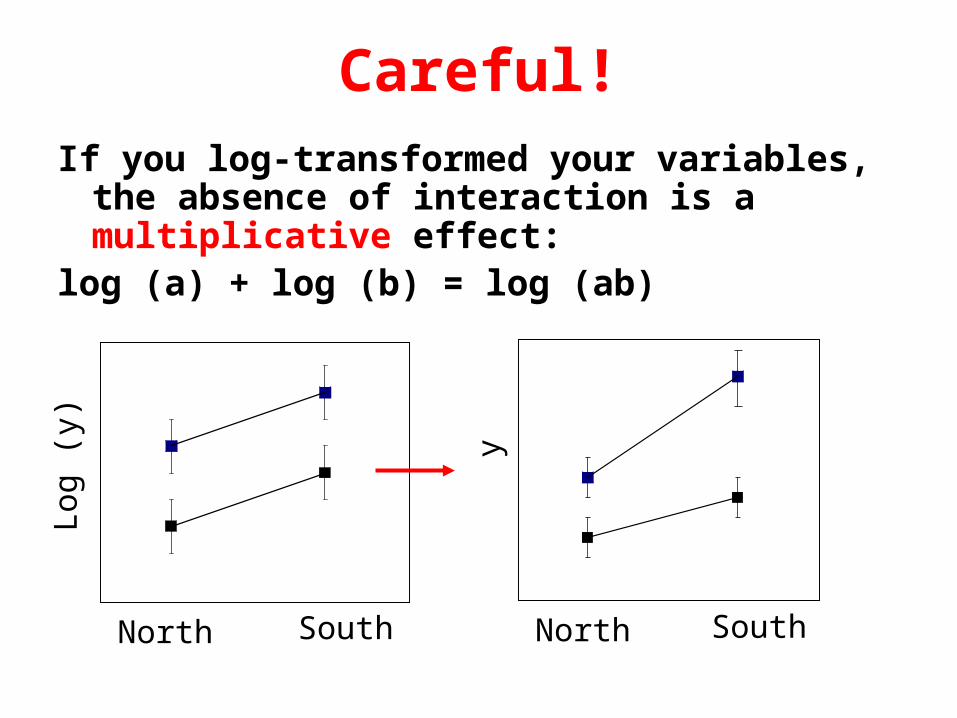
If you log-transformed your variables, the absence of interaction is a multiplicative effect:
log (a) + log (b) = log (ab)
Careful!
North SouthNorth South
Log
(y) y