statistics south africa · johannesburg and ekurhuleni metropolitan ... a broad plan on how human...
TRANSCRIPT

Statistics South Africa Private Bag X44
Pretoria 0001 South Africa
ISIbalo House, Koch street, Salvokop Pretoria 0002
User information services: (012) 310 8600 Fax: (012) 310 8500
Main switchboard: (012) 310 8911 Fax: (012) 321 7381
Website: www.statssa.gov.za Email: [email protected]

i
Editor’s comment
Severe thunderstorms resulting in heavy rainfall and flash flooding have hit parts of Gauteng since 9 November 2016. According to South African Weather Services (SAWS), areas that were mostly affected were the City of Johannesburg and Ekurhuleni Metropolitan municipalities. The flash flooding (a sudden flood in a low-lying area commonly caused by periods of heavy rainfall) has resulted in loss of lives, and cars being submerged or swept away at major roads such as the R24, N3 and N2. The heavy rains also caused damage to property at private homes and in places such as OR Tambo International Airport, where some flights were either diverted or delayed. To stay safe during a flood, citizens are urged to avoid crossing rivers, swimming or driving through fast-moving flood water and should abandon their vehicles if they stall after heavy rainfall.
In this month’s issue of Mbalo Brief, our educational article is based on the Housing findings, which were derived from the 2016 Community Survey (CS) results. The findings focus on distribution of households, types of dwellings and occupation status between Census 1996 and CS 2016. Also have a look at our monthly crossword puzzle and solutions for the October 2016 puzzle.
Also included in this issue are our monthly articles such as Consumer price index, Retail trade sales, Mining: Production and sales and Food and beverages.
Articles published in this issue are based on results of industry surveys conducted for the months ranging from July to September 2016 which were published by Stats SA in September and October 2016.
For more details on any of the surveys, visit our website at: www.statssa.gov.za
Enjoy the read.

iii
CONTENTS
Editor’s comment .......................................................................................... ii Crossword puzzle .........................................................................................iv Educational article on housing…………………......…………………………1 Primary industries ......................................................................................... 7
Mining: Production and sales ...................................................................... 7
Secondary industries .................................................................................... 9
Manufacturing: Production and sales .......................................................... 9
Selected building statistics of the private sector .......................................10
Electricity generated and available for distribution ...................................12
Tertiary industries .......................................................................................14
Wholesale trade sales ...............................................................................14
Retail trade sales ......................................................................................15
Motor trade sales ......................................................................................16
Food and beverages .................................................................................17
Tourist accommodation .............................................................................18
Tourism and migration ..............................................................................20
Statistics of civil cases for debt .................................................................24
Statistics of liquidations and insolvencies .................................................25
Land transport survey ...............................................................................27
Prices ............................................................................................................29
Producer price index .................................................................................29
Consumer price index ...............................................................................32
Glossary .......................................................................................................34

iv
Crossword puzzle

v
Across
4. Who is the Executive Mayor ofNelson Mandela MetropolitanMunicipality?
6. What is the name of the mobileapplication that enablespassengers to pay for their taxifare using the airtime on theircellphones? Read Land transport survey
7. According to Community Survey(CS), which province is thesmallest and most populous inSouth Africa? Read educationalarticle for clue
8. Who is the MEC for Education inGauteng?
Down
1. Who is the newly elected presidentof United States?
2. What is the name of the anti-electricity theft campaign launchedby Eskom? Read Electricitygenerated and available fordistribution article
3. Which African country has recentlynotified United Nations that it iswithdrawing from InternationalCriminal Court?
5. According to the CommunitySurvey (CS) 2016, which provincehas the largest number ofhouseholds living in RDP or state-subsidised houses? Readeducational article for clue
Solutions for October 2016 puzzle
Across Down
1. True 1. Transport2. Salvokop 3. Mkhwebane4. Springbok 6. White5. Gauteng7. Jeff Radebe

1
Educational article on housing 1. Introduction Housing is considered one of the basic needs and a human right, this is according to section 26 of the Constitution of the Republic of South Africa,1996, which states that “everyone has a right to have access to adequate housing” that people not only need food and clothes to survive, they also need a house as a form of shelter. Parliament of South Africa therefore recognises housing as adequate shelter that fulfils a basic human need. In-line with the constitutional terms, the Housing Act, 1997 (Act No.107 of 1997) stipulates that government should provide houses to those in need and protect and prohibit evictions of persons from their homes. In addition to the Housing Act, the government implemented strategies and policies that support the Act and meet the housing demands through the National Development Plan (NDP), which is one of the policies by government that further outlines a broad plan on how human settlements are to be transformed by the year 2030, the different types of housing and how the state-subsidised houses should be allocated to meet the current and future demands. However, in order for the government to provide basic services and adequate housing, it needs to know the population size of the country, the number of households to be serviced, the different types of dwellings and their status of occupancy. This educational article will look into the distribution of housing services in South Africa using the Community Survey (CS) 2016 results. The CS 2016, which is conducted by Statistics South Africa (Stats SA) and is used to measure the progress of development in South Africa in terms of the living conditions of the country’s households in areas that include population structure, migration patterns, general health and functioning and parental survival, education, fertility, mortality and emigration and also household characteristics. However, for the purpose of this article, only housing, which falls under the CS household characteristics will be discussed. Other factors that will be discussed are population growth, distribution of households, types of dwelling and occupation status, and government interventions to address housing challenges faced by municipalities. 2. Population growth and distribution of households Population growth can have an impact on the distribution of housing services, this means the increase in the population size the higher the

2
demand it will have on the housing supply and distribution. According to the CS 2016, the population of South Africa has increased from 51,7 million in 2011 to 55,6 million in 2016. There are four distinct population groups in South Africa namely black African, coloured, Indian/Asian and white. According to the CS 2016, the largest population group is black African (44 891 603), followed by Coloured (4 869 526) and Indian/Asian (1 375 834), the white population group is the lowest group with a population of 4 516 691. Therefore due to differences in the number of population groups, the demand for housing is set to differ from one population group to the other. 2.1 Population distribution by province According to the CS 2016, Gauteng, the smallest province in the country, is the most populous, with a population of 13,4 million. This may be because majority of people consider the province as the hub of the country for economic activities, and it affords them better opportunities that improve their living standards. The province with the lowest population rate is Northern Cape with 1,2 million people, even though it is the largest province in terms of square kilometres (372 889). Number of population by province
2.2 Number of households by province Population growth may have an impact on the number of households to be serviced by the government. The government uses the CS results as one of the tools to determine how many households to be provided with houses for a given period, as well as knowing which provinces and municipalities have a high demand of basic services, including adequate housing. With the recent household figures from the CS 2016, the number of households in South Africa has increased from 14 450 161 in 2011 to 16 923 309 in 2016.

3
Table 1: Distribution of households per province according to Censuses 1996, 2001, 2011 and Community Survey 2016
Source: Statistics South Africa, Census 1996; Census 2001; Census 2011; CS 2016 Note: Number of households for censuses based on population in conventional housing units
Table 1 above shows the distribution of households by province between 1996 and 2016. In 2016 Gauteng has the largest number of households (4 951 137), followed by KwaZulu-Natal (2 875 843) and Western Cape (1 933 876). Free State (946 639) and Northern Cape (353 709) have the lowest number of households in 2016. Gauteng and KwaZulu-Natal have consistently over the years had the highest number of households. Gauteng had the highest percentage increase in the number of households between 2011 and 2016, increasing from 27,1% in 2011 to 29,3% in 2016. The Eastern Cape had the highest percentage decrease in households, from 11,7% in 2011 to 10,5% in 2016.
2.3 Distribution of households by type of main dwelling by province
The CS results show that in 2016, 13 404 199 (79,2%) of South African households live in formal dwellings , followed by 2 193 968 (13,0%) who live in informal houses, and 1 180 745 (7,0%) who live in traditional houses. Generally there has been a gradual increase in the number of households living in formal dwellings across all the provinces. The proportion of households living in traditional and informal dwellings has declined. The highest number of households in Gauteng live in formal dwellings (4 029 069), followed by KwaZulu-Natal (2 090 067). Gauteng also has the highest number of informal houses (878 246), followed by Western Cape (320 022). Northern Cape (45 246) is the province with the lowest informal houses. Although the highest number of formal and informal houses are found in Gauteng, it is worth noting that it is the most populous province as

4
compared with the other provinces. The highest number of households who live in traditional dwellings are found in KwaZulu-Natal (520 244). 4. Housing and occupation status Between the years 2001 and 2016 there has been an increase in the number of people that own and fully paid off their houses in South Africa. The proportion of households in the country who own and fully paid off their houses increased from 41,3% in 2001 to 54,7% in 2016. The proportion of households who own their houses but have not yet paid them off, declined from 15% in 2001 to 11% in 2016. There is a decline in the proportion of households living in houses that were rented, from 18,7% in 2001 to 18,4% in 2016. The percentage of households that occupy dwellings that are rent-free has decreased significantly from 25,0% in 2001, to 18,6% in 2011 and 9,8% in 2016. The percentage distribution of households by province and occupation status according to the CS 2016 shows that Limpopo has the highest proportion (65,4%) of households living in owned and fully paid off homes, followed by KwaZulu-Natal (62,5%) and Mpumalanga (62,5%). The leading provinces with the highest proportions of households living in rented dwellings are Gauteng (27,5%), followed by Western Cape with (19,3%) and these two provinces also have the highest proportions of households who live in houses that they own but not yet paid off 13,6% and 3,9% respectively. 5. Housing as one of the municipal challenges The CS 2016 introduced a question that asked households on the main challenges they are facing in the municipalities. The top five challenges that households are faced with were: • lack of a safe and reliable water supply; • lack of or inadequate employment opportunities; • the cost of electricity; • inadequate housing; and • violence and crime. Inadequate housing is one of the notable leading five challenges that households are faced with at the municipal level, across South Africa. However, the perceived challenges in municipalities differ hugely by province. According to CS 2016 results, Limpopo, North West and
5
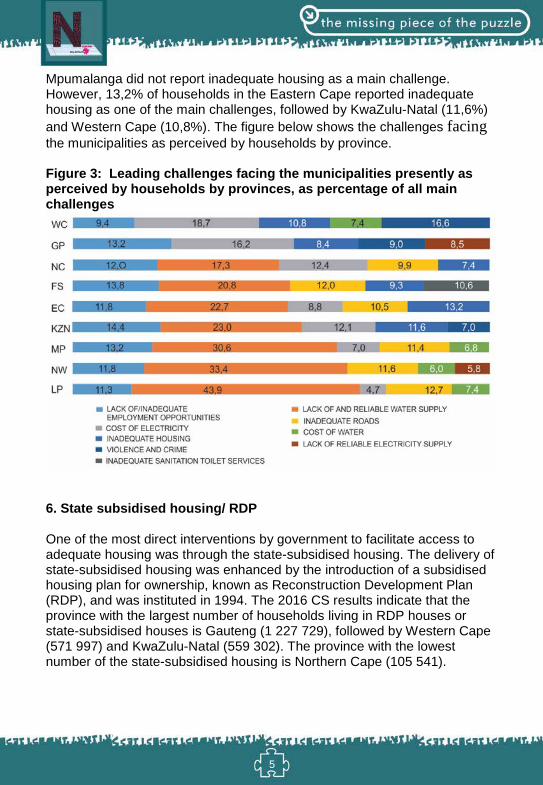
Mpumalanga did not report inadequate housing as a main challenge. However, 13,2% of households in the Eastern Cape reported inadequate housing as one of the main challenges, followed by KwaZulu-Natal (11,6%) and Western Cape (10,8%). The figure below shows the challenges facing the municipalities as perceived by households by province.
Figure 3: Leading challenges facing the municipalities presently as perceived by households by provinces, as percentage of all main challenges
6. State subsidised housing/ RDP
One of the most direct interventions by government to facilitate access to adequate housing was through the state-subsidised housing. The delivery of state-subsidised housing was enhanced by the introduction of a subsidised housing plan for ownership, known as Reconstruction Development Plan (RDP), and was instituted in 1994. The 2016 CS results indicate that the province with the largest number of households living in RDP houses or state-subsidised houses is Gauteng (1 227 729), followed by Western Cape (571 997) and KwaZulu-Natal (559 302). The province with the lowest number of the state-subsidised housing is Northern Cape (105 541).
6
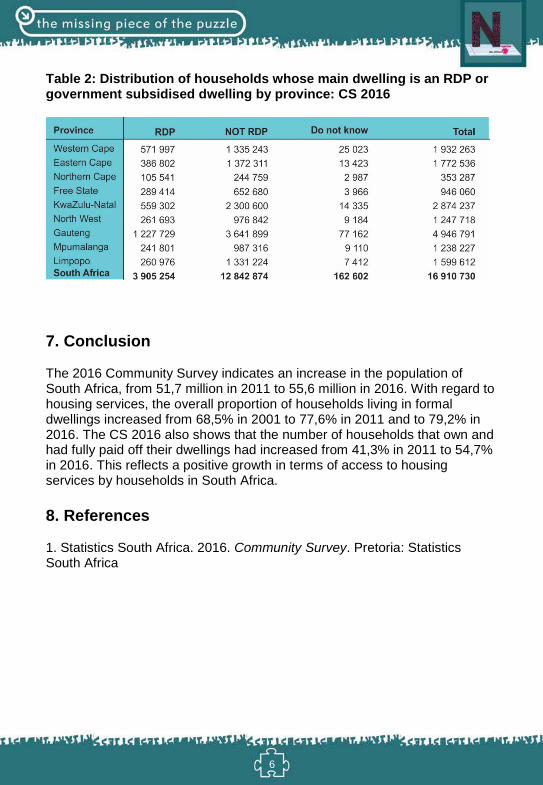
Table 2: Distribution of households whose main dwelling is an RDP or government subsidised dwelling by province: CS 2016
7. Conclusion
The 2016 Community Survey indicates an increase in the population of South Africa, from 51,7 million in 2011 to 55,6 million in 2016. With regard to housing services, the overall proportion of households living in formal dwellings increased from 68,5% in 2001 to 77,6% in 2011 and to 79,2% in 2016. The CS 2016 also shows that the number of households that own and had fully paid off their dwellings had increased from 41,3% in 2011 to 54,7% in 2016. This reflects a positive growth in terms of access to housing services by households in South Africa.
8. References
1. Statistics South Africa. 2016. Community Survey. Pretoria: StatisticsSouth Africa

7
Primary industries
Mining: Production and sales
Mining production and mineral sales decrease
South Africa is one of the leading mineral producers in the world and has resorted to look at beneficiation to find new uses of the mineral products. In July 2016, the Cabinet approved the proposal to designate Musina-Makhado Special Economic Zone (SEZ) which will focus on mineral beneficiation. Mineral beneficiation entails transformation of a mineral (or a combination of minerals) to a higher value product, which can either be consumed locally or exported. Some of the minerals such as chrome, manganese, coal and lime will be extracted at Musina-Makhado SEZ. The SEZ will come with several benefits such as job creation, and investors will have the advantage of getting a tax rate of 15% as opposed to the 28% that is currently on offer. Presented in this article is the mining production and sales for August 2016.
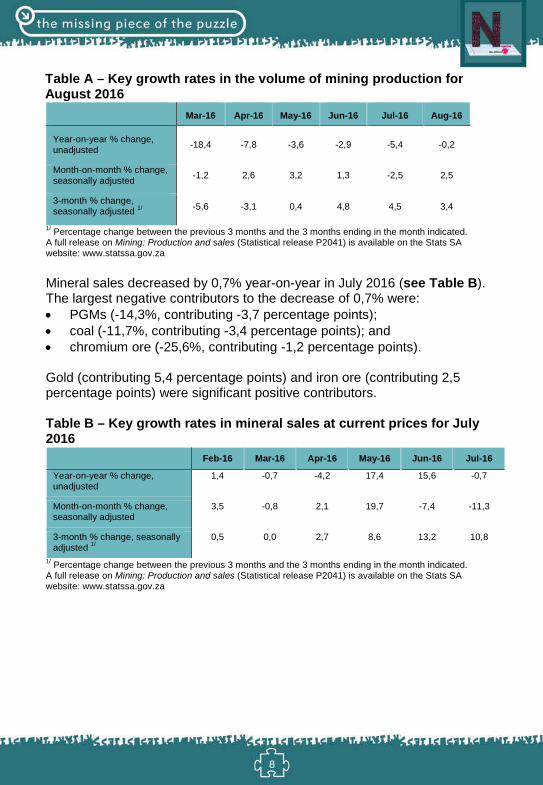
Mining production decreased by 0,2% year-on-year in August 2016 (see Table A). The main negative contributors were: • gold (-8,2%, contributing -1,0 percentage point);• manganese ore (-13,7%, contributing -0,9 of a percentage point);• nickel (-20,6%, contributing -0,6 of a percentage point); and• ‘other’ non-metallic minerals (-17,3%, contributing -0,6 of a percentage
point).
Iron ore was a significant positive contributor (19,0%, contributing 3,0 percentage points).
8
Table A – Key growth rates in the volume of mining production for August 2016
Mar-16 Apr-16 May-16 Jun-16 Jul-16 Aug-16
Year-on-year % change, unadjusted -18,4 -7,8 -3,6 -2,9 -5,4 -0,2
Month-on-month % change, seasonally adjusted -1,2 2,6 3,2 1,3 -2,5 2,5
3-month % change, seasonally adjusted 1/ -5,6 -3,1 0,4 4,8 4,5 3,4
1/ Percentage change between the previous 3 months and the 3 months ending in the month indicated. A full release on Mining: Production and sales (Statistical release P2041) is available on the Stats SA website: www.statssa.gov.za
Mineral sales decreased by 0,7% year-on-year in July 2016 (see Table B). The largest negative contributors to the decrease of 0,7% were: • PGMs (-14,3%, contributing -3,7 percentage points);• coal (-11,7%, contributing -3,4 percentage points); and• chromium ore (-25,6%, contributing -1,2 percentage points).
Gold (contributing 5,4 percentage points) and iron ore (contributing 2,5 percentage points) were significant positive contributors.
Table B – Key growth rates in mineral sales at current prices for July 2016
Feb-16 Mar-16 Apr-16 May-16 Jun-16 Jul-16
Year-on-year % change, unadjusted
1,4 -0,7 -4,2 17,4 15,6 -0,7
Month-on-month % change, seasonally adjusted
3,5 -0,8 2,1 19,7 -7,4 -11,3
3-month % change, seasonally adjusted 1/
0,5 0,0 2,7 8,6 13,2 10,8
1/ Percentage change between the previous 3 months and the 3 months ending in the month indicated. A full release on Mining: Production and sales (Statistical release P2041) is available on the Stats SA website: www.statssa.gov.za

9
Secondary industries
Manufacturing: production and sales
Manufacturing production increases
The government is due to introduce the Environmental Tyre Levy on 1 February 2017. The purpose of this levy is to manage tyre waste, minimise impact on health of human beings and to encourage reuse, recycling and recovery of tyre waste. South Africa generates an estimated 108 million tonnes of waste each year and some manufacturers use toxic additives such as zinc, chromium, sulphur and cadmium that are harmful to humans. The tyre levy will apply to manufacturers of new tyres produced locally or imported into South Africa at a rate of R2,30 per kg. The revenue collection will be conducted by the South African Revenue Service (SARS) through the Customs and Excise Act, 1964 (Act No. 91 of 1964). Presented in this article is a summary of the manufacturing: production and sales statistics for August 2016.
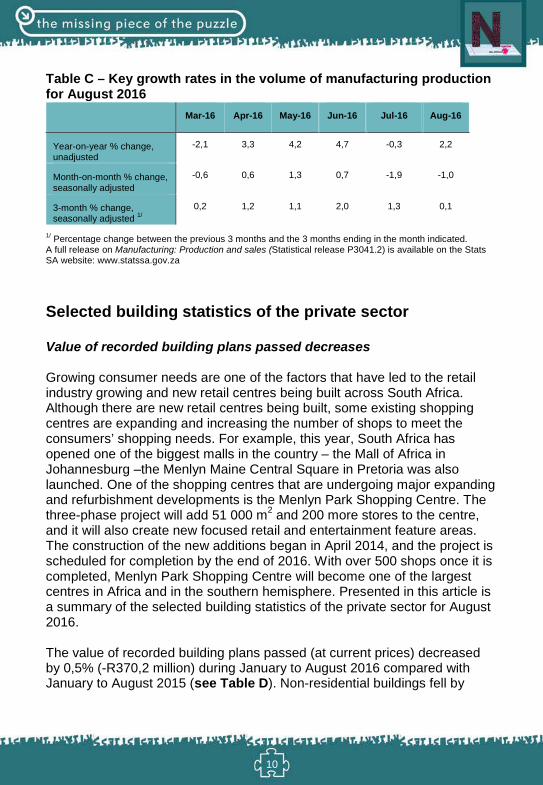
Manufacturing production increased by 2,2% in August 2016 compared with August 2015 (see Table C). This increase was mainly due to higher production in the following divisions: • petroleum, chemical products, rubber and plastic products (4,9%,
contributing 1,2 percentage points); • food and beverages (3,1%, contributing 0,8 of a percentage point); and• motor vehicles, parts and accessories and other transport equipment
(8,5%, contributing 0,6 of a percentage point).
10
Table C – Key growth rates in the volume of manufacturing production for August 2016
Mar-16 Apr-16 May-16 Jun-16 Jul-16 Aug-16
Year-on-year % change, unadjusted
-2,1 3,3 4,2 4,7 -0,3 2,2
Month-on-month % change, seasonally adjusted
-0,6 0,6 1,3 0,7 -1,9 -1,0
3-month % change, seasonally adjusted 1/
0,2 1,2 1,1 2,0 1,3 0,1
1/ Percentage change between the previous 3 months and the 3 months ending in the month indicated. A full release on Manufacturing: Production and sales (Statistical release P3041.2) is available on the Stats SA website: www.statssa.gov.za
Selected building statistics of the private sector
Value of recorded building plans passed decreases
Growing consumer needs are one of the factors that have led to the retail industry growing and new retail centres being built across South Africa. Although there are new retail centres being built, some existing shopping centres are expanding and increasing the number of shops to meet the consumers’ shopping needs. For example, this year, South Africa has opened one of the biggest malls in the country – the Mall of Africa in Johannesburg –the Menlyn Maine Central Square in Pretoria was also launched. One of the shopping centres that are undergoing major expanding and refurbishment developments is the Menlyn Park Shopping Centre. The three-phase project will add 51 000 m2 and 200 more stores to the centre, and it will also create new focused retail and entertainment feature areas. The construction of the new additions began in April 2014, and the project is scheduled for completion by the end of 2016. With over 500 shops once it is completed, Menlyn Park Shopping Centre will become one of the largest centres in Africa and in the southern hemisphere. Presented in this article is a summary of the selected building statistics of the private sector for August 2016.
The value of recorded building plans passed (at current prices) decreased by 0,5% (-R370,2 million) during January to August 2016 compared with January to August 2015 (see Table D). Non-residential buildings fell by

11
7,6% (-R1 381,1 million), while residential buildings rose by 3,4% (R1 131,9 million).
Six provinces reported decreases for January to August 2016 compared with January to August 2015. The largest negative contribution to the total decrease of 0,5% (-R370,2 million) was made by Gauteng (contributing -1,8 percentage points or -R1 226,3 million). The largest positive contribution was made by KwaZulu-Natal (contributing 2,3 percentage points or R1 550,9 million).
The value of buildings reported as completed (at current prices) increased by 10,2% (R3 552,6 million) during January to August 2016 compared with January to August 2015. Non-residential buildings rose by 39,0% (R3 096,7 million). There were large year-on-year increases in completions of non-residential buildings in KwaZulu-Natal (R2 006,1 million) and Gauteng (R1 479,3 million).
Six provinces reported year-on-year increases in the value of buildings completed during January to August 2016. The largest contributions were recorded for: • KwaZulu-Natal (contributing 4,9 percentage points or R1 713,0 million);
and • Gauteng (contributing 4,7 percentage points or R1 622,5 million).

12
Table D – Recorded building plans passed by larger municipalities: January to August 2015 versus January to August 2016
Estimates at current prices
January to August
2015 1/
January to August
2016 1/
Difference in value
between January to
August 2015 and January
to August 2016
% change between
January to August 2015
and January to
August 2016
R'000 R'000 R'000
Residential buildings 33 114 117 34 246 027 1 131 910 3,4
-Dwelling houses 22 314 446 21 722 217 -592 229 -2,7
-Flats and townhouses 10 047 306 11 262 544 1 215 238 12,1 -Other residential buildings 752 365 1 261 266 508 901 67,6
Non-residential buildings 18 219 333 16 838 236 -1 381 097 -7,6
Additions and alterations 17 569 134 17 448 146 -120 988 -0,7
Total 68 902 584 68 532 409 -370 175 -0,5
1/ 2015 and 2016 figures should be regarded as preliminary because of possible backlogs and incomplete reporting by municipalities. A full release on Selected building statistics of the private sector as reported by local government institutions (Statistical release P5041.1) is available on the Stats SA website: www.statssa.gov.za
Electricity generated and available for distribution
Electricity production increases while consumption decreases
Electricity plays a key role in keeping homes and businesses functioning effectively. However, electricity theft like illegal connections, cable theft and buying or selling of illegal prepaid vouchers can contribute to power outages and may also lead to consequences such as business closure or job losses and fatalities when electrical equipment shuts down due to lack of power. In order to fight against electricity theft and promote legal, safe and efficient usage, Eskom launched an anti-electricity theft campaign in October 2010 called Operation Khanyisa, and it is still continuing. The campaign has been working closely with the South African Police Service (SAPS), the Hawks and the National Prosecuting Authority (NPA) to investigate electricity theft and hold those involved accountable. Since Operation Khanyisa was launched, the campaign has helped reduce Eskom’s non-technical losses
13
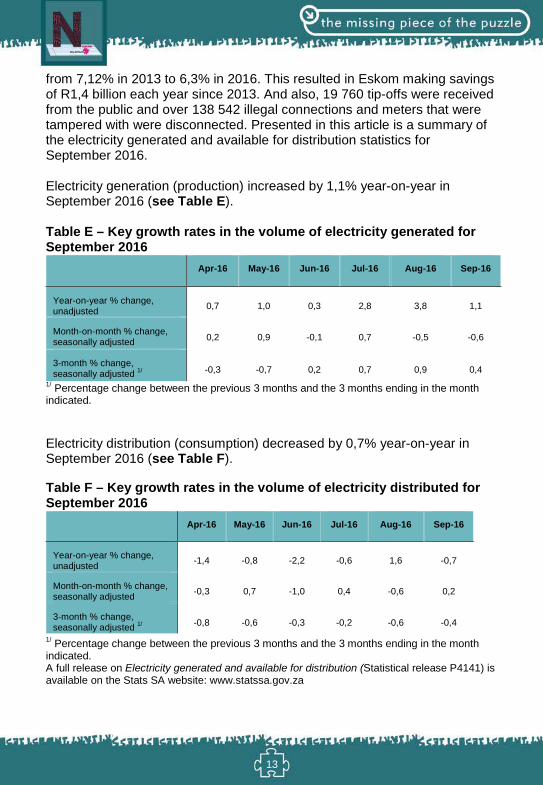
from 7,12% in 2013 to 6,3% in 2016. This resulted in Eskom making savings of R1,4 billion each year since 2013. And also, 19 760 tip-offs were received from the public and over 138 542 illegal connections and meters that were tampered with were disconnected. Presented in this article is a summary of the electricity generated and available for distribution statistics for September 2016.
Electricity generation (production) increased by 1,1% year-on-year in September 2016 (see Table E).
Table E – Key growth rates in the volume of electricity generated for September 2016
Apr-16 May-16 Jun-16 Jul-16 Aug-16 Sep-16
Year-on-year % change, unadjusted 0,7 1,0 0,3 2,8 3,8 1,1
Month-on-month % change, seasonally adjusted 0,2 0,9 -0,1 0,7 -0,5 -0,6
3-month % change, seasonally adjusted 1/ -0,3 -0,7 0,2 0,7 0,9 0,4
1/ Percentage change between the previous 3 months and the 3 months ending in the month indicated.
Electricity distribution (consumption) decreased by 0,7% year-on-year in September 2016 (see Table F).
Table F – Key growth rates in the volume of electricity distributed for September 2016
Apr-16 May-16 Jun-16 Jul-16 Aug-16 Sep-16
Year-on-year % change, unadjusted -1,4 -0,8 -2,2 -0,6 1,6 -0,7
Month-on-month % change, seasonally adjusted -0,3 0,7 -1,0 0,4 -0,6 0,2
3-month % change, seasonally adjusted 1/ -0,8 -0,6 -0,3 -0,2 -0,6 -0,4
1/ Percentage change between the previous 3 months and the 3 months ending in the month indicated. A full release on Electricity generated and available for distribution (Statistical release P4141) is available on the Stats SA website: www.statssa.gov.za
14
Tertiary industries
Wholesale trade sales
Wholesale trade sales increase
The festive season is around the corner and certain wholesalers are set to benefit from purchases made by stokvels. 'Stokvel' is an exclusive term, unique to South Africa, which refers to a group of people who collectively contribute money on a monthly basis with the purpose of saving. The money contributed by stokvel members is used to purchase goods in bulks and divide them amongst themselves, making the goods more affordable than if they had been purchased by an individual. Some wholesalers work closely with stokvels to get the best possible deals by hosting regular meetings to gain a thorough understanding of what members of the stokvels want and how stores can deliver the right value at the best possible price. Wholesalers also use their buying and procurement expertise to negotiate great deals with suppliers or manufacturers on behalf of stokvels. This helps stokvels to get as many high quality goods as possible at an affordable price, and also benefits wholesalers as they sell a higher volume of goods than they otherwise would do. Presented in this article is a summary of the wholesale trade sales statistics for August 2016.
Wholesale trade sales increased by 11,0% in August 2016 compared with August 2015 (see Table G). The main contributors to this increase were dealers in agricultural raw materials and livestock (79,3%, contributing 4,1 percentage points) and food, beverages and tobacco (18,0%, contributing 2,8 percentage points).
Wholesale trade sales increased by 8,0% in the three months ended August 2016 compared with the three months ended August 2015. The main contributors to this increase were dealers in: agricultural raw materials and livestock (80,9%, contributing 4,2 percentage points); and machinery, equipment and supplies (16,4%, contributing 2,2 percentage points).

15
Table G – Key growth rates in wholesale trade sales at current prices for August 2016
Mar-16 Apr-16 May-16 Jun-16 Jul-16 Aug-16
Year-on-year % change, unadjusted
4,4 11,6 11,5 8,0 5,3 11,0
Month-on-month % change, seasonally adjusted
-1,1 -0,9 2,2 -0,2 2,0 -2,9
3-month % change, seasonally adjusted1/
5,8 4,8 2,4 0,8 1,7 1,3
1/ Percentage change between the previous 3 months and the 3 months ending in the month indicated. A full release on Wholesale trade sales (P6141.2) is available on the Stats SA website: www.statssa.gov.za
Retail trade sales Retail trade sales increase The South African retail industry has changed dramatically over the last decade. The country has seen an improvement in road networks for instance, which benefited the retail industry by facilitating an efficient distribution of goods to most areas of the country, including townships and rural areas. An increase in urbanisation and the increase in the middle class market have resulted in an increased number of malls being constructed across the country. This has resulted not only in an increase in the number of retailers in the country but also a more intensified competition among many retailers such as grocery retailers. This competition will benefit consumers because it will affect pricing, quality, access and choice of products and services. Presented in this article is a summary of the retail trade sales statistics for August 2016. Retail trade sales increased by 0,2% year-on-year in August 2016 (see Table H). Positive annual growth rates were recorded for: • retailers in pharmaceuticals and medical goods, cosmetics and toiletries
(6,6%); • retailers in food, beverages and tobacco in specialised stores (2,6%); • retailers in hardware, paint and glass (1,4%); and • general dealers (1,2%). The main contributors to the 0,2% increase were general dealers (contributing 0,5 of a percentage point) and retailers in pharmaceuticals and

16
medical goods, cosmetics and toiletries (contributing 0,5 of a percentage point). Retail trade sales increased by 0,9% in the three months ended August 2016 compared with the three months ended August 2015. The main contributors to this increase were general dealers (1,5%, contributing 0,7 of a percentage point); and retailers in pharmaceuticals and medical goods, cosmetics and toiletries (7,4%, contributing 0,6 of a percentage point).
Table H – Key growth rates in retail trade sales for August 2016 – at constant 2012 prices
Mar-16 Apr-16 May-16 Jun-16 Jul-16 Aug-16
Year-on-year % change, unadjusted
2,6 1,6 3,7 1,4 1,2 0,2
Month-on-month % change, seasonally adjusted
0,2 -1,4 2,9 -1,9 -0,2 0,3
3-month % change, seasonally adjusted 1/
-0,1 -0,6 0,1 0,1 0,6 -0,6
1/ Percentage change between the previous 3 months and the 3 months ending in the month indicated. A full release on Retail trade sales (Statistical release P6242.1) is available on the Stats SA website: www.statssa.gov.za
Motor trade sales Motor trade sales decrease Motor traders run businesses which involve selling, buying, repairing and servicing of motor vehicles. Like motor vehicle owners, the motor traders should also insure their businesses with motor trader insurance. Motor trader insurance covers damages to and theft of vehicles that form part of the motor trader’s stock or clients’ vehicles while still in the possession of the motor trader. It is therefore advisable for the motor traders to be covered under such insurance policy so that, in the event of any of these incidents occurring, they would not have to be liable for the payments as that can be costly. Presented in this article is a summary of the motor trade sales for August 2016. Motor trade sales increased by 4,1% year-on-year in August 2016 (see Table I). The largest annual growth rates were recorded for: • used vehicle sales (13,7%);

17
• new vehicle sales (12,7%); and• workshop income (11,8%).
Motor trade sales increased by 0,9% in the three months ended August 2016 compared with the three months ended August 2015. The main positive contributors to this increase were used vehicle sales (9,4%, contributing 1,7 percentage points) and sales of accessories (8,4%, contributing 1,5 percentage points).
Table I – Key growth rate figures in motor trade sales for August 2016
Mar-16 Apr-16 May-16 Jun-16 Jul-16 Aug-16
Year-on-year % change, unadjusted -3,9 7,6 6,8 0,2 -1,4 4,1
Month-on-month % change, seasonally adjusted -2,8 3,7 0,3 -3,0 2,1 -3,7
3-month % change, seasonally adjusted 1/ -0,2 1,8 1,5 2,3 0,4 -1,5
1/ Percentage change between the previous 3 months and the 3 months ending in the month indicated. A full release on Motor trade sales (Statistical release P6343.2) is available on the Stats SA website: www.statssa.gov.za
Food and beverages
Total income generated by food and beverage industry decreases
Amongst other beverages, the coffee market is the fastest growing in South Africa, as more people consume more of it. However, the use of beverage cups plays a major role in the pollution of the environment when thrown everywhere. Some of these cups end up in landfills and are unable to decompose, thus contributing to climate warning. In order to curb the waste epidemic and promote eco-friendly products, Ecoffee Cup, a South African brand, launched reusable and recyclable takeaway cups on 15 August 2016. The benefits of using these eco-friendly cups are that they minimise carbon footprint, and consumers will also save money by using them to refill their beverages. Presented in this article is a summary of the food and beverages statistics for August 2016.

18
The total income generated by the food and beverages industry decreased by 1,8% in August 2016 compared with August 2015 (see Table J). The largest negative growth rates were recorded for ‘other’ income (-9,4%) and bar sales (-8,8%).
In August 2016, negative annual growth rates were recorded for restaurants and coffee shops (-6,8%, contributing -2,8 percentage points) and catering services (-3,1%, contributing -0,5 of a percentage point).
Total income increased by 0,6% in the three months ended August 2016 compared with the three months ended August 2015. Takeaway and fast-food outlets grew by 6,1% and contributed 2,5 percentage points.
Table J – Year-on-year percentage change in food and beverages income at constant prices by type of income – August 2016
Type of income Mar-16 Apr-16 May-16 Jun-16 Jul-16 Aug-16
Food sales 1,5 0,1 1,6 3,5 2,5 -0,4
Bar sales -0,1 -3,8 -1,8 -2,2 -0,8 -8,8
Other income -12,8 -17,0 -15,1 -16,3 -10,3 -9,4
Total 0,8 -0,9 0,7 2,2 1,7 -1,8
A full release on Food and beverages (Statistical release P6420) is available on the Stats SA website: www.statssa.gov.za
Tourist accommodation
Total income for the tourist accommodation industry increased
Tourist accommodation is an integral part of the total tourism product. Lack of suitable and sufficient accommodation may be a deterrent to tourists who wish to visit their destinations. To ensure that tourists have sufficient accommodation, Marriott International, a hotel and leisure company, announced on 6 October 2016 that it plans to construct five new hotels in South Africa (three in Cape Town and two in Johannesburg). The company will spend R3 billion and the construction of the hotels is expected to create 8 000 jobs while under construction, and over 700 long-term hospitality jobs.
19
This will have a positive impact on the economy of the country. Presented in this article is a summary of the tourist accommodation statistics for August 2016.
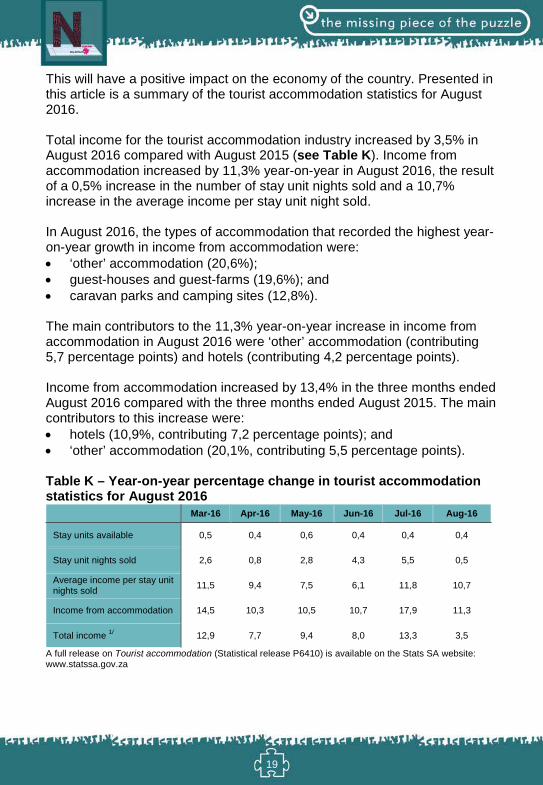
Total income for the tourist accommodation industry increased by 3,5% in August 2016 compared with August 2015 (see Table K). Income from accommodation increased by 11,3% year-on-year in August 2016, the result of a 0,5% increase in the number of stay unit nights sold and a 10,7% increase in the average income per stay unit night sold.
In August 2016, the types of accommodation that recorded the highest year-on-year growth in income from accommodation were: • ‘other’ accommodation (20,6%);• guest-houses and guest-farms (19,6%); and• caravan parks and camping sites (12,8%).
The main contributors to the 11,3% year-on-year increase in income from accommodation in August 2016 were ‘other’ accommodation (contributing 5,7 percentage points) and hotels (contributing 4,2 percentage points).
Income from accommodation increased by 13,4% in the three months ended August 2016 compared with the three months ended August 2015. The main contributors to this increase were: • hotels (10,9%, contributing 7,2 percentage points); and• ‘other’ accommodation (20,1%, contributing 5,5 percentage points).
Table K – Year-on-year percentage change in tourist accommodation statistics for August 2016
Mar-16 Apr-16 May-16 Jun-16 Jul-16 Aug-16
Stay units available 0,5 0,4 0,6 0,4 0,4 0,4
Stay unit nights sold 2,6 0,8 2,8 4,3 5,5 0,5
Average income per stay unit nights sold 11,5 9,4 7,5 6,1 11,8 10,7
Income from accommodation 14,5 10,3 10,5 10,7 17,9 11,3
Total income 1/ 12,9 7,7 9,4 8,0 13,3 3,5
A full release on Tourist accommodation (Statistical release P6410) is available on the Stats SA website: www.statssa.gov.za

20
Tourism and migration in South Africa
Volume of arrivals and departures increases for foreign travellers
A total of 13 246 people were denied boarding flights to South Africa between June 2015 and July 2016. This is according to what the Tourism Business Council of South Africa (TBCSA) presented in the Portfolio Committee on Tourism meeting in Parliament on 28 October 2016. These travellers were denied boarding because of the unabridged birth certificate regulations that came into effect on 1 July 2015. Under this regulation, all minors under the age of 18 years were required to produce, in addition to their passport, an Unabridged Birth Certificate (showing the particulars of both parents) when exiting and entering South African ports of entry. As a result of this regulation, the country has lost the revenue that would have been received from the people who were denied boarding. Although the regulation has been reviewed and is no longer in effect, this shows that the Department of Home Affairs’ regulations on migration can affect the tourism industry, and ultimately the economy of the country. Presented in this article is a summary of the Tourism and migration statistics for August 216.
Number of travellers
The routine data collected by the Department of Home Affairs’ (DHA) immigration officers at the ports of entry into South Africa show that a total of 3 497 070 travellers (arrivals, departures and transits) passed through South African ports of entry in August 2016 (see Table L). These travellers were made up of 899 322 South African residents and 2 597 748 foreign travellers. A further breakdown of the figures for South African residents indicates that there were 436 996 arrivals, 461 320 departures and 1 006 travellers in transit. The corresponding volume for foreign arrivals, departures and transit travellers was 1 323 775, 1 181 138 and 92 835, respectively. A comparison between the movements in August 2015 and August 2016 indicates that the volume of arrivals and departures decreased for South African residents but increased for foreign travellers, while the volume of transits increased for South African residents but decreased for foreign travellers.
For South African residents, the volume of arrivals decreased by 3,3% (from 451 785 in August 2015 to 436 996 in August 2016), departures decreased by 1,2% (from 466 951 in August 2015 to 461 320 in August 2016), and transits increased by 5,1% (from 957 in August 2015 to 1 006 in August
21
2016). For foreign travellers, arrivals increased by 8, 6% (from 1 219 410 in August 2015 to 1 323 775 in August 2016), departures increased by 3,8% (from 1 138 025 in August 2015 to 1 181 138 in August 2016), and transits decreased by 4,1% (from 96 847 in August 2015 to 92 835 in August 2016). A comparison between the movements in July 2016 and August 2016 indicates that the volume of arrivals and departures decreased for South African residents but increased for foreign travellers, while the volume of transits increased for both groups of travellers. For South African residents, the volume of arrivals decreased by 19,6% (from 543 725 in July 2016 to 436 996 in August 2016), departures decreased by 1,4% (from 467 673 in July 2016 to 461 320 in August 2016) and transits increased by 14,3% (from 880 in July 2016 to 1 006 in August 2016). For foreign travellers, the volume of arrivals increased by 0,3% (from 1 319 955 in July 2016 to 1 323 755 in August 2016), departures increased by 3,1% (from 1 145 550 in July 2016 to 1 181 138 in August 2016), and transits increased by 12,8% (from 82 331 in July 2016 to 92 835 in August 2016). Mode of travel In August 2016, road transport was the most common mode of travel used by 2 502 214 (71,6%) of the 3 497 070 travellers. The total number of travellers who used air transport was 987 275 (28,2%). Compared to use of air and land transport, a smaller number of travellers (7 581 or 0,2%) used sea transport. The arrivals data for South African residents show that 154 605 (35,4%) came by air, 282 252 (64,6%) came by road and 139 (less than 0,1%) arrived by sea. For departures, 175 358 (38,0%) used air, 285 657 (61,9%) used road and 305 (0,1%) left by sea transport. All travellers in transit (1 006) used air transport. Purpose of visit In August 2016, the majority of tourists (805 654 or 96,6%) were in South Africa for holiday compared to 21 659 (2,6%) and 6 325 (0,8%) who were in South Africa for business and for study purposes, respectively. A detailed analysis reveals that of all the tourists from each of the overseas regions, more than 90,0% came to South Africa for a holiday. The majority of African tourists (609 266 or 96,8%) came to South Africa for a holiday. However, there were differences between tourists from the SADC countries and 'other' African countries, namely:

22
• Whereas 593 418 (97,0%) of tourists from the SADC countries were on holiday; 15 848 (90,7%) of tourists from 'other' African countries came for the same purpose. Data on the regions of 'other' African countries show that tourists on holiday constituted 93,2% (8 569); 89,4% (6 219); and 80,5% (1 060) for West Africa, East and Central Africa and North Africa, respectively. • Business persons constituted 5,1% (885) of tourists from 'other' African countries and 2,4% (14 387) from the SADC countries. North Africa had the highest proportion, 12,5% (164) of its tourists who came to South Africa for business purposes. • Students made up 4,2% (738) of tourists from 'other' African countries compared with 0,7% (4 072) from the SADC countries. North Africa had the highest proportion (7,0% or 92) of its tourists who came to South Africa for study purposes. Sex and age distribution In August 2016, there were 457 414 (54,9%) male and 376 224 (45,1%) female tourists. Overseas tourists were made up of 108 490 (53,3%) male tourists and 94 931 (46,7%) female tourists. There were 337 712 (55,2%) male and 274 165 (44,8%) female tourists from the SADC countries. Tourists from 'other' African countries were made up of 10 703 (61,3%) male and 6 768 (38,7%) female tourists. The ages of the tourists were categorised into three broad groups: Those younger than 15 years, 15 to 64 years, and 65 years and older. The overall results presented show that 61 550 (7,4%) tourists were aged less than 15 years; 738 527 (88,6%) were aged between 15 and 64 years; and 33 561 (4,0%) were aged 65 years and older.

23
Table L – Number of South African residents and foreign travellers by travel direction: August 2016
Travel direction August
2015 July 2016 August 2016
% change between July and
August 2016
% change between
August 2015 and August
2016
Total 3 373 975 3 560 114 3 497 070 -1,8% 3,6%
South African residents 919 693 1 012 278 899 322 -11,2% -2,2%
Arrivals 451 785 543 725 436 996 -19,6% -3,3%
Departures 466 951 467 673 461 320 -1,4% -1,2%
Transit 957 880 1 006 14,3% 5,1%
Foreign travellers 2 454 282 2 547 836 2 597 748 2,0% 5,8%
Arrivals 1 219 410 1 319 955 1 323 775 0,3% 8,6%
Departures 1 138 025 1 145 550 1 181 138 3,1% 3,8%
Transit 96 847 82 331 92 835 12,8% -4,1%
Foreign arrivals 1 219 410 1 319 955 1 323 775 0,3% 8,6% Non-visitors 97 541 86 078 89 276 3,7% -8,5%
Visitors 1 121 869 1 233 877 1 234 499 0,1% 10,0%
Visitors 1 121 869 1 233 877 1 234 499 0,1% 10,0%
Arrivals only 255 265 305 522 302 421 -1,0% 18,5%
Single trips 445 500 421 228 434 658 3,2% -2,4%
Multiple trips 421 104 507 127 497 420 -1,9% 18,1%
Visitors 1 121 869 1 233 877 1 234 499 0,1% 10,0%
Same-day 390 621 411 461 400 861 -2,6% 2,6%
Tourists 731 248 822 416 833 638 1,4% 14,0%
A full release on Tourism and migration (Statistical release P0351) is available on the Stats SA website: www.statssa.gov.za

24
Statistics on civil cases for debt
Total number of civil summonses and judgements issued for debt decreases
On 18 October 2016, the Department of Trade and Industry (DTI) said in Parliament that legislative measures to bring relief to deeply indebted consumers in South Africa are in the pipeline. These measures include extending the powers of the National Credit Regulator (NCR) to conduct proactive investigations and impose administrative fines on perpetrators. This means that should any credit provider, such as micro lenders, retailers and the four big banks, lend money to over-indebted consumers, these loans may be written off and criminal steps taken against the directors of these companies. The department also believes that the act should make provision for the introduction of debt relief or debt forgiveness measures to alleviate over-indebtedness in specific economic circumstances. These measures are expected to reduce and possibly prevent over-indebtedness. Presented in this article is a summary of the civil cases for debt statistics for August 2016.
The total number of civil summonses issued for debt increased by 0,3% in the three months ended August 2016 compared with the three months ended August 2015 (see Table M). The largest positive contributions to the 0,3% increase were civil summonses relating to promissory notes (contributing 1,1 percentage points) and money lent (contributing 1,0 percentage point).
The total number of civil judgements recorded for debt decreased by 6,6% in the three months ended August 2016 compared with the three months ended August 2015. Negative contributions to the 6,6% decrease were civil judgements relating to: • money lent (contributing -2,8 percentage points);• services (contributing -1,6 percentage points);• promissory notes (contributing -1,4 percentage points); and• ‘other’ debts (contributing -1,4 percentage points).
The total value of civil judgements recorded for debt decreased by 14,4% in the three months ended August 2016 compared with the three months ended August 2015. Negative contributions to the 14,4% decrease were the value of judgements relating to: • ‘other’ debts (contributing -6,5 percentage points);

25
• promissory notes (contributing -3,6 percentage points);• money lent (contributing -3,5 percentage points); and• services (contributing -1,3 percentage points).
In August 2016, 22 960 civil judgements for debt amounting to R345,7 million were recorded. The largest contributors to the total value of judgements were: • money lent (R90,1 million or 26,1%);• ‘other’ debts (R83,6 million or 24,2%); and• services (R73,7 million or 21,3%).
Table M – Key figures for civil summonses and judgements for August 2016
Actual estimates August 2016
% change between
August 2015 and
August 2016
% change between June to August
2015 and
June to August 2016
Number of civil summonses issued for debt 55 226 5,8 0,3 Number of civil judgements recorded for debt 22 960 -5,5 -6,6 Value of civil judgements recorded for debt (R million) 345,7 -9,4 -14,4
A full release on Statistics of civil cases for debt (Statistical release P0041) is available on the Stats SA website: www.statssa.gov.za
Statistics of liquidations and insolvencies
Number of liquidations and insolvencies increase
Companies that are financially distressed or trade in insolvent circumstances and facing liquidation can file a notice to commence business rescue proceedings to facilitate their rehabilitation. However, business rescue proceedings are more suitable for some companies than others. The type of business a company is conducting will determine whether it is more suitable for business rescue or not. For instance, companies that are involved in retail might be more suitable for business rescue, as retail companies operate to generate income frequently (if not, they may be put under liquidation) than property companies, as assets can generate revenue when they increase in value. Presented in this article is a summary of the liquidations for September and insolvencies statistics for August 2016.

26
The total number of liquidations recorded increased by 15,4% (23 more cases) in September 2016 (see Table N) compared with September 2015. The largest year-on-year increases in total liquidations related to businesses in the following industries: • unclassified (35 more liquidations); and• financing, insurance, real estate and business services (14 more
liquidations).
Decreases were recorded for businesses in the community, social and personal services industry (25 fewer liquidations) and the trade, catering and accommodation industry (21 fewer liquidations). Liquidations increased by 4,3% in the third quarter of 2016 compared with the third quarter of 2015.
Table N – Total number of liquidations for September 2016
Number of liquidations
September 2016
% change between September 2015
and September 2016
% change between July to September 2015
and July to September 2016
% change between January to
September 2015 and
January to September 2016
172 15,4 4,3 -2,8
A full release on Statistics of liquidations and insolvencies (Statistical release P0043) is available on the Stats SA website: www.statssa.gov.za
The estimated number of insolvencies increased by 7,9% in August 2016 (See Table O). A 2,1% increase was estimated between the three months ended August 2015 and the three months ended August 2016. There was an increase of 2,9% in the first eight months of 2016 compared with the first eight months of 2015.
Table O – Total number of insolvencies for August 2016
Number of insolvencies August 2016
% change between August 2015
and August 2016
% change between June to August 2015
and June to August 2016
% change between January to August
2015 and
January to August 2016
233 7,9 2,1 2,9
A full release on Statistics of liquidations and insolvencies (Statistical release P0043) is available on the Stats SA website: www.statssa.gov.za
Land transport survey

27
Volume of goods transported increased
One challenge to passenger transportation in South Africa is the payment method used towards minibus taxis fare, which is commonly cash method only. Sometimes, passengers often find that they don’t have loose money to pay for their fare or they haven’t withdrawn the cash. As a result taxi drivers are often forced to stop at petrol filling stations to get change or ask for it from other taxi drivers, thus causing a delayed trip. Fortunately, some innovators and developers have come up with a mobile application (app) known as Mobi Moola. The app enables passengers to pay for their taxi fare using the airtime on their cellphones. Mobi Moola uses USSD devise (a short code used to access services via cellphones) and could be installed on smartphones or feature phones to wirelessly transfer payment to taxi operators, using airtime from any mobile operator. The taxi driver generates a Quick Response (QR) code which generates a USSD string as a confirmation that a payment has been made/received. Alternatively, a Quick Response (QR) code is placed on the side of a taxi and scanned, launching the payment system. This makes paying for taxis simpler and quicker. Presented in this article is a summary of the Land transport survey statistics for August 2016.
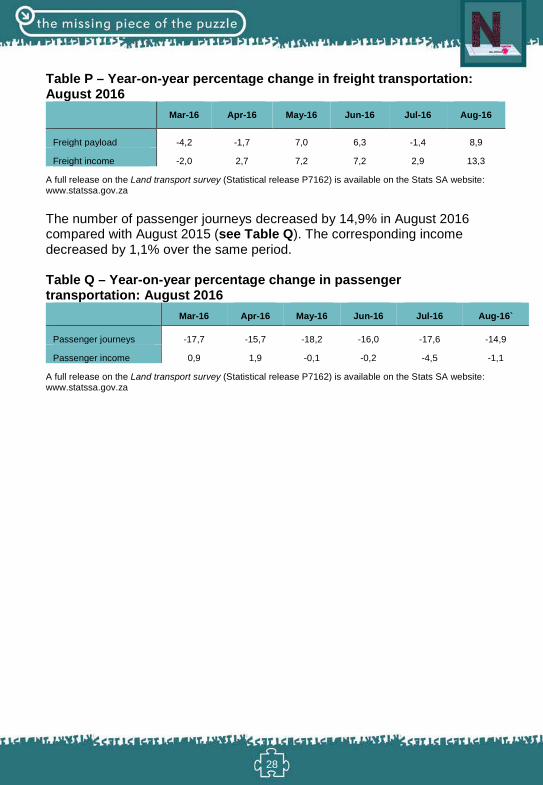
The volume of goods transported (payload) increased by 8,9% in August 2016 compared with August 2015 (see Table P). The corresponding income increased by 13,3% over the same period.
Income from freight transportation increased by 7,7% in the three months ended August 2016 compared with the three months ended August 2015. The main contributors to this increase were: primary mining and quarrying products (14,7%, contributing 4,9 percentage points) and manufactured food, beverages and tobacco products (31,8% and contributing 3,6 percentage points).
28
Table P – Year-on-year percentage change in freight transportation: August 2016
Mar-16 Apr-16 May-16 Jun-16 Jul-16 Aug-16
Freight payload -4,2 -1,7 7,0 6,3 -1,4 8,9
Freight income -2,0 2,7 7,2 7,2 2,9 13,3
A full release on the Land transport survey (Statistical release P7162) is available on the Stats SA website: www.statssa.gov.za
The number of passenger journeys decreased by 14,9% in August 2016 compared with August 2015 (see Table Q). The corresponding income decreased by 1,1% over the same period.
Table Q – Year-on-year percentage change in passenger transportation: August 2016
Mar-16 Apr-16 May-16 Jun-16 Jul-16 Aug-16`
Passenger journeys -17,7 -15,7 -18,2 -16,0 -17,6 -14,9
Passenger income 0,9 1,9 -0,1 -0,2 -4,5 -1,1
A full release on the Land transport survey (Statistical release P7162) is available on the Stats SA website: www.statssa.gov.za

29
Prices
Producer price index (PPI)
PPI at 6,6%
Water is one of the basic needs of life, and it is mostly used for drinking, irrigation, electricity, mining, and industrial processes. Water is one of the products that contribute to the country’s producer price index. The annual percentage change in the PPI for electricity and water was 11,2% in September 2016 compared with 11,5% in August 2016, with water contributing 2,9 percentage points to the 11,2%. In order to regulate the use of water, the National Water Act, 1998 (Act No.36 of 1998) allows the Department of Water and Sanitation (DWS) Minister, in concurrence with the Finance Minister, to establish a pricing strategy for charges of any water use including raw water and processed water. These pricing strategy regulates the pricing of water use from South Africa’s water resources. The DWS held its final national water tariff consultation meeting on 31 August 2016 to discuss the raw water tariff for 2017/18, with participants from AgriSA and Government Water Schemes (GWS) amongst others. Raw water is natural water that has not been treated, nor has it any minerals or particles or living organisms removed; this includes ground water, rainwater or water from lakes and rivers. In its consultation meetings, the department made a proposal for Irrigation Raw Water Tariffs for 2017/18 to be subjected to a lower increase of 7% or less in producer price index (PPI). This proposal came as a result of the current economic climate and the concerns by different sectors such as small farmers that they were being overcharged, even above the PPI rate. The DWS is yet to make the recommendations on the proposed tariffs. Presented in this article is a summary of the PPI statistics for September 2016.
Final manufactured goods – headline PPI
The annual percentage change in the PPI for final manufactured goods was 6,6% in September 2016 (compared with 7,2% in August 2016) (see Table R). From August 2016 to September 2016 the PPI for final manufactured goods decreased by 0,3%.
The main contributors to the annual rate of 6,6 % were:

30
• food products, beverages and tobacco products (3,9 percentage points);and
• metals, machinery, equipment and computing equipment (0,9 of apercentage point).
The main contributors to the monthly decrease of 0,3% were: • transport equipment (-0,2 of a percentage point);• coke, petroleum, chemical, rubber and plastic products (-0,1 of a
percentage point); and• non-metallic mineral products (-0,1 of a percentage point).
Intermediate manufactured goods
The annual percentage change in the PPI for intermediate manufactured goods was 6,8% in September 2016 (compared with 8,2% in August 2016). From August 2016 to September 2016 the PPI for intermediate manufactured goods remained unchanged (see Table R).
The main contributors to the annual rate of 6,8% were: • basic and fabricated metals (2,3 percentage points);• chemicals, rubber and plastic products (1,9 percentage points); and• sawmilling and wood (1,8 percentage points).
Electricity and water
The annual percentage change in the PPI for electricity and water was 11,2% in September 2016 (compared with 11,5% in August 2016) (see Table R). From August 2016 to September 2016 the PPI for electricity and water decreased by 24,5%.
The contributors to the annual rate of 11,2% were electricity (8,4 percentage points) and water (2,9 percentage points)
Mining
The annual percentage change in the PPI for mining was 16,2% in September 2016 (compared with 21,0% in August 2016) (see Table R). From August 2016 to September 2016 the PPI for mining increased by 0,7%.
The main contributors to the annual rate of 16,2% were:

31
• gold and other metal ores (6,0 percentage points);• stone quarrying, clay and diamonds (5,3 percentage points); and• non-ferrous metal ores (3,6 percentage points).
The main contributors to the monthly increase of 0,7% were non-ferrous metal ores (1,0 percentage point) and stone quarrying, clay and diamonds (0,7 of a percentage point).
Agriculture, forestry and fishing
The annual percentage change in the PPI for agriculture, forestry and fishing was 14,5% in September 2016 (compared with 16,1% in August 2016) (see Table R). From August 2016 to September 2016 the PPI for agriculture, forestry and fishing decreased by 0,7%.
The contributors to the annual rate of 14,5% were: • agriculture (12,2 percentage points);• forestry (1,3 percentage points); and• fishing (1,0 percentage point).
The contributor to the monthly decrease of 0,7% was agriculture (-0,9 of a percentage point).
Table R – Key PPI figures for September 2016
Product
Weight Index (2012=100) % change Sep 2015
Aug 2016
Sep 2016
Sep 2016 vs. Aug 2016
Sep 2016 vs. Sep 2015
Final manufactured goods 100,00 119,1 127,4 127,0 -0,3 6,6
Intermediate manufactured goods 100,00 118,8 126,9 126,9 0,0 6,8
Electricity and water 100,00 132,8 195,5 147,7 -24,5 11,2
Mining 100,00 104,9 121,0 121,9 0,7 16,2
Agriculture, forestry and fishing 100,00 113,2 130,5 129,6 -0,7 14,5
A full release on the Producer price index (Statistical release P0142.1) is available on the Stats SA website: www.statssa.gov.za

32
Consumer price index (CPI)
CPI surpasses 3 – 6% inflation target
The Consumer price index (CPI) for September 2016 came in at 6,1% surpassing the ceiling of the South African Reserve Bank’s (SARB) inflation target range of 3 to 6%, which was set on 25 February 2009. An inflation target range, or target, is important because it means that the central bank, which in the case of South Africa is the SARB, is responsible for using monetary policy to keep inflation close to the agreed range. This will help reduce high inflation, as it can destabilise the economy and reduce the value of the rand. Presented in this article is a summary of the Consumer price index statistics for September 2016.
Annual consumer price inflation was 6,1% in September 2016, up from 5,9% in August 2016 (see Table S). The consumer price index increased by 0,2% month-on-month in September 2016.
Transport increased from 0,3 of a percentage point in August 2016 to 0,6 of a percentage point in September 2016. The index increased by 3,5% year-on-year in 2016.
Housing and utilities contributed 0,1 of a percentage point in September 2016. The index increased by 0,5% month-on-month, mainly due to a 0,9% increase in actual rentals for housing and a 0,8% increase in owners’ equivalent rent.
In September 2016, the CPI for goods increased by 6,6% year-on-year (up from 6,1% in August 2016), while the CPI for services increased by 5,6% year-on-year (down from 5,7% in August 2016).
Provincial annual inflation rates ranged from 5,1% in Northern Cape to 8,3% in Limpopo .

33
Table S – Consumer price index: Index numbers and year-on-year rates Base year: Dec 2012 = 100
Year Jan Feb Mar Apr May Jun Jul Aug Sep Oct Nov Dec Avg1/
2010 Index 86,4 87,0 87,7 87,8 88,0 88,0 88,6 88,6 88,7 88,9 89,0 89,2 88,2
Rate 6,2 5,7 5,1 4,8 4,6 4,2 3,7 3,5 3,2 3,4 3,6 3,5 4,3
2011 Index 89,6 90,2 91,3 91,6 92,0 92,4 93,2 93,4 93,8 94,2 94,5 94,6 92,6
Rate 3,7 3,7 4,1 4,2 4,5 5,0 5,3 5,3 5,7 6,0 6,1 6,1 5,0
2012 Index 95,2 95,7 96,8 97,2 97,2 97,5 97,8 98,0 98,9 99,5 99,8 100,0 97,8
Rate 6,3 6,1 6,0 6,1 5,7 5,5 4,9 5,0 5,5 5,6 5,6 5,7 5,6
2013 Index 100,3 101,3 102,5 102,9 102,6 102,9 104,0 104,3 104,8 105,0 105,1 105,4 103,4
Rate 5,4 5,9 5,9 5,9 5,6 5,5 6,3 6,4 6,0 5,5 5,3 5,4 5,7
2014 Index 106,1 107,3 108,7 109,2 109,4 109,7 110,6 111,0 111,0 111,2 111,2 111,0 109,7
Rate 5,8 5,9 6,0 6,1 6,6 6,6 6,3 6,4 5,9 5,9 5,8 5,3 6,1
2015 Index 110,8 111,5 113,1 114,1 114,4 114,9 116,1 116,1 116,1 116,4 116,5 116,8 114,7
Rate 4,4 3,9 4,0 4,5 4,6 4,7 5,0 4,6 4,6 4,7 4,8 5,2 4,6
Index 117,7 119,3 120,2 121,2 121,4 122,1 123,1 123,0 123,2 .. .. .. .. 2016
Rate 6,2 7,0 6,3 6,2 6,1 6,3 6,0 5,9 6,1 .. .. .. .. 1/ Annual average. A full release on the Consumer price index (Statistical release P0141) is available on the Stats SA website: www.statssa.gov.za

34
Glossary
Primary industries Gigawatt-hour (gWh): one gigawatt-hour of electricity is equal to one million kilowatt-hours. A kilowatt-hour is the basic unit of electrical energy equal to one kilowatt of power supplied to or taken from an electric circuit steadily for one hour. One kilowatt-hour equals one thousand watt-hours.
Index of physical volume of manufacturing production: also known as a production index, is a statistical measure of the change in the volume of production. The production index of a major group is the ratio between the volume of production of a major group in a given period and the volume of production of the same major group in the base period.
Index of physical volume of mining production: a statistical measure of the change in the volume of production. The production index of a mineral group is the ratio between the volume of production of a mineral group in a given period and the volume of production of the same mineral group in the base period.
Index of the physical volume of electricity production: a statistical measure of the change in the volume of production of electricity in a given period and the volume of production of electricity in the base period.
Industry: a group of establishments engaged in the same or similar kinds of economic activity.
PGMs – Platinum group metals: include platinum; iridium; osmiridium, palladium; rhodium; ruthenium and osmium.
Sales: total value of sales and transfers-out of goods mined by the mining establishments and the amounts received for installation, erection or assembly or other services.

35
Secondary industriesAdditions and alterations: extensions to existing buildings as well as internal and external alterations of existing buildings.
Blocks of flats: a structure, usually multi-storey, consisting of a number of dwellings sharing the same residential address, and usually sharing a common entrance, foyer or staircase.
Dwelling houses: a free-standing, complete structure on a separate stand or a self-contained dwelling-unit, e.g. granny flat, on the same premises as existing residence. Out-buildings and garages are included.
Other residential buildings: include institutions for the disabled, boarding houses, old age homes, hostels, hotel, motels, guest houses, holiday chalets, bed and breakfast accommodation, entertainment centres and casinos.
Residential buildings: dwelling houses, flats, townhouses and other residential buildings.
Tertiary industries Acknowledgements of debt: a statement by a person/debtor in which he admits that he owes money to an individual or a company or a bank.
Average income per stay unit night sold: average rate per stay unit (i.e. rate per room in a hotel or powered site in a caravan park) is calculated by dividing the total income from accommodation by the number of stay unit nights sold in the survey period.
Catering services: enterprises involved in the sale and supply of meals and drinks prepared on the premises on a contract basis and brought to other premises chosen by the person ordering them, to be served for immediate consumption to guests or customers. Include bars, taverns, other drinking places, ice-cream parlours, etc. Civil judgements: decisions taken in a civil matter or a dispute between two people or parties.

36
Civil summonses: notices to appear before the court of law where a dispute between two parties or people has to be heard, i.e. not for criminal offence.
Enterprise: a legal entity or a combination of legal units that includes and directly controls all functions necessary to carry out its sales activities.
Foreign traveller: a person who resides outside South Africa and visits the country temporarily.
Income from accommodation industry: income from amounts charged for rooms or equivalent. Other income is excluded (e.g. income from meals).
Income from bar sales: refers to income from liquor sales.
Income from food sales: refers to income from the sale of meals and non-alcoholic drinks.
Income from restaurant and bar sales: income from meals, banqueting and beverages and tobacco sales.
Insolvency: refers to an individual or partnership which is unable to pay its debt and is placed under final sequestration. The number of insolvencies does not refer to the number of persons involved, as a partnership which is unable to pay its debt is regarded as one insolvency, irrespective of the number of partners.
Liquidation: refers to the winding-up of the affairs of a company or close corporation when liabilities exceed assets and it can be resolved by voluntary action or by an order of the court.
Microdata: data gathered on a small scale, such as data on an individual.
‘Other’ African countries: refers to all non SADC African countries.
Other income: includes all income not earned from food sales or bar sales.
Other SADC: refers to the thirteen countries, excluding South Africa, that belong to the Southern African Development Community.
Professional services: refer to medical doctors, dentists, advocates, attorney, auditors, accountants, architects, engineers, hospital services etc.

37
Promissory notes: written undertaking, signed by a person or party, to pay money to another person or to be the bearer of such a note on a specific date or on demand.
Restaurants and coffee shops: enterprises involved in the sale and provision of meals and drinks, ordered from a menu, prepared on the premises for immediate consumption and with provided seating.
Retailer: a retailer is an enterprise deriving more than 50% of its turnover from sales of goods to the general public for household use.
Retail trade: includes the resale (sale without transformation) of new and used goods and products to the general public for household use.
Stay unit: unit accommodation available to be charged out to guests, for example, a powered site in a caravan park or a room in a hotel.
Stay unit night sold: total number of stay units occupied on each night during the survey period.
Takeaway and fast-food outlets: enterprises involved in the sale and provision of meals and drinks, ordered from a menu, prepared on the premises for takeaway purposes in a packaged format, at a stand or in a location, with or without provided seating.
Total income: includes income from food sales, income from bar sales and other income.
Tourism: comprises the activities of persons travelling to, and staying in places outside their usual environment, for not more than one consecutive year, for leisure, business and other purposes not related to the exercise of an activity remunerated from within the place visited. Tourist: a visitor who stays at least one night in the place visited.
Traveller: any person on a trip between two or more countries or between two or more localities within his/her country of residence.
Voluntary liquidation: takes place when a company or close corporation, by own choice, resolves to wind-up its affairs.
Wholesale trade: Includes the resale (sale without transformation) of new and used goods and products to other wholesalers, retailers, agricultural,

38
industrial, commercial, institutional and professional users either directly or through agents on a fee or contract basis.
Prices Annual percentage change: change in the index of the relevant month of the current year compared with the index of the same month in the previous year expressed as a percentage.
Consumer price index (CPI): an index that measures the price of a fixed basket of consumer goods and services.
Inflation rate: annual percentage change in the CPI for all items of the relevant month of the current year compared with the CPI for all items of the same month in the previous year expressed as a percentage.
Monthly percentage change: change in the index of the relevant month compared to the index of the previous month expressed as a percentage.
Year-on-year: A term used frequently in investment research and other reports to mean ‘compared with the same period in the previous fiscal year’.