stats press release 2009
TRANSCRIPT

8/4/2019 Stats Press Release 2009
http://slidepdf.com/reader/full/stats-press-release-2009 1/12
URN 10/92 13 October 2010
STATISTICAL PRESS RELEASE
Introduction
The Department for Business Innovation and Skills, today released ‘Small and Medium-sized Enterprise (SME) Statistics for the UK and Regions 2009’ ,according to arrangements approved by the UK Statistics Authority.
This publication provides an estimate of the total number of private sector
enterprises in the UK at the start of 2009, and their employment and turnover.
Further information is provided by number of employees, legal status, industryand geography. The publication comprises this statistical press release, a
methodology note and a detailed dataset which are all accessible on the BIS
website, via the link: http://stats.bis.gov.uk/ed/sme.
Summary
There were an estimated 4.8 million1 private sector enterprises in the UK at thestart of 2009, an increase of 51,0002 (1.1 per cent) since the start of 2008.
These enterprises employed an estimated 22.8 million people, and had an
estimated combined annual turnover of £3,200 billion3.
Small and medium-sized enterprises (SMEs) together accounted for 99.9 per
cent of all enterprises, 59.8 per cent of private sector employment and 49.0 per
cent of private sector turnover.
Turnover in SMEs is estimated at £1,589 billion, £88 billion (5.8 per cent) higher
than 2008.
1 This figure is rounded to the nearest 100,000.
2 Re-weighted ONS Labour Force Survey data reflecting mid-2009 population estimates havebeen used to compile the start-2009 statistics. If the start-2008 estimate of the number of enterprises had been produced on the same basis, it would have been 4,600 lower. Therefore thelevel of the increase described here slightly underestimates the actual change. For a fullexplanation see the accompanying methodology note.
3 Turnover data throughout this release excludes SIC2003 Section J (Financial Intermediation),where turnover is not available on a comparable basis.
1

8/4/2019 Stats Press Release 2009
http://slidepdf.com/reader/full/stats-press-release-2009 2/12
The stock of enterprises, employment and turnover
At the start of 2009, the 4.8 million UK private sector enterprises employed an
estimated 22.8 million people, and had an estimated combined annual turnover
of £3,200 billion (see Table 1).
Table 1
Number of enterprises, employment and turnover by number of employees, UK private sector,
start of 2009.
Number
Enterprises Employment Turnover 1
( / 1,000) ( / £ million)
All enterprises 4,834,045 22,819 3,240,329
SMEs (0-249 employees) 4,828,160 13,639 1,588,581
All employers 1,220,070 18,876 3,000,770
With no employees 2 3,613,975 3,942 239,559 1-9 1,019,605 3,813 444,953
10-49 167,670 3,251 472,272
50-249 26,910 2,633 431,79 7
250 or more 5,885 9,179 1,651,748
1: "All Industries" turnover figures exclude Section J (financial intermediation) where turnover is not available on a comparable basis.
2: "With no employees" comprises sole proprietorships and partnerships comprising only the sel f-employed owner-manager(s),
and companies comprising only one employee director.
Almost all of these enterprises (99.3 per cent) were small (0 to 49 employees).
Only 27,000 (0.6 per cent) were medium-sized (50 to 249 employees) and 6,000
(0.1 per cent) were large (250 or more employees)
Figure 1
Share of enterprises, employment and
turnover by size of enterprise
UK private sector, start of 2009.
0.1% 0.6%
99.3%
40.2%
11.5%
48.2% 51.0%
35.7%
13.3%
0%
50%
100%
Small Medium Large
Enterprises Employment Turnover
Small and medium-sizedenterprises (SMEs) together
accounted for more than half of
employment (59.8 per cent) and
turnover (49.0 per cent) in the
UK.
Small enterprises alone (0 to 49
employees) accounted for 48.2
per cent of employment and
35.7 per cent of turnover (see
Figure 1).

8/4/2019 Stats Press Release 2009
http://slidepdf.com/reader/full/stats-press-release-2009 3/12
Changes in stock of enterprises, employment and turnover over time
There were an estimated 4.8 million private sector enterprises in the UK at the
start of 2009, an increase of 51,000 (1.1 per cent) since the start of 2008. This is
the highest number of enterprises since the time series began in 1994.
UK private sector enterprises employed an estimated 22.8 million people at thestart of 2009, a fall of 309,000 (-1.3 per cent) since the start of 2008.
Estimated employment in SMEs has fallen by 102,000 (-0.7 per cent) to 13.6
million people at the start of 2009, though the SME share of private sector
employment has increased from 59.4 to 59.8 per cent.
At the start of 2009, UK enterprises had an estimated combined annual turnover
of £3,200 billion, an increase of almost £250 billion (8.2 per cent) since the startof 2008.
Turnover in SMEs is estimated at just under £1,600 billion, £88 billion (5.8 percent) higher than 2008. As a proportion of all private sector turnover, this has
decreased from 50.1 per cent to 49.0 per cent at the start of 2009.
Legal status
There were an estimated 3.1
million sole proprietorships
in the UK at the start of 2009,
of which 302,000 (9.8 per
cent) had employees (seeFigure 2).
There were an estimated
444,000 partnerships, of
which 170,000 (38.4 per cent)had employees.
There were 1.3 million
companies, of which 747,000
(57.5 per cent) had
employees4.
Figure 2
Number of enterprises with employees, by
legal status, UK private sector, start of 2009.
0 0.5 1 1.5 2 2.5 3 3.5
Companies
Partnerships
Sole pro- prietorships
Number of enterprises ( / millions)
With employees No employees
Table 2 shows that during 2008 the number of companies increased by 3,000
(0.3 per cent) to 1.3 million at the start of 2009, though this has only risen forthose without employees. This is the eleventh successive year that companies
have increased in number.
The number of sole proprietorships has increased by 65,000 (2.1 per cent), to 3.1
million, the seventh successive annual increase. The number of partnerships
has decreased by 18,000 (-3.8 per cent), to 444,000.
4 For legal reasons most companies are run by employees. However, in the SME statisticscompanies with a single employee are treated as having no employees.
8/4/2019 Stats Press Release 2009
http://slidepdf.com/reader/full/stats-press-release-2009 4/12
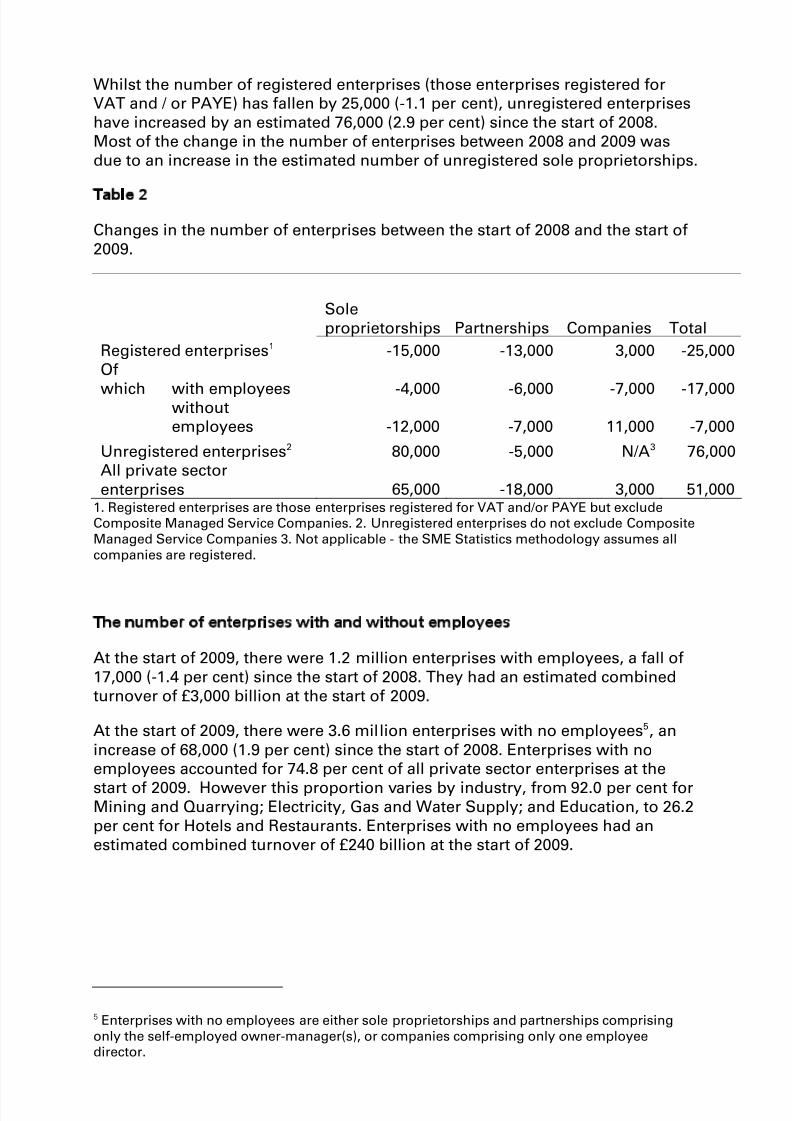
Whilst the number of registered enterprises (those enterprises registered forVAT and / or PAYE) has fallen by 25,000 (-1.1 per cent), unregistered enterprises
have increased by an estimated 76,000 (2.9 per cent) since the start of 2008.
Most of the change in the number of enterprises between 2008 and 2009 was
due to an increase in the estimated number of unregistered sole proprietorships.
Table 2
Changes in the number of enterprises between the start of 2008 and the start of
2009.
Sole
proprietorships Partnerships Companies Total
Registered enterprises1 -15,000 -13,000 3,000 -25,000
Of
which with employees -4,000 -6,000 -7,000 -17,000
withoutemployees -12,000 -7,000 11,000 -7,000
Unregistered enterprises2 80,000 -5,000 N/A3 76,000All private sector
enterprises 65,000 -18,000 3,000 51,0001. Registered enterprises are those enterprises registered for VAT and/or PAYE but excludeComposite Managed Service Companies. 2. Unregistered enterprises do not exclude CompositeManaged Service Companies 3. Not applicable - the SME Statistics methodology assumes allcompanies are registered.
The number of enterprises with and without employees
At the start of 2009, there were 1.2 million enterprises with employees, a fall of
17,000 (-1.4 per cent) since the start of 2008. They had an estimated combined
turnover of £3,000 billion at the start of 2009.
At the start of 2009, there were 3.6 million enterprises with no employees5, an
increase of 68,000 (1.9 per cent) since the start of 2008. Enterprises with noemployees accounted for 74.8 per cent of all private sector enterprises at the
start of 2009. However this proportion varies by industry, from 92.0 per cent forMining and Quarrying; Electricity, Gas and Water Supply; and Education, to 26.2
per cent for Hotels and Restaurants. Enterprises with no employees had an
estimated combined turnover of £240 billion at the start of 2009.
5 Enterprises with no employees are either sole proprietorships and partnerships comprisingonly the self-employed owner-manager(s), or companies comprising only one employeedirector.

8/4/2019 Stats Press Release 2009
http://slidepdf.com/reader/full/stats-press-release-2009 5/12
Industry patterns
More industries experienced growth in the number of enterprises between the
start of 2008 and the start of 2009, than experienced a fall. In percentage terms,
the biggest increases in the number of enterprises were in the Financial
Intermediation (13.1 per cent) and Agriculture and Fishing (12.1 per cent)
sectors, whilst the biggest falls were in the Manufacturing (-6.5 per cent), Hotelsand Restaurants (-4.7 per cent) and Wholesale, Retail and Repairs (-3.5 per cent)
sectors.
At the start of 2009, 1,196,000 enterprises were in operating in Real Estate,
Renting and Business Activities. This represents a quarter (24.7 per cent) of all
UK private sector enterprises. These enterprises employed an estimated
4,482,000 people (19.6 per cent of the UK private sector employment) and had
turnover of £478 billion (14.7 per cent of the UK private sector turnover,excluding Financial Intermediation).
Wholesale, Retail and Repairs was the biggest employer at the start of 2009. The563,000 enterprises in this sector employed 4,853,000 people, representing 21.3
per cent of all UK private sector employment.
Small enterprise employment and turnover share
At the start of 2009, 48.2 per cent of private sector enterprise employment was in
small enterprises (0-49 employees), although this proportion varied by industry
(see Figure 3). In Financial Intermediation only 18.0 per cent of employment was
in small enterprises - in Agriculture, Fishing and Forestry, 92.6 per cent of employment was in small enterprises.

8/4/2019 Stats Press Release 2009
http://slidepdf.com/reader/full/stats-press-release-2009 6/12
Figure 3
Small enterprise1 share of employment within each industry section based on
SIC2003, for the UK private sector, start of 2009.
1: Small enterprises defined as those with 0 to 49 employees.
0%
20%
40%
60%
80%
100%
A l l i n d u s t r i e s
A g r i c u l t u r e ;
F i s h i n g ( A B )
M i n i n g /
Q u a r r y i n g &
U t i l i t i e s ( C E ) *
M a n u f a c t u r i n g
( D )
C o n s t r u c t i o n
( F )
W h o l e s a l e &
R e t a i l ; R e p a i r s
( G )
H o t e l s &
R e s t a u r a n t s ( H )
T r a n s p o r t ,
S t o r a g e &
C o m m . s ( I )
F i n a n c i a l
I n t e r m e d i a t i o n
( J )
R e a l E s t . ,
R e n t i n g &
B u s i n e s s A c t . s
E d u c a t i o n ( M ) *
H e a l t h &
S o c i a l w o r k
( N )
O t h e r s e r v i c e s
( O )
* SIC 2003 Sections CE and M have been suppressed to avoid disclosure.
The share of turnover in small enterprises also varies between industries.
Overall, 35.7 per cent of turnover was in small enterprises. Again, there were
variations by industry, ranging from 5.8 per cent in Mining, Quarrying and
Utilities to 84.0 per cent in Agriculture, Fishing and Forestry.

8/4/2019 Stats Press Release 2009
http://slidepdf.com/reader/full/stats-press-release-2009 7/12
Enterprises in the English Regions, Scotland, Wales and Northern Ireland
Of the estimated 4.8 million enterprises in the UK at the start of 2009, 4.2 million
(86.6 per cent) were in England6. The number of enterprises in England
increased by 53,000 (1.3 per cent) between 2008 and 2009.
With 840,000 private sector enterprises in 2009, London had more enterprisesthan any other region or country in the UK. The South East had the secondlargest number of enterprises with 740,000. Together these regions account for
almost a third of all private sector enterprises in the UK (see Figure 4).
Figure 4
Number of private sector enterprises in each region and country in the UK, start
of 2009.
0
200,000
400,000
600,000
800,000
1,000,000
L o
n d o n
S . E a s t
E a s t
N .
W e s t
S .
W e s t
W .
M i d s
Y o
r k s / H
E .
M i d s
N . E a s t
S c o
t l a n d
W
a l e s
N .
I r e l ' d
For each region and country in the UK, no more than 0.1 per cent of enterprises
are large (250 or more employees), and at least 99.2 per cent of enterprises are
small (0 to 49 employees).
Regional changes since the start of 2008
Half of the regions and countries in the UK experienced growth in the number of
private sector enterprises between the start of 2008 and the start of 2009, and
half experienced a decline. In percentage terms, the biggest increases wereexperienced by North West (6.3 per cent) and London (4.7 per cent), whilst the
largest falls were in the East Midlands (-3.7 per cent) and South East (-3.3 per
cent).
Most regions and countries saw falls in levels of employment over the period,
with the exception of the South West, the East of England and Scotland. The
South West had the largest increase in employment, rising by 13,000 (0.8 per
cent) to 1,745,000.
6 Enterprises that have sites in more than one region or country are counted here only in theregion or country where they are registered.

8/4/2019 Stats Press Release 2009
http://slidepdf.com/reader/full/stats-press-release-2009 8/12
Regional share of employment in SMEs
Out of all the UK regions and countries, London had the lowest share of private
sector employment in SMEs (50.0 per cent) 7. For Northern Ireland, Wales and
the South West this figure exceeded 70 per cent.
Regional variation by industry
The differences in employment patterns between regions can be explainedpartly by differing industry compositions.
Almost a third (31.2 per cent) of businesses in London were in Real Estate,
Renting and Business Activities, the highest proportion of all regions and
countries (see Figure 5), but less than one per cent of enterprises in London are
in Agriculture, Fishing and Forestry.
Northern Ireland (15.9 per cent) and Wales (16.0 per cent) had the lowest
proportion of enterprises in the Real Estate, Renting and Business Activitiessector, out of all regions and countries (see Figure 5).
Figure 5
Share of enterprises in the Real Estate, Renting and Business Activities sector(SIC2003 Section K), by region and country, start of 2009.
25%
31% 29%
26% 23% 23% 22% 22% 21% 21%
26%
16%
24%
16%
0%
5%
10%
15%
20%
25%
30%
35%
U . K .
L o n d o n
S . E a s t
E a s t
W . M i d s
N . W e s t
S . W e s t
N . E a s t
E . M i d s
Y o r k s / H .
E n g l a n d
W a l e s
S c o t l a n d
N . I r e l ' d
However, Northern Ireland (25.1 per cent) also had the highest proportion of
enterprises in the Construction sector, followed by the East Midlands (24.5 percent), whilst just 17.5 per cent of enterprises in London were in this sector (see
Figure 6).
7 Enterprises that have employees in more than one region or country are counted here only inthe region or country where they are registered.

8/4/2019 Stats Press Release 2009
http://slidepdf.com/reader/full/stats-press-release-2009 9/12
Figure 6
Share of enterprises in the Construction sector (SIC2003 Section F), by region,
start of 2009.
21%
25% 24%
22% 22%21% 21% 20%
20%
18%
21%
23%
19%
25%
0%
5%
10%
15%
20%
25%
30%
U . K .
E . M i d s
E a s t
S . W e s t
W . M i d s
Y o r k s / H .
S . E a s t
N . W e s t
N . E a s t
L o n d o n
E n g l a n d
W a l e s
S c o t l a n d
N . I r e l ' d
Regional variation in employment by industry
The share of employment in each industry also varied by region.
For example, the Wholesale, Retail and Repairs sector had the largest share (21.3
per cent) of UK private sector employment at the start of 2009, employing 4.9
million people. Yorkshire and the Humber (32.9 per cent) had the largest share of
its employment in this sector, whilst Scotland (13.6 per cent) had the lowest (seeFigure 7).
Figure 7
Share of employment in the Wholesale, Retail Trade; Repair sector (SIC2003
Section G), by region, start of 2009.
21%
33%
26% 25%
24%
20%19%
17% 17%16%
22%20%
14%
23%
0%
5%
10%
15%
20%
25%
30%
35%
U . K .
Y o r k s / H .
E a
s t
E . M i d s
N . W e
s t
L o n d o
n
W . M i d s
S . W e
s t
S . E a
s t
N . E a
s t
E n g l a n
d
W a l e s
S c o t l a n
d
N . I r e l ' d

8/4/2019 Stats Press Release 2009
http://slidepdf.com/reader/full/stats-press-release-2009 10/12
Notes on this release
1. In this release, and in the tables accompanying it, a small enterprise is
defined as an enterprise with 0 to 49 employees, a medium-sized enterprise is an
enterprise with 50 to 249 employees, and a large enterprise is an enterprise with
250 or more employees.
2. Within the scope of the SME Statistics companies with a single employeedirector are counted as zero employee businesses.
3. The definition of private sector used in this publication excludes the non-
profit sector, but includes nationalised bodies which are not in the private sector.
This is different to the ONS definition which includes the non-profit sector.
4. Turnover data throughout this release excludes SIC2003 Section J(Financial Intermediation), where turnover is not available on a comparable
basis.
5. Enterprises that have sites (and employees) in more than one region or
country are counted here only in the region or country where they are
registered. These estimates may therefore differ from actual employment in aregion, since some employees in one region will work for enterprises that are
registered in another region.
6. 1 billion = 1,000 million.
7. All figures in this document can also be found in the accompanying Excel
tables published at http://stats.bis.gov.uk/ed/sme .
8. All figures and percentages in this document are rounded, usually to two
significant figures and one decimal place respectively. Therefore totals might notexactly match the sum of their parts. Suppression and controlled rounding have
been used to protect the data in this publication from disclosure. For further
information about the confidentiality procedures applied, please refer to the
Methodology Note.
9. These statistics are final and will not be revised.
Timeliness
The 2009 edition of this publication was published over 20 months after the start
of the reference year. This reflects lags in the recording of key information on
the administrative system.
Sources and accuracy
10. A document on methodology used to produce these estimates
accompanies this press release at http://stats.bis.gov.uk/ed/sme. It is
recommended that this document is read before interpreting these statistics.
11. There is no single source of estimates of the number of enterprises in the
UK. The main source for this publication is the Inter-Departmental BusinessRegister (IDBR), administered by the Office for National Statistics (ONS), which
is used to provide the number of registered enterprises in the UK.

8/4/2019 Stats Press Release 2009
http://slidepdf.com/reader/full/stats-press-release-2009 11/12
12. This publication also includes estimates of very small enterprises that donot appear on the IDBR. These are estimated by BIS from the ONS Labour Force Survey and HM Revenue & Customs Survey of Personal Incomes . Since the
estimates use survey data, the reliability of the SME Statistics is lower for the
smallest size class.
13. A number of methodological changes have been made to the series,which impact on the comparability of the estimates over time. Please refer to the
Methodology Note for further information.
Changes to this edition
14. The methodology used to produce this series is currently under review,
following a public consultation last year. Some small (mainly presentational)changes have been incorporated into this publication and further improvements
will be made in future editions. Further details are listed in the MethodologyNote that accompanies this release. Links to the public consultation and the
government response can be found via the following link:
http://www.berr.gov.uk/whatwedo/enterprise/enterprisesmes/page49415.html
Data users and uses
15. The SME Statistics are used extensively by the public, public bodies andbusinesses. For example they are used by:
- businesses in understanding their market share and planning marketing
strategies
- by banks in developing an understanding of their customer base.
- by foreign firms in making UK location decisions
- by academics to inform research into businesses at local and national
level
- by a range of public bodies in decision making and in evaluating thesuccess of regeneration and enterprise related policies
- by public and private business support providers in targeting businesssupport.
16. The SME Statistics provide information on the relative contribution by
enterprises of different employment size bands to the economy in terms of numbers, employment and turnover, at a point in time. The publication also
provides information on the location and industry of these enterprises. If theuser is interested in employment in isolation (i.e. not employment in
combination with enterprise), the ONS Business Register and Employment Survey is the preferred source (data for 2009 will be published in December
2010). If the user is interested in turnover in isolation (i.e. not turnover incombination with enterprise), the ONS Annual Business Survey (formerly the Annual Business Inquiry) is the preferred source. For analysis of year-on-year
change in the number of jobs, it is recommended that the ONS Workforce Jobs

8/4/2019 Stats Press Release 2009
http://slidepdf.com/reader/full/stats-press-release-2009 12/12
publication is used. Please refer to the Methodology Note for further informationon alternative sources of enterprise information.
National Statistics publication
17. National Statistics are produced to high professional standards set out in
the Code of Practice for Official Statistics. They undergo regular qualityassurance reviews to ensure that they meet customer needs. They are producedfree from any political interference.
Contact details
18. For enquiries, or to give feedback on this publication, contact Karen
Grierson, BIS Enterprise Directorate Analytical Unit:
Tel 0114 207 5104E-mail [email protected]
Letters 2nd Floor, 2 St Paul's Place, 125 Norfolk Street, SHEFFIELD, S1 2FJ
For enquiries about National Statistics, contact the National Statistics Public
Enquiry Service:
Tel 0845 601 3034 Fax 01633 652747Minicom 01633 812399 E-mail [email protected]
Letters Customer Contact Centre, Room 1.015, Office for National Statistics,
Cardiff Road, Newport, NP10 8XG
National Statistics are available on the internet - go to
http://www.statistics.gov.uk/hub/index.html.