status assessment of high level indicator reporting metrics · status assessment of high level...
TRANSCRIPT

Status Assessment of High Level Indicator Reporting Metrics
Prepared for: Dairy Sustainability Framework
Prepared by:
Marty D. Matlock, PhD, PE, BCEE
Professor Dep’t of Biological and Agricultural Engineering
Executive Director Office for Sustainability University of Arkansas [email protected]
June 9, 2017

i
TABLE OF CONTENTS
1. PURPOSE .......................................................................................................................................1
2. SURVEY INSTRUMENT ....................................................................................................................2 2.1. DEVELOPMENT PROCESS ......................................................................................................................... 2 2.2. SURVEY ................................................................................................................................................. 2 2.3. SURVEY DISTRIBUTION ............................................................................................................................ 3
3. SURVEY ANALYSIS ..........................................................................................................................3
4. RESULTS .........................................................................................................................................6 4.1. SOIL NUTRIENTS ..................................................................................................................................... 6 4.2. SOIL QUALITY & RETENTION .................................................................................................................... 9 4.3. BIODIVERSITY ....................................................................................................................................... 12 4.4. WATER AVAILABILITY & QUALITY ............................................................................................................ 16 4.5. WORKING CONDITIONS ......................................................................................................................... 22
5. APPENDIX: SURVEY WITH INTRODUCTION AND DEFINITIONS ........................................................ 26

ii
LIST OF FIGURES
Figure 1: Scoring Rubric for Survey Responses, with color codes for sectors of responders ........ 4
Figure 2: Scoring rubric grid for the Soil Nutrient metric question “Soil nutrient testing is conducted routinely.” ...................................................................................................................... 5
Figure 3: Scoring rubric grids for the Soil Nutrients High Level Indicator .................................... 7
Figure 4:Scoring rubric grids for the Soil Quality and Retention High Level Indicator .............. 10
Figure 5:Scoring rubric grids for the Biodiversity High Level Indicator ..................................... 13
Figure 6:Scoring rubric grids for the Water Availability & Quality High Level Indicator .......... 18
Figure 7:Scoring rubric grids for the Working Conditions Level Indicator ................................. 23
LIST OF TABLES
Table 1: Scores derived from rubric grid plots of Survey results for the Soil Nutrients High Level Indicators. KPI metrics are ordered from highest to lowest Matrix Priority Score. ............. 6
Table 2: Scores derived from rubric grid plots of Survey results for the Soil Quality & Retention High Level Criteria. KPI metrics are ordered from highest to lowest Matrix Priority Score. .............................................................................................................................................. 9
Table 3:Scores derived from rubric grid plots of Survey results for the Biodiversity High Level Criteria. KPI metrics are ordered from highest to lowest Matrix Priority Score. ......................... 12
Table 4: Scores derived from rubric grid plots of Survey results for the Water Availability & Quality High Level Criteria. KPI metrics are ordered from highest to lowest Matrix Priority Score. ............................................................................................................................................ 17
Table 5:Scores derived from rubric grid plots of Survey results for the Working Conditions High Level Criteria. KPI metrics are ordered from highest to lowest Matrix Priority Score. ...... 22

1
1. PURPOSE 1
The Dairy Sustainability Framework (DSF) was created to identify material issues, set priorities, 2 implement change to demonstrate progress, and report on continuous improvements across 3 member organizations/regions. The DSF is in the process of developing eleven high level 4 Sustainability ‘indicators’ chosen to quantify and track desired improvement across the industry. 5 The eleven indicators are: Greenhouse Gas Emissions, Soil Nutrients, Waste, Water, Soil, 6 Biodiversity, Market Development, Rural Economics, Working Conditions, Product Safety & 7 Quality, and Animal Care. Indicators were developed in 2016 for the Animal Care and Greenhouse 8 Gas Criteria. The Dairy Sustainability Framework plans to develop five High Level Indicators for 9 launch in 2017. The remaining four will be completed in 2018. The five high level indicators 10 included in the 2017 indicator development are: 11
• Soil – Quality and Retention 12 • Soil Nutrients 13 • Biodiversity 14 • Water Availability and Quality 15 • Working Conditions 16
These indicators will enable the DSF to publically report global progress of the dairy industry 17 within the 11 DSF indicators. The DSF will have to capture data from diverse dairy production 18 systems from a range of geographies. The scale of this project demands that the chosen indicators 19 be both ‘meaningful’ and measureable. Each indicator will have an associated reporting period. 20 The development of an appropriate baseline for each indicator metric will be integral to the 21 indicator development process. Reporting will focus on the change since the previous reporting 22 period. 23
The scope of work required to develop these High Level Indicators included creating and 24 distributing surveys to the membership to help inventory and identify the metrics that DSF 25 members currently measure that apply to each High Level Indicator. Where possible, the DSF 26 will utilize existing measurement systems. Members will be asked to incorporate the High Level 27 Indicators alongside their own Key Performance Indicators (KPIs) and metrics, and will be 28 required to include these results as part of their reporting procedure to the DSF. 29
30

2
2. SURVEY INSTRUMENT 1
2.1. Development Process 2
Before developing the survey, we examined the websites for DSF members of all categories to 3 help determine what Key Performance Indicator metrics the membership is already measuring and 4 what indicators have been developed by members. We also examined notes from previous 5 stakeholder conversations regarding metrics measured by DSF members. Finally, indicators 6 developed by the Global Roundtable for Sustainable Beef (GRSB), Dairy Research Institute (DRI), 7 and others were reviewed and included where appropriate. A comparison of high level indicators 8 across animal agriculture initiatives is being prepared to support final DSF metric selection. A 9 draft survey was created, reviewed, and revised before it was distributed to members. 10
2.2. Survey 11
The survey (Appendix) included questions about Key Performance Indicator metrics for each of 12 the five High Level Indicators. Each Indicator can be measured by a variety of KPIs, so the number 13 of questions varied by Indicator. A total of 39 metrics were addressed in the survey. The division 14 of metrics between indicators was: 15
Soil Nutrients = 7 Key Performance Indicator metrics 16 Soil Quality & Retention =5 Key Performance Indicator metrics 17 Biodiversity = 10 Key Performance Indicator metrics 18 Water Availability & Quality = 15 Key Performance Indicator metrics 19 Working Conditions = 12 Key Performance Indicator metrics 20
The first page of the survey requested identifying information (Name, Organization, Address, and 21 Contact Information) and requested a list of other sustainability programs with which the member 22 organization participates. An introductory paragraph explained the purpose of the survey and 23 provided instructions. A list of terminology provided definitions of words and phrases used in the 24 survey questions. Instructions indicated that responders could skip questions that did not pertain 25 to their operation. 26
For each High Level Criteria, the survey asked members to numerically rank the importance of 27 each metric to their operation and to their customers. Responses were limited to 0 through 3, and 28 were defined as follows: 29
0 = Not important at all 30 1 = Minimally important 31 2 = Somewhat important 32 3 = Very important 33

3
The survey also asked members to indicate whether they currently measure each metric (yes or 1 no) and provided space for members to list other metrics they thought should be considered as 2 indicators for each High Level Criteria. This space also allowed for comments and explanations 3 of answers. 4
2.3. Survey Distribution 5
The survey was created as a fillable PDF that could be emailed to members and as an online survey 6 on the Survey Monkey website. Members were emailed the survey PDF and a link to the online 7 survey so they could choose which platform they preferred to use for their responses. Both survey 8 formats included an introduction explaining the survey purpose, instructions for completing the 9 survey, and a list of definitions defining the terminology used in the survey. 10
Surveys were distributed March 22, 2017 to DSF members. After deadline extensions, members 11 were given approximately eight weeks to complete and return the surveys. A total of nine surveys 12 were completed online and ten surveys were returned via email, for a total of 19 completed surveys. 13
3. SURVEY ANALYSIS 14
Survey responses were collected and consolidated. Responses were identified by the sector(s) they 15 represent in the dairy industry using a color coded system. Those members representing multiple 16 sectors were coded with multiple colors. Colors were assigned as follows: 17 18 Producer = green 19 Cooperative = yellow 20 Industry group = orange 21 Processor/Distributor = purple 22 Research = blue 23 Government = red 24 25 For each metric, numerical rankings were plotted on a 16-square grid scoring rubric (Figure 1). 26 Each square on the scoring rubric grid was assigned a numerical value based on its position on the 27 grid. The Data point for each survey was plotted into the square associated with the Operator 28 Priority and Customer Priority values reported. Once all surveys were plotted onto the grid, the 29 Total Score (T) was determined by adding the numeric scores for all of the data points. The Matrix 30 Priority Score was then calculated by dividing the Total Score by the number of data points (N). 31 A unique scoring rubric grid was created for each metric question of the survey. 32

4
The scoring rubric grid for the first metric question of the Soil Nutrients section of the survey is 1 shown in Figure 2. The image shows that there were 15 responses to the metric “Soil Nutrient 2 testing is conducted routinely.” The total score (T) for the data points is 75, and the Matrix Priority 3 Score is 75/15 = 5.0. Further examination of the grid shows that the metric of soil nutrient testing 4 was considered more important to the operation for survey responders representing the government 5 (red), processor/distributor (purple), producer (green), Co-operative (yellow), and research (blue) 6 sectors, and less important for responders representing the Industry group (orange) sector. Only 7 one third of the responses indicated that the metric was very important to customers, while two 8 thirds of the responses indicated the metric was very important to their operation. All the scoring 9 rubric grids for the survey questions are included in Appendices 2-6. 10
11
Figure 1: Scoring Rubric for Survey Responses, with color codes for 12 sectors of responders 13
14
15

5
Figure 2: Scoring rubric grid for the Soil Nutrient metric question “Soil 1 nutrient testing is conducted routinely.” 2
3
4
5

6
4. RESULTS 1
4.1. Soil Nutrients 2
The scores for the Survey results for the Soil Nutrients High Level Indicators are shown in Table 3 1. Results are arranged from highest to lowest Matrix Priority Score. The metric “Percent of 4 suppliers completing nutrient management plan” had the highest score. The scoring rubric grid 5 shows that most data points fell in the top right quadrant of the grid, indicating that most 6 responders, across all sectors, felt the metric was somewhat to very important to both the operation 7 and customer. The table shows that 50% of the survey respondents are currently measuring the 8 metric. Results were similar for the next lower scoring metrics; “Nutrient management plan in 9 place to optimize nutrient application (C, N, P, K, and S)” and “Soil nutrient testing is conducted 10 routinely.” Across the Criteria, the Industry Group sector responders indicated the metrics were of 11 low to moderate importance except for the “Nutrient Management Plan” metrics. 12
Table 1: Scores derived from rubric grid plots of Survey results for the 13 Soil Nutrients High Level Indicators. KPI metrics are ordered from 14 highest to lowest Matrix Priority Score. 15
SOIL NUTRIENTS High Level Indicator Key Performance Indicator Metric
Total (T)
Data points
(N)
Matrix Priority Score
Currently measure metric
(% Yes) Percent of suppliers completing nutrient management plan 86 16 5.38 50%
Nutrient management plan in place to optimize nutrient application (C, N, P, K, and S) 85 16 5.31 50%
Soil nutrient testing is conducted routinely 81 16 5.06 47% Soil Test Phosphorus (STP) is analyzed to inform fertilization plans 76 16 4.75 41%
Total Nitrogen (kg per hectare) is analyzed to inform fertilization plans 74 16 4.63 41%
Soil pH levels are measured 69 16 4.31 41% Percent of suppliers using an effluent management plan 67 16 4.19 18%
T= total rubric points for the survey responses, 16 N= number of survey responses for the metric, 17 Matrix Priority Score = T/N, 18 % Yes = the percentage of “yes” responses to the question “Do you measure this metric 19
20

7
Figure 3: Scoring rubric grids for the Soil Nutrients High Level Indicator 1
2
3

8
Figure 3: Scoring rubric grids for the Soil Nutrients High Level Indicator (continued) 1
2
3

9
4.2. Soil Quality & Retention 1
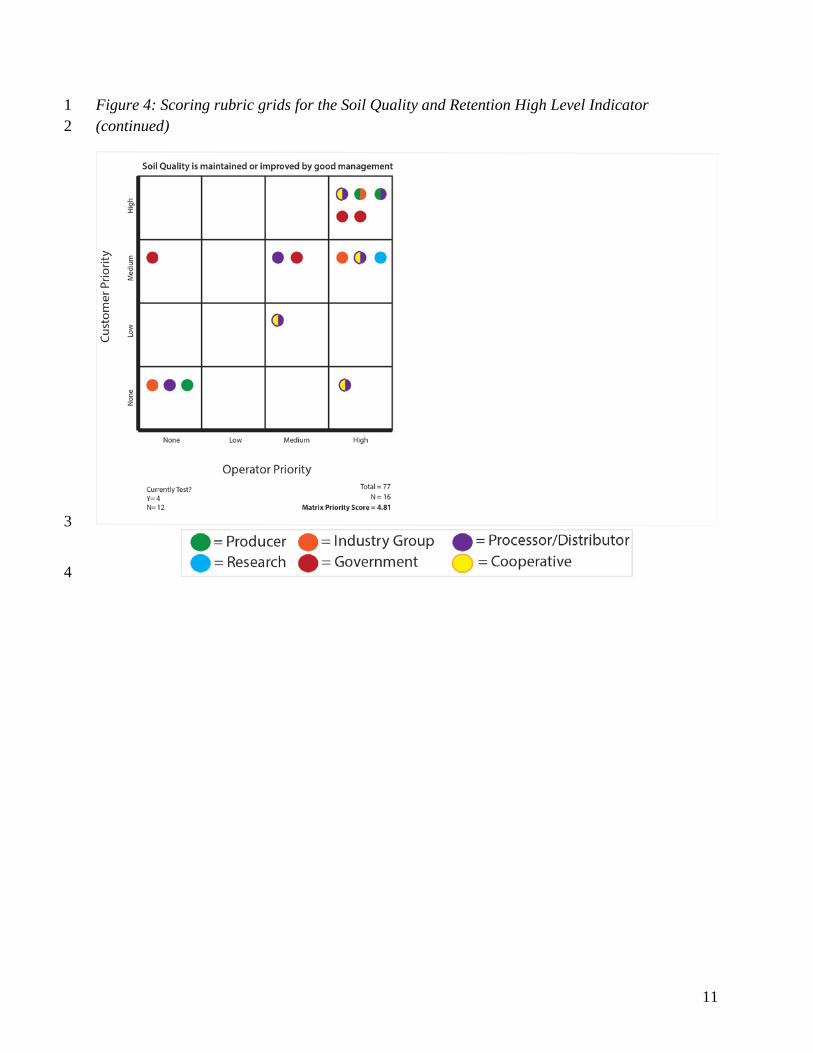
The scores for the Survey results for the Soil Quality & Retention High Level Criteria are shown 2 in Table 2. Results are arranged from highest to lowest Matrix Priority Score. The metric “Soil 3 quality is maintained or improved by good management practices” had the highest score. The 4 table shows that 25% of the survey respondents are currently measuring the metric. The majority 5 of responders, across all sectors, indicated this metric is medium to high priority for both 6 operators and customers. 7
Table 2: Scores derived from rubric grid plots of Survey results for the Soil Quality & 8 Retention High Level Criteria. KPI metrics are ordered from highest to lowest Matrix Priority 9 Score. 10
SOIL QUALITY & RETENTION High Level Criteria Key Performance Indicator Metric
Total (T)
Data points
(N)
Matrix Priority Score
Currently measure metric
(% Yes) Soil quality is maintained or improved by good management practices 77 16 4.81 25%
Total Organic Carbon (TOC), (g/kg) in soil is monitored & maintained 68 16 4.25 24%
Percent (%) of feed grown with sustainability certification 64 16 4.00 13%
Soil Erosion (tons per hectare) is monitored & minimized 64 16 4.00 6%
Soil aggregate stability is monitored & maintained 56 16 3.50 12% T= total rubric points for the survey responses, 11 N= number of survey responses for the metric, 12 Matrix Priority Score = T/N, 13 % Yes = the percentage of “yes” responses to the question “Do you measure this metric?” 14
15
16
17
18
19
20
21
22

10
Figure 4:Scoring rubric grids for the Soil Quality and Retention High 1 Level Indicator 2
3
4
11
Figure 4: Scoring rubric grids for the Soil Quality and Retention High Level Indicator 1 (continued) 2
3
4

12
4.3. Biodiversity 1
The scores for the Survey results for the Biodiversity High Level Criteria are shown in Table 3. 2 Results are arranged from highest to lowest Matrix Priority Score. The metric “Native vegetation 3 is preserved where possible, to improve on-farm biodiversity” had the highest score. The table 4 shows that 29% of the survey respondents are currently measuring the metric. 5
Table 3:Scores derived from rubric grid plots of Survey results for the 6 Biodiversity High Level Criteria. KPI metrics are ordered from highest 7 to lowest Matrix Priority Score. 8
BIODIVERSITY High Level Criteria Key Performance Indicator Metric
Total (T)
Data points
(N)
Matrix Priority Score
Currently measure metric
(% Yes) Native vegetation is preserved where possible, to improve on-farm biodiversity 70 14 5.00 29%
“No Net Loss” principles for critical habitat are followed 67 14 4.79 14%
No hunting of rare, threatened or endangered species takes place on the property 65 14 4.64 33%
Riparian zones left undisturbed (% of suppliers) 60 13 4.62 21% Environmental management programs utilized (% of suppliers) 66 15 4.40 29%
Percent (%) of feed grown with sustainability certification 60 14 4.29 7%
FSC packaging used (% of total packaging purchased) 55 13 4.23 29%
Area of native trees (hectares) left undisturbed or planted 58 14 4.14 21%
Shelterbelt planting zones utilized (% of suppliers) 51 13 3.92 13% Habitat corridors utilized (% of suppliers) 46 13 3.54 0%
T= total rubric points for the survey responses, 9 N= number of survey responses for the metric, 10 Matrix Priority Score = T/N, 11 % Yes = the percentage of “yes” responses to the question “Do you measure this metric?” 12
13
14
15
16

13
Figure 5:Scoring rubric grids for the Biodiversity High Level Indicator 1
2
3

14
Figure 5: Scoring rubric grids for the Biodiversity High Level Indicator (continued) 1
2
3

15
Figure 5: Scoring rubric grids for the Biodiversity High Level Indicator (continued) 1
2
3

16
4.4. Water Availability & Quality 1
The scores for the Survey results for the Water Availability & Quality High Level Criteria are 2 shown in Table 4. Results are arranged from highest to lowest Matrix Priority Score. The metric 3 “Water quality testing is routinely conducted” had the highest score. The scoring rubric grid 4 (Appendix 5) shows that over half of the data points fell in the top right square of the grid, 5 indicating that most responders felt the metric was very important to both the operation and 6 customer. The table shows that 71% of the survey respondents are currently measuring the metric. 7 Results were similar for the next lower scoring metrics; “Effluent management plan in place to 8 minimize impacts to water quality,” “Any localized contamination of ground or surface water is 9 reported to local authorities,” “Nutrient management plan in place to minimize impacts to water 10 quality,” and “The quality & supply of surface & ground water is maintained and improved” all 11 had greater than 60% of the data points in the upper right quadrant, indicating that most responders 12 felt that each of these metrics were somewhat to very important to their operation and to their 13 customers. 14
15

17
Table 4: Scores derived from rubric grid plots of Survey results for the 1 Water Availability & Quality High Level Criteria. KPI metrics are 2 ordered from highest to lowest Matrix Priority Score. 3
WATER AVAILABILITY & QUALITY High Level Criteria Key Performance Indicator Metric
Total (T)
Data points
(N)
Matrix Priority Score
Currently measure metric
(% Yes) Water quality testing is routinely conducted 88 14 6.29 71% Effluent management plan in place to minimize impacts to water quality 79 14 5.64 53%
Any localized contamination of ground or surface water is reported to local authorities 75 14 5.36 67%
Nutrient management plan in place to minimize impacts to water quality 75 14 5.36 40%
The quality & supply of surface & ground water is maintained and improved 68 13 5.23 47%
Water consumption (L/kg of finished product) is monitored and a plan is in place to minimize consumption
73 14 5.21 53%
Water recycling and re-use implemented 77 15 5.13 50% Good irrigation management practices are used to improve water use efficiency and reduce waste 73 15 4.87 50%
Natural wetlands are not drained and native vegetation is maintained 63 13 4.85 21%
Riparian plans are in place and implemented for waterways & wetlands 59 13 4.54 36%
Blue water footprint (L per unit product) is monitored to reduce wasteful water use 63 14 4.50 33%
Fertilizer application and irrigation scheduling coordinated with weather 67 15 4.47 31%
Waterways are fenced off to exclude stock 60 14 4.29 36% Incidents of algal bloom or water pollution directly related to production are monitored and a plan is in place to minimize events
52 13 4.00 36%
WRI aquaduct is utilized for planning & assessment 38 13 2.92 7%
T= total rubric points for the survey responses, 4 N= number of survey responses for the metric, 5 Matrix Priority Score = T/N, 6 % Yes = the percentage of “yes” responses to the question “Do you measure this metric?” 7
8
9

18
Figure 6:Scoring rubric grids for the Water Availability & Quality High 1 Level Indicator 2
3
4

19
Figure 6: Scoring rubric grids for the Water Availability & Quality High Level Indicator 1 (continued) 2
3
4

20
Figure 6: Scoring rubric grids for the Water Availability & Quality High Level Indicator 1 (continued) 2
3
4

21
Figure 6: Scoring rubric grids for the Water Availability & Quality High Level Indicator 1 (continued) 2
3
4
22
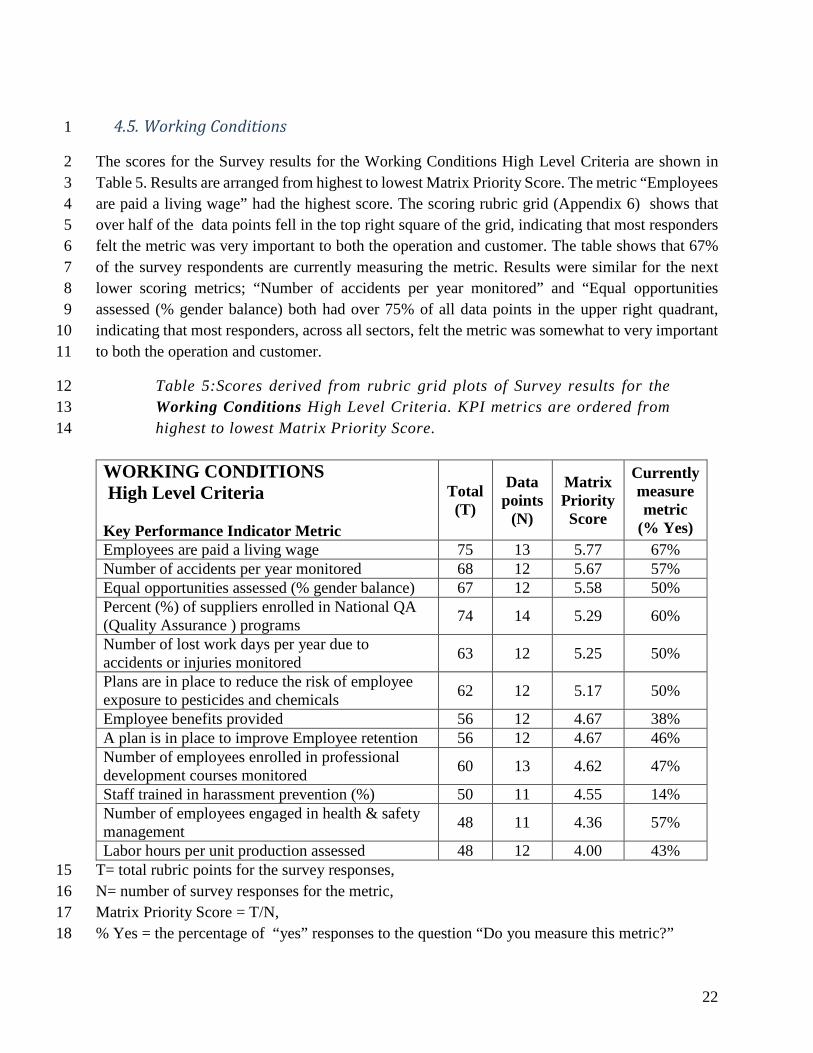
4.5. Working Conditions 1
The scores for the Survey results for the Working Conditions High Level Criteria are shown in 2 Table 5. Results are arranged from highest to lowest Matrix Priority Score. The metric “Employees 3 are paid a living wage” had the highest score. The scoring rubric grid (Appendix 6) shows that 4 over half of the data points fell in the top right square of the grid, indicating that most responders 5 felt the metric was very important to both the operation and customer. The table shows that 67% 6 of the survey respondents are currently measuring the metric. Results were similar for the next 7 lower scoring metrics; “Number of accidents per year monitored” and “Equal opportunities 8 assessed (% gender balance) both had over 75% of all data points in the upper right quadrant, 9 indicating that most responders, across all sectors, felt the metric was somewhat to very important 10 to both the operation and customer. 11
Table 5:Scores derived from rubric grid plots of Survey results for the 12 Working Conditions High Level Criteria. KPI metrics are ordered from 13 highest to lowest Matrix Priority Score. 14
WORKING CONDITIONS High Level Criteria Key Performance Indicator Metric
Total (T)
Data points
(N)
Matrix Priority Score
Currently measure metric
(% Yes) Employees are paid a living wage 75 13 5.77 67% Number of accidents per year monitored 68 12 5.67 57% Equal opportunities assessed (% gender balance) 67 12 5.58 50% Percent (%) of suppliers enrolled in National QA (Quality Assurance ) programs 74 14 5.29 60%
Number of lost work days per year due to accidents or injuries monitored 63 12 5.25 50%
Plans are in place to reduce the risk of employee exposure to pesticides and chemicals 62 12 5.17 50%
Employee benefits provided 56 12 4.67 38% A plan is in place to improve Employee retention 56 12 4.67 46% Number of employees enrolled in professional development courses monitored 60 13 4.62 47%
Staff trained in harassment prevention (%) 50 11 4.55 14% Number of employees engaged in health & safety management 48 11 4.36 57%
Labor hours per unit production assessed 48 12 4.00 43% T= total rubric points for the survey responses, 15 N= number of survey responses for the metric, 16 Matrix Priority Score = T/N, 17 % Yes = the percentage of “yes” responses to the question “Do you measure this metric?” 18

23
Figure 7:Scoring rubric grids for the Working Conditions Level Indicator 1
2
3

24
Figure 7: Scoring rubric grids for the Working Conditions Level Indicator (continued) 1
2
3

25
Figure 7: Scoring rubric grids for the Working Conditions Level Indicator (continued) 1
2
3

26
5. APPENDIX: SURVEY WITH INTRODUCTION AND DEFINITIONS 1
2
We are conducting this survey to better understand the performance indicators that are most 3 important to DSF members to track and improve High Level Criteria. High Level Criteria 4 explored in this survey include Soil Quality & Retention, Soil Nutrients, 5
Biodiversity, Water Availability & Quality, and Working Conditions. Definitions of 6 terminology and information regarding potential performance indicators are included. Questions 7 that don't apply to your operation can be left unanswered. 8
9
10
Name
Organization
Address
Contact Information
Email Address
Phone
Other sustainability Programs you participate in
11
12
13
14

27
1
High Level Criteria Soil Nutrients
How helpful would this
metric be for your operation?
How important would this
metric be for your customers?
Do you measure
this metric?
0 = Not Important at all 1 = Minimally Important 2 = Somewhat Important 3 = Very Important
Performance Indicators 0 1 2 3 0 1 2 3 Yes No
Soil nutrient testing is conducted routinely
Nutrient management plan in place to optimize nutrient application (C,N,P,K, and S)
Soil pH levels are measured Total Nitrogen (kg per hectare) is analyzed to inform fertilization plans
Soil Test Phosphorus (STP) is analyzed to inform fertilization plans
Percent (%) of suppliers completing nutrient management plan
Percent (%) of suppliers using an effluent management plan
What other soil nutrient metrics do you think should be considered?
2
3

28
High Level Criteria Soil Quality & Retention
How helpful would this
metric be for your operation?
How important would this
metric be for your customers?
Do you measure
this metric?
0 = Not Important at all 1 = Minimally Important 2 = Somewhat Important 3 = Very Important
Performance Indicators 0 1 2 3 0 1 2 3 Yes No
Percent (%) of feed grown with sustainability certification
Total Organic Carbon (TOC), (g/kg) in soil is monitored and maintained
Soil aggregate stability is monitored & maintained Soil Erosion (tons per hectare) is monitored & minimized
Soil quality is maintained or improved by good management practices.
What other soil quality & retention metrics do you think should be considered?
1
2
29
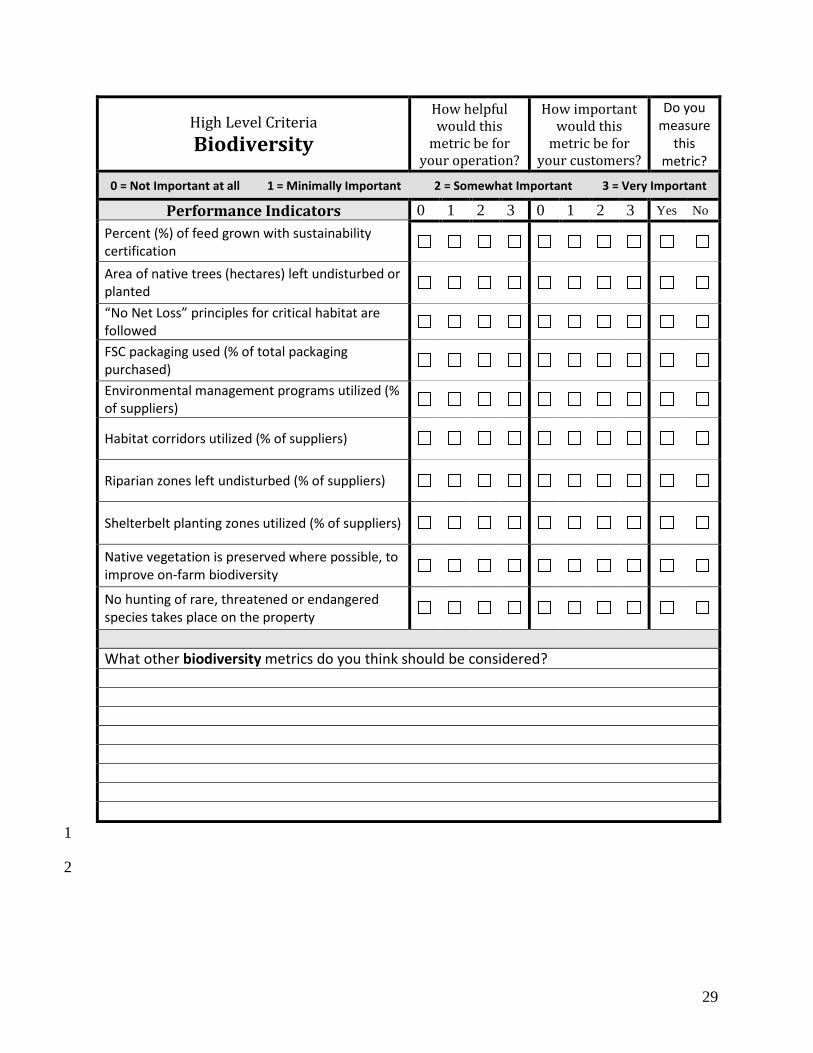
High Level Criteria Biodiversity
How helpful would this
metric be for your operation?
How important would this
metric be for your customers?
Do you measure
this metric?
0 = Not Important at all 1 = Minimally Important 2 = Somewhat Important 3 = Very Important
Performance Indicators 0 1 2 3 0 1 2 3 Yes No
Percent (%) of feed grown with sustainability certification
Area of native trees (hectares) left undisturbed or planted
“No Net Loss” principles for critical habitat are followed
FSC packaging used (% of total packaging purchased)
Environmental management programs utilized (% of suppliers)
Habitat corridors utilized (% of suppliers)
Riparian zones left undisturbed (% of suppliers)
Shelterbelt planting zones utilized (% of suppliers)
Native vegetation is preserved where possible, to improve on-farm biodiversity
No hunting of rare, threatened or endangered species takes place on the property
What other biodiversity metrics do you think should be considered?
1
2

30
High Level Criteria Water Availability & Quality
How helpful would this
metric be for your operation?
How important would this
metric be for your customers?
Do you measure
this metric?
0 = Not Important at all 1 = Minimally Important 2 = Somewhat Important 3 = Very Important
Performance Indicators 0 1 2 3 0 1 2 3 Yes No WRI aquaduct is utilized for planning & assessment
Blue water footprint (L per unit product) is monitored to reduce wasteful water use
Incidents of algal bloom or water pollution directly related to production are monitored and a plan is in place to minimize events
Any localized contamination of ground or surface water is reported to local authorities
Water quality testing is routinely conducted Water consumption (L/kg of finished product) is monitored and a plan is in place to minimize consumption
Good irrigation management practices are used to improve water use efficiency and reduce waste
Nutrient management plan in place to minimize impacts to water quality
Effluent management plan in place to minimize impacts to water quality
Fertilizer application and irrigation scheduling coordinated with weather
Water recycling and re-use implemented Waterways are fenced off to exclude stock Riparian plans are in place and implemented for waterways & wetlands
The quality & supply of surface & ground water is maintained and improved
Natural wetlands are not drained and native vegetation is maintained
What other Water Availability & Quality metrics do you think should be considered?
1

31
High Level Criteria Working Conditions
How helpful would this
metric be for your operation?
How important would this
metric be for your customers?
Do you measure
this metric?
0 = Not Important at all 1 = Minimally Important 2 = Somewhat Important 3 = Very Important
Performance Indicators 0 1 2 3 0 1 2 3 Yes No Percent (%) of suppliers enrolled in National QA (Quality Assurance ) programs
Equal opportunities assessed (% gender balance) Employees are paid a living wage Staff trained in harassment prevention (%) Number of accidents per year monitored Number of lost work days per year due to accidents or injuries monitored
Number of employees enrolled in professional development courses monitored
Labor hours per unit production assessed
Employee benefits provided
A plan is in place to improve Employee retention Number of employees engaged in health & safety management
Plans are in place to reduce the risk of employee exposure to pesticides and chemicals
What other Working Conditions metrics do you think should be considered?
1
2

32
SOIL NUTRIENT DEFINITIONS & INFORMATION 1
Soil nutrient testing: Annual soil nutrient testing provides information required to optimize fertilizer 2 application to maintain proper nutrient requirements of plants while minimizing nutrient runoff. 3
Nutrient management plans document practices and strategies adopted by livestock operations to 4 address soil erosion and management and disposal of livestock manure to minimize water contamination. 5
Soil pH levels: pH tests measure the acidity and alkalinity in soils. pH levels affect plant productivity and 6 fertilizer efficacy. 7
Total Nitrogen: The total amount of nitrogen in the soil, including all forms, both available and 8 unavailable to plants. 9
Soil Test Phosphorus: There are multiple soil tests for phosphorus. The appropriate test is determined by 10 soil pH and other factors, and results provide an index of availability. Results are correlated and calibrated 11 with crop response to applied phosphorus. Soil tests can minimize over application of phosphorus to 12 fields. Manure has high levels of phosphorus, and surface runoff from livestock operations can increase 13 eutrophication of water bodies and cause ecological and health problems. 14
Effluent Management Plan (EMP): An EMP documents the practices and strategies adopted by 15 livestock operations or food production facilities to manage effluent (liquid waste stream from milking 16 sheds and yards or from food production). Effluent can be a usable nutrient source, but can harm 17 waterways if not properly managed. Management plans vary depending on the operation and may include 18 continuous application or treatment and storage. 19
20
SOIL QUALITY & RETENTION DEFINITIONS & INFORMATION 21
Sustainability certification: There are many effective sustainability programs available. Effective 22 sustainability programs incorporate quantitative measures and are based on continuous improvement 23 principles. 24
Soil Total Organic Carbon (TOC): TOC tests measure the carbon stored in soil organic matter. TOC 25 affects nutrient holding capacity and soil stability. 26
Soil Aggregate stability (SAS): SAS indicates the ability of soil aggregates to resist disruption from 27 outside forces (usually water). Dry aggregate stability (DAS) generally refers to the ability of soil 28 aggregates to resist disruption from wind forces. Aggregation affects erosion, plant growth, and water 29 movement. 30
Soil Erosion: Erosion is the wearing away of topsoil by natural forces (wind and water) and human 31 activities (tillage and soil disturbance) and livestock (soil disturbance and compaction). Erosion reduces 32 soil quality, and can cause sedimentation and eutrophication of water bodies. 33
34

33
BIODIVERSITY DEFINITIONS & INFORMATION 1
Sustainability certification: There are many effective sustainability programs available. Effective 2 sustainability programs incorporate quantitative measures and are based on continuous improvement 3 principles. 4
Area of native trees undisturbed or planted (hectares): Retaining areas of native trees allows for 5 increased biodiversity and provides habitat for local wildlife. 6 “No Net Loss” principles followed: “No Net Loss” is the US standard for wetland preservation by 7 which the total acreage of wetlands does not decrease. It requires that all acreage of wetlands lost is 8 balanced by wetland reclamation and restoration. “No Net Loss” principles provide a standard 9 for habitat preservation by which the total acreage of critical habitat does not decrease. It requires that all 10 acreage of critical habitat lost is balanced by habitat reclamation and restoration. 11
12
FSC packaging: The Forest Stewardship Council (FSC) provides standards for forest protection. FSC 13 certified packaging is sourced from well-managed forests and recycled sources. 14 Environmental management programs: Environmental management plans document practices and 15 strategies to address environmental factors. In the US the National Institute of Environmental Health 16 Sciences (NIEHS) has established environmental management programs which were to assure 17 compliance with local environmental regulations. Established programs exist for solid waste 18 management, green purchasing, pesticides, stormwater management, and more. 19 Habitat Corridors: A habitat corridor is an area of habitat which connects wildlife populations across 20 human developments. This connection of populations increases biodiversity and moderates the effects of 21 habitat fragmentation. 22 Riparian zones left undisturbed: Riparian zones exist along the banks of rivers or streams and are one 23 of the fifteen terrestrial biomes. As a transition zone between land and water, these areas provide 24 biodiversity and are important for maintaining ecological functions of the waterbody and for reducing the 25 flow of sediment and nutrients into waterways. 26 Shelterbelt planting zones utilized: Shelterbelts are rows of trees or shrubs which are planted to provide 27 a barrier to wind. These zones reduce soil erosion, protect plants from wind damage, manage snow 28 deposits, and provide shelter for wildlife. 29
30

34
WATER AVAILABILITY & QUALITY DEFINITIONS & INFORMATION 1
WRI Aquaduct: The World Resources Institute Aquaduct program measures and maps water risks 2 globally. Aquaduct provides maps, data, and charts that help companies and governments understand 3 water scarcity and flooding risks. This data may be used inform decisions based on risks and 4 opportunities that are emerging globally. 5
Blue Water Footprint: The water footprint is the amount of water used to produce goods and services. 6 The blue water footprint is the amount of water sourced from surface or groundwater resources that is 7 evaporated, incorporated into a product, or moved from one body of water to another, or returned later in 8 time. Agricultural irrigation, industry use and domestic water use can all have a blue water footprint. 9 Calculating the blue water footprint allows farmers, industries and governments to find ways to optimize 10 water usage and reduce waste or water shortages. 11
Algal blooms: An algal bloom is rapid growth or accumulation of the algae and/or Cyanobacteria 12 population in a natural water system, sometimes caused by an overabundance of nutrients from 13 agricultural or industrial runoff. Harmful Algal blooms are algal blooms that injure animals or the 14 environment. These blooms can result in fish die-offs and inability to use a water source for drinking. 15
Water quality testing provides information regarding nutrients and other pollutants in the water. Water 16 that will be used in food products should be tested for safety of human consumption. Testing the quality 17 of water from waterways that come in contact with livestock operations or industrial/food production can 18 help inform management plans created to reduce pollution. 19
Water consumption is measured in volume of water per volume of product, and is the amount of water 20 used in production and not returned to the source. Total water use includes water consumed as well as 21 water that is returned to the water resource. An awareness of water consumption can inform management 22 plans in order to reduce overall water usage. 23
Utilizing weather forecasts and patterns to inform fertilizer and irrigation timing helps reduce nutrient 24 runoff and water consumption. 25
Water recycling and re-use can reduce water consumption. 26
Fencing livestock out of waterways reduces water bank damage, sedimentation, and manure and nutrient 27 waste in water bodies. 28
Riparian plans document practices and strategies adopted to maintain a natural area along waterways. 29 Riparian vegetation protect water quality by providing a buffer to waterways against sediment, nutrients, 30 and pollutants. Riparian vegetation reduces runoff and improves infiltration so that more precipitation 31 reaches the groundwater supply, and can also reduce the number and severity of flood events. 32
33

35
WORKING CONDITIONS DEFINITIONS & INFORMATION 1
National QA programs: Local governments may regulate standardized Quality Assurance (QA) 2 programs to ensure that products and processes meet certain requirements. 3 Equal opportunities (% gender balance): Increased employment opportunities for women, and an even 4 gender balance in employees at all levels of management, can increase economic vitality of a community. 5 Living wage: A living wage is the minimum income necessary for a worker to meet their basic needs. 6 This is higher than a subsistence wage, or the biological minimum. A living wage includes shelter, 7 clothing, utilities, transport, food, and healthcare for a person working forty hours a week with no 8 additional income. 9 Harassment prevention training: Workplace harassment can pose a barrier to employment for 10 vulnerable populations. Training in harassment prevention may reduce this barrier and increase economic 11 opportunities for these populations. 12 Number of accidents per year: Accidents can cause personal physical harm and environmental, social, 13 and economic damage. Tracking the occurrence of accidents and working to minimize them improves 14 worker, community, and environmental safety. 15 Lost work days: The loss of labor and time to accidents may increase the damage caused by the accident. 16 Professional development courses: Professional development courses provide opportunities for 17 economic advancement for employees. 18 Labor hours per unit production: The number of labor hours required to produce a unit of goods 19 indicates the efficiency of production. 20 Employee benefits provided: Employee benefits like health insurance or retirement plans increase 21 quality of life for employees. 22 Employee retention: A low employee retention rate may indicate poor working conditions. 23 Health & safety management: Resources devoted to health and safety of employees may help reduce 24 accidents and improve working conditions. 25 Risk of employee exposure to pesticides and chemicals: Employee exposure to pesticides and 26 chemicals poses a health risk to the employee and possibly those who come into contact with the 27 employee. 28
29

36
1