status of business activities...130,709 1,462 3,415 3,950 139,537 (112 ) 139,425 year-on-year (%)...
TRANSCRIPT

4241
1. Overview of Business Performance
(1) Business PerformanceDuring the consolidated fiscal year under review, the future direction of the Japanese economy remained unclear with a
slowdown in China and other emerging nations combined with a shift from a weak yen to strong yen to prompt expectations of a decline in corporate results which had been generally improving prior to those developments.
Against this economic backdrop, the Group’s primary waste treatment plant business benefitted from planned upgrades and improvements in superannuated facilities due to efforts to prevent global warming and to conserve resources and energy as a result of rising environmental awareness. Demand for biomass power plants is also expected to continue as a result of energy policies such as the feed-in tariff system for electricity generated from renewable sources.
Looking to our business performance during the consolidated fiscal year under review, we received a steady flow of orders for construction projects involving biomass power plants amidst numerous inquiries, and we also received orders for primary equipment upgrades and periodical maintenance at waste treatment facilities as well as for the operation and management of such facilities. However, a lack of orders for construction of waste treatment plants until this April caused order volume to fall 13,843 million yen (12.2%) from the previous consolidated fiscal year to 99,919 million yen.
Net sales rose 9,213 million yen (8.9%) from the previous consolidated fiscal year to 113,088 million yen on significant progress in the construction of waste treatment plants that were ordered during the previous fiscal year, leaving an outstanding order balance of 139,425 million yen.
Operating income increased 966 million yen (11.8%) from the previous consolidated fiscal year to 9,189 million yen on the increase in net sales. Although non-operating income fell due to factors including the elimination of negative goodwill amortization, ordinary income rose 530 million yen (5.8%) from the previous consolidated fiscal year to 9,646 million yen. The absence of any extraordinary gains combined with a decline in extraordinary losses and an increase in tax expenses resulting from a decline in loss carried forward resulted in profit attributable to owners of the parent to fall 213 million yen (2.6%) from the previous consolidated fiscal year to 7,817 million yen.
Results by Business Segment
Domestic Environment and Energy
In addition to receiving a steady flow of orders amidst numerous inquiries for construction projects involving biomass power plants, we received orders for primary equipment upgrades and periodical maintenance at waste treatment facilities as well as for the operation and management of such facilities. However, a lack of orders for construction of waste treatment plants until this April caused order volume to fall 12,431 million yen (14.1%) from the previous consolidated fiscal year to 75,609 million yen. Nonetheless, net sales rose 8,532 million yen (10.7%) from the previous consolidated fiscal year to 88,494 million yen on the back of major progress in the construction of waste treatment plants ordered during the previous fiscal year.
Operating income rose 935 million yen (10.5%) from the previous consolidated fiscal year to 9,834 million yen thanks to an increase in net sales.
Overseas Environment and Energy
Order volume fell 1,342 million yen (60.9%) from the previous consolidated fiscal year to 861 million yen as a failure to receive any orders for biomass power boilers during the consolidated fiscal year under review offset orders for maintenance of overseas plants. Net sales fell 577 million yen (41.0%) from the previous consolidated fiscal year to 830 million yen, reflecting the fact that none of the biomass power boilers for which we have previously received orders are at a stage of construction in which significant progress can be made.
Performance declined as operating income of 2 million yen during the previous consolidated fiscal year turned into an operating loss of 223 million yen.
Package Boiler
Despite efforts to secure upgrade demand for high-efficiency once-through boilers and vacuum-type water heaters and maintenance demand for parts sales and repairs, order volume fell 203 million yen (1.2%) from the previous consolidated fiscal year to 16,450 million yen. Net sales fell 214 million yen (1.3%) from the previous consolidated fiscal year to 16,390 million yen.
Operating income fell 2 million yen (0.2%) from the previous consolidated fiscal year to 896 million yen.
Equipment and System Business
Order volume rose 192 million yen (2.7%) from the previous consolidated fiscal year to 7,331 million yen thanks to growth in orders for building equipment and a steady flow of orders for semiconductor-related equipment. Net sales rose 1,516 million yen (24.7%) from the previous consolidated fiscal year to 7,663 million yen.
Operating income rose 305 million yen (665.3%) from the previous consolidated fiscal year to 351 million yen.
(2) Status of Cash FlowCash and cash equivalents at the end of the consolidated fiscal year under review rose 3,327 million yen from the previous
consolidated fiscal year to 48,335 million yen.
Cash Flows from Operating ActivitiesNet cash provided by operating activities totaled 6,728 million yen (compared to net cash provided by operating activities
of 21,727 million yen during the previous consolidated fiscal year). Principal factors included net income before taxes of 9,379 million yen as an increase of 6,867 million yen in accounts payable offset decreases of 7,951 million yen and 1,731 million yen in receivables and provision for loss on construction contracts, respectively.
Cash Flows from Investing ActivitiesNet cash used in investing activities totaled 445 million yen (compared to net cash used in investing activities of 160
million yen during the previous consolidated fiscal year). Income of 243 million yen from collection of loans receivable was offset by expenditures of 656 million yen on the purchase of property, plant and equipment.
Cash Flows from Financing ActivitiesNet cash used in financing activities totaled 2,900 million yen (compared to net cash used in financing activities of 3,707
million yen during the previous consolidated fiscal year). Principal factors included expenditures of 1,896 million yen on repayment of long-term debt and payment of 827 million yen as dividends.
2. Production Output, Orders Received and Sales(1) Production Results
The following table summarizes the Group’s production results during the consolidated fiscal year under review by business segment:
(2) Orders ReceivedThe following table summarizes orders received by the Takuma Group during the consolidated fiscal year under review by
business segment:
Notes: 1. Amounts are expressed as total manufacturing expenses.2. Amounts do not include consumption tax or other taxes.
Production output(millions of yen)
Year-on-year(%)Segment
Domestic Environment and Energy
Overseas Environment and Energy
Package Boiler
Equipment and System Business
Internal transactions between segments
64,195
830
10,602
6,456
82,084
(279 )
81,805
13.9
(2.9 )
(3.3 )
23.3
11.8
25.9
11.7
Subtotal
Total
Notes:1. Amounts do not include consumption tax or other taxes.2. Package Boiler figures include some speculative production. In addition to order-driven production, the order volume and order balance
figures in the above table include that portion of speculative production for which delivery to a specific customer has been finalized.
Orders received(millions of yen)
Year-on-year(%)Segment
Domestic Environment and Energy
Overseas Environment and Energy
Package Boiler
Equipment and System Business
Inter-segment order volume
75,609
861
16,450
7,331
100,251
(332 )
99,919
(14.1 )
(60.9 )
(1.2 )
2.7
(12.1 )
21.2
(12.2 )
Backlog(millions of yen)
130,709
1,462
3,415
3,950
139,537
(112 )
139,425
Year-on-year(%)
(9.0 )
2.2
1.8
(7.8 )
(8.6 )
59.3
(8.6 )
Subtotal
Total
Financial Information
Status of Business Activities
TAKUMA 2016 ANNUAL REPORTTAKUMA 2016 ANNUAL REPORT

4443 TAKUMA 2016 ANNUAL REPORTTAKUMA 2016 ANNUAL REPORT
3. 11th Midium-Term Management Plan (FY2015 to FY2017)(1) Target Management Indicators
The Group considers consolidated ordinary income to be its most important management indicator. The 11th Medium-Term Management Plan sets forth the following quantitative targets in an effort to steadily expand our
business in terms of both quantity and quality so as to facilitate sustained growth (all figures consolidated-basis):① Cumulative order volume during plan term (FY2015 to FY2017): 400.0 billion yen② Cumulative net sales during plan term (FY2015 to FY2017): 360.0 billion yen③ Cumulative ordinary income during plan term (FY2015 to FY2017): 27.0 billion yen
(2) Policies① Maintenance and expansion of market position in the EPC business② Expansion of businesses that generate base profits③ Initiatives that target growth markets④ Further enhancement of the company’s financial strength⑤ Human resources management⑥ Cultivation of a robust organizational culture
4. Business and Other RisksAlthough the Takuma Group strives to neutralize business and other risks on an organizational and systematic basis, we
believe the risks described below may influence investor decisions due to their potential to impact operating performance, financial standing, and other aspects of the Group’s operations.
Forward-looking statements represent the Group’s judgment as of the end of the consolidated fiscal year under review.
• Economic trendsThe Group’s operating performance and financial standing may be impacted by trends in public investment and private
capital investment, structural changes in price competitiveness and markets due to factors such as entry of new companies into the market, changes in the pricing of raw materials and other inputs, stock market conditions, and other factors.
• Natural disastersLarge natural disasters such as earthquakes, storms, and flooding may impact the Group’s operations.
• Country riskAs the Group expands its business operations overseas, it becomes exposed to the potential impact not only of economic
conditions and exchange-rate fluctuations in the countries in which it operates, but also of acts of God such as regional terrorism, conflict, natural disasters, and infectious disease.
(3) SalesThe following table summarizes the Takuma Group’s sales results during the consolidated fiscal year under review by
business segment:
Note:Amounts do not include consumption tax or other taxes.
Sales amount(millions of yen)
Year-on-year(%)Segment
Domestic Environment and Energy
Overseas Environment and Energy
Package Boiler
Equipment and System Business
Inter-segment sales
88,494
830
16,390
7,663
113,378
(290 )
113,088
10.7
(41.0 )
(1.3 )
24.7
8.9
17.8
8.9
Subtotal
Total
Financial Information
• Safety and qualityOperating performance, financial standing, reputation, and other aspects of the Group’s operations may be impacted by
accidents or incidents caused by human error or product defects occurring during the manufacture, installation or construction, operational management, or subsequent use of Group products. In addition, the Group may be affected by unanticipated cost overruns or other adverse developments due to unforeseen issues or other problems at plants and other facilities for which it has received orders, in particular when new technologies are introduced or deployed.
• Intellectual property rightsThe Group’s business activities may be impacted if it becomes unable to protect intellectual property rights such as
patents and trademarks that it owns or has acquired, if those rights are infringed upon by other parties, or if the Group must take steps to avoid infringing on the intellectual property rights of other parties.
• Other risksThe Group’s operating performance and financial standing may be impacted in a variety of ways by factors such as
government regulations, vendor supply capability, its ability to hire and retain human resources in Japan and abroad, loss of key personnel, lawsuits, and other contingencies as it carries out its business activities.
5. Research and Development ActivitiesHaving identified the fields of environmental protection and renewable energy utilization as its principal business domains
in an effort to achieve a sustainable, recycling-oriented society that is not excessively dependent on nuclear power or fossil fuels, the Takuma Group is focusing its management resources on business in these domains as it pursues research and development in keeping with the corporate vision it has set forth of being an indispensable presence in society as a leading company.
The Takuma Group has consolidated its technology-related departments into the Engineering Group, through which it is actively working to strengthen and pass on its technological capabilities and develop new technologies, products, and services through collaboration between the Takuma Group companies and joint research with outside research institutions and universities.
Expenditures on research and development during the consolidated fiscal year under review totaled 743 million yen. Principal research and development activities by business segment were as follows:
(1) Environment and Energy① In the area of waste treatment, we constructed a demonstration incinerator with a next-generation stoker (with a
processing capacity of 10 tons per day) at one of our plants with the principal goal of developing proprietary technology to aid in reducing life cycle cost and boosting energy recovery. We are utilizing this demonstration incinerator to carry out development into such aspects of equipment operation as the reduction of harmful substances (e.g., nitrogen oxides and dioxins) through combustion improvements and increases in power generation efficiency. We also completed development, and began sales, of a safe, inexpensive, and high-efficiency nitrogen oxide reduction system that uses urea instead of ammonia gas. Furthermore, we continue to conduct trials to verify that use of water-cooled stokers, which have a track record of standing up to the demands of use in industrial waste incinerators over extended periods of time, in municipal waste incinerators can reduce maintenance and management costs compared to conventional air-cooled stokers due to their improved durability. These trials include efforts to address material improvements.
② In the area of energy, we continue to develop constituent technologies for burning a variety of fuels including unutilized wood biomass to generate power, an area in which we are receiving many inquiries in connection with Japan’s new feed-in tariff program for power generated from renewable sources. We are also developing technology for effectively utilizing combustion ash from wood biomass as a Forestry Agency subsidy project, and we have adopted the goal of using that resource as fertilizer.
③ In the area of water treatment, we continued to develop a sewage sludge incineration and power generation system as well as a new system for eliminating nitrogen by means of the anammox process. For sewage sludge incineration and power generation, we developed and commercialized technology for generating power by incinerating sewage sludge without the need for an auxiliary fuel—an accomplishment previously thought to have been impossible—and for significantly lowering emissions of greenhouse gases compared to applicable Ministry of the Environment ordinances. Furthermore, we carried out trials in mixed fuel combustion with dried sludge and screen residue (an impurity contained in sewage) as part of an effort to broaden the range of conditions and applications in which the system can be used. We also developed technology for use with the anammox process to make significant reductions possible in facility construction, maintenance, management, and other costs as well as in energy use compared to conventional technologies. We continue to conduct research in an effort to achieve even greater cost reductions and to broaden the range of conditions and applications in which these technologies can be used. The research and development budget for this segment of our business was 598 million yen.

4645 TAKUMA 2016 ANNUAL REPORTTAKUMA 2016 ANNUAL REPORT
(2) Package BoilerWe developed and launched new models in our Eqos series of once-through boilers, which deliver quieter performance
and reduced CO2 emissions thanks to a more energy-efficient design. These newly developed models are described below.In addition to delivering quieter operation than previous models, the oil-fired EQS-101 to 301 and gas-fired EQS-121 to
351 once-though boilers feature improved operability in the form of additional display items on the control panel and improvements in how information is displayed along with additional capabilities such as functionality for controlling automatic chemical injection. In addition, we developed the gas-fired EQRH-1001 once-through boiler as part of a joint project with Tokyo Gas Co., Ltd.; Osaka Gas Co., Ltd.; and Toho Gas Co., Ltd. The new boiler not only delivers higher operating efficiency by being the first boiler of its kind to use four-point combustion control to reduce the number of combustion start and stop events, but also features a fan that consumes less power and produces less noise. Furthermore, the gas-fired EQi(H)-6001 compact boiler features a high-efficiency, low-noise, space-saving design that uses proportional integration control to deliver stable steam pressure and high-quality steam.
The research and development budget for this segment of our business was 41 million yen.
(3) Equipment and System BusinessReacting to expectations that the development of the Internet of Things (IoT) will spur growth in demand for small-radius
wafer (the material used as a substrate for semiconductors), we developed and launched a small-radius wafer washing system for use by semiconductor plants featuring a sheet-type design that offers outstanding washing effectiveness.
Going forward, we will continue to develop products that meet customer needs by refining this small-radius wafer washing system, for example by increasing its washing effectiveness and reducing chemical use by utilizing fine foam.
The research and development budget for this segment of our business was 103 million yen.
(4) Contracts of Major Importance in the Group’s Business① Technology In-licensing Contracts
Financial Information
6. Analysis of Financial Position and Operating Results(1) Financial Position
The Takuma Group has formulated a financial policy of maintaining an appropriate level of liquidity, securing funding for business activities, and maintaining a robust balance sheet.
Total assets at the end of the consolidated fiscal year under review increased 9,487 million yen from the end of the previous consolidated fiscal year to 132,614 million yen as an increase of 6,878 million yen in notes and accounts receivable and an increase of 3,266 million yen in cash and deposits offset a decrease of 877 million yen in investment securities.
Liabilities rose 3,194 million yen from the end of the previous consolidated fiscal year to 73,805 million yen as an increase of 7,068 million yen in notes and accounts payable offset a decrease of 1,996 million yen in short-term loans payable and long-term debt and a decrease of 1,731 million yen in provision for loss on construction contracts.
Net assets rose 6,293 million yen from the end of the previous consolidated fiscal year to 58,809 million yen as an increase of 7,817 million yen in retained earnings due to the posting of profit attributable to owners of the parent offset a decrease of 827 million yen in retained earnings due to the payment of dividends and a decrease of 511 million yen in valuation difference on available-for-sale securities.
As a result, the equity capital ratio rose 1.7 points from the end of the previous consolidated fiscal year to 44.1%, and net assets per share rose 76.65 yen from the end of the previous consolidated fiscal year to 708.18 yen.
(2) Operating ResultsNet sales during the consolidated fiscal year under review rose 9,213 million yen from the previous consolidated fiscal
year to 113,088 million yen. Gross profit was 23,344 million yen, and selling, general, and administrative expenses were 14,155 million yen. After
deducting the latter, operating income was 9,189 million yen.Non-operating income of 800 million yen and non-operating expenses of 343 million yen yielded ordinary income of
9,646 million yen. Extraordinary losses of 267 million yen without any offsetting extraordinary gains yielded income before income taxes and
minority interests of 9,379 million yen. Profit attributable to owners of the parent after deducting income taxes of 1,569 million yen and loss attributable to
non-controlling shareholders of 7 million yen was 7,817 million yen. An overview of net sales and operating income by segment can be found in “Status of Business Activities: 1. Overview of Business Performance.”
Notes:1. Most of the above contracts entail payment of a fixed percentage of sales in addition to a one-time payment at the time the contract was
entered into.2. The contract has been revised to extend its term to December 2018.
Contract target Contract dateContracteeTakuma Co., Ltd. Continuous bed filtration of liquids April 1979
Name of other partyNordic Water Products AB (Sweden)
Contract termUntil December 2018(See Note 2.)
Takuma Co., Ltd. Process for the organic and anaerobic treatment of waste
December 2011 Hitachi Zosen Inova AG(Switzerland)
For 10 years, then automatically renewed every year
Note:Most of the above contracts entail receipt of payment of a fixed percentage of sales in addition to a one-time payment at the time the contract was entered into.
Contract target Contract dateContractorTakuma Co., Ltd. N-type palm wastes fired water-tube
boilerSeptember 1982
Name of other partyP.T. Super Andalas Steel (Indonesia)
Contract termFor 15 years, then automatically renewed every year
Takuma Co., Ltd. Auxiliary agent for filter-type dust collector
July 1993 MITSUI MINING & SMELTING CO., LTD. (Japan)
For 10 years, then automatically renewed every year
Takuma Co., Ltd. Dust elimination technology in exhaust gas treatment systems using impulse waves
November 2005 Nihon Spindle Manufacturing Co., Ltd. (Japan)
For 10 years, then automatically renewed every year
Takuma Co., Ltd. Coal firing boiler June 2007 P.T. Panca Mandiri Essencia (Indonesia)
For 10 years, then automatically renewed every year
② Technology Out-licensing Contracts

4847 TAKUMA 2016 ANNUAL REPORTTAKUMA 2016 ANNUAL REPORT
See accompanying notes.
Thousands ofU.S. dollars
(Note 1)Millions of yen
201620152016Current assets: Cash and time deposits (Notes 5, 7 and 9) ..................... ¥ 48,916 ¥ 45,650 $ 434,115 Notes and accounts receivable (Note 7): Trade .......................................................... 44,935 38,057 398,786 Unconsolidated subsidiaries and affiliated companies ........................... 1,457 1,281 12,930 Other .......................................................... 289 456 2,565 Less allowance for doubtful accounts ........... (39 ) (51 ) (349 ) Total ............................................ 46,642 39,743 413,932 Inventories (Note 6) ....................................................... 4,041 3,812 35,866 Deferred tax assets (Note 16) ......................................... 2,803 3,359 24,873 Other ............................................................................ 607 722 5,387 Total current assets ................................. 103,009 93,286 914,173 Property, plant and equipment: Land (Note 9) ................................................................ 3,018 3,082 26,789 Buildings and structures (Note 9) ................................... 12,219 12,228 108,437 Machinery, equipment, lease assets and construction in progress ....................................... 11,123 11,918 98,713 (Note 9) ........................................................................ 26,360 27,228 233,939 Less accumulated depreciation ...................................... (16,764 ) (17,372 ) (148,774 ) Total property, plant and equipment .... 9,596 9,856 85,165 Investments and other assets: Investment securities (Notes 7, 8 and 9) ......................... 11,136 12,013 98,825 Investments in: Unconsolidated subsidiaries and affiliated companies (Note 7) .............. 5,556 5,702 49,313 Other .......................................................... 823 784 7,301 Less allowance for doubtful accounts ........... (467 ) (477 ) (4,145 ) Total ............................................ 5,912 6,009 52,469 Deferred tax assets (Note 16) ......................................... 2,648 1,709 23,501 Other ............................................................................ 313 254 2,779 Total investments and other assets ....... 20,009 19,985 177,574 Total assets ............................................................................ ¥ 132,614 ¥ 123,127 $ 1,176,912
TAKUMA CO., LTD. and Consolidated Subsidiaries As of March 31, 2016 and 2015
ASSETS
Thousands ofU.S. dollars
(Note 1)Millions of yen
201620152016Current liabilities: Short-term loans payable (Notes 7 and 10) .................... ¥ 7,750 ¥ 7,850 $ 68,779 Current portion of long-term debt (Notes 7 and 10) ...... 673 1,896 5,969 Notes and accounts payable (Note 7): Trade .......................................................... 34,584 27,516 306,924 Unconsolidated subsidiaries and affiliated companies ............................ 575 694 5,108 Other .......................................................... 1,111 1,075 9,856 Total ............................................ 36,270 29,285 321,888 Accrued income taxes .................................................... 1,256 304 11,146 Advances received ......................................................... 7,700 8,692 68,336 Allowance for guarantees on completed work ............... 141 70 1,257 Allowance for losses on sales contracts .......................... 5,164 6,895 45,829 Other ............................................................................ 4,190 4,620 37,182 Total current liabilities ............................. 63,144 59,612 560,386 Long term liabilities: Long-term debt (Notes 7 and 10) .................................. 1,396 2,069 12,393 Allowance for directors’, executive officers’ and corporate auditors’ retirement benefits ........................ 189 181 1,676 Net defined benefit liability (Note 11) ............................ 8,668 8,294 76,925 Other ............................................................................ 408 455 3,616 Total long term liabilities ........................ 10,661 10,999 94,610 Total liabilities .......................................... 73,805 70,611 654,996Contingent liabilities (Note 12) Net assets (Note 13): Common stock .............................................................. 13,367 13,367 118,632 Authorized: 321,840,000 shares Issued: 83,000,000 shares Capital surplus ............................................................... 3,768 3,768 33,442 Retained earnings .......................................................... 38,754 31,764 343,934 Treasury stock, at cost ................................................... (232 ) (228 ) (2,066 ) 328,764 shares in 2016 and 324,240 shares in 2015 Total shareholders’ equity ............................ 55,657 48,671 493,942 Unrealized gains on securities ........................................ 3,586 4,097 31,825 Deferred gains and losses on hedges ............................. (27 ) 24 (236 ) Foreign currency translation adjustments ....................... (11 ) 25 (100 ) Remeasurements of defined benefit plans ...................... (660 ) (605 ) (5,855 ) Total accumulated other comprehensive income .. 2,888 3,541 25,634 Non-controlling interests in consolidated subsidiaries ..... 264 304 2,340 Total net assets ........................................ 58,809 52,516 521,916Total liabilities and net assets .............................................. ¥ 132,614 ¥ 123,127 $ 1,176,912
LIABILITIES AND NET ASSETS
Financial Statement■ Consolidated Balance Sheets
Financial Information

5049 TAKUMA 2016 ANNUAL REPORTTAKUMA 2016 ANNUAL REPORT
Financial Information
See accompanying notes.
TAKUMA CO., LTD. and Consolidated SubsidiariesFor the years ended March 31, 2016 and 2015
TAKUMA CO., LTD. and Consolidated SubsidiariesFor the years ended March 31, 2016 and 2015
Thousands ofU.S. dollars
(Note 1)Millions of yen201620152016
Net sales (Note 19) ................................................................ ¥ 113,088 ¥ 103,875 $ 1,003,626Cost of sales (Notes 11, 14, 15 and 19) .............................. 89,744 81,774 796,452 Gross profit ................................................................... 23,344 22,101 207,174Selling, general and administrative expenses (Notes 11, 15 and 19) ......................................................... 14,155 13,878 125,621 Operating income (Note 19) .......................................... 9,189 8,223 81,553Other income (expenses): Interest and dividend income ......................................... 366 310 3,253 Interest expense ............................................................ (105 ) (157 ) (934 ) Amortization of negative goodwill ................................. - 195 - Gain on sales of investment securities ............................ - 262 - Loss on disposal of property, plant and equipment ........ (167 ) (25 ) (1,483 ) Equity in earnings of affiliated companies ...................... 287 431 2,543 Reversal of provision for loss on litigation ...................... - 523 - Impairment loss (Note 17) ............................................. (267 ) (1,425 ) (2,368 ) Other, net ..................................................................... 76 140 675 Other income (expenses), net ................. 190 254 1,686 Income before income taxes ................................................ 9,379 8,477 83,239Income taxes (Note 16): Current ......................................................................... 1,558 903 13,828 Deferred ........................................................................ 11 (468 ) 100 Total income taxes ................................... 1,569 435 13,928 Profit ....................................................................................... 7,810 8,042 69,311 Profit (loss) attributable to non-controlling interests in consolidated subsidiaries ............................................... (7 ) 12 (63 ) Profit attributable to owners of parent .............................. ¥ 7,817 ¥ 8,030 $ 69,374 Per share: Net income ........................................................................... ¥ 94.55 ¥ 97.12 $ 0.84 Diluted net income ............................................................... - - - Cash dividends applicable to the year .................................... 11.00 9.00 0.10
U.S. dollars(Note 1)Yen
TAKUMA CO., LTD. and Consolidated SubsidiariesFor the years ended March 31, 2016 and 2015
Thousands ofU.S. dollars
(Note 1)Millions of yen 201620152016
Profit ........................................................................................ ¥ 7,810 ¥ 8,042 $ 69,311Other comprehensive income: Unrealized gains (losses) on securities ............................ (511 ) 1,606 (4,536 ) Deferred gains and losses on hedges ............................. (41 ) 8 (362 ) Foreign currency translation adjustments ....................... (55 ) 81 (484 ) Remeasurements of defined benefit plans ...................... (54 ) (339 ) (481 ) Total other comprehensive income ..................... (661 ) 1,356 (5,863 )Comprehensive income (Note 18) ............................................. ¥ 7,149 ¥ 9,398 $ 63,448 Comprehensive income attributed to: Owners of the parent ......................................... ¥ 7,165 ¥ 9,358 $ 63,587 Non-controlling interests .................................... (16 ) 40 (139 )
Millions of yen
Thousands of U.S. dollars (Note 1)
Millions of yen
For the years ended March 31, 2016 Balance at the beginning of current period .. Cash dividends (¥9.00 per share) ........ Profit attributable to owners of parent .. Purchase of treasure stock .................. Other changes during the year, net .....Balance at the end of current period ....... For the years ended March 31, 2015 Balance at the beginning of current period .. Cumulative effect of changes in accounting policies.. Restated balance ................................... Cash dividends (¥7.00 per share) ........ Profit attributable to owners of parent .. Change in scope of consolidation ....... Purchase of treasure stock .................. Sales of treasury stock ........................ Retirement of treasury stock ................ Other changes during the year, net .....Balance at the end of current period ....... For the years ended March 31, 2016 Balance at the beginning of current period .. Cash dividends ($0.08 per share) ........ Profit attributable to owners of parent .. Purchase of treasure stock .................. Other changes during the year, net .....Balance at the end of current period .......
¥ 13,367 - - - -¥ 13,367
¥ 13,367 - 13,367 - - - - - - -¥ 13,367
$ 118,632 - - - -$ 118,632
¥ 3,768 - - - -¥ 3,768
¥ 3,841 - 3,841 - - - - (0 ) (73 ) -¥ 3,768
$ 33,442 - - - - $ 33,442
¥ 31,764 (827 ) 7,817 - -¥ 38,754
¥ 27,799 (175 ) 27,624 (579 ) 8,030 (6 ) - - (3,305 ) -¥ 31,764
$ 281,897 (7,337 ) 69,374 - -$ 343,934
¥ (228 ) - - (4 ) -¥ (232 )
¥ (3,606 ) - (3,606 ) - - - (1 ) 1 3,378 -¥ (228 )
$ (2,028 ) - - (38 ) -$ (2,066 )
¥ 48,671 (827 ) 7,817 (4 ) -¥ 55,657
¥ 41,401 (175 ) 41,226 (579 ) 8,030 (6 ) (1 ) 1 - -¥ 48,671
$ 431,943 (7,337 ) 69,374 (38 ) -$ 493,942
¥ 4,097 - - - (511 )¥ 3,586
¥ 2,491 - 2,491 - - - - - - 1,606¥ 4,097
$ 36,356 - - - (4,531 )$ 31,825
¥ 24 - - - (51 )¥ (27 )
¥ 16 - 16 - - - - - - 8¥ 24
$ 213 - - - (449 )$ (236 )
¥ 25 - - - (36 )¥ (11 )
¥ (29 ) - (29 ) - - - - - - 54¥ 25
$ 226 - - - (326 )$ (100 )
¥ 3,541 - - - (653 )¥ 2,888
¥ 2,212 - 2,212 - - - - - - 1,329¥ 3,541
$ 31,421 - - - (5,787 )$ 25,634
¥ 304 - - - (40 )¥ 264
¥ 276 - 276 - - - - - - 28¥ 304
$ 2,698 - - - (358 )$ 2,340
¥ 52,516 (827 ) 7,817 (4 ) (693 )¥ 58,809
¥ 43,889 (175 ) 43,714 (579 ) 8,030 (6 ) (1 ) 1 - 1,357¥ 52,516
$ 466,062 (7,337 ) 69,374 (38 ) (6,145 )$ 521,916
Commonstock
Capitalsurplus
Retainedearnings
Treasurystock,at cost
Total share-holders’equity
Unrealizedgains onsecurities
Deferredgains andlosses onhedges
Foreigncurrency
translationadjust-ments
¥ (605 ) - - - (55 )¥ (660 )
¥ (266 ) - (266 ) - - - - - - (339 )¥ (605 )
$ (5,374 ) - - - (481 )$ (5,855 )
Remeasure-ments ofdefined
benefit plans
Totalaccumu-
lated othercompre-hensiveincome
Non-controllinginterests in
consolidated subsidiaries
Totalnet
assets
■ Consolidated Statements of Operations ■ Consolidated Statements of Comprehensive Income
■ Consolidated Statements of Changes in Net Assets

5251 TAKUMA 2016 ANNUAL REPORTTAKUMA 2016 ANNUAL REPORT
Financial Information
See accompanying notes.
TAKUMA CO., LTD. and Consolidated SubsidiariesFor the years ended March 31, 2016 and 2015
TAKUMA CO., LTD. and Consolidated Subsidiaries
Thousands ofU.S. dollars
(Note 1)Millions of yen 201620152016
Cash flows from operating activities: Income before income taxes ........................................................................... ¥ 9,379 ¥ 8,477 $ 83,239 Adjustments to reconcile income before income taxes to net cash provided by operating activities: Depreciation ............................................................................................... 840 900 7,455 Impairment loss .......................................................................................... 267 1,425 2,368 Amortization of negative goodwill .............................................................. - (195 ) - Gain on sales of investment securities .......................................................... - (262 ) - Increase (decrease) in allowance for doubtful accounts ................................ (21 ) (67 ) (189 ) Increase (decrease) in allowance for bonuses ............................................... 107 268 948 Increase (decrease) in allowance for losses on sales contracts ....................... (1,731 ) 3,956 (15,365 ) Increase (decrease) in allowance for losses on litigation ............................... - (690 ) - Increase (decrease) in net defined benefit liability ......................................... 325 69 2,880 Interest and dividend income ...................................................................... (367 ) (310 ) (3,253 ) Interest expense .......................................................................................... 105 157 934 Equity in losses (earnings) of affiliated companies ........................................ (287 ) (431 ) (2,543 ) Net decrease (increase) in notes and accounts receivable and advances received ...... (7,951 ) 2,468 (70,565 ) Decrease (increase) in inventories ................................................................. (237 ) (598 ) (2,105 ) Decrease (increase) in other current assets ................................................... 42 1,224 374 Net increase (decrease) in notes and accounts payable and advance money ....... 6,867 6,714 60,940 Increase (decrease) in other current liabilities ............................................... (587 ) (835 ) (5,210 ) Other .......................................................................................................... 152 73 1,352 Subtotal .................................................................................................. 6,903 22,343 61,260 Interest and dividend received ..................................................................... 623 582 5,529 Interest paid ................................................................................................ (108 ) (160 ) (954 ) Income taxes received (paid) ........................................................................ (690 ) (1,038 ) (6,124 ) Net cash provided by operating activities ................................................. 6,728 21,727 59,711 Cash flows from investing activities: Net decrease (increase) in time deposits .......................................................... 42 13 377 Purchase of property, plant and equipment ..................................................... (656 ) (346 ) (5,823 ) Purchase of intangible fixed assets .................................................................. (82 ) (40 ) (736 ) Purchase of investment securities .................................................................... (91 ) (209 ) (813 ) Sale of investment securities ........................................................................... 152 181 1,352 Disbursement for loans receivable ................................................................... (25 ) (31 ) (222 ) Collection of loans receivable .......................................................................... 243 187 2,160 Other .............................................................................................................. (28 ) 85 (248 ) Net cash used in investing activities ............................................................. (445 ) (160 ) (3,953 ) Cash flows from financing activities: Net increase (decrease) in short-term bank loans ............................................. (100 ) (450 ) (887 ) Proceeds from long-term debt ........................................................................ - 200 - Payment of long-term debt ............................................................................. (1,896 ) (2,805 ) (16,823 ) Purchase of treasury stock ............................................................................... (4 ) (1 ) (38 ) Payment of cash dividends .............................................................................. (827 ) (579 ) (7,337 ) Dividends paid to non-controlling interests ..................................................... (25 ) (16 ) (219 ) Other .............................................................................................................. (48 ) (56 ) (429 ) Net cash used in financing activities ............................................................ (2,900 ) (3,707 ) (25,733 ) Effect of exchange rate changes on cash and cash equivalents ............................ (56 ) 69 (495 ) Net increase (decrease) in cash and cash equivalents .................................... 3,327 17,929 29,530Cash and cash equivalents at beginning of year ......................................... 45,008 27,030 399,431Increase in cash and cash equivalents from newly consolidated subsidiary ........... - 49 -Cash and cash equivalents at end of year (Note 5) ..................................... ¥ 48,335 ¥ 45,008 $ 428,961
■ Consolidated Statements of Cash Flows ■ Notes to Consolidated Financial Statements
1. Basis of presenting financial statementsThe accompanying consolidated financial statements have been prepared in accordance with the provisions set forth in the Japanese Financial Instruments and Exchange Law and its related accounting regulations and in conformity with accounting principles generally accepted in Japan, which are different in certain respects as to application and disclosure requirements from International Financial Report-ing Standards.
The accounts of overseas subsidiaries are based on their accounting records maintained in conformity with generally accepted accounting principles prevailing in the respective countries of domicile. However, necessary adjustments are made upon consolidation. The accompany-ing consolidated financial statements have been restructured and translated into English from the consolidated financial statements of TAKUMA CO., LTD. (the “Company”) prepared in accordance with Japanese GAAP and filed with the appropriate Local Finance Bureau of the Ministry of Finance as required by the Japanese Financial Instruments and Exchange Law. Some supplementary information included in the statutory Japanese language consolidated financial statements, but not required for fair presentation, is not presented in the accompa-nying consolidated financial statements.
The translation of the Japanese yen amounts into U.S. dollar amounts are included solely for the convenience of readers outside Japan, using the prevailing exchange rate at March 31, 2016, which was ¥112.68 to U.S.$1.00. The translations should not be construed as representations that the Japanese yen amounts have been, could have been or could in the future be converted into U.S. dollars at this or any other rate of exchange.
2. Summary of significant accounting policies(1) Principles of consolidation
The consolidated financial statements include the accounts of the Company and its 19 significant subsidiaries (the “Companies”).Takuma Energy Co., Ltd., which was a newly established subsidiary, has been included in the consolidation from the consolidated fiscal year ended March 31, 2016. All significant intercompany transactions and unrealized profits among the Companies have been eliminated in consolidation. Investments in certain significant affiliates over which the Company and/or its subsidiaries are able to exert influence to a material degree with regard to financial and operating decision making, other than consolidated subsidiaries, are accounted for by the equity method after the elimination of unrealized intercompany profits.
Investments in the remaining unconsolidated subsidiaries and affiliated companies are not accounted for by the equity method because of the immaterial effect on the consolidated financial statements. Therefore, such investments are carried at cost, adjusted for any substantial and non-recoverable decline in value. Income from those unconsolidated subsidiaries and affiliated companies is recognized only when the Companies receive dividends therefrom.
(2) Foreign currency translationRevenue and expense are translated at the rates of exchange prevailing on the transaction date. Assets and liabilities denominated in foreign currencies are generally translated at the rate of exchange prevailing at the balance sheet date, and the resulting translation gains and losses are included in earnings.
The financial statements of a consolidated overseas subsidiary are translated into Japanese yen at the year-end rate, except that net asset accounts are translated at historical rates and income statement items resulting from transactions with the Company are translated at rates used by the Company. The resulting translation adjustments are shown as “Foreign currency translation adjust-ments,” a separate component of net assets.
(3) Cash and cash equivalents In preparing the consolidated statements of cash flows, cash and cash equivalents include cash on hand, readily available deposits and short-term investments with maturities not exceeding three months from the date of acquisition and which have high liquidity and low risk of price fluctuation.
(4) SecuritiesEquity securities issued by subsidiaries and affiliated companies which are not consolidated or accounted for using the equity method are stated at cost determined by moving average cost. Available-for-sale securities with available fair market value are stated at fair market value, and unrealized gains and losses on these securities are reported net of applicable income taxes as a separate component of net assets. Realized gains and losses on the sale of such securities are computed at cost using moving average cost. Available-for-sale securities with no available fair market value are stated at cost determined by moving average cost.
If the market value of equity securities issued by unconsolidated subsidiaries and affiliated companies or available-for-sale securities declines significantly, such securities are stated at fair market value and the difference between fair market value and the carrying amount is recognized as loss in the period of the decline. If the fair market value of securities is not readily available, such securities should be written down to net asset value with a corresponding charge in the income statement in the event the net asset value declines significantly. In these cases, the fair market value or the net asset value will be the carrying amount of the securities at the beginning of the next year.
(5) Allowance for doubtful accounts The Companies provide the allowance for doubtful accounts by estimating the uncollectible amounts of certain individual accounts and by applying a percentage based on collection experience to the remaining receivables.
(6) InventoriesMerchandise and finished goods are stated at cost using the moving average method. Work-in-process is stated at cost determined by the identified cost method. Materials and supplies are stated at cost using the average method. For these inventories, the carrying amounts on the balance sheet are written down to reflect decreases in profitability.

5453 TAKUMA 2016 ANNUAL REPORTTAKUMA 2016 ANNUAL REPORT
Financial Information
(7) Property, plant and equipmentProperty, plant and equipment are depreciated principally using the declining balance method over the estimated useful life of the asset. However, buildings acquired after March 31, 1998 are depreciated using the straight-line method. The range of useful lives is principally from 3 to 60 years for buildings and structures and from 2 to 20 years for machinery, equipment and other. Maintenance and repairs, including minor renewals and improvements, are charged to income as incurred.
Lease assets under finance leases in which the ownership of the lease assets is not transferred to the lessee are depreciated using the straight-line method over the lease term with an assumption of no residual value.
(8) Allowance for losses on sales contractsFor sales orders on hand at the balance sheet date for projects in which the estimated cost is expected to exceed the price of the order by a wide margin, an allowance for losses on sales contracts is recognized at the estimated aggregate amount.
(9) Allowance for guarantees on completed work Allowance for guarantees on completed work is based on estimated amounts of expenditure in the warranty period after products are delivered.
(10) Allowance for directors’, executive officers’ and corporate auditors’ retirement benefits Directors, executive officers and corporate auditors are generally entitled to receive retirement benefits based on the Companies’ internal rules. The Companies provide allowance for directors’, executive officers’ and corporate auditors’ retirement benefits based on the amount that would be required if all directors, executive officers and corporate auditors retired at the balance sheet date.
(11) Net defined benefit liability In calculating retirement benefit obligations, the method of attributing expected benefits to period employs principally a benefit formula basis. Actuarial gains and losses are recognized in expenses using the straight-line method principally over 10 years commencing with the following period. Prior service costs are recognized in expenses using the straight-line method principally over 10 years.
(12) Revenue recognitionWhen the outcome of an individual contracts can be estimated reliably, the domestic companies apply the percentage-of-completion method to work performed during the year, otherwise, the completed contract method is applied. The degree of completion, or the percentage of the contract performed during the period under review, is measured by the proportion of the cost incurred during the period to the estimated total cost.
(13) Income taxesThe Companies are subject to corporation tax, inhabitants tax and enterprise tax based on taxable income. The Companies recognize the tax effects of the temporary differences between the carrying amounts of assets and liabilities for tax and financial reporting. The provision for income taxes is computed based on the pretax income of each of the Companies, with certain required adjustments. The asset-liability approach is used to recognize deferred tax assets and liabilities for the expected future tax consequences of temporary differences.
The Companies adopted the consolidated tax return system.
(14) Net income and cash dividends per shareNet income per share is computed based on the weighted average number of shares of common stock outstanding during each period. Diluted net income per share is computed with the assumption that all convertible bonds were converted into common stock at the beginning of each period. Cash dividends per share represent interim dividends declared by the Board of Directors in each year and year-end dividends approved by the shareholders at the annual meeting held subsequent to the end of the fiscal year.
(15) Derivatives and hedge accountingThe Companies generally state derivative financial instruments at fair value and recognize changes in the fair value as gains or losses unless the derivative financial instruments are used for hedging purposes. If derivative financial instruments are used as hedges and meet certain hedging criteria, the Companies generally defer recognition of gain or loss resulting from a change in the fair value of the derivative financial instrument until the related loss or gain on the hedged item is recognized.
The Companies use currency forward contracts to hedge accounts receivable and payable denominated in foreign currencies (mainly U.S. dollars) against the risk of fluctuation in exchange rates that comes from foreign currency transactions.Interest rate swaps that qualify for hedge accounting and meet specific matching criteria are not re-measured at market value.
(16) ReclassificationsCertain prior year amounts have been reclassified to conform to the 2016 presentation.
3. Changes in accounting policiesThe Company and its domestic subsidiaries adopted “Revised Accounting Standard for Business Combinations” (ASBJ Statement No.21, September 13, 2013 (hereinafter, “Statement No.21”)), “Revised Accounting Standard for Consolidated Financial Statements” (ASBJ Statement No.22, September 13, 2013 (hereinafter, “Statement No.22”)) and “Revised Accounting Standard for Business Divestitures” (ASBJ Statement No.7, September 13, 2013 (hereinafter, “Statement No.7”)) (together, the “Business Combination Accounting Standards”), from the current fiscal year. As a result, the Company changed its accounting policies to recognize in capital surplus the differences arising from the changes in the Company’s ownership interest of subsidiaries over which the Company continues to maintain control and to record acquisition related costs as expenses in the fiscal year in which the costs are incurred. In addition, the Company changed its accounting policy for the reallocation of acquisition costs due to the completion following provisional accounting to reflect such reallocation in the consolidated financial statements for the fiscal year in which the business combination took place. The Company also changed the presentation of net income and the term “non-controlling interests” is used instead of “minority interests”. Certain amounts in the prior year comparative information were reclassified to conform to such changes in the current year presentation.With regard to the application of the Business Combination Accounting Standards, the Company followed the provisional treatments in article 58-2 (4) of Statement No.21, article 44-5 (4) of Statement No.22 and article 57-4 (4) of Statement No.7 with application from the
Thousands of U.S. dollarsMillions of yen201620152016
Cash and time deposits ................................................................ ¥ 48,916 ¥ 45,650 $ 434,115Time deposits with maturities exceeding three months from the date of acquisition ..................................................... (581 ) (642 ) (5,154 )Total cash and cash equivalents .................................................... ¥ 48,335 ¥ 45,008 $ 428,961
Thousands of U.S. dollarsMillions of yen201620152016
Merchandise and finished goods .................................................. ¥ 539 ¥ 720 $ 4,785Work-in-process ........................................................................... 2,066 1,785 18,335Materials and supplies ................................................................. 1,436 1,307 12,746Total inventories .......................................................................... ¥ 4,041 ¥ 3,812 $ 35,866
beginning of the current fiscal year prospectively.There is no effect on the consolidated financial statements of the current fiscal year.
4. Accounting standards issued but not yet adopted“Revised Implementation Guidance on Recoverability of Deferred Tax Assets” (ASBJ Guidance No. 26, March 28, 2016 (hereinafter, “Guidance No.26”)
(a) OverviewFollowing the framework in Auditing Committee Report No. 66 “Audit Treatment regarding the Judgment of Recoverability of Deferred Tax Assets”, which prescribes estimation of deferred tax assets according to the classification of the entity by one of five types, the following treatments were changed as necessary:
1) Treatment for an entity that does not meet any of the criteria in types 1 to 5;2) Criteria for types 2 and 3;3) Treatment for deductible temporary differences which an entity classified as type 2 is unable to schedule; 4) Treatment for the period which an entity classified as type 3 is able to reasonably estimate with respect to future taxable income
before consideration of taxable or deductible temporary differences that exist at the end of the current fiscal year; and5) Treatment when an entity classified as type 4 also meets the criteria for types 2 or 3.
(b) Effective dateEffective from the beginning of the fiscal year ending March 31, 2017
(c) Effects of application of the GuidanceThe Company and its consolidated domestic subsidiaries are currently in the process of determining the effects of the guidance on the consolidated financial statements.
5. Cash and cash equivalentsAmounts of cash and cash equivalents as of March 31, 2016 and 2015 were reconciled with cash and time deposits as follows:
6. InventoriesInventories were summarized as follows:
7. Financial instruments(1) Status of financial instruments
(a) Financial instruments policyUnder Group policy, investment in financial instruments is limited primarily to short-term deposits and bank loans for raising funds. Derivative transactions are used to hedge risks of fluctuations in foreign exchange and interest rates.
(b) Financial instruments, risks and risk management structureThe Companies are working to reduce customer credit risk associated with notes and accounts receivable and operating receivables through customer based due dates and other balance controls in accordance with the Companies’ regulations. Investment securities consists mainly of stocks and are periodically checked for the fair value of listed shares.Long-term loans receivable are made mainly to affiliated companies whose financial status is checked periodically.Notes and accounts payables, or operating payables, are due within one year.Short-term financing is primarily for operating funds while long-term debt is for capital investment.
With floating rate loans, which are exposed to interest rate fluctuation risk, Group companies use derivative transactions (interest rate swaps) as a part of their long-term loans to hedge the risk of interest rate fluctuation on bank loans and to fix interest payments.
To cope with operating receivables and loans exposed to liquidity risk, each Group company manages its cash position by preparing monthly cash-flow plans and other means.
(c) Supplementary remarks on fair values of financial instrumentsThe fair values of financial instruments do not reflect the market risks concerning the derivative trading.
(2) Fair value of financial instrumentsAmounts recognized on the consolidated balance sheets, fair values and differences as of March 31, 2016 and 2015, except items for which no fair value was obtainable, were as follows:

5655 TAKUMA 2016 ANNUAL REPORTTAKUMA 2016 ANNUAL REPORT
Financial Information
(Cash and time deposits)The fair value of cash and time deposits is based on relevant book value because they are mostly settled within a short period of time and the fair value is nearly equal to the book value.
(Notes and accounts receivable)The fair value of notes and accounts receivable is based on the relevant book value because they are mostly settled within a short period of time and the fair value is nearly equal to the book value.
(Investment securities)The fair value of stocks is based on stock exchange prices, and fair values of bonds are based on stock exchange prices or prices provided by financial institutions.
(Long-term loans receivable)The fair value of long-term loans receivable is calculated by a method that discounts total principal plus interest by an assumed interest rate for a similar new loan.
Thousands of U.S. dollarsMillions of yen2016 20152016
Amounts recognized on the consolidated balance sheets ............. ¥ 48,916 ¥ 45,650 $ 434,115Fair value ..................................................................................... 48,916 45,650 434,115Difference .................................................................................... ¥ - ¥ - $ -
Thousands of U.S. dollarsMillions of yen201620152016
Amounts recognized on the consolidated balance sheets ............. ¥ 45,178 ¥ 38,196 $ 400,940Fair value ..................................................................................... 45,178 38,196 400,940Difference .................................................................................... ¥ - ¥ - $ -
Thousands of U.S. dollarsMillions of yen201620152016
Amounts recognized on the consolidated balance sheets ............. ¥ 11,051 ¥ 11,928 $ 98,071Fair value ..................................................................................... 11,051 11,928 98,071Difference .................................................................................... ¥ - ¥ - $ -
Thousands of U.S. dollarsMillions of yen201620152016
Amounts recognized on the consolidated balance sheets ............. ¥ 964 ¥ 1,097 $ 8,555Fair value ..................................................................................... 962 1,096 8,539Difference .................................................................................... ¥ (2 ) ¥ (1 ) $ (16 )
(Notes and accounts payable)The fair value of notes and accounts payable is based on the relevant book value because they are mostly settled within a short period of time and the fair value is nearly equal to the book value.
Thousands of U.S. dollarsMillions of yen201620152016
Amounts recognized on the consolidated balance sheets ............. ¥ 35,120 ¥ 28,166 $ 311,683Fair value ..................................................................................... 35,120 28,166 311,683Difference .................................................................................... ¥ - ¥ - $ -
(Short-term loans payable)The fair value of short-term loans payable is based on the relevant book value because they are settled within a short period of time and the fair value is nearly equal to the book value.
Thousands of U.S. dollarsMillions of yen201620152016
Amounts recognized on the consolidated balance sheets ............. ¥ 7,750 ¥ 7,850 $ 68,779Fair value ..................................................................................... 7,750 7,850 68,779Difference .................................................................................... ¥ - ¥ - $ -
(Long-term debt)The fair value of long-term debt is calculated by a method that discounts total principal plus interest by an assumed interest rate for a similar new loan. Short-term financing is primarily for operating funds, while long-term debt is for capital investment.
Thousands of U.S. dollarsMillions of yen201620152016
Amounts recognized on the consolidated balance sheets ............. ¥ 2,069 ¥ 3,965 $ 18,362Fair value ..................................................................................... 2,080 3,971 18,457Difference .................................................................................... ¥ 11 ¥ 6 $ 95
(3) Redemption schedule of monetary assets with contractual maturities and repayment schedule of short-term loans payable and long-term debt
Millions of yen
As of March 31, 2016 Cash and time deposits .................. ¥ 48,916 ¥ - ¥ - ¥ - ¥ - ¥ - Notes and accounts receivable ........ 43,745 1,433 - - - - Investment securities ...................... - - - - - - Long-term loans receivable ............. - 223 131 106 160 344 Total .............................................. ¥ 92,661 ¥ 1,656 ¥ 131 ¥ 106 ¥ 160 ¥ 344 Short-term loans payable ............... ¥ 7,750 ¥ - ¥ - ¥ - ¥ - ¥ - Long-term debt .............................. 673 468 470 116 80 262 Total .............................................. ¥ 8,423 ¥ 468 ¥ 470 ¥ 116 ¥ 80 ¥ 262
More than5 years4 to 5 years3 to 4 years2 to 3 years1 to 2 years
Less than1 year
Items for which no fair value was obtainable (Non-listed equity securities)
Thousands of U.S. dollarsMillions of yen201620152016Amounts recognized on the consolidated balance sheets
Equity securities issued by affiliates ............................................... ¥ 4,548 ¥ 4,565 $ 40,359Debt securities issued by affiliates ................................................. 50 50 444Other ........................................................................................... 85 85 754
Millions of yen
As of March 31, 2015 Cash and time deposits .................. ¥ 45,650 ¥ - ¥ - ¥ - ¥ - ¥ - Notes and accounts receivable ........ 37,131 1,065 - - - - Investment securities ...................... - - - - - - Long-term loans receivable ............. - 242 222 131 105 393 Total .............................................. ¥ 82,781 ¥ 1,307 ¥ 222 ¥ 131 ¥ 105 ¥ 393 Short-term loans payable ............... ¥ 7,850 ¥ - ¥ - ¥ - ¥ - ¥ - Long-term debt .............................. 1,896 672 468 470 117 342 Total .............................................. ¥ 9,746 ¥ 672 ¥ 468 ¥ 470 ¥ 117 ¥ 342
More than5 years4 to 5 years3 to 4 years2 to 3 years1 to 2 years
Less than1 year
Thousands of U.S. dollars
As of March 31, 2016 Cash and time deposits .................. $ 434,115 $ - $ - $ - $ - $ - Notes and accounts receivable ........ 388,221 12,719 - - - - Investment securities ...................... - - - - - - Long-term loans receivable ............. - 1,979 1,161 936 1,422 3,057 Total .............................................. $ 822,336 $ 14,698 $ 1,161 $ 936 $ 1,422 $ 3,057 Short-term loans payable ............... $ 68,779 $ - $ - $ - $ - $ - Long-term debt .............................. 5,969 4,151 4,169 1,036 710 2,327 Total .............................................. $ 74,748 $ 4,151 $ 4,169 $ 1,036 $ 710 $ 2,327
More than5 years4 to 5 years3 to 4 years2 to 3 years1 to 2 years
Less than1 year
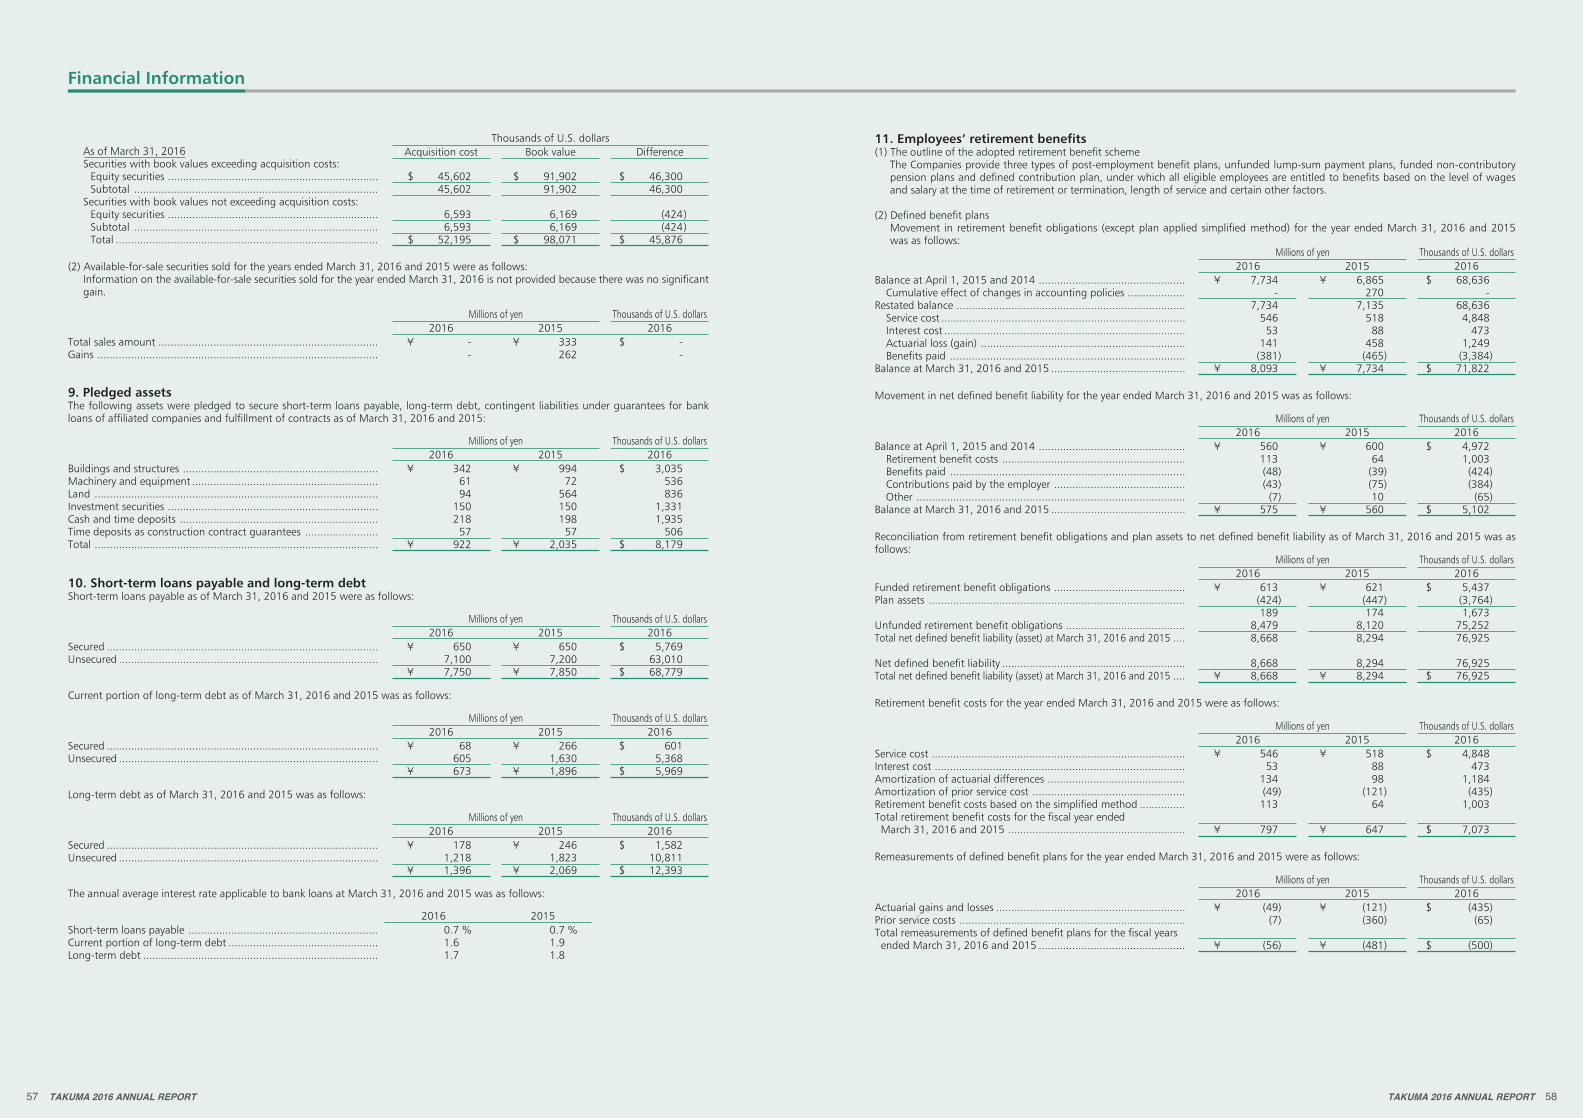
8. Securities(1) Acquisition costs and book values of available-for-sale securities with available fair values as of March 31, 2016 and 2015 were as
follows:
Millions of yenDifferenceBook valueAcquisition cost As of March 31, 2016
Securities with book values exceeding acquisition costs: Equity securities ..................................................................... ¥ 5,139 ¥ 10,356 ¥ 5,217 Subtotal ................................................................................ 5,139 10,356 5,217 Securities with book values not exceeding acquisition costs: Equity securities ..................................................................... 743 695 (48 ) Subtotal ................................................................................ 743 695 (48 ) Total ...................................................................................... ¥ 5,882 ¥ 11,051 ¥ 5,169
Millions of yenDifferenceBook valueAcquisition cost As of March 31, 2015
Securities with book values exceeding acquisition costs: Equity securities ..................................................................... ¥ 5,831 ¥ 11,879 ¥ 6,048 Subtotal ................................................................................ 5,831 11,879 6,048 Securities with book values not exceeding acquisition costs: Equity securities ..................................................................... 50 49 (1 ) Subtotal ................................................................................ 50 49 (1 ) Total ...................................................................................... ¥ 5,881 ¥ 11,928 ¥ 6,047
5857 TAKUMA 2016 ANNUAL REPORTTAKUMA 2016 ANNUAL REPORT
Financial Information
Thousands of U.S. dollarsMillions of yen201620152016
Total sales amount ........................................................................ ¥ - ¥ 333 $ -Gains ............................................................................................ - 262 -
(2) Available-for-sale securities sold for the years ended March 31, 2016 and 2015 were as follows:Information on the available-for-sale securities sold for the year ended March 31, 2016 is not provided because there was no significant gain.
Thousands of U.S. dollarsMillions of yen201620152016
Buildings and structures ................................................................ ¥ 342 ¥ 994 $ 3,035Machinery and equipment ............................................................. 61 72 536Land ............................................................................................. 94 564 836Investment securities ..................................................................... 150 150 1,331Cash and time deposits ................................................................. 218 198 1,935Time deposits as construction contract guarantees ........................ 57 57 506Total ............................................................................................. ¥ 922 ¥ 2,035 $ 8,179
9. Pledged assets The following assets were pledged to secure short-term loans payable, long-term debt, contingent liabilities under guarantees for bank loans of affiliated companies and fulfillment of contracts as of March 31, 2016 and 2015:
Current portion of long-term debt as of March 31, 2016 and 2015 was as follows:
Thousands of U.S. dollarsMillions of yen201620152016
Secured ......................................................................................... ¥ 68 ¥ 266 $ 601Unsecured ..................................................................................... 605 1,630 5,368 ¥ 673 ¥ 1,896 $ 5,969
Long-term debt as of March 31, 2016 and 2015 was as follows:
Thousands of U.S. dollarsMillions of yen201620152016
Secured ......................................................................................... ¥ 178 ¥ 246 $ 1,582Unsecured ..................................................................................... 1,218 1,823 10,811 ¥ 1,396 ¥ 2,069 $ 12,393
The annual average interest rate applicable to bank loans at March 31, 2016 and 2015 was as follows:
20152016Short-term loans payable .............................................................. 0.7 % 0.7 %Current portion of long-term debt ................................................. 1.6 1.9 Long-term debt ............................................................................. 1.7 1.8
10. Short-term loans payable and long-term debtShort-term loans payable as of March 31, 2016 and 2015 were as follows:
Thousands of U.S. dollarsMillions of yen201620152016
Secured ......................................................................................... ¥ 650 ¥ 650 $ 5,769Unsecured ..................................................................................... 7,100 7,200 63,010 ¥ 7,750 ¥ 7,850 $ 68,779
11. Employees’ retirement benefits(1) The outline of the adopted retirement benefit scheme
The Companies provide three types of post-employment benefit plans, unfunded lump-sum payment plans, funded non-contributory pension plans and defined contribution plan, under which all eligible employees are entitled to benefits based on the level of wages and salary at the time of retirement or termination, length of service and certain other factors.
(2) Defined benefit plansMovement in retirement benefit obligations (except plan applied simplified method) for the year ended March 31, 2016 and 2015 was as follows:
Movement in net defined benefit liability for the year ended March 31, 2016 and 2015 was as follows:
Thousands of U.S. dollarsDifferenceBook valueAcquisition cost As of March 31, 2016
Securities with book values exceeding acquisition costs: Equity securities ..................................................................... $ 45,602 $ 91,902 $ 46,300 Subtotal ................................................................................ 45,602 91,902 46,300 Securities with book values not exceeding acquisition costs: Equity securities ..................................................................... 6,593 6,169 (424 ) Subtotal ................................................................................ 6,593 6,169 (424 ) Total ...................................................................................... $ 52,195 $ 98,071 $ 45,876
Thousands of U.S. dollarsMillions of yen201620152016
Balance at April 1, 2015 and 2014 ................................................ ¥ 7,734 ¥ 6,865 $ 68,636 Cumulative effect of changes in accounting policies ................... - 270 -Restated balance ........................................................................... 7,734 7,135 68,636 Service cost ................................................................................ 546 518 4,848 Interest cost ............................................................................... 53 88 473 Actuarial loss (gain) ................................................................... 141 458 1,249 Benefits paid ............................................................................. (381 ) (465 ) (3,384 )Balance at March 31, 2016 and 2015 ............................................ ¥ 8,093 ¥ 7,734 $ 71,822
Thousands of U.S. dollarsMillions of yen201620152016
Balance at April 1, 2015 and 2014 ................................................ ¥ 560 ¥ 600 $ 4,972 Retirement benefit costs ............................................................ 113 64 1,003 Benefits paid ............................................................................. (48 ) (39 ) (424 ) Contributions paid by the employer ........................................... (43 ) (75 ) (384 ) Other ........................................................................................ (7 ) 10 (65 )Balance at March 31, 2016 and 2015 ............................................ ¥ 575 ¥ 560 $ 5,102
Reconciliation from retirement benefit obligations and plan assets to net defined benefit liability as of March 31, 2016 and 2015 was as follows:
Thousands of U.S. dollarsMillions of yen201620152016
Funded retirement benefit obligations ........................................... ¥ 613 ¥ 621 $ 5,437Plan assets .................................................................................... (424 ) (447 ) (3,764 ) 189 174 1,673Unfunded retirement benefit obligations ....................................... 8,479 8,120 75,252Total net defined benefit liability (asset) at March 31, 2016 and 2015 .... 8,668 8,294 76,925 Net defined benefit liability ............................................................ 8,668 8,294 76,925Total net defined benefit liability (asset) at March 31, 2016 and 2015 .... ¥ 8,668 ¥ 8,294 $ 76,925
Retirement benefit costs for the year ended March 31, 2016 and 2015 were as follows:
Thousands of U.S. dollarsMillions of yen201620152016
Service cost ................................................................................... ¥ 546 ¥ 518 $ 4,848Interest cost .................................................................................. 53 88 473Amortization of actuarial differences ............................................. 134 98 1,184Amortization of prior service cost .................................................. (49 ) (121 ) (435 )Retirement benefit costs based on the simplified method ............... 113 64 1,003Total retirement benefit costs for the fiscal year ended March 31, 2016 and 2015 .......................................................... ¥ 797 ¥ 647 $ 7,073
Remeasurements of defined benefit plans for the year ended March 31, 2016 and 2015 were as follows:
Thousands of U.S. dollarsMillions of yen201620152016
Actuarial gains and losses .............................................................. ¥ (49 ) ¥ (121 ) $ (435 )Prior service costs .......................................................................... (7 ) (360 ) (65 )Total remeasurements of defined benefit plans for the fiscal years ended March 31, 2016 and 2015 ................................................ ¥ (56 ) ¥ (481 ) $ (500 )

6059 TAKUMA 2016 ANNUAL REPORTTAKUMA 2016 ANNUAL REPORT
Financial Information
Accumulated remeasurements of defined benefit plans as of March 31, 2016 and 2015 were as follows:
Thousands of U.S. dollarsMillions of yen201620152016
Actuarial gains and losses yet to be recognized .............................. ¥ 108 ¥ 157 $ 956Prior service costs yet to be recognized .......................................... (1,059 ) (1,051 ) (9,392 )Total balance at March 31, 2016 and 2015 ................................... ¥ (951 ) ¥ (894 ) $ (8,436 )
The principal actuarial assumptions at March 31, 2016 and 2015 were as follows:
2016Discount rate principally 0.64% principally 0.64%Expected rate of salary increase principally 7.0% principally 6.9%
2015
(3) Defined contribution planThe amount of contribution required to the defined contribution plan of the Companies for the years ended March 31, 2016 and 2015 was 136 million yen ($1,209 thousand) and 127 million yen, respectively.
12. Contingent liabilitiesThe Companies were contingently liable under guarantees for bank loans of affiliated companies and other companies as of March 31, 2016 and 2015 as follows:
15. Research and development expensesResearch and development expenses are charged to income as incurred. Such expenses included in cost of sales and selling, general and administrative expenses for the years ended March 31, 2016 and 2015 were as follows:
13. Net assetsUnder Japanese laws and regulations, the entire amount paid for new shares is required to be designated as common stock. However, a company may, by a resolution of the Board of Directors, designate an amount not exceeding one half of the price of the new shares as additional paid-in capital, which is included in capital surplus.
Under the Japanese Corporate Law (the “Law”), in cases in which a dividend distribution of surplus is made, the smaller of an amount equal to 10% of the dividend or the excess, if any, of 25% of common stock over the total of additional paid-in capital and legal earnings reserve must be set aside as additional paid-in capital or legal earnings reserve. Legal earnings reserve is included in retained earnings in the accompanying consolidated balance sheets.
Under the Law, legal earnings reserve and additional paid-in capital can be used to eliminate or reduce a deficit or be capitalized by a resolution of the shareholders’ meeting.
Additional paid-in capital and legal earnings reserve may not be distributed as dividends. Under the Law, all additional paid-in capital and all legal earnings reserve may be transferred to other capital surplus and retained earnings, respectively, which are potentially available for dividends.
The maximum amount that the Company can distribute as dividends is calculated based on the nonconsolidated financial statements of the Company in accordance with Japanese laws and regulations.
The appropriation of retained earnings with respect to a given financial year is made by resolution of the shareholders at a general meeting held subsequent to the close of such financial year. The accounts for that year do not, therefore, reflect such appropriations.
14. Provision for losses on sales contractsProvision for losses on sales contracts included in cost of sales for the years ended March 31, 2016 and 2015 was as follows:
Millions of yen Thousands of U.S. dollars2016
Unsecured ................................................................................... ¥ 502 ¥ 682 $ 4,4532015 2016
Millions of yen Thousands of U.S. dollars2016
¥ 29 ¥ 4,239 $ 2552015 2016
Millions of yen Thousands of U.S. dollars2016
¥ 743 ¥ 586 $ 6,5942015 2016
16. Income taxesThe Companies are subject to a number of taxes based on income, which, in the aggregate, indicated a statutory rate in Japan of approximately 33.0% and 35.6% for the years ended March 31, 2016 and 2015, respectively.
The significant differences between the statutory tax rate and the Companies’ effective tax rate for financial statement purposes were set forth in the table below.
2016Statutory tax rate ............................................................................ 33.0 % 35.6 % Nondeductible expenses .................................................................. 1.0 0.8Dividend income ............................................................................. (4.7 ) (9.1 )Amortization of negative goodwill ................................................... - (0.8 )Equity in earnings of affiliated companies ........................................ (1.0 ) (1.8 )Intercompany cash dividend ............................................................ 4.3 8.6Council tax ...................................................................................... 0.7 0.7Decrease in deferred tax assets resulting from change in statutory rate .. 2.4 4.0Valuation allowance ........................................................................ (18.9 ) (32.8 )The Companies’ effective tax rate .................................................... 16.7 % 5.1 %
2015
Thousands of U.S. dollarsMillions of yen201620152016
Deferred tax assets: Net defined benefit liability .................................................. ¥ 2,669 ¥ 2,696 $ 23,689 Allowance for losses on sales contracts ................................. 1,524 2,247 13,526 Impairment loss ................................................................... 1,260 1,263 11,183 Loss carryforwards for tax purposes ...................................... 1,214 2,754 10,768 Accrued cost of sales ............................................................ 1,150 732 10,205 Other ................................................................................... 3,473 2,607 30,823 Total deferred tax assets ....................................................... 11,290 12,299 100,194 Valuation allowance ............................................................. (4,110 ) (5,121 ) (36,471 ) Net deferred tax assets ......................................................... ¥ 7,180 ¥ 7,178 $ 63,723Deferred tax liabilities: Unrealized gains on securities ............................................... ¥ (1,568 ) ¥ (1,935 ) $ (13,913 ) Valuation difference in land of consolidated subsidiary ......... (152 ) (136 ) (1,351 ) Other ................................................................................... (198 ) (224 ) (1,759 ) Total deferred tax liabilities ................................................... (1,918 ) (2,295 ) (17,023 ) Net deferred tax assets ......................................................... ¥ 5,262 ¥ 4,883 $ 46,700
Components of the Companies’ deferred tax assets and liabilities as of March 31, 2016 and 2015 were as follows:
Adjustment of deferred tax assets and liabilities for enacted changes in tax laws and ratesOn March 31, 2016, amendments to the Japanese tax regulations were enacted into law. As a result of these amendments, the statutory income tax rate for the Companies will be reduced to 30.8% for years beginning on or after April 1, 2016 and 30.6% for years beginning on or after April 1, 2018. Based on the amendments, the statutory income tax rate used for the measurement of deferred tax assets and liabilities expected to be settled or realized from April 1, 2016 to March 31, 2018 and on or after April 1, 2018 are 30.8% and 30.6%, respectively, as of March 31, 2016.
Due to these changes in statutory income tax rates, net deferred tax assets (after deducting deferred tax liabilities) decreased by ¥222 million as of March 31, 2016, deferred income tax expense recognized for the fiscal year ended March 31, 2016 increased by ¥304 million, unrealized gains on securities increased by ¥98 million, deferred gains and losses on hedges increased by ¥(1) million and remeasurements of defined benefit plans increased by ¥(16) million.
17. Impairment lossInformation on the impairment loss for the year ended March 31, 2016 is not provided because there was no significant loss.
Impairment loss for the year ended March 31, 2015 was as follows:
In Campo Recycle Plaza Co., Ltd., a consolidated subsidiary of the Company, the profitability of some noncurrent assets had declined due to a significant aging of the waste treatment facilities. Accordingly, the subsidiary decreased the book value of these assets to the recoverable value and reported the reduced amount, ¥1,425 million, as impairment loss under the extraordinary loss category. Included in this impairment loss was impairment of buildings and structures in the amount of ¥321 million, machinery and equipment ¥615 million, land ¥486 million, and other ¥3 million.In the Company, assets held by our waste treatment facilities were grouped for the purpose of this valuation.Recoverable values are determined based on the value in use. Because no positive future cash flows were expected, the recoverable values were estimated at 0.
PurposeWaste treatment facilities
TypeMachinery and equipment, etc.
LocationNantan City, Kyoto

6261 TAKUMA 2016 ANNUAL REPORTTAKUMA 2016 ANNUAL REPORT
Financial Information
18. Comprehensive incomeAmounts reclassified to net income in the current period that were recognized in other comprehensive income in the current or previous periods and the tax effects for each component of other comprehensive income were as follows:
Thousands of U.S. dollarsMillions of yen2015 20162016
Unrealized gains on securities Increase (decrease) during the year ..................................... ¥ (879 ) ¥ 2,436 $ (7,798 ) Reclassification adjustments ............................................... (0 ) (262 ) (2 ) Subtotal, before tax ........................................................... (879 ) 2,174 (7,800 ) Tax (expense) or benefit ..................................................... 368 (568 ) 3,264 Subtotal, net of tax ............................................................ ¥ (511 ) ¥ 1,606 $ (4,536 ) Deferred gains and losses on hedges Increase (decrease) during the year ..................................... ¥ (64 ) ¥ 11 $ (567 ) Reclassification adjustments ............................................... - - - Subtotal, before tax ........................................................... (64 ) 11 (567 ) Tax (expense) or benefit ..................................................... 23 (3 ) 205 Subtotal, net of tax ............................................................ ¥ (41 ) ¥ 8 $ (362 ) Foreign currency translation adjustments Increase (decrease) during the year ..................................... ¥ (55 ) ¥ 81 $ (484 ) Reclassification adjustments ............................................... - - - Subtotal, before tax ........................................................... (55 ) 81 (484 ) Tax (expense) or benefit ..................................................... - - - Subtotal, net of tax ............................................................ ¥ (55 ) ¥ 81 $ (484 ) Remeasurements of defined benefit plans Increase (decrease) during the year ..................................... ¥ (140 ) ¥ (458 ) $ (1,248 ) Reclassification adjustments ............................................... 84 (23 ) 748 Subtotal, before tax ........................................................... (56 ) (481 ) (500 ) Tax (expense) or benefit ..................................................... 2 142 19 Subtotal, net of tax ............................................................ ¥ (54 ) ¥ (339 ) $ (481 ) Total other comprehensive income ................................................ ¥ (661 ) ¥ 1,356 $ (5,863 )
(3) Information about reported segment profit or loss and other material itemsReportable segment information for the years ended March 31, 2016 and 2015 was as follows:
19. Segment information(Supplemental information – Accounting Standard for Disclosures about Segments of an Enterprise and Related Information)
(1) General information about reportable segmentsIn the Group, businesses for which separate financial information is available are grouped into the following four reporting segments in accordance with the similarity of products and services of the respective business, and results of each reporting segment are reviewed periodically by the Board of Directors to assess the segment’s business performance:
Domestic Environment and EnergyGeneral waste treatment plants, industrial waste treatment plants, waste recycling plants, wastewater treatment plants, sludge combustion plants, biomass power plants and gas-turbine cogeneration systems
Overseas Environment and EnergyWaste combusting power plants and biomass power plants
Package BoilerCompact through-flow boilers and vacuum water heating systems
Equipment and System BusinessConstruction equipment, equipment for semi-conductor industry and cleaning systems
(2) Basis of measurement about reported segment profit or loss and other material itemsAccounting methods used for reporting segments are the same those explained in the Note 2, “Summary of significant accounting policies.”
Profits of reporting units are operating incomes. Internal revenues and transfers between reporting segments are recorded using prevailing market prices.
Millions of yen
Year ended March 31, 2016Sales: Outside customers .......................... Intersegment .................................. Total ..........................................Reportable segment income (loss) .......Others: Depreciation ..................................
¥ 88,292 202 88,494 ¥ 9,834
¥ 608
¥ 830 - 830 ¥ (223 )
¥ 12
¥ 16,315 75 16,390 ¥ 896
¥ 144
¥ 7,651 13 7,664 ¥ 352
¥ 25
¥ 113,088 290 113,378 ¥ 10,859
¥ 789
¥ - (290 ) (290 ) ¥ (1,670 )
¥ 51
¥ 113,088 - 113,088 ¥ 9,189
¥ 840
DomesticEnvironmentand Energy
OverseasEnvironmentand Energy
PackageBoiler
Equipmentand System
Business Total Adjustment Consolidated
Millions of yen
Year ended March 31, 2015Sales: Outside customers .......................... Intersegment .................................. Total ..........................................Reportable segment income (loss) .......Others: Depreciation ..................................
¥ 79,828 134 79,962 ¥ 8,899
¥ 683
¥ 1,407 1 1,408 ¥ 2
¥ 11
¥ 16,513 91 16,604 ¥ 898
¥ 124
¥ 6,127 20 6,147 ¥ 46
¥ 24
¥ 103,875 246 104,121 ¥ 9,845
¥ 842
¥ - (246 ) (246 ) ¥ (1,622 )
¥ 58
¥ 103,875 - 103,875 ¥ 8,223
¥ 900
DomesticEnvironmentand Energy
OverseasEnvironmentand Energy
PackageBoiler
Equipmentand System
Business Total Adjustment Consolidated
Thousands of U.S. dollars
Year ended March 31, 2016Sales: Outside customers .......................... Intersegment .................................. Total ..........................................Reportable segment income (loss) .......Others: Depreciation ..................................
$ 783,566 1,796 785,362 $ 87,276
$ 5,395
$ 7,367 - 7,367 $ (1,980 )
$ 111
$ 144,793 665 145,458 $ 7,952
$ 1,278
$ 67,900 115 68,015 $ 3,119
$ 221
$ 1,003,626 2,576 1,006,202 $ 96,367
$ 7,005
$ - (2,576 ) (2,576 ) $ (14,814 )
$ 450
$ 1,003,626 - 1,003,626 $ 81,553
$ 7,455
DomesticEnvironmentand Energy
OverseasEnvironmentand Energy
PackageBoiler
Equipmentand System
Business Total Adjustment Consolidated
Adjustments in reportable segment income (loss) include eliminations of transactions between segments and corporate expenses not allocated to reportable segment expenses, including selling, general and administrative expenses not attributable to reportable segment.
Total reportable segment income (loss) is adjusted with operating income reported on the consolidated income and loss statement.
Disclosure of information relating to segment assets is omitted since assets are not allocated to business segments.
(Related information)Reportable segment information for the years ended March 31, 2016 and 2015 was as follows:
(1) Information about products and servicesDisclosure of this information is omitted since similar information is disclosed in Note 19, “Segment information.”
(2) Information about geographic areasRevenuesSince over 90% of net sales reported on the consolidated income statements were sales to outside customers within Japan, disclosure of this information is omitted.
Tangible fixed assetsSince 90% of tangible noncurrent assets reported on the consolidated balance sheet (in terms of values) were located within Japan, disclosure of this information is omitted.
(3) Information about major customersSince no outside customer accounted for 10% or more of net sales reported on the income statement, disclosure of this information is omitted.

6463 TAKUMA 2016 ANNUAL REPORTTAKUMA 2016 ANNUAL REPORT
Financial Information
(Information related to noncurrent asset impairment loss by reporting segment)
(Information related to amortization and unamortized balance of goodwill)
Millions of yen
Year ended March 31, 2016 Impairment loss ............................... ¥ 267 ¥ - ¥ - ¥ - ¥ 267 ¥ - ¥ 267
DomesticEnvironmentand Energy
OverseasEnvironmentand Energy
PackageBoiler
Equipmentand System
Business Total Adjustment Consolidated
Millions of yen
Year ended March 31, 2015 Impairment loss ............................... ¥ 1,425 ¥ - ¥ - ¥ - ¥ 1,425 ¥ - ¥ 1,425
DomesticEnvironmentand Energy
OverseasEnvironmentand Energy
PackageBoiler
Equipmentand System
Business Total Adjustment Consolidated
Thousands of U.S. dollars
Year ended March 31, 2016 Impairment loss ............................... $ 2,368 $ - $ - $ - $ 2,368 $ - $ 2,368
DomesticEnvironmentand Energy
OverseasEnvironmentand Energy
PackageBoiler
Equipmentand System
Business Total Adjustment Consolidated
Millions of yen
Year ended March 31, 2016Negative goodwill: Amortization ................................... Balance as of March 31, 2016 .........
¥ - -
¥ - -
¥ - -
¥ - -
¥ - -
¥ - -
¥ - -
DomesticEnvironmentand Energy
OverseasEnvironmentand Energy
PackageBoiler
Equipmentand System
Business Total Adjustment Consolidated
Thousands of U.S. dollars
Year ended March 31, 2016Negative goodwill: Amortization ................................... Balance as of March 31, 2016 .........
$ - -
$ - -
$ - -
$ - -
$ - -
$ - -
$ - -
DomesticEnvironmentand Energy
OverseasEnvironmentand Energy
PackageBoiler
Equipmentand System
Business Total Adjustment Consolidated
Millions of yen
Year ended March 31, 2015Negative goodwill: Amortization ................................... Balance as of March 31, 2015 .........
¥ 123 -
¥ - -
¥ 38 -
¥ 34 -
¥ 195 -
¥ - -
¥ 195 -
DomesticEnvironmentand Energy
OverseasEnvironmentand Energy
PackageBoiler
Equipmentand System
Business Total Adjustment Consolidated
(Information related to gains on negative goodwill by reporting segment)Not applicable