status of performance-based contracting model - quarter 2
TRANSCRIPT
Status of Performance-Based Contracting Model Second Quarter Report
(FY2020 Appropriation Act - Public Act 67 of 2019)
March 31, 2020
Sec. 503. (1) In accordance with the final report of the Michigan child welfare performance-based funding task force issued in response to section 503 of article X of 2013 PA 59, the department shall continue to review, update, or develop actuarially sound case rates for necessary child welfare foster care case management services that achieve permanency by the department and private child placing agencies in a prospective payment system under a performance-based funding model.
(2) By March 1 of the current fiscal year, the department shall provide to the senate and house appropriations committees on the department budget, the senate and house fiscal agencies and policy offices, and the state budget office a report on the full cost analysis of the performance-based funding model. The report shall include background information on the project and give details about the contractual costs covered through the case rate.
(3) In accordance with the final report of the Michigan child welfare performance-based funding task force issued in response to section 503 of article X of 2013 PA 59, the department shall continue an independent, third-party evaluation of the performance-based funding model.
(4) The department shall only implement the performance-based funding model into additional counties where the department, private child welfare agencies, the county, and the court operating within that county have signed a memorandum of understanding that incorporates the intentions of the concerned parties in order to implement the performance-based funding model.
(5) The department, in conjunction with members from both the house of representatives and senate, private child placing agencies, the courts, and counties shall continue to implement the recommendations that are described in the workgroup report that was provided in section 503 of article X of 2013 PA 59 to establish a performance-based funding for public and private child welfare services providers. The department shall provide quarterly reports on the status of the performance-based contracting model to the senate and house appropriations subcommittees on the department budget, the senate and house standing committees on families and human services, and the senate and house fiscal agencies and policy offices.
(6) From the funds appropriated in part 1 for the performance-based funding model pilot, the department shall continue to work with the West Michigan Partnership for Children Consortium on the implementation of the performance-based funding model pilot. The consortium shall accept and comprehensively assess referred youth, assign cases to members of its continuum or leverage services from other entities, and make appropriate case management decisions during the duration of a case. The consortium shall operate an integrated continuum of care structure, with services provided by both private and public agencies, based on individual case needs. The consortium shall demonstrate significant organizational capacity and competencies, including experience

Status of Performance-Based Contracting Model Second Quarter Report
with managing risk-based contracts, financial strength, experienced staff and leadership, and appropriate governance structure.
Status of Performance-Based Contracting Model Second Quarter Report
Section 503(5) PA 67 of 2019
1
The Michigan Department of Health and Human Services (MDHHS) has continued its collaboration with Kent County MDHHS staff and the Kent County provider community involved in the West Michigan Partnership for Children (WMPC) to support the Kent County pilot. The performance-based case rate funding model is intended to improve outcomes for children and families; allow for the effective allocation of resources to promote local service innovation, create service efficiencies, and incentivize service providing agencies to be accountable for achieving performance standards. The funding model reinforces positive outcomes and reinvests savings for continued improvements in foster care service delivery. Data Overview
The outcomes monitored include the Child and Family Services Review (CFSR) federal measures, Modified Implementation, Sustainability, and Exit Plan (MISEP), and contracted measures. The WMPC is meeting:
• 11 out of the 14 identified permanency performance measures • 2 out of the 6 identified well-being performance measures • 3 out of the 7 identified safety performance measures
The detailed quarterly performance measures are included in the attachment titled WMPC Network Performance Report, Fiscal Year 2020 Quarter 1.

Status of Performance-Based Contracting Model Second Quarter Report
Section 503(5) PA 67 of 2019
2
Key Innovations and Status Updates
• A transfer approved by the State Administrative Board in early October 2019 reduced the Foster care payments appropriation by $1,999,900, representing WMPC’s full FY 2020 administrative budget. If not restored, this would have resulted in the closure of WMPC. During that time period, WMPC engaged in transition planning with MDHHS to ensure the children served by WMPC and its partners would continue to receive uninterrupted services. WMPC’s administrative budget was restored in a supplemental appropriation, PA 154 of 2019, in December 2019.
• WMPC continued to operate in a deficit in the first quarter of FY2020 for its programmatic expenses. In a report from September 3rd 2019, MDHHS’s project management consultant, Public Consulting Group (PCG), and PCG’s contracted actuary, Lewis & Ellis (L&E), recommended a retrospective adjustment in the amount of $6.42 million and a prospective case rate adjustment in the amount of seven percent beginning in FY 2020, to account for expenses not included in the original case rate methodology. WMPC has not received the retrospective or prospective case rate adjustment as of the end of the first quarter of FY 2020 and has relied on cash advances from MDHHS to manage its cashflow. The recommended prospective rate adjustment was included in a supplemental recommendation advanced to the Legislature by the State Budget Director in February 2020.
• WMPC received significantly fewer intakes in the first quarter of FY 2020 than it had anticipated due to a statewide trend in decreased removals of children from their homes. Due to the front-loaded structure of the case rate, this parlayed into a revenue loss for WMPC, exacerbating cash flow issues.
• WMPC is continuing to work collaboratively with MDHHS, PCG, and L&E to ensure actuarial soundness of the case rate.
• WMPC developed and implemented a Request for Proposal and a Request for Quote
Expenses- Cash Basis FY2018 FY2019 FY2020 Q1 FY2020 Projected Spending Compared to FY2019
Foster Care Administration $ 15,240,083 $ 15,610,709 $2,477,158 Caregiver Maintenance Expenses $ 3,648,410 $ 4,643,238 $740,149
Enhanced Foster Care Maintenance & Administration $ 1,053,168 $ 3,448,756 $618,800
Residential Expenses $ 10,525,555 $ 9,042,917 $2,366,914 Shelter Expenses $ 1,167,662 $ 1,247,024 $279,224 Ancillary Services $ 1,325,453 $ 1,399,903 $194,227 Adoption Administration $ 1,337,245 $ 1,648,892 $123,804
Status of Performance-Based Contracting Model Second Quarter Report
Section 503(5) PA 67 of 2019
3
process in compliance with the Federal Acquisition Regulations (FAR). WMPC procured three contracts (foster care supportive visitation, domestic violence counseling, and group parent education) through this process.
• Westat’s second annual evaluation report was released for the year FY 2018 and is included as an attachment titled Evaluation of Michigan’s Performance-Based Funding Model. Positive findings in the report included children in Kent County stayed fewer days in care; exited to reunification faster; were less likely to experience two or more placements; and were more likely to be placed in a relative’s home than the comparison group. The report also noted an increase in expenses as compared to the benchmark which had also been identified by L&E in their September 3rd addendum to the original case rate methodology. The addendum indicated that there were missing costs from the original case rate methodology which, if factored into the case rate, would have increased the benchmark for expenses.
• WMPC’s Enhanced Foster Care (EFC) service continues to provide individualized treatment for children in general foster care who present with intensive behavioral or emotional needs. Between January 1, 2018 – December 31, 2019, WMPC provided this service to 162 children. EFC has assisted with maintaining community-based placements and has been a much-needed support for children transitioning from residential placement to the community.
• EFC has continued to contribute to decreased placements in residential settings. Between October and December 2019, the number of days children spent in residential placements decreased by four percent compared to the previous three months.
• WMPC’s performance and quality improvement team continues to analyze performance data and engage with its network providers monthly to discuss key performance measures, data quality, outcome measures, and quality improvement plans. WMPC also meets with providers on a quarterly basis to assess performance against the contract. (See WMPC Network Performance Report, Fiscal Year 2020 Quarter 1)
• WMPC worked collaboratively with MDHHS to develop or adjust nine new contractual performance measures for FY 2020-2022. These new measures went into effect this quarter and are included in the FY 2020 Quarter One Performance Report.
• As noted in previous legislative reports, WMPC received a grant from the Michigan Health Endowment Fund to implement the Sanctuary Model, an evidenced-informed, trauma-informed model through the Kent County Child and Family System of Care (including WMPC and foster care partners, MDHHS, the Kent County Circuit Court – Family Division, Network 180, and Court Appointed Special Advocates). In October, Sanctuary completed the self-assessment phase for the Kent County Child and Family System of Care, which concluded that the system is resource rich and well-positioned to implement the comprehensive model. Year one of implementation will focus on training child welfare staff in the model, and a five-day training for WMPC and partners is scheduled for February 2020.
• WMPC was awarded funds through the local community mental health provider, Network 180, to continue parent engagement work that was previously facilitated by Network 180 through their Community Family Partnership program. WMPC will utilize

Status of Performance-Based Contracting Model Second Quarter Report
Section 503(5) PA 67 of 2019
4
the funds to hire a Parent Planner and is currently engaged in the hiring process. Through training, family dinners, and other activities, this part-time staff member will draw upon their own lived experience to increase parent engagement and well-being among parents whose children are involved in the child welfare, community mental health, or juvenile justice systems.
• WMPC’s clinical liaison is working with the director of care coordination and innovation to ensure consistent approaches to trauma screens among partner agencies, thus ensuring children receive timely services at intake. During quarter one, the clinical liaison received 113 screening referrals, which resulted in more than 20 formal assessments and over 70 clinical consultations.
• WMPC continues to implement a Utilization Management (UM) model targeted on achieving permanency in 12 months, reducing placements in residential settings, and optimizing utilization of EFC. Through case reviews, the WMPC UM team creates recommendations and action steps, including referrals for trauma assessments, additional family finding, increasing youth connections, and referrals for other services.
• WMPC’s Board includes a representative from each of the five private case management agencies that comprise the consortium (Bethany Christian Services, Catholic Charities West Michigan, D.A. Blodgett – St. John’s, Samaritas, and Wellspring Lutheran Services), Cheryl Schuch, Executive Director of Family Promise, Sally Andreatta, Executive Director of the Grand Rapids Student Advancement Foundation, Dr. Nkechy Ezeh, Executive Director of the Early Learning Neighborhood Collaborative, and Kayla Morgan, a former foster youth and founder and owner of Resilient Roots, a trauma-informed yoga practice. WMPC has three additional board slots to fill to fulfill its objective of adding seven members representative of the diversity of the community and to allow for a non-provider quorum.
Attachments:
• Evaluation of Michigan’s Performance-Based Funding Model, Second Annual Report • WMPC Network Performance Report, Fiscal Year 2020 Quarter 1
Evaluation of Michigan’s Performance-Based
Funding Model
Second Annual Report
Executive Summary
Authors
Westat
Susan H. Chibnall
Karla Eisen
Marnee Evans
Angela Greene
Shauna Harps
Vanessa Kranz
Bryan Williams
University of Michigan,
School of Social Work
Joseph Ryan
Andrew Moore
Chapin Hall at the University
of Chicago
Laura Packard Tucker
Emily Rhodes
November 2019
Prepared for:
Michigan Department of Health and Human
Services
Children’s Services Agency
Lansing, Michigan 48933
Prepared by:
Westat
An Employee-Owned Research Corporation®
1600 Research Boulevard
Rockville, Maryland 20850-3129
(301) 251-1500
Evaluation of Michigan’s Performance-Based
Funding Model: Second Annual Report iii
Table of Contents
Chapter Page
Executive Summary ............................................................................................ ES-1
E.1 Overview ................................................................................................ ES-1 E.2 Methodology .......................................................................................... ES-1 E.3 Cost Study .............................................................................................. ES-2 E.4 Outcome Study: Safety, Permanency, and Stability ......................... ES-4 E.5 Case Studies: The Nature and Practice of Child Welfare in
Three Michigan Counties ..................................................................... ES-7 E.6 Conclusions and Next Steps ................................................................ ES-10
Tables
E-1 Exited or still in care .......................................................................................... ES-5
E-2 Time to exit ......................................................................................................... ES-6
E-3 First and initial placement ................................................................................. ES-6
Figures
E-1 WMPC-related placement maintenance expenditure trends by placement setting ................................................................................................ ES-3
E-2 Care day utilization by state Fiscal Year .......................................................... ES-4
Evaluation of Michigan’s Performance-Based
Funding Model: Second Annual Report ES-1
Executive Summary
E.1 Overview
The Michigan Legislature, through Public Act 59 of 2013, Section 503, convened a task force to
determine the feasibility of establishing performance-based funding for public and private child
welfare service providers. A recommendation from the task force called for a pilot project to plan
and implement the new funding model, and an independent evaluation of the pilot to assess the
planning and implementation required of such a project, the cost effectiveness, and the child and
family outcomes associated with it. The latter was awarded to Westat and its partners in 2016 and
includes process (Westat) and outcome (University of Michigan School of Social Work) components
and a cost study (Chapin Hall).
Westat and its partners, University of Michigan School of Social Work and Chapin Hall at the
University of Chicago, completed the second of a rigorous five-year evaluation of the Kent Model.
The evaluation compares the Kent Model with the per diem foster care service model, and is
composed of three components: process, outcome, and cost studies. The process evaluation
provides the context for foster care service planning and implementation in Kent, Ingham, and
Oakland counties. The outcome study examines changes in child and family outcomes (i.e., safety,
permanency, and well-being), while the cost study addresses changes in service delivery and
administrative costs for Kent County.
E.2 Methodology
The process evaluation is designed to provide the context for foster care service planning and
implementation in the three counties, while the outcome and cost components of the evaluation are
designed to compare the Kent Model to the per diem model being implemented across the state
using matched comparison groups (developed using propensity score matching); the outcome study
documents changes in child and family outcomes (i.e., safety, permanency, and stability), while the
cost study will address the types, amounts, costs, and cost-effectiveness of services that children in
out-of-home placements receive.

Evaluation of Michigan’s Performance-Based
Funding Model: Second Annual Report ES-2
E.3 Cost Study
The cost study is designed to understand the fiscal effects of the transition to the Kent Model. For
the current report, the evaluation team examined Kent County’s system-level expenditure and
revenue trends, concentrating on the three-year baseline period (FY 2015 through FY 2017) and the
first year post-implementation (FY 2018).1 Sources of administrative data are: (1) MiSACWIS
payment data, (2) MiSACWIS placement data, (3) WMPC Actual Cost Reporting Workbook and
Accrual Detail, (4) BP 515 Payment Workbook (defined on pg. 2-3) , and (5) Trial Reunification
Payments.
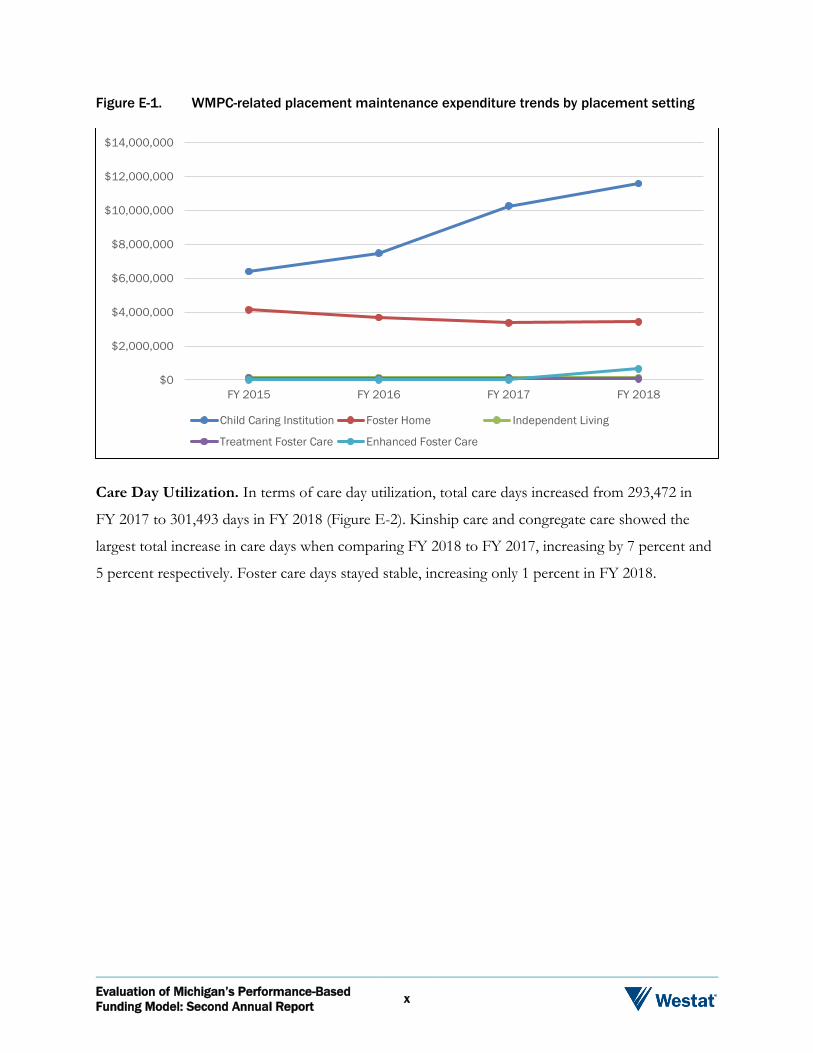
Total Expenditures. Kent County’s total out-of-home service expenditures increased over time.
The largest increase was from FY 2017 to FY 2018, when total expenditures increased by $6 million
(a 23 percent increase). Placement maintenance (e.g., daily maintenance rate for a child’s placement)
and administrative expenses (e.g., agencies’ daily administrative rate paid for a child’s placement)
increased from FY 2017 to FY 2018, and placement maintenance expenditures decreased between
FY 2015 and FY 2017 and stayed stable into FY 2018 (Figure E-1). Child caring institution (CCI)
placement maintenance expenditures increased each observable year, and the trend continued into
the first year of the post-implementation period.
1 WMPC does not provide services for voluntary foster care (YAVFC), youth with a juvenile justice designation (OTI), or unaccompanied refugee minors (URM), because data for these groups are excluded.

Evaluation of Michigan’s Performance-Based
Funding Model: Second Annual Report ES-3
Figure E-1. WMPC-related placement maintenance expenditure trends by placement setting
Care Day Utilization. In terms of care day utilization, total care days increased from 293,472 in
FY 2017 to 301,493 days in FY 2018 (Figure E-2). Kinship care and congregate care showed the
largest total increase in care days when comparing FY 2018 to FY 2017, increasing by 7 percent and
5 percent respectively. Foster care days stayed stable, increasing only 1 percent in FY 2018.
$0
$2,000,000
$4,000,000
$6,000,000
$8,000,000
$10,000,000
$12,000,000
$14,000,000
FY 2015 FY 2016 FY 2017 FY 2018
Child Caring Institution Foster Home Independent Living
Treatment Foster Care Enhanced Foster Care
Evaluation of Michigan’s Performance-Based
Funding Model: Second Annual Report ES-4
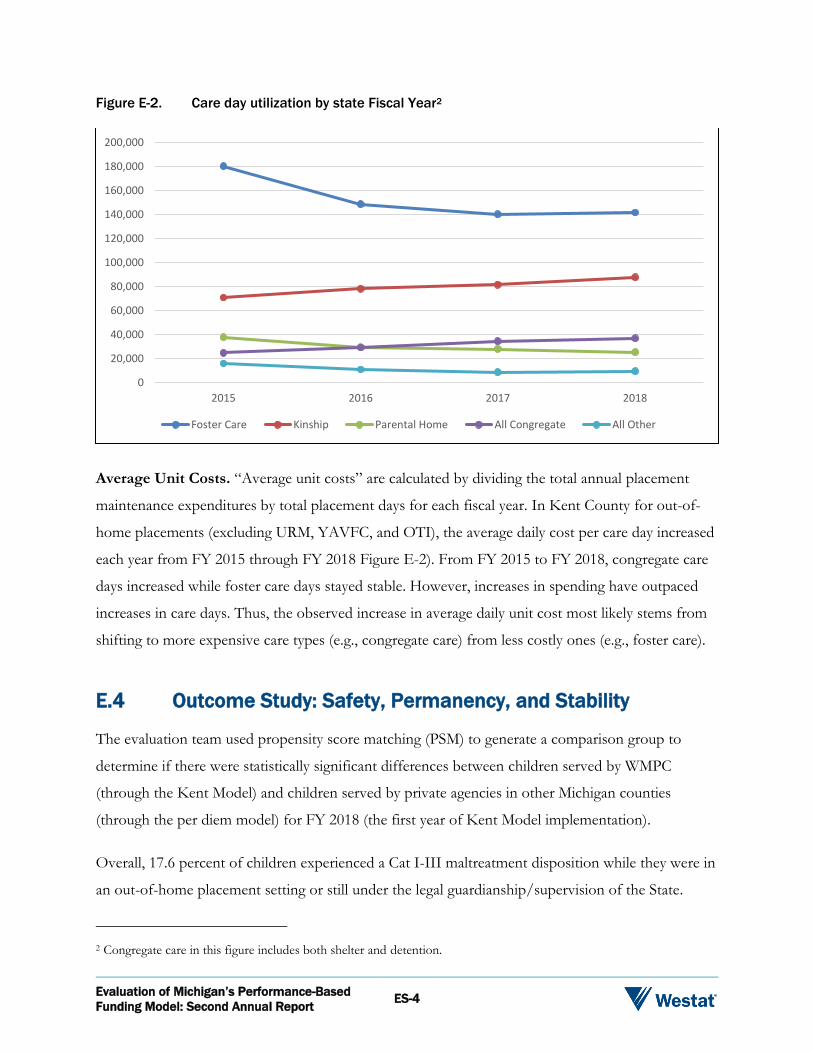
Figure E-2. Care day utilization by state Fiscal Year2
Average Unit Costs. “Average unit costs” are calculated by dividing the total annual placement
maintenance expenditures by total placement days for each fiscal year. In Kent County for out-of-
home placements (excluding URM, YAVFC, and OTI), the average daily cost per care day increased
each year from FY 2015 through FY 2018 Figure E-2). From FY 2015 to FY 2018, congregate care
days increased while foster care days stayed stable. However, increases in spending have outpaced
increases in care days. Thus, the observed increase in average daily unit cost most likely stems from
shifting to more expensive care types (e.g., congregate care) from less costly ones (e.g., foster care).
E.4 Outcome Study: Safety, Permanency, and Stability
The evaluation team used propensity score matching (PSM) to generate a comparison group to
determine if there were statistically significant differences between children served by WMPC
(through the Kent Model) and children served by private agencies in other Michigan counties
(through the per diem model) for FY 2018 (the first year of Kent Model implementation).
Overall, 17.6 percent of children experienced a Cat I-III maltreatment disposition while they were in
an out-of-home placement setting or still under the legal guardianship/supervision of the State.
2 Congregate care in this figure includes both shelter and detention.
0
20,000
40,000
60,000
80,000
100,000
120,000
140,000
160,000
180,000
200,000
2015 2016 2017 2018
Foster Care Kinship Parental Home All Congregate All Other

Evaluation of Michigan’s Performance-Based
Funding Model: Second Annual Report ES-5
There were no significant differences between children served in Kent County and similar children
served by private agencies outside of Kent County.
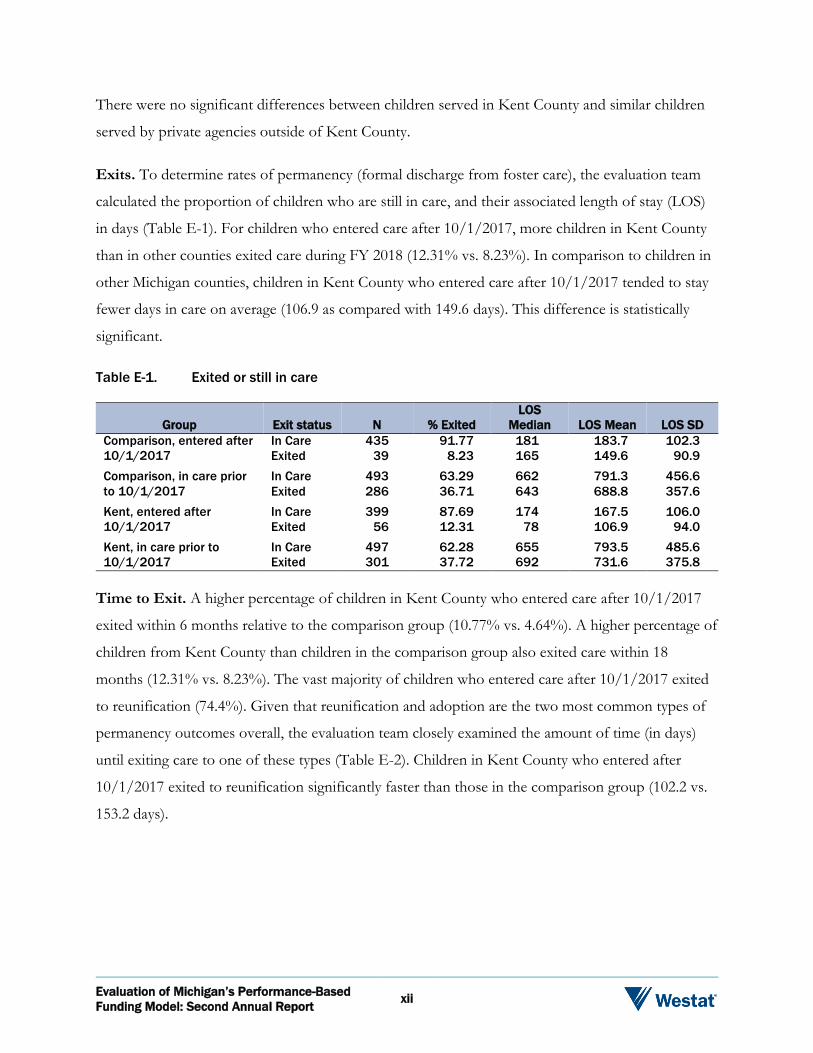
Exits. To determine rates of permanency (formal discharge from foster care), the evaluation team
calculated the proportion of children who are still in care, and their associated length of stay (LOS)
in days (Table E-1). For children who entered care after 10/1/2017, more children in Kent County
than in other counties exited care during FY 2018 (12.31% vs. 8.23%). In comparison to children in
other Michigan counties, children in Kent County who entered care after 10/1/2017 tended to stay
fewer days in care on average (106.9 as compared with 149.6 days). This difference is statistically
significant.
Table E-1. Exited or still in care
Group Exit status N % Exited
LOS
Median LOS Mean LOS SD
Comparison, entered after
10/1/2017
In Care 435 91.77 181 183.7 102.3
Exited 39 8.23 165 149.6 90.9
Comparison, in care prior
to 10/1/2017
In Care 493 63.29 662 791.3 456.6
Exited 286 36.71 643 688.8 357.6
Kent, entered after
10/1/2017
In Care 399 87.69 174 167.5 106.0
Exited 56 12.31 78 106.9 94.0
Kent, in care prior to
10/1/2017
In Care 497 62.28 655 793.5 485.6
Exited 301 37.72 692 731.6 375.8
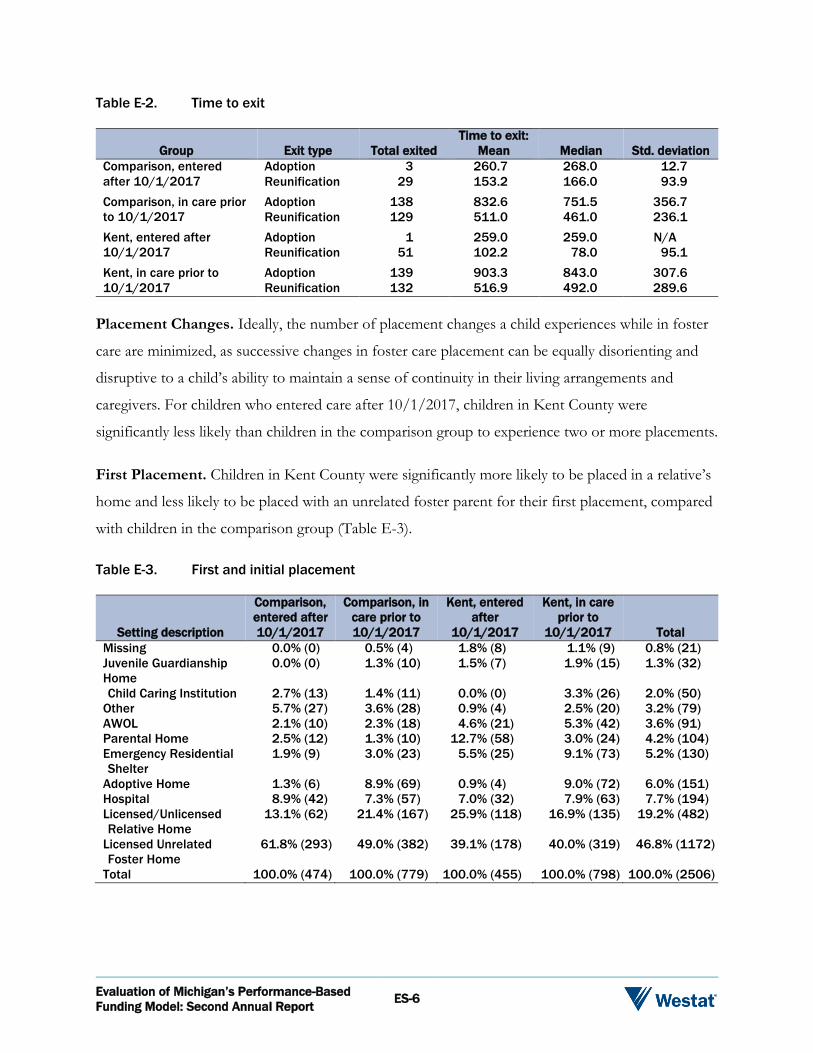
Time to Exit. A higher percentage of children in Kent County who entered care after 10/1/2017
exited within 6 months relative to the comparison group (10.77% vs. 4.64%). A higher percentage of
children from Kent County than children in the comparison group also exited care within 18
months (12.31% vs. 8.23%). The vast majority of children who entered care after 10/1/2017 exited
to reunification (74.4%). Given that reunification and adoption are the two most common types of
permanency outcomes overall, the evaluation team closely examined the amount of time (in days)
until exiting care to one of these types (Table E-2). Children in Kent County who entered after
10/1/2017 exited to reunification significantly faster than those in the comparison group (102.2 vs.
153.2 days).
Evaluation of Michigan’s Performance-Based
Funding Model: Second Annual Report ES-6
Table E-2. Time to exit
Group Exit type Total exited
Time to exit:
Mean Median Std. deviation
Comparison, entered
after 10/1/2017
Adoption 3 260.7 268.0 12.7
Reunification 29 153.2 166.0 93.9
Comparison, in care prior
to 10/1/2017
Adoption 138 832.6 751.5 356.7
Reunification 129 511.0 461.0 236.1
Kent, entered after
10/1/2017
Adoption 1 259.0 259.0 N/A
Reunification 51 102.2 78.0 95.1
Kent, in care prior to
10/1/2017
Adoption 139 903.3 843.0 307.6
Reunification 132 516.9 492.0 289.6
Placement Changes. Ideally, the number of placement changes a child experiences while in foster
care are minimized, as successive changes in foster care placement can be equally disorienting and
disruptive to a child’s ability to maintain a sense of continuity in their living arrangements and
caregivers. For children who entered care after 10/1/2017, children in Kent County were
significantly less likely than children in the comparison group to experience two or more placements.
First Placement. Children in Kent County were significantly more likely to be placed in a relative’s
home and less likely to be placed with an unrelated foster parent for their first placement, compared
with children in the comparison group (Table E-3).
Table E-3. First and initial placement
Setting description
Comparison,
entered after
10/1/2017
Comparison, in
care prior to
10/1/2017
Kent, entered
after
10/1/2017
Kent, in care
prior to
10/1/2017 Total
Missing 0.0% (0) 0.5% (4) 1.8% (8) 1.1% (9) 0.8% (21)
Juvenile Guardianship
Home
0.0% (0) 1.3% (10) 1.5% (7) 1.9% (15) 1.3% (32)
Child Caring Institution 2.7% (13) 1.4% (11) 0.0% (0) 3.3% (26) 2.0% (50)
Other 5.7% (27) 3.6% (28) 0.9% (4) 2.5% (20) 3.2% (79)
AWOL 2.1% (10) 2.3% (18) 4.6% (21) 5.3% (42) 3.6% (91)
Parental Home 2.5% (12) 1.3% (10) 12.7% (58) 3.0% (24) 4.2% (104)
Emergency Residential
Shelter
1.9% (9) 3.0% (23) 5.5% (25) 9.1% (73) 5.2% (130)
Adoptive Home 1.3% (6) 8.9% (69) 0.9% (4) 9.0% (72) 6.0% (151)
Hospital 8.9% (42) 7.3% (57) 7.0% (32) 7.9% (63) 7.7% (194)
Licensed/Unlicensed
Relative Home
13.1% (62) 21.4% (167) 25.9% (118) 16.9% (135) 19.2% (482)
Licensed Unrelated
Foster Home
61.8% (293) 49.0% (382) 39.1% (178) 40.0% (319) 46.8% (1172)
Total 100.0% (474) 100.0% (779) 100.0% (455) 100.0% (798) 100.0% (2506)

Evaluation of Michigan’s Performance-Based
Funding Model: Second Annual Report ES-7
E.5 Case Studies: The Nature and Practice of Child Welfare in
Three Michigan Counties
The process evaluation is designed using a case study approach to examine similarities and
differences in child welfare practice in Kent, Ingham, and Oakland counties. Process evaluation
findings provide the framework for understanding child welfare practice in the counties. In addition,
as the focus of the pilot, process evaluation findings for Kent County also provide context for
understanding associated outcomes and costs.
During the second round of site visits to MDHHS and Kent, Ingham, and Oakland counties,
conducted one year after the launch of the Kent Model, the process evaluation team conducted 56
interviews and focus groups with public child welfare and private agency leadership, and a sample of
supervisors and caseworkers. Interviews were also conducted with stakeholders from the court and
mental health systems, and in Kent County, the county administrator and staff at the WMPC. Focus
groups and interviews covered topics that included MiTEAM, case management, interagency
collaboration, and data systems.
Kent, Ingham, and Oakland counties vary widely relative to certain characteristics, including racial
and ethnic composition, rate of confirmed cases of child abuse and neglect, and family poverty
status. Populations range from just under 300,000 people in Ingham County to over 1 million people
in suburban Oakland County. Although there may be variation in the number of families with
children in care, each county’s locale (e.g., rural, suburban), and other community characteristics,
child welfare agency staff in all three counties share a common goal: to provide appropriate and
timely services for children and families, and guide them toward achieving positive outcomes.
Child Welfare Service Delivery. Interview and focus group respondents from private agencies in
Ingham County reported that one barrier to serving families effectively is the requirement that they
obtain approval from Ingham County DHHS for services, which can take a considerable amount of
time. Kent County respondents described similar delays in service request approvals from Kent
County DHHS prior to implementation of the Kent Model. Through the model, each of the five
private agencies now has a dedicated WMPC Care Coordinator who authorizes service requests in a
timely manner.
Evaluation of Michigan’s Performance-Based
Funding Model: Second Annual Report ES-8
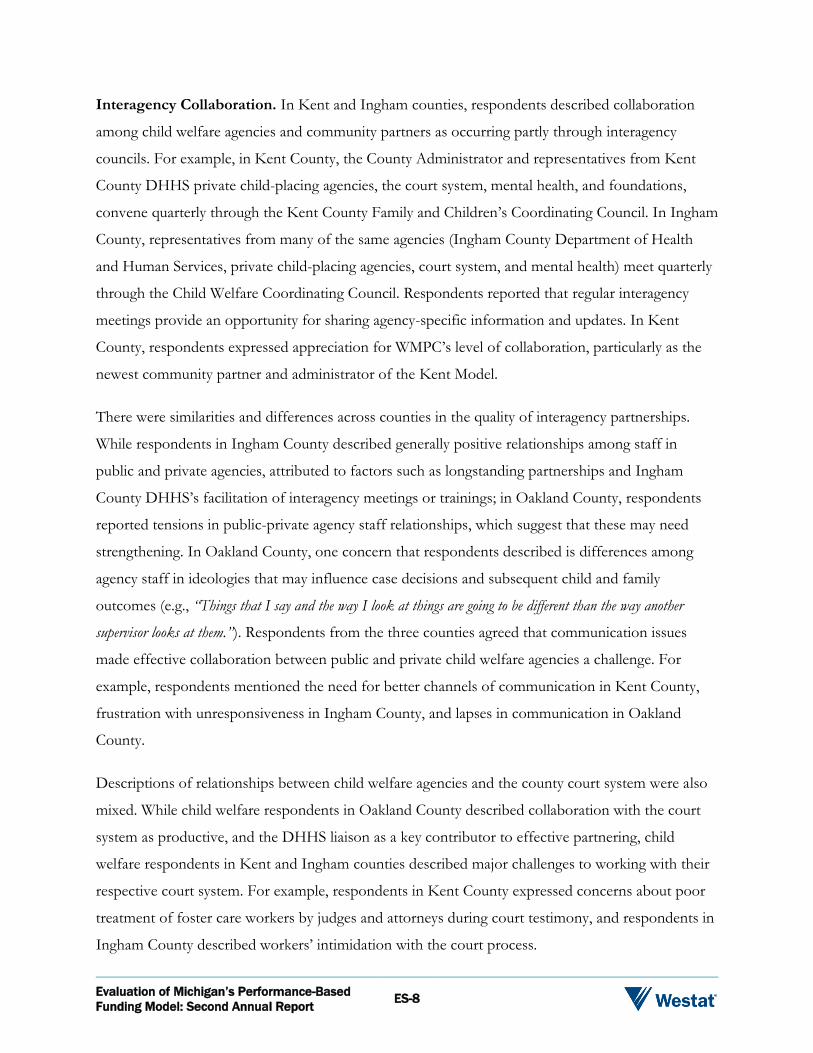
Interagency Collaboration. In Kent and Ingham counties, respondents described collaboration
among child welfare agencies and community partners as occurring partly through interagency
councils. For example, in Kent County, the County Administrator and representatives from Kent
County DHHS private child-placing agencies, the court system, mental health, and foundations,
convene quarterly through the Kent County Family and Children’s Coordinating Council. In Ingham
County, representatives from many of the same agencies (Ingham County Department of Health
and Human Services, private child-placing agencies, court system, and mental health) meet quarterly
through the Child Welfare Coordinating Council. Respondents reported that regular interagency
meetings provide an opportunity for sharing agency-specific information and updates. In Kent
County, respondents expressed appreciation for WMPC’s level of collaboration, particularly as the
newest community partner and administrator of the Kent Model.
There were similarities and differences across counties in the quality of interagency partnerships.
While respondents in Ingham County described generally positive relationships among staff in
public and private agencies, attributed to factors such as longstanding partnerships and Ingham
County DHHS’s facilitation of interagency meetings or trainings; in Oakland County, respondents
reported tensions in public-private agency staff relationships, which suggest that these may need
strengthening. In Oakland County, one concern that respondents described is differences among
agency staff in ideologies that may influence case decisions and subsequent child and family
outcomes (e.g., “Things that I say and the way I look at things are going to be different than the way another
supervisor looks at them.”). Respondents from the three counties agreed that communication issues
made effective collaboration between public and private child welfare agencies a challenge. For
example, respondents mentioned the need for better channels of communication in Kent County,
frustration with unresponsiveness in Ingham County, and lapses in communication in Oakland
County.
Descriptions of relationships between child welfare agencies and the county court system were also
mixed. While child welfare respondents in Oakland County described collaboration with the court
system as productive, and the DHHS liaison as a key contributor to effective partnering, child
welfare respondents in Kent and Ingham counties described major challenges to working with their
respective court system. For example, respondents in Kent County expressed concerns about poor
treatment of foster care workers by judges and attorneys during court testimony, and respondents in
Ingham County described workers’ intimidation with the court process.

Evaluation of Michigan’s Performance-Based
Funding Model: Second Annual Report ES-9
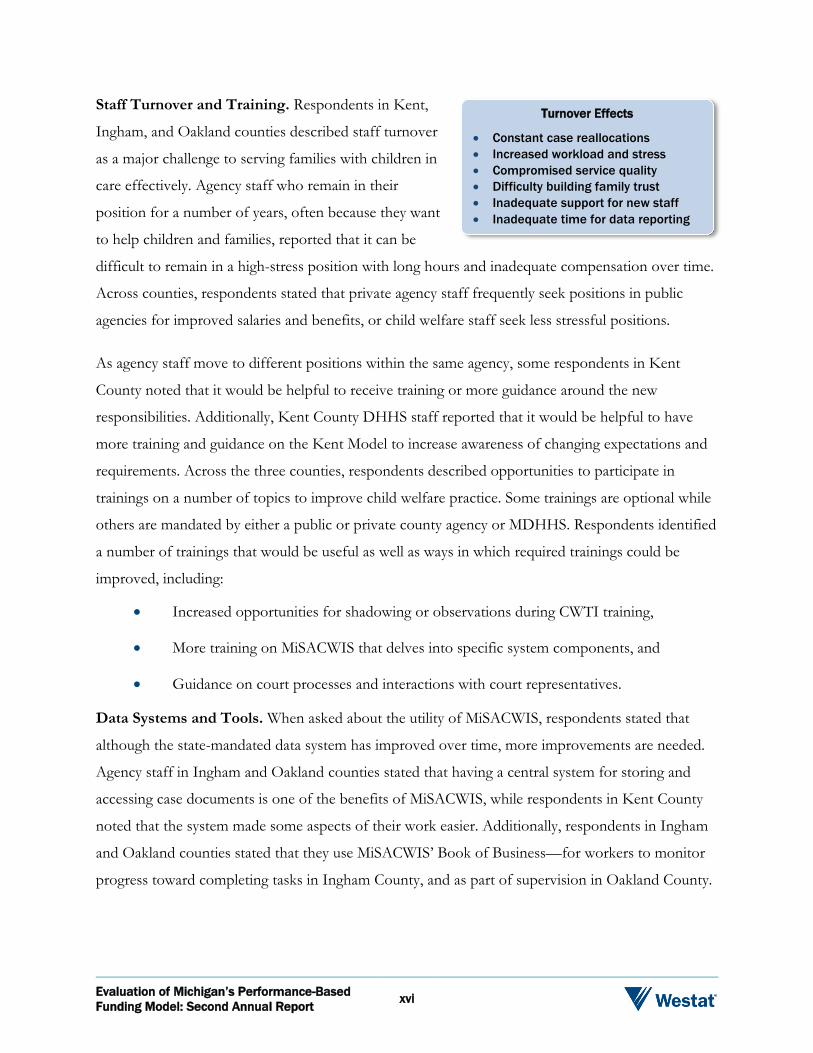
Staff Turnover and Training. Respondents in Kent,
Ingham, and Oakland counties described staff turnover
as a major challenge to serving families with children in
care effectively. Agency staff who remain in their
position for a number of years, often because they want
to help children and families, reported that it can be
difficult to remain in a high-stress position with long hours and inadequate compensation over time.
Across counties, respondents stated that private agency staff frequently seek positions in public
agencies for improved salaries and benefits, or child welfare staff seek less stressful positions.
As agency staff move to different positions within the same agency, some respondents in Kent
County noted that it would be helpful to receive training or more guidance around the new
responsibilities. Additionally, Kent County DHHS staff reported that it would be helpful to have
more training and guidance on the Kent Model to increase awareness of changing expectations and
requirements. Across the three counties, respondents described opportunities to participate in
trainings on a number of topics to improve child welfare practice. Some trainings are optional while
others are mandated by either a public or private county agency or MDHHS. Respondents identified
a number of trainings that would be useful as well as ways in which required trainings could be
improved, including:
Increased opportunities for shadowing or observations during CWTI training,
More training on MiSACWIS that delves into specific system components, and
Guidance on court processes and interactions with court representatives.
Data Systems and Tools. When asked about the utility of MiSACWIS, respondents stated that
although the state-mandated data system has improved over time, more improvements are needed.
Agency staff in Ingham and Oakland counties stated that having a central system for storing and
accessing case documents is one of the benefits of MiSACWIS, while respondents in Kent County
noted that the system made some aspects of their work easier. Additionally, respondents in Ingham
and Oakland counties stated that they use MiSACWIS’ Book of Business—for workers to monitor
progress toward completing tasks in Ingham County, and as part of supervision in Oakland County.
Turnover Effects
Constant case reallocations
Increased workload and stress
Compromised service quality
Difficulty building family trust
Inadequate support for new staff
Inadequate time for data reporting

Evaluation of Michigan’s Performance-Based
Funding Model: Second Annual Report ES-10
In terms of challenges to using MiSACWIS, respondents in both Kent and Oakland counties
identified the number of “clicks” that are often necessary to navigate the system as excessive and
time-consuming. Additionally, respondents in Oakland and Ingham counties acknowledged that the
ability of system users to access valid and reliable information depends on the extent to which other
users enter complete and accurate information in a timely manner, which does not always happen.
Respondents in all three counties expressed frustration that MiSACWIS is not user-friendly and
requires a substantial amount of time to enter data.
MDHHS also mandates that agencies use the state’s Fidelity
Tool and data system to assess and report the extent to
which workers implement the MiTEAM practice model as
intended. Respondents from all three counties discussed the
time necessary to complete the Fidelity Tool, and were aware of the types of data yielded from the
assessments, but they expressed disappointment that they do not receive feedback from the
assessments that could help them improve practice. Additionally, respondents in Kent and Ingham
counties noted that questions in the Fidelity Tool do not apply to certain positions, such as licensing
workers, as they do not work directly with families.
E.6 Conclusions and Next Steps
Kent, Ingham, and Oakland counties vary across several characteristics, such as foster care funding
mechanisms (performance-based in Kent County, per diem in Ingham and Oakland counties),
population (ranging from under 300,000 people in Ingham County to over one million people in
Oakland County), and rates of confirmed victims of child abuse and neglect. For 2019, the number
of confirmed victims is below the state rate of 18.9 per 1,000 children in Oakland County (8.4), but
above the state rate in Kent County (19.8) and Ingham County (31.5). Across counties, respondents
described staff turnover as a major challenge to serving families effectively. Respondents associated
high turnover, due to factors such as low salaries and high stress, with consequences that include
inadequate service quality and placement instability. Respondents agreed that turnover is a challenge
but acknowledged steps being taken to address it at the state level (e.g., professional development)
and locally (e.g., MiTEAM subgroups in Oakland County).
Fidelity Assessment Challenges
Time-consuming
Does not apply to all positions
Tool is not user-friendly

Evaluation of Michigan’s Performance-Based
Funding Model: Second Annual Report ES-11
Similarities and differences among the counties in composition and child welfare agency
characteristics and experiences are important to consider relative to the goals of the Kent Model.
The impetus for the shift from implementation of a per diem to a performance-based funding
model is the Michigan Legislature’s priority to improve child welfare outcomes through increased
flexibility and innovation in service provision for families with children in care. Although the
performance-based model is currently being piloted in Kent County, stakeholders should understand
contextual variables that may affect service delivery (and related costs and outcomes), if the model
were to be implemented in other Michigan counties in the future.
During interviews and focus groups conducted as part of the process evaluation, respondents in
Kent County reported that over the past year, they observed more innovative thinking about
services during case planning and fewer bureaucratic barriers preventing them from identifying
creative solutions to address family needs. Caseworkers also increased reliance on Enhanced Foster
Care as a primary method of stabilizing placements and supporting high-need foster children and
caregivers.
Respondents in Kent County described the nature of interactions between child placing agencies
and the WMPC, the entity supporting and providing oversight of the Kent Model, over the past
year. They indicated that communication among agency and WMPC staff is frequent and effective,
and respondents from nearly all of the child placing agencies described the agency-WMPC
collaborative relationship as strong. Additionally, through the Kent Model, each of the five child
placing agencies in Kent County has a designated WMPC Care Coordinator who authorizes service
requests, when required, in less time than was typical prior to the model’s launch. Although
respondents in Kent County described challenges to the new service authorization process (e.g.,
learning curve for some WMPC and private agency staff), the new process has facilitated child
welfare practice in several ways (e.g., increased efficiency and timeliness of services). In contrast,
respondents in child placing agencies in Ingham County reported that the considerable time lag
between service requests and approvals can be a barrier to serving families effectively.
Although agency staff from child placing agencies in Kent County appreciate the ease with which
service requests are approved when required, they are cognizant that the funds are not unlimited. As
one respondent expressed, “I am worried about like, I’m going to run out of money?” Cost study findings
indicate that expenditures in Kent County increased between baseline (fiscal years 2015-2017) and
Evaluation of Michigan’s Performance-Based
Funding Model: Second Annual Report ES-12
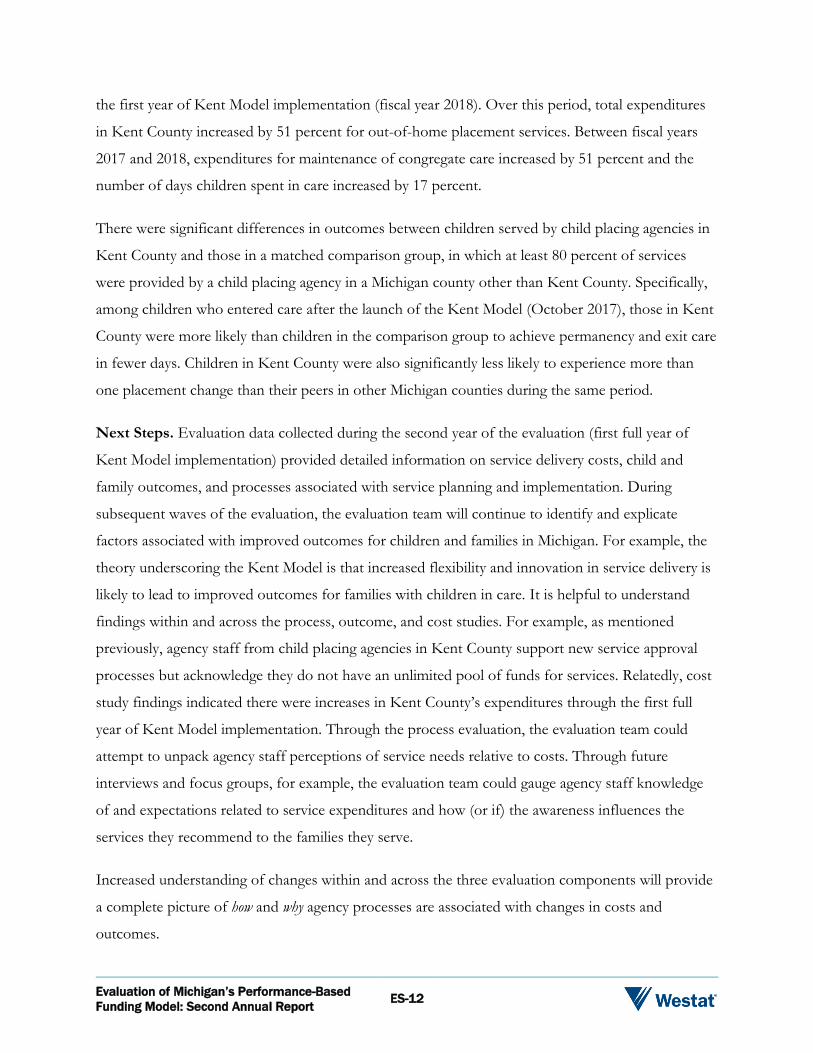
the first year of Kent Model implementation (fiscal year 2018). Over this period, total expenditures
in Kent County increased by 51 percent for out-of-home placement services. Between fiscal years
2017 and 2018, expenditures for maintenance of congregate care increased by 51 percent and the
number of days children spent in care increased by 17 percent.
There were significant differences in outcomes between children served by child placing agencies in
Kent County and those in a matched comparison group, in which at least 80 percent of services
were provided by a child placing agency in a Michigan county other than Kent County. Specifically,
among children who entered care after the launch of the Kent Model (October 2017), those in Kent
County were more likely than children in the comparison group to achieve permanency and exit care
in fewer days. Children in Kent County were also significantly less likely to experience more than
one placement change than their peers in other Michigan counties during the same period.
Next Steps. Evaluation data collected during the second year of the evaluation (first full year of
Kent Model implementation) provided detailed information on service delivery costs, child and
family outcomes, and processes associated with service planning and implementation. During
subsequent waves of the evaluation, the evaluation team will continue to identify and explicate
factors associated with improved outcomes for children and families in Michigan. For example, the
theory underscoring the Kent Model is that increased flexibility and innovation in service delivery is
likely to lead to improved outcomes for families with children in care. It is helpful to understand
findings within and across the process, outcome, and cost studies. For example, as mentioned
previously, agency staff from child placing agencies in Kent County support new service approval
processes but acknowledge they do not have an unlimited pool of funds for services. Relatedly, cost
study findings indicated there were increases in Kent County’s expenditures through the first full
year of Kent Model implementation. Through the process evaluation, the evaluation team could
attempt to unpack agency staff perceptions of service needs relative to costs. Through future
interviews and focus groups, for example, the evaluation team could gauge agency staff knowledge
of and expectations related to service expenditures and how (or if) the awareness influences the
services they recommend to the families they serve.
Increased understanding of changes within and across the three evaluation components will provide
a complete picture of how and why agency processes are associated with changes in costs and
outcomes.

Evaluation of Michigan’s Performance-Based
Funding Model
Second Annual Report
Authors
Westat
Susan H. Chibnall
Karla Eisen
Marnee Evans
Angela Greene
Shauna Harps
Vanessa Kranz
Bryan Williams
University of Michigan,
School of Social Work
Joseph Ryan
Andrew Moore
Chapin Hall at the University
of Chicago
Laura Packard Tucker
Emily Rhodes
November 2019
Prepared for:
Michigan Department of Health and Human
Services
Children’s Services Agency
Lansing, Michigan 48933
Prepared by:
Westat
An Employee-Owned Research Corporation®
1600 Research Boulevard
Rockville, Maryland 20850-3129
(301) 251-1500
Evaluation of Michigan’s Performance-Based
Funding Model: Second Annual Report iii
Table of Contents
Chapter Page
Executive Summary ............................................................................................ viii
E.1 Overview ................................................................................................ viii E.2 Methodology .......................................................................................... viii E.3 Cost Study .............................................................................................. ix E.4 Outcome Study: Safety, Permanency, and Stability ......................... xi E.5 Case Studies: The Nature and Practice of Child Welfare in
Three Michigan Counties ..................................................................... xiv E.6 Conclusions and Next Steps ................................................................ xvii
1 Project Overview ................................................................................................ 1-1
1.1 Overview ................................................................................................ 1-1 1.2 Research Questions .............................................................................. 1-2 1.3 Logic Model ........................................................................................... 1-3 1.4 Methodology .......................................................................................... 1-4
2 Cost and Outcome Studies: An Examination of the PBCWS on Child Welfare Costs and Outcomes in Kent County .................................... 2-1
2.1 Overview: Cost Study ........................................................................... 2-1
2.1.1 Data Sources .......................................................................... 2-2 2.1.2 Data Collection ..................................................................... 2-4 2.1.3 Data Analysis ......................................................................... 2-6 2.1.4 Summary of Cost Study ....................................................... 2-14
2.2 Overview: Outcome Study – Safety, Permanency, and Stability ................................................................................................... 2-15
2.2.1 Safety ...................................................................................... 2-16 2.2.2 Permanency ........................................................................... 2-17 2.2.3 Placement Stability ................................................................ 2-20 2.2.4 Summary of Outcome Study .............................................. 2-23
3 Case Studies: The Nature and Practice of Child Welfare in Three Michigan Counties .............................................................................................. 3-1
3.1 Overview ................................................................................................ 3-1 3.2 Case Study Approach ........................................................................... 3-2 3.3 Process Evaluation Data Collection ................................................... 3-2

Evaluation of Michigan’s Performance-Based
Funding Model: Second Annual Report iv
Contents (continued)
Chapter Page
3.4 County Descriptions: Overall and in Child Welfare ........................ 3-4
3.4.1 Kent County .......................................................................... 3-6 3.4.2 Ingham County ..................................................................... 3-8 3.4.3 Oakland County .................................................................... 3-9
3.5 Process Evaluation Findings ............................................................... 3-11
3.5.1 Kent County .......................................................................... 3-11
Overarching Research Question 1: Do the Counties Adhere to the State’s Guiding Principles In Performing Child Welfare Practice? ............................................................................................................... 3-12
Overarching Research Question 2: Do Child Placing Agencies Adhere to the MiTEAM Practice Model When Providing Child Welfare Services? ................................................................................................ 3-46
3.5.2 Ingham County ..................................................................... 3-55
Overarching Research Question 1: Do the Counties Adhere to the State’s Guiding Principles in Performing Child Welfare Practice? ............................................................................................................... 3-56
Overarching Research Question 2: Do Child Placing Agencies Adhere to the MiTEAM Practice Model When Providing Child Welfare Services? ................................................................................................ 3-62
3.5.3 Oakland County .................................................................... 3-76
Overarching Research Question 1: Do the Counties Adhere to the State’s Guiding Principles in Performing Child Welfare Practice? ............................................................................................................... 3-77
Overarching Research Question 2: Do Child Placing Agencies Adhere to the MiTEAM Practice Model When Providing Child Welfare Services? ................................................................................................ 3-81
3.6 Cross-County Comparisons: Similarities and Differences .............. 3-94
Evaluation of Michigan’s Performance-Based
Funding Model: Second Annual Report v
Contents (continued)
Chapter Page
4 Evaluation Year 2: What Do The Data Tell Us? ........................................... 4-1
4.1 Evaluation Goals and Status................................................................ 4-1 4.2 Summary of Evaluation Findings ....................................................... 4-1 4.3 Next Steps .............................................................................................. 4-3
References ............................................................................................................ R-1
Appendixes
1 PBCWS Logic Model ......................................................................................... A1-1
2 The Evaluation Plan ........................................................................................... A2-1
3 Kent Expenditure Category Mapping ............................................................. A3-1
4 Additional Fidelity Data for Each MiTEAM Competency .......................... A4-1
5 Additional Satisfaction Data with Services Related to Each MiTEAM Competency ...................................................................................... A5-1
Tables
E-1 Exited or still in care .......................................................................................... xii
E-2 Time to exit ......................................................................................................... xiii
E-3 First and initial placement ................................................................................. xiii
2-1 Kent County fiscal data elements by data source .......................................... 2-5
2-2 Kent County – Expenditures trends by Fiscal Year, service Domain, and URM/YAVFC/OTI status ....................................................... 2-8
2-3 WMPC-related – Placement maintenance expenditure trends by placement setting ................................................................................................ 2-9
2-4 WMPC-related revenue totals by overall fund source and Fiscal Year ............................................................................................................ 2-11
2-5 WMPC-related revenue proportions by overall fund source and Fiscal Year ............................................................................................................ 2-11

Evaluation of Michigan’s Performance-Based
Funding Model: Second Annual Report vi
Contents (continued)
Tables Page
2-6 Care days by state Fiscal Year and living arrangement, all Kent County responsible ............................................................................................. 2-12
2-7 Child Placement Events by Entry Year, all Kent County responsible ........................................................................................................... 2-13
2-8 WMPC-related average daily unit cost for out-of-home placements for all, foster home, and congregate care placements .............. 2-14
2-9 Demographics of children in care .................................................................... 2-16
2-10 Risk of maltreatment in care ............................................................................. 2-17
2-11 Second substantiation within one year ............................................................ 2-17
2-12 Exited or still in care .......................................................................................... 2-18
2-13 Cumulative exits to permanency ...................................................................... 2-18
2-14 Cumulative re-entries ......................................................................................... 2-19
2-15 Permanency categories by study group ........................................................... 2-19
2-16 Time to exit ......................................................................................................... 2-20
2-17 Cumulative exits to permanency for older youth ........................................... 2-20
2-18 Placement stability .............................................................................................. 2-21
2-19 First and initial placement ................................................................................. 2-22
2-20 Last and most recently recorded placement ................................................... 2-22
3-1 Data collection sample summary...................................................................... 3-3
3-2 Michigan 2018 state demographics .................................................................. 3-5
3-3 Michigan 2017 state child welfare statistics .................................................... 3-6
3-4 Kent County 2018 demographics ..................................................................... 3-7
3-5 Kent County 2017 child welfare statistics ....................................................... 3-7
3-6 Ingham County 2017 demographics ................................................................ 3-8
3-7 2017 Ingham County 2017 child welfare statistics ........................................ 3-9
Evaluation of Michigan’s Performance-Based
Funding Model: Second Annual Report vii
Contents (continued)
Tables Page
3-8 Oakland County 2018 demographics .............................................................. 3-10
3-9 Oakland County 2017 child welfare statistics ................................................. 3-10
3-10 Key implementation factors .............................................................................. 3-13
3-11 Planning and guidance: Facilitating factors ..................................................... 3-18
3-12 Facilitators associated with Kent Model ......................................................... 3-21
3-13 Factors contributing to private agency staff turnover ................................... 3-34
Figures
E-1 WMPC-related placement maintenance expenditure trends by placement setting ................................................................................................ x
E-2 Care day utilization by state Fiscal Year .......................................................... xi
2-1 WMPC-related placement maintenance expenditure trends by placement setting ................................................................................................ 2-10
2-2 Care day utilization by state Fiscal Year .......................................................... 2-12
3-1 Percentage of sampled caseworkers implementing MiTEAM with fidelity by quarter ................................................................................................ 3-49
3-2 Percentage of sampled caseworkers implementing MiTEAM competencies with fidelity ................................................................................. 3-50
3-3 Percentage of sampled caseworkers implementing MiTEAM with fidelity, by assessment method ......................................................................... 3-51
3-4 Respondents’ overall level of agreement that they were satisfied with services ........................................................................................................ 3-52
3-5 Percentage of parents and foster parents who agreed they were satisfied with services ......................................................................................... 3-53
Exhibits
3-1 WMPC organizational structure ....................................................................... 3-15
3-2 Service request approval process ...................................................................... 3-95

Evaluation of Michigan’s Performance-Based
Funding Model: Second Annual Report viii
Executive Summary
E.1 Overview
The Michigan Legislature, through Public Act 59 of 2013, Section 503, convened a task force to
determine the feasibility of establishing performance-based funding for public and private child
welfare service providers. A recommendation from the task force called for a pilot project to plan
and implement the new funding model, and an independent evaluation of the pilot to assess the
planning and implementation required of such a project, the cost effectiveness, and the child and
family outcomes associated with it. The latter was awarded to Westat and its partners in 2016 and
includes process (Westat) and outcome (University of Michigan School of Social Work) components
and a cost study (Chapin Hall).
Westat and its partners, University of Michigan School of Social Work and Chapin Hall at the
University of Chicago, completed the second of a rigorous five-year evaluation of the Kent Model.
The evaluation compares the Kent Model with the per diem foster care service model, and is
composed of three components: process, outcome, and cost studies. The process evaluation
provides the context for foster care service planning and implementation in Kent, Ingham, and
Oakland counties. The outcome study examines changes in child and family outcomes (i.e., safety,
permanency, and well-being), while the cost study addresses changes in service delivery and
administrative costs for Kent County.
E.2 Methodology
The process evaluation is designed to provide the context for foster care service planning and
implementation in the three counties, while the outcome and cost components of the evaluation are
designed to compare the Kent Model to the per diem model being implemented across the state
using matched comparison groups (developed using propensity score matching); the outcome study
documents changes in child and family outcomes (i.e., safety, permanency, and stability), while the
cost study will address the types, amounts, costs, and cost-effectiveness of services that children in
out-of-home placements receive.
Evaluation of Michigan’s Performance-Based
Funding Model: Second Annual Report ix
E.3 Cost Study
The cost study is designed to understand the fiscal effects of the transition to the Kent Model. For
the current report, the evaluation team examined Kent County’s system-level expenditure and
revenue trends, concentrating on the three-year baseline period (FY 2015 through FY 2017) and the
first year post-implementation (FY 2018).1 Sources of administrative data are: (1) MiSACWIS
payment data, (2) MiSACWIS placement data, (3) WMPC Actual Cost Reporting Workbook and
Accrual Detail, (4) BP 515 Payment Workbook (defined on pg. 2-3) , and (5) Trial Reunification
Payments.
Total Expenditures. Kent County’s total out-of-home service expenditures increased over time.
The largest increase was from FY 2017 to FY 2018, when total expenditures increased by $6 million
(a 23 percent increase). Placement maintenance (e.g., daily maintenance rate for a child’s placement)
and administrative expenses (e.g., agencies’ daily administrative rate paid for a child’s placement)
increased from FY 2017 to FY 2018, and placement maintenance expenditures decreased between
FY 2015 and FY 2017 and stayed stable into FY 2018 (Figure E-1). Child caring institution (CCI)
placement maintenance expenditures increased each observable year, and the trend continued into
the first year of the post-implementation period.
1 WMPC does not provide services for voluntary foster care (YAVFC), youth with a juvenile justice designation (OTI), or unaccompanied refugee minors (URM), because data for these groups are excluded.
Evaluation of Michigan’s Performance-Based
Funding Model: Second Annual Report x
Figure E-1. WMPC-related placement maintenance expenditure trends by placement setting
Care Day Utilization. In terms of care day utilization, total care days increased from 293,472 in
FY 2017 to 301,493 days in FY 2018 (Figure E-2). Kinship care and congregate care showed the
largest total increase in care days when comparing FY 2018 to FY 2017, increasing by 7 percent and
5 percent respectively. Foster care days stayed stable, increasing only 1 percent in FY 2018.
$0
$2,000,000
$4,000,000
$6,000,000
$8,000,000
$10,000,000
$12,000,000
$14,000,000
FY 2015 FY 2016 FY 2017 FY 2018
Child Caring Institution Foster Home Independent Living
Treatment Foster Care Enhanced Foster Care

Evaluation of Michigan’s Performance-Based
Funding Model: Second Annual Report xi
Figure E-2. Care day utilization by state Fiscal Year2
Average Unit Costs. “Average unit costs” are calculated by dividing the total annual placement
maintenance expenditures by total placement days for each fiscal year. In Kent County for out-of-
home placements (excluding URM, YAVFC, and OTI), the average daily cost per care day increased
each year from FY 2015 through FY 2018 Figure E-2). From FY 2015 to FY 2018, congregate care
days increased while foster care days stayed stable. However, increases in spending have outpaced
increases in care days. Thus, the observed increase in average daily unit cost most likely stems from
shifting to more expensive care types (e.g., congregate care) from less costly ones (e.g., foster care).
E.4 Outcome Study: Safety, Permanency, and Stability
The evaluation team used propensity score matching (PSM) to generate a comparison group to
determine if there were statistically significant differences between children served by WMPC
(through the Kent Model) and children served by private agencies in other Michigan counties
(through the per diem model) for FY 2018 (the first year of Kent Model implementation).
Overall, 17.6 percent of children experienced a Cat I-III maltreatment disposition while they were in
an out-of-home placement setting or still under the legal guardianship/supervision of the State.
2 Congregate care in this figure includes both shelter and detention.
0
20,000
40,000
60,000
80,000
100,000
120,000
140,000
160,000
180,000
200,000
2015 2016 2017 2018
Foster Care Kinship Parental Home All Congregate All Other
Evaluation of Michigan’s Performance-Based
Funding Model: Second Annual Report xii
There were no significant differences between children served in Kent County and similar children
served by private agencies outside of Kent County.
Exits. To determine rates of permanency (formal discharge from foster care), the evaluation team
calculated the proportion of children who are still in care, and their associated length of stay (LOS)
in days (Table E-1). For children who entered care after 10/1/2017, more children in Kent County
than in other counties exited care during FY 2018 (12.31% vs. 8.23%). In comparison to children in
other Michigan counties, children in Kent County who entered care after 10/1/2017 tended to stay
fewer days in care on average (106.9 as compared with 149.6 days). This difference is statistically
significant.
Table E-1. Exited or still in care
Group Exit status N % Exited
LOS
Median LOS Mean LOS SD
Comparison, entered after
10/1/2017
In Care 435 91.77 181 183.7 102.3
Exited 39 8.23 165 149.6 90.9
Comparison, in care prior
to 10/1/2017
In Care 493 63.29 662 791.3 456.6
Exited 286 36.71 643 688.8 357.6
Kent, entered after
10/1/2017
In Care 399 87.69 174 167.5 106.0
Exited 56 12.31 78 106.9 94.0
Kent, in care prior to
10/1/2017
In Care 497 62.28 655 793.5 485.6
Exited 301 37.72 692 731.6 375.8
Time to Exit. A higher percentage of children in Kent County who entered care after 10/1/2017
exited within 6 months relative to the comparison group (10.77% vs. 4.64%). A higher percentage of
children from Kent County than children in the comparison group also exited care within 18
months (12.31% vs. 8.23%). The vast majority of children who entered care after 10/1/2017 exited
to reunification (74.4%). Given that reunification and adoption are the two most common types of
permanency outcomes overall, the evaluation team closely examined the amount of time (in days)
until exiting care to one of these types (Table E-2). Children in Kent County who entered after
10/1/2017 exited to reunification significantly faster than those in the comparison group (102.2 vs.
153.2 days).

Evaluation of Michigan’s Performance-Based
Funding Model: Second Annual Report xiii
Table E-2. Time to exit
Group Exit type Total exited
Time to exit:
Mean Median Std. deviation
Comparison, entered
after 10/1/2017
Adoption 3 260.7 268.0 12.7
Reunification 29 153.2 166.0 93.9
Comparison, in care prior
to 10/1/2017
Adoption 138 832.6 751.5 356.7
Reunification 129 511.0 461.0 236.1
Kent, entered after
10/1/2017
Adoption 1 259.0 259.0 N/A
Reunification 51 102.2 78.0 95.1
Kent, in care prior to
10/1/2017
Adoption 139 903.3 843.0 307.6
Reunification 132 516.9 492.0 289.6
Placement Changes. Ideally, the number of placement changes a child experiences while in foster
care are minimized, as successive changes in foster care placement can be equally disorienting and
disruptive to a child’s ability to maintain a sense of continuity in their living arrangements and
caregivers. For children who entered care after 10/1/2017, children in Kent County were
significantly less likely than children in the comparison group to experience two or more placements.
First Placement. Children in Kent County were significantly more likely to be placed in a relative’s
home and less likely to be placed with an unrelated foster parent for their first placement, compared
with children in the comparison group (Table E-3).
Table E-3. First and initial placement
Setting description
Comparison,
entered after
10/1/2017
Comparison, in
care prior to
10/1/2017
Kent, entered
after
10/1/2017
Kent, in care
prior to
10/1/2017 Total
Missing 0.0% (0) 0.5% (4) 1.8% (8) 1.1% (9) 0.8% (21)
Juvenile Guardianship
Home
0.0% (0) 1.3% (10) 1.5% (7) 1.9% (15) 1.3% (32)
Child Caring Institution 2.7% (13) 1.4% (11) 0.0% (0) 3.3% (26) 2.0% (50)
Other 5.7% (27) 3.6% (28) 0.9% (4) 2.5% (20) 3.2% (79)
AWOL 2.1% (10) 2.3% (18) 4.6% (21) 5.3% (42) 3.6% (91)
Parental Home 2.5% (12) 1.3% (10) 12.7% (58) 3.0% (24) 4.2% (104)
Emergency Residential
Shelter
1.9% (9) 3.0% (23) 5.5% (25) 9.1% (73) 5.2% (130)
Adoptive Home 1.3% (6) 8.9% (69) 0.9% (4) 9.0% (72) 6.0% (151)
Hospital 8.9% (42) 7.3% (57) 7.0% (32) 7.9% (63) 7.7% (194)
Licensed/Unlicensed
Relative Home
13.1% (62) 21.4% (167) 25.9% (118) 16.9% (135) 19.2% (482)
Licensed Unrelated
Foster Home
61.8% (293) 49.0% (382) 39.1% (178) 40.0% (319) 46.8% (1172)
Total 100.0% (474) 100.0% (779) 100.0% (455) 100.0% (798) 100.0% (2506)
Evaluation of Michigan’s Performance-Based
Funding Model: Second Annual Report xiv
E.5 Case Studies: The Nature and Practice of Child Welfare in
Three Michigan Counties
The process evaluation is designed using a case study approach to examine similarities and
differences in child welfare practice in Kent, Ingham, and Oakland counties. Process evaluation
findings provide the framework for understanding child welfare practice in the counties. In addition,
as the focus of the pilot, process evaluation findings for Kent County also provide context for
understanding associated outcomes and costs.
During the second round of site visits to MDHHS and Kent, Ingham, and Oakland counties,
conducted one year after the launch of the Kent Model, the process evaluation team conducted 56
interviews and focus groups with public child welfare and private agency leadership, and a sample of
supervisors and caseworkers. Interviews were also conducted with stakeholders from the court and
mental health systems, and in Kent County, the county administrator and staff at the WMPC. Focus
groups and interviews covered topics that included MiTEAM, case management, interagency
collaboration, and data systems.
Kent, Ingham, and Oakland counties vary widely relative to certain characteristics, including racial
and ethnic composition, rate of confirmed cases of child abuse and neglect, and family poverty
status. Populations range from just under 300,000 people in Ingham County to over 1 million people
in suburban Oakland County. Although there may be variation in the number of families with
children in care, each county’s locale (e.g., rural, suburban), and other community characteristics,
child welfare agency staff in all three counties share a common goal: to provide appropriate and
timely services for children and families, and guide them toward achieving positive outcomes.
Child Welfare Service Delivery. Interview and focus group respondents from private agencies in
Ingham County reported that one barrier to serving families effectively is the requirement that they
obtain approval from Ingham County DHHS for services, which can take a considerable amount of
time. Kent County respondents described similar delays in service request approvals from Kent
County DHHS prior to implementation of the Kent Model. Through the model, each of the five
private agencies now has a dedicated WMPC Care Coordinator who authorizes service requests in a
timely manner.

Evaluation of Michigan’s Performance-Based
Funding Model: Second Annual Report xv
Interagency Collaboration. In Kent and Ingham counties, respondents described collaboration
among child welfare agencies and community partners as occurring partly through interagency
councils. For example, in Kent County, the County Administrator and representatives from Kent
County DHHS private child-placing agencies, the court system, mental health, and foundations,
convene quarterly through the Kent County Family and Children’s Coordinating Council. In Ingham
County, representatives from many of the same agencies (Ingham County Department of Health
and Human Services, private child-placing agencies, court system, and mental health) meet quarterly
through the Child Welfare Coordinating Council. Respondents reported that regular interagency
meetings provide an opportunity for sharing agency-specific information and updates. In Kent
County, respondents expressed appreciation for WMPC’s level of collaboration, particularly as the
newest community partner and administrator of the Kent Model.
There were similarities and differences across counties in the quality of interagency partnerships.
While respondents in Ingham County described generally positive relationships among staff in
public and private agencies, attributed to factors such as longstanding partnerships and Ingham
County DHHS’s facilitation of interagency meetings or trainings; in Oakland County, respondents
reported tensions in public-private agency staff relationships, which suggest that these may need
strengthening. In Oakland County, one concern that respondents described is differences among
agency staff in ideologies that may influence case decisions and subsequent child and family
outcomes (e.g., “Things that I say and the way I look at things are going to be different than the way another
supervisor looks at them.”). Respondents from the three counties agreed that communication issues
made effective collaboration between public and private child welfare agencies a challenge. For
example, respondents mentioned the need for better channels of communication in Kent County,
frustration with unresponsiveness in Ingham County, and lapses in communication in Oakland
County.
Descriptions of relationships between child welfare agencies and the county court system were also
mixed. While child welfare respondents in Oakland County described collaboration with the court
system as productive, and the DHHS liaison as a key contributor to effective partnering, child
welfare respondents in Kent and Ingham counties described major challenges to working with their
respective court system. For example, respondents in Kent County expressed concerns about poor
treatment of foster care workers by judges and attorneys during court testimony, and respondents in
Ingham County described workers’ intimidation with the court process.
Evaluation of Michigan’s Performance-Based
Funding Model: Second Annual Report xvi
Staff Turnover and Training. Respondents in Kent,
Ingham, and Oakland counties described staff turnover
as a major challenge to serving families with children in
care effectively. Agency staff who remain in their
position for a number of years, often because they want
to help children and families, reported that it can be
difficult to remain in a high-stress position with long hours and inadequate compensation over time.
Across counties, respondents stated that private agency staff frequently seek positions in public
agencies for improved salaries and benefits, or child welfare staff seek less stressful positions.
As agency staff move to different positions within the same agency, some respondents in Kent
County noted that it would be helpful to receive training or more guidance around the new
responsibilities. Additionally, Kent County DHHS staff reported that it would be helpful to have
more training and guidance on the Kent Model to increase awareness of changing expectations and
requirements. Across the three counties, respondents described opportunities to participate in
trainings on a number of topics to improve child welfare practice. Some trainings are optional while
others are mandated by either a public or private county agency or MDHHS. Respondents identified
a number of trainings that would be useful as well as ways in which required trainings could be
improved, including:
Increased opportunities for shadowing or observations during CWTI training,
More training on MiSACWIS that delves into specific system components, and
Guidance on court processes and interactions with court representatives.
Data Systems and Tools. When asked about the utility of MiSACWIS, respondents stated that
although the state-mandated data system has improved over time, more improvements are needed.
Agency staff in Ingham and Oakland counties stated that having a central system for storing and
accessing case documents is one of the benefits of MiSACWIS, while respondents in Kent County
noted that the system made some aspects of their work easier. Additionally, respondents in Ingham
and Oakland counties stated that they use MiSACWIS’ Book of Business—for workers to monitor
progress toward completing tasks in Ingham County, and as part of supervision in Oakland County.
Turnover Effects
Constant case reallocations
Increased workload and stress
Compromised service quality
Difficulty building family trust
Inadequate support for new staff
Inadequate time for data reporting
Evaluation of Michigan’s Performance-Based
Funding Model: Second Annual Report xvii
In terms of challenges to using MiSACWIS, respondents in both Kent and Oakland counties
identified the number of “clicks” that are often necessary to navigate the system as excessive and
time-consuming. Additionally, respondents in Oakland and Ingham counties acknowledged that the
ability of system users to access valid and reliable information depends on the extent to which other
users enter complete and accurate information in a timely manner, which does not always happen.
Respondents in all three counties expressed frustration that MiSACWIS is not user-friendly and
requires a substantial amount of time to enter data.
MDHHS also mandates that agencies use the state’s Fidelity
Tool and data system to assess and report the extent to
which workers implement the MiTEAM practice model as
intended. Respondents from all three counties discussed the
time necessary to complete the Fidelity Tool, and were aware of the types of data yielded from the
assessments, but they expressed disappointment that they do not receive feedback from the
assessments that could help them improve practice. Additionally, respondents in Kent and Ingham
counties noted that questions in the Fidelity Tool do not apply to certain positions, such as licensing
workers, as they do not work directly with families.
E.6 Conclusions and Next Steps
Kent, Ingham, and Oakland counties vary across several characteristics, such as foster care funding
mechanisms (performance-based in Kent County, per diem in Ingham and Oakland counties),
population (ranging from under 300,000 people in Ingham County to over one million people in
Oakland County), and rates of confirmed victims of child abuse and neglect. For 2019, the number
of confirmed victims is below the state rate of 18.9 per 1,000 children in Oakland County (8.4), but
above the state rate in Kent County (19.8) and Ingham County (31.5). Across counties, respondents
described staff turnover as a major challenge to serving families effectively. Respondents associated
high turnover, due to factors such as low salaries and high stress, with consequences that include
inadequate service quality and placement instability. Respondents agreed that turnover is a challenge
but acknowledged steps being taken to address it at the state level (e.g., professional development)
and locally (e.g., MiTEAM subgroups in Oakland County).
Fidelity Assessment Challenges
Time-consuming
Does not apply to all positions
Tool is not user-friendly
Evaluation of Michigan’s Performance-Based
Funding Model: Second Annual Report xviii
Similarities and differences among the counties in composition and child welfare agency
characteristics and experiences are important to consider relative to the goals of the Kent Model.
The impetus for the shift from implementation of a per diem to a performance-based funding
model is the Michigan Legislature’s priority to improve child welfare outcomes through increased
flexibility and innovation in service provision for families with children in care. Although the
performance-based model is currently being piloted in Kent County, stakeholders should understand
contextual variables that may affect service delivery (and related costs and outcomes), if the model
were to be implemented in other Michigan counties in the future.
During interviews and focus groups conducted as part of the process evaluation, respondents in
Kent County reported that over the past year, they observed more innovative thinking about
services during case planning and fewer bureaucratic barriers preventing them from identifying
creative solutions to address family needs. Caseworkers also increased reliance on Enhanced Foster
Care as a primary method of stabilizing placements and supporting high-need foster children and
caregivers.
Respondents in Kent County described the nature of interactions between child placing agencies
and the WMPC, the entity supporting and providing oversight of the Kent Model, over the past
year. They indicated that communication among agency and WMPC staff is frequent and effective,
and respondents from nearly all of the child placing agencies described the agency-WMPC
collaborative relationship as strong. Additionally, through the Kent Model, each of the five child
placing agencies in Kent County has a designated WMPC Care Coordinator who authorizes service
requests, when required, in less time than was typical prior to the model’s launch. Although
respondents in Kent County described challenges to the new service authorization process (e.g.,
learning curve for some WMPC and private agency staff), the new process has facilitated child
welfare practice in several ways (e.g., increased efficiency and timeliness of services). In contrast,
respondents in child placing agencies in Ingham County reported that the considerable time lag
between service requests and approvals can be a barrier to serving families effectively.
Although agency staff from child placing agencies in Kent County appreciate the ease with which
service requests are approved when required, they are cognizant that the funds are not unlimited. As
one respondent expressed, “I am worried about like, I’m going to run out of money?” Cost study findings
indicate that expenditures in Kent County increased between baseline (fiscal years 2015-2017) and

Evaluation of Michigan’s Performance-Based
Funding Model: Second Annual Report xix
the first year of Kent Model implementation (fiscal year 2018). Over this period, total expenditures
in Kent County increased by 51 percent for out-of-home placement services. Between fiscal years
2017 and 2018, expenditures for maintenance of congregate care increased by 51 percent and the
number of days children spent in care increased by 17 percent.
There were significant differences in outcomes between children served by child placing agencies in
Kent County and those in a matched comparison group, in which at least 80 percent of services
were provided by a child placing agency in a Michigan county other than Kent County. Specifically,
among children who entered care after the launch of the Kent Model (October 2017), those in Kent
County were more likely than children in the comparison group to achieve permanency and exit care
in fewer days. Children in Kent County were also significantly less likely to experience more than
one placement change than their peers in other Michigan counties during the same period.
Next Steps. Evaluation data collected during the second year of the evaluation (first full year of
Kent Model implementation) provided detailed information on service delivery costs, child and
family outcomes, and processes associated with service planning and implementation. During
subsequent waves of the evaluation, the evaluation team will continue to identify and explicate
factors associated with improved outcomes for children and families in Michigan. For example, the
theory underscoring the Kent Model is that increased flexibility and innovation in service delivery is
likely to lead to improved outcomes for families with children in care. It is helpful to understand
findings within and across the process, outcome, and cost studies. For example, as mentioned
previously, agency staff from child placing agencies in Kent County support new service approval
processes but acknowledge they do not have an unlimited pool of funds for services. Relatedly, cost
study findings indicated there were increases in Kent County’s expenditures through the first full
year of Kent Model implementation. Through the process evaluation, the evaluation team could
attempt to unpack agency staff perceptions of service needs relative to costs. Through future
interviews and focus groups, for example, the evaluation team could gauge agency staff knowledge
of and expectations related to service expenditures and how (or if) the awareness influences the
services they recommend to the families they serve.
Increased understanding of changes within and across the three evaluation components will provide
a complete picture of how and why agency processes are associated with changes in costs and
outcomes.
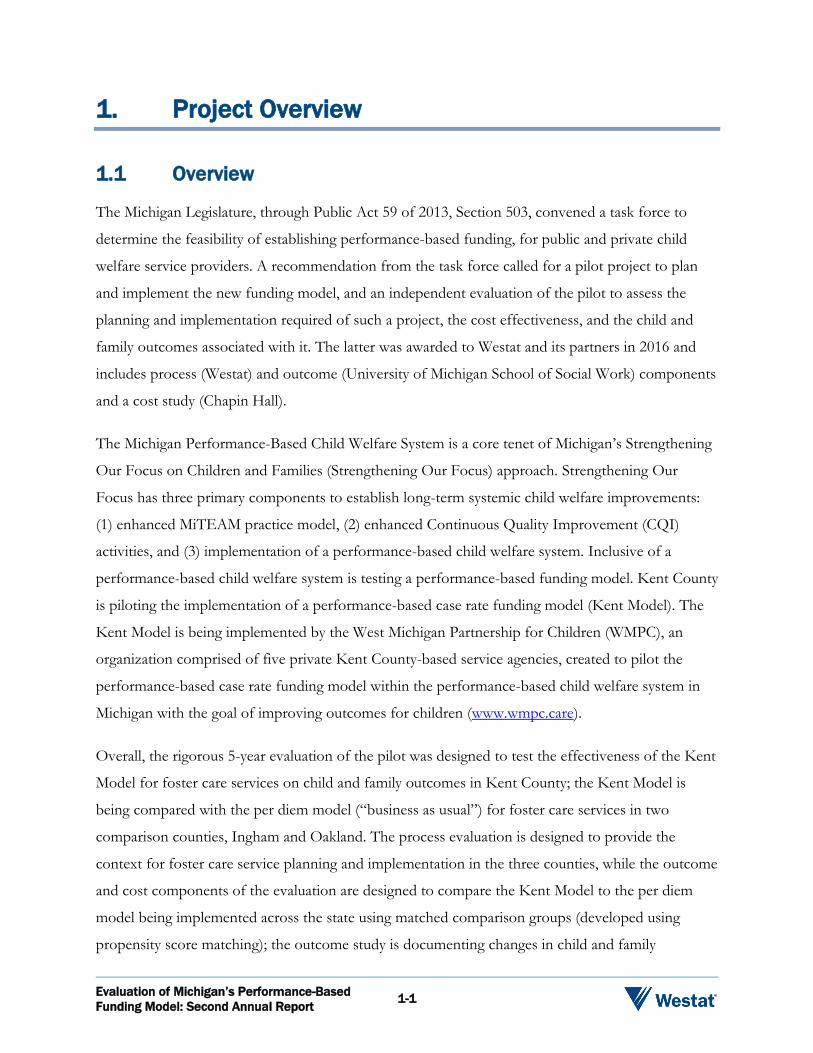
Evaluation of Michigan’s Performance-Based
Funding Model: Second Annual Report 1-1
1. Project Overview
1.1 Overview
The Michigan Legislature, through Public Act 59 of 2013, Section 503, convened a task force to
determine the feasibility of establishing performance-based funding, for public and private child
welfare service providers. A recommendation from the task force called for a pilot project to plan
and implement the new funding model, and an independent evaluation of the pilot to assess the
planning and implementation required of such a project, the cost effectiveness, and the child and
family outcomes associated with it. The latter was awarded to Westat and its partners in 2016 and
includes process (Westat) and outcome (University of Michigan School of Social Work) components
and a cost study (Chapin Hall).
The Michigan Performance-Based Child Welfare System is a core tenet of Michigan’s Strengthening
Our Focus on Children and Families (Strengthening Our Focus) approach. Strengthening Our
Focus has three primary components to establish long-term systemic child welfare improvements:
(1) enhanced MiTEAM practice model, (2) enhanced Continuous Quality Improvement (CQI)
activities, and (3) implementation of a performance-based child welfare system. Inclusive of a
performance-based child welfare system is testing a performance-based funding model. Kent County
is piloting the implementation of a performance-based case rate funding model (Kent Model). The
Kent Model is being implemented by the West Michigan Partnership for Children (WMPC), an
organization comprised of five private Kent County-based service agencies, created to pilot the
performance-based case rate funding model within the performance-based child welfare system in
Michigan with the goal of improving outcomes for children (www.wmpc.care).
Overall, the rigorous 5-year evaluation of the pilot was designed to test the effectiveness of the Kent
Model for foster care services on child and family outcomes in Kent County; the Kent Model is
being compared with the per diem model (“business as usual”) for foster care services in two
comparison counties, Ingham and Oakland. The process evaluation is designed to provide the
context for foster care service planning and implementation in the three counties, while the outcome
and cost components of the evaluation are designed to compare the Kent Model to the per diem
model being implemented across the state using matched comparison groups (developed using
propensity score matching); the outcome study is documenting changes in child and family
Evaluation of Michigan’s Performance-Based
Funding Model: Second Annual Report 1-2
outcomes (i.e., safety, permanency, and well-being), while the cost study addresses cost effectiveness
in service delivery.
1.2 Research Questions
The evaluation is guided by the following research questions that are relevant to each component of
the evaluation (process, cost, and outcome).
Process Component
RQ1: Do the counties adhere to the state’s guiding principles in performing child welfare practice?
RQ2: Do child placing agencies adhere to the MiTEAM practice model when providing child welfare services?
– Subquestion: What resources (strategies, infrastructure) are necessary to support the successful delivery of child welfare services?
– Subquestion: What factors facilitate and inhibit effective implementation of child welfare practice, in general, and, importantly, the Kent Model (in Kent County)?
– Subquestion: (Kent County) What resources are necessary to support the successful implementation of the Kent Model (i.e., performance-based case rate funding model)?
Cost Component
To what extent does the case rate fully cover the cost of services required under the contract?
What effect has the transition to performance-based case rate contracting had on expenditure and revenue patterns in Kent County?
Evaluation of Michigan’s Performance-Based
Funding Model: Second Annual Report 1-3
How does the cost of out-of-home care in Kent County compare to the cost of out-of-home care in prior periods and to the rest of the state?
Cost effective sub-studies3
Outcome Component
Does the Kent Model, a performance-based case rate funding model, improve the safety of children?
Does the Kent Model improve permanency for children?
Does the Kent Model improve the well-being of children and families?
1.3 Logic Model
To illustrate the theory of change for the evaluation of the Kent Model, a logic model was created
by the evaluation team (Appendix 1). That is, the logic model created a visual depiction of the theory
underlying how and why certain changes are expected to occur relative to Kent Model
implementation. The evaluation team is examining planning and implementation of the model
through the evaluation’s process, outcome, and cost studies. Primary activities carried out through
the studies are captured in three streams of logic model components, or pathways of interconnected
components that span from activities to outcomes. A fourth stream shows cross-cutting
components, or components that are related to all three studies.
The four streams or components begin with the inputs, or resources that support and are integral to
implementation of the Kent Model. Agency/organizational staff, funding, service recipients, and
data and research are the key assets or resources that stakeholders rely on to implement the Kent
Model. Subsequent columns in the logic model show major activities carried out through the
process, outcome, and cost studies (e.g., access administrative data on children served by child
3 Cost-effectiveness analysis examines the relationship between a program’s costs and a relevant unit of program effectiveness. In this instance, a cost-effectiveness analysis will begin by assessing the cost per child’s spell in out-of-home care. An average cost will be calculated for out-of-home spells in-care for each major, identifiable placement type. These placement costs will be linked to outcome(s) of interest from the outcome study to provide evidence to assist stakeholders in deciding if the outcomes under the Kent Model were cost effective when compared to baseline performance and costs in Kent county, and the matched comparison population in the rest of the state. In general, a program is considered more cost-effective than another if it is: less costly and at least as effective; more effective and more costly, but the additional benefit is considered worth the extra cost; or less effective and less costly, when the added benefit is not considered worth the extra cost.

Evaluation of Michigan’s Performance-Based
Funding Model: Second Annual Report 1-4
welfare agencies in Michigan counties), as well as resulting outputs or deliverables from the activities
(e.g., outcomes for children in Kent County and other Michigan counties are tracked). Finally,
components in the short-, mid-, and long-term outcomes columns represent the immediate, gradual,
and systemic changes that are expected to occur (e.g., improved child safety, permanency, and well-
being outcomes).
1.4 Methodology
The purpose of this evaluation is to rigorously test whether the pilot produces improved outcomes
for children and families, is cost effective, and allows for the effective allocation of resources to
promote local service innovation, create service efficiencies, and incentivize child placing agencies to
be accountable for achieving performance standards.
Overarching Design: Matched Comparison Model Combined with a Descriptive
Case Study Approach
This evaluation provides the team with an opportunity to combine two methodologies into one
overall design. First, the outcome and cost studies are based on a matched comparison design. This
design allows administrative outcome (safety, permanency, and well-being) and cost data associated
with the Kent Model to be compared with those for the per diem model using matched comparison
groups drawn from across the state and developed using propensity score matching. These
comparisons allow the evaluation team to answer the research questions of interest. The process
evaluation is based on a case study approach, which is described in more detail in Chapter 3. The
overall evaluation plan (e.g., research questions, indicators, methods, and data sources for the three
components) is in Appendix 2.
Report Overview
This report is divided into two additional chapters: (1) Chapter 2, Cost and Outcome Studies; and
(2) Chapter 3, Case Studies: The Nature and Practice of Child Welfare in Three Michigan Counties.
Each of these chapters begins with an overview of the evaluation component and then presents the
main findings of it. The process evaluation, which is built on a case study design, is organized by
county, with a section at the end for cross-county findings.

Evaluation of Michigan’s Performance-Based
Funding Model: Second Annual Report 2-1
2. Cost and Outcome Studies: An Examination of
the PBCWS on Child Welfare Costs and
Outcomes in Kent County
2.1 Overview: Cost Study
The cost study is designed to understand the fiscal effects of the transition to the Kent Model using
primarily system-level and child-level fiscal and placement data in Kent County. The overarching
research questions are:
RQ 1: What effect has the transition to the Kent Model had on expenditure and revenue patterns in the County?
RQ2: How does the cost of out-of-home care in Kent County compare to the cost of out-of-home care in the rest of the state of Michigan?
RQ3: To what extent does the West Michigan Partnership for Children (WMPC) case rate fully cover the cost of services required under the contract?
RQ4: What are the cost implications of the outcomes observed under the transition to the Kent Model?
The cost study addresses these research questions in the following ways. To address the first
research question, which is the focus of this report, system-level expenditure and revenue trends
were examined in Kent County, concentrating on the three-year baseline period (FY 2015 through
FY 2017) and the first year post-implementation (FY 2018). In later reports, these expenditure
patterns and revenue sources will also be compared with those across the state, to address the
second research question. This comparison to statewide expenditure patterns will be made using
individual child-level cost data. The type, amounts, and costs of services received by children in out-
of-home placements will be examined and compared with those provided to a matched cohort of
children receiving out-of-home services delivered by private providers across the state.
Future reports will also address the third and fourth research questions. For the third research
question, to understand whether the WMPC case rate fully covers the cost of services required
under the contract, the analysis will assess the extent to which case rates applied to individual child
and family services equals the total program and service expenditures for the services provided to
those children and families. Finally, the fourth research question will be addressed using cost‐
Evaluation of Michigan’s Performance-Based
Funding Model: Second Annual Report 2-2
effectiveness substudies that will be conducted for key outcomes (safety, permanency, and well-
being) identified in the outcome evaluation.
2.1.1 Data Sources
The cost study currently uses administrative data collected from these sources:
1. MiSACWIS Payment Data. These data include only paid4 payments where Kent County was listed as the responsible county, from 5/1/2014 through 9/30/2018, for all child and family services (at the child level) during those times when a child was in out-of-home placement up until the point of discharge. These data are categorized by their Service Domain, Service Category, and Service Description. A full mapping of these expenditure categories is in Appendix 3. The data are assigned to the appropriate fiscal year via their Claim Begin and Claim End Date.5 For any payments that spanned multiple fiscal years, their total cost was pro-rated across the applicable fiscal years based on the number of days within the claim period in each fiscal year.
2. MiSACWIS Placement Data. This is the same child-level data the University of Michigan used in the outcome study. The cost study uses placement data to measure care day utilization and the number of days spent in care by placement type. These data are combined with fiscal data to assess the “average daily unit cost of care” to examine how these daily out-of-home costs have changed before and after the Kent Model was first implemented (10/01/2017).
3. WMPC Actual Cost Reporting Workbook and Accruals Detail. These quarterly workbooks include comprehensive documentation of WMPC operational costs, including administrative costs, payments to private agencies for services provided, child-level residential payments, case rate revenue payments, and other revenue sources for FY 2018 only (10/1/2017 through 9/30/2018). Because the WMPC Cost Report is recorded on a cash basis, these data were supplemented with accrual payment data from the WMPC for private agency expenses claimed but not paid in FY18 (and, as such, not recorded in the FY18 WMPC Cost Reports). FY 2018 data from the WMPC Cost Report and Accruals Detail used in this study include:
A. CCI Placement Payments. Taken from the Residential Services tab Total Payments and the Accruals Detail, these CCI Placement Payments represent the full scope of the CCI maintenance costs in FY 2018.
B. PAFC and EFC Administration Payments. Beginning in FY 2018 (10/1/2017 forward), foster care, independent living, and EFC administrative payments in Kent County were no longer logged in MiSACWIS. For the purposes of the cost study, these expenditures will now be captured on the WPMC Cost Report and
4 All unpaid services are excluded.
5 Claim dates in MiSACWIS represent the dates of the pay period of when the service occurred, not the dates of the actual payment for the service.
Evaluation of Michigan’s Performance-Based
Funding Model: Second Annual Report 2-3
associated Accruals Report, in the case of EFC Administration. The PAFC and EFC Administration Payments are reported in the aggregate on the WMPC Cost Report. The information below maps out the method for assigning and incorporating these costs.
(a) PAFC Admin. The total PAFC Administration expense is evenly allocated at the child-level across all applicable days in the specified Service Descriptions in the appropriate fiscal year. PAFC Admin is applied in full on placement start date, and no PAFC Admin is applied on the end date of a placement.6
(b) Enhanced Foster Care (EFC) Agency Premium Administration Payments. The total EFC Agency Premium Administration expense incorporated in this Cost Study is taken in aggregate from the WMPC Cost Report and Accruals detail and is not allocated at the child level.7
(c) Other Purchased Services – Kids First. Representing expenses made to secure available beds, these costs were captured on both the WMPC Cost Report and Accrual Detail. They were grouped under the Service Domain of Residential Services.8 (See Appendix 3 for a full mapping of expenditures codes.)
4. BP 515 Payment Workbook. Spanning FY 2015 through FY 2017, these annual workbooks include the monthly BP 515 expenses – the administration costs for children’s placements that traditionally would not have received an administrative rate (e.g., residential care, unlicensed relatives) – by agency and revenue source. These workbooks are used because during the baseline period (FY 2015 through FY 2017), BP 515 costs were not recorded in MiSACWIS. In FY 2018 and afterward, these costs are included in the PAFC admin rate within the WMPC Actual Cost Reporting Workbook.
5. Trial Reunification Payments. Spanning FY 2015 through FY 2017, these trial reunification payments – administrative payments made to agencies during the time a child is on a trial home discharge – include detail at the agency and fiscal-year level. These payments are used because during the baseline period (FY 2015 through FY 2017), trial reunification payments were not recorded in MiSACWIS. In FY 2018 and afterward, these costs are included in the PAFC admin rate within the WMPC Actual Cost Reporting Workbook.
6 In FY 2018, total PAFC Admin was found in the quarterly WMPC Cost Report – WMPC tab, cell C62. FY 2018’s total PAFC administrative expense was $15,051,799. The applicable Service Descriptions included in the PAFC Admin allocation were 1780 – General Foster Care, 1782 – General Independent Living, 1783 – Specialized Independent Living, and all CCI Placement Payments included in the WMPC Cost Report Residential Services tab. Since these payments are paid prospectively, there was no need to include accrual information.
7 In FY 2018, total EFC Admin was found in the quarterly WMPC Cost Report – WMPC tab, cell C64 – and in the Accruals Detail report. FY 2018’s total EFC administrative expense was $480,770.
8 WMPC Cost Report – WMPC tab, cell C66.
Evaluation of Michigan’s Performance-Based
Funding Model: Second Annual Report 2-4
The integration of these data sources into a comprehensive assessment of fiscal activity in Kent
County is further detailed in the sections that follow, including the data collection and analysis
sections.
2.1.2 Data Collection
The cost study team received fiscal and placement data for the period of 10/1/14 through 9/30/18
(FY 2015 through FY 2018) for all counties in Michigan. However, as noted above, for this report,
we focus on Kent County, system-level expenditure and revenue trends only. Fiscal and placement
data are limited to those for which Kent County is recorded as having legal responsibility for the
child and thus has responsibility for providing placement and other services to the child (and
family).9
The WMPC provides services to most – but not all – children for which Kent County is responsible.
Young adults in voluntary foster care (YAVFC), youth with a juvenile justice designation (OTI), and
unaccompanied refugee minors (URM) are not under the WMPC’s purview. The cost study
identified children that the WMPC served based on their WMPC program dates, their YAVFC and
OTI legal status, and a child-level indicator that they are not URM. Additionally, any expenditure
associated with the URM Overall Funding Source was excluded. These child-level identifiers allow
WMPC-related payments and placements to be analyzed separately from those served by Kent
County, but not by the WMPC. These parameters were also applied to the baseline period of
FY 2015 through FY 2017 so that the fiscal activity in FY 2018 could be compared with a similar
population of children. To summarize, all expenditure, revenue, and placement data presented in
this Cost Study excludes any records associated with a URM, YAVFC, or OTI case – both in the
pre- and post-implementation period.
Table 2-1 summarizes key cost data elements and data sources. It is important to note that because
the WMPC began implementation of the Kent Model on 10/1/2017, some data sources vary across
the two time periods (before and after implementation).
9 Each fiscal and placement record indicates a County of Responsibility and Removal County. For this report, we are focusing on the County of Responsibility.

Evaluation of Michigan’s Performance-Based
Funding Model: Second Annual Report 2-5
Table 2-1. Kent County fiscal data elements by data source
Data source
Pre-implementation
(10/1/14 – 9/30/17)
Post-implementation
(10/1/17 – 9/30/18)
MiSACWIS Payments Maintenance and administrative
payments for out-of-home
placement services
Includes all private agency
administrative payments and all
Child Caring Institution (CCI)
payments
Maintenance and administrative
payments for non-CCI out-of-home
placement services
Excludes private agency
administrative payments and all CCI
payments
WMPC Actual Cost
Reporting Workbook
CCI payments for children that the
WMPC serviced
Private agency administrative
payments
Other purchased services (Kids
First)
Other Fiscal Data BP 515 payments (administrative
payments for CCI and other non-
admin-paid living arrangements)
Trial reunification payments
WMPC accruals (CCI, PAFC, & EFC
Admin, Kids First)
MiSACWIS Child
Placement Data Child placements, child
demographics, removal
information, worker information
Child placements, child
demographics, removal
information, worker information
Building on the data in Table 2-1, the cost study team compiled a basic longitudinal database
structure allowing for analysis of changes in expenditure and revenue patterns at the state and
county levels, across fiscal years. The database structure further allows the flexibility to compare
financial data within and across counties, across fiscal years, and within child welfare-specific
expenditure and revenue categories. In this report, Kent County WMPC expenditure and revenue
trends are presented for the baseline period (FY 2015 through FY 2017) and one year post-
implementation (FY 2018).
The cost team also analyzed placement data to understand care-day utilization. This involved
creating a “child event” file to summarize the number of care days used by state fiscal year,
placement event, and provider type (e.g., foster care, kinship, congregate care, etc.).

Evaluation of Michigan’s Performance-Based
Funding Model: Second Annual Report 2-6
2.1.3 Data Analysis
The outcomes examined and reported here focus on the expenditure and revenue trends in Kent
County for FY 2015 (Oct 2014 – Sep 2015) through FY 2018 (Oct 2017 – Sep 2018). The period
examined is split between the baseline years (FY 2015 – FY 2017)—the three years prior to the
implementation of the Kent Model, and the first implementation year (FY 2018).
As previously stated, under the Kent Model, the WMPC does not serve all children and families
receiving child welfare services in Kent County—YAVFC, OTI, and URM are not under the
WMPC’s purview. The expenditures and revenue presented in this report represent the expenditures
for all children and families who received, or would have received, out-of-home placement services
in Kent County under the WMPC. The designation of these WMPC-related costs differ by time
period:
Baseline Period (FY 2015 through FY 2017). During the three years prior to the implementation of the Kent Model, expenses, revenues, and placement days were only included in the cost study’s data analysis if they belonged to a child or youth who was not associated with a URM, YAVFC, or OTI status.
Post-Implementation Period (FY 2018). During the first year of the Kent Model, costs and revenue were limited to those reported by the WMPC. Placement days examined during this period were again limited to those that belonged to a child or youth who was not associated with a URM, YAVFC, or OTI status.
The key outcomes examined for this report are:
1. Annual Expenditures by Service Type. For this analysis, annual expenditure levels within Kent County from FY 2015 through FY 2018 are compared to examine changes in expenditures by service types (Service Domain).
2. Annual Placement Maintenance Expenditures. This report breaks down placement expenditures into two major categories – Administration and Maintenance. Maintenance expenditures reflect the payments for the daily care and supervision of children in out-of-home care. For CCI placements, maintenance costs also include the provision of social services and clinical treatment. Administration expenditures represent the costs to manage child placement services and administrative costs related to foster care for

Evaluation of Michigan’s Performance-Based
Funding Model: Second Annual Report 2-7
children.10 For this analysis, we include an in-depth look at shifting expenditures by placement setting maintenance expenditures.11
3. Annual Revenue by Funding Source. For this analysis, annual WMPC-related revenue totals within Kent County from FY 2015 through FY 2018 are compared to examine changes in revenue by funding source
4. Placement Days. Care-day utilization is examined by state fiscal year and placement type to determine whether the volume of care days and per unit costs of care have changed under the Kent Model (as compared to the baseline period).
5. Average Daily Unit Cost of Care. To examine annual trends in the average daily unit cost of care, total annual placement costs are divided by annual placement days and trend analyses are run.
Findings for these key outcomes are presented in the section that follows.
2.1.3.1 Expenditures Trends
The tables in this section present expenditure totals by fiscal year and service domain where Kent
County is the county responsible for payment. Payments for substance abuse services, treatment
services (which include services such as domestic violence counseling, parental education, and a
family reunification program), and consortium case rates are excluded.12 Table 2-2 presents all Kent
County expenditures (excluding URM, YAVFC, and OTI), with expenditures broken down by
Service Domain. All subsequent tables and figures present data that excludes all payments related to
YAVFC, OTI, and URM cases.
10In the baseline period, FY 2015 through FY 2017, the administration expenditures for non-CCI placements are captured in the ADMIN_AMOUNT variable in the MiSACWIS data. For CCI placements during this period, their administration expenditures are captured in the BP515 report while their ADMIN_AMOUNT in MiSACWIS is included in the CCI’s maintenance expenditures. All placement administration expenditures are captured in the WMPC Cost Report or Accruals Detail in FY 2018.
11In future reports, placement administration expenditures by placement setting will also be available. Additional work still needs to be invested in allocating all placement administrative costs to the child level, and the related placement setting.
12Substance abuse expenditures are excluded due to the inconsistent recording of these services in the data from year to year. Treatment services are excluded because they only begin to appear in the data in FY 2018 (despite the services themselves being offered prior to that year). Child Welfare Continuum of Care (CWCC) case rate payments are akin to revenue for the private agencies and will be explored in full in future revenue analyses.
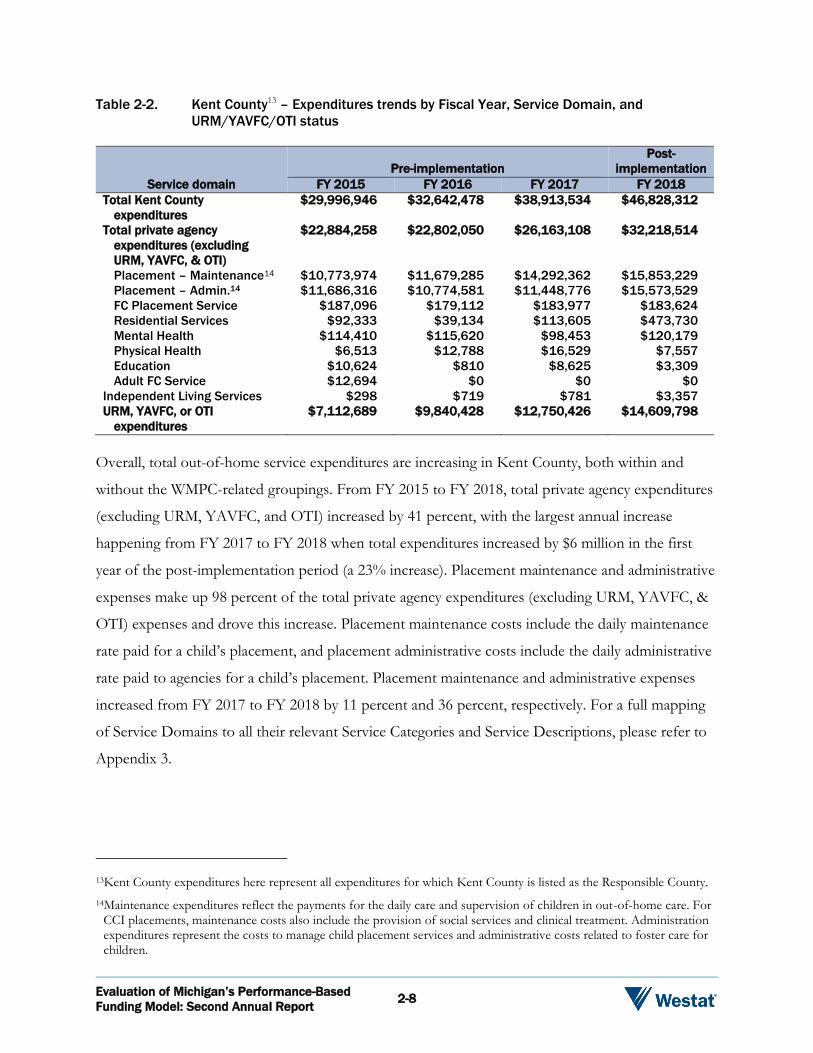
Evaluation of Michigan’s Performance-Based
Funding Model: Second Annual Report 2-8
Table 2-2. Kent County13 – Expenditures trends by Fiscal Year, Service Domain, and
URM/YAVFC/OTI status
Service domain
Pre-implementation
Post-
implementation
FY 2015 FY 2016 FY 2017 FY 2018
Total Kent County
expenditures
$29,996,946 $32,642,478 $38,913,534 $46,828,312
Total private agency
expenditures (excluding
URM, YAVFC, & OTI)
$22,884,258 $22,802,050 $26,163,108 $32,218,514
Placement – Maintenance14 $10,773,974 $11,679,285 $14,292,362 $15,853,229
Placement – Admin.14 $11,686,316 $10,774,581 $11,448,776 $15,573,529
FC Placement Service $187,096 $179,112 $183,977 $183,624
Residential Services $92,333 $39,134 $113,605 $473,730
Mental Health $114,410 $115,620 $98,453 $120,179
Physical Health $6,513 $12,788 $16,529 $7,557
Education $10,624 $810 $8,625 $3,309
Adult FC Service $12,694 $0 $0 $0
Independent Living Services $298 $719 $781 $3,357
URM, YAVFC, or OTI
expenditures
$7,112,689 $9,840,428 $12,750,426 $14,609,798
Overall, total out-of-home service expenditures are increasing in Kent County, both within and
without the WMPC-related groupings. From FY 2015 to FY 2018, total private agency expenditures
(excluding URM, YAVFC, and OTI) increased by 41 percent, with the largest annual increase
happening from FY 2017 to FY 2018 when total expenditures increased by $6 million in the first
year of the post-implementation period (a 23% increase). Placement maintenance and administrative
expenses make up 98 percent of the total private agency expenditures (excluding URM, YAVFC, &
OTI) expenses and drove this increase. Placement maintenance costs include the daily maintenance
rate paid for a child’s placement, and placement administrative costs include the daily administrative
rate paid to agencies for a child’s placement. Placement maintenance and administrative expenses
increased from FY 2017 to FY 2018 by 11 percent and 36 percent, respectively. For a full mapping
of Service Domains to all their relevant Service Categories and Service Descriptions, please refer to
Appendix 3.
13Kent County expenditures here represent all expenditures for which Kent County is listed as the Responsible County.
14Maintenance expenditures reflect the payments for the daily care and supervision of children in out-of-home care. For CCI placements, maintenance costs also include the provision of social services and clinical treatment. Administration expenditures represent the costs to manage child placement services and administrative costs related to foster care for children.
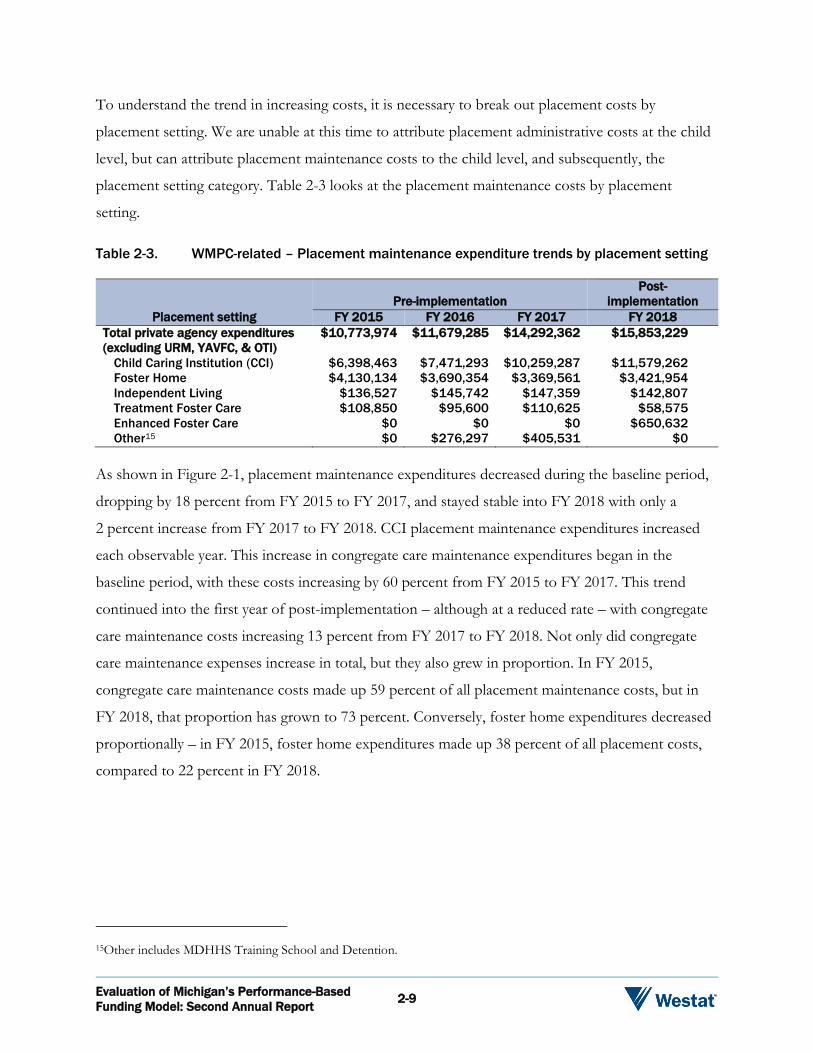
Evaluation of Michigan’s Performance-Based
Funding Model: Second Annual Report 2-9
To understand the trend in increasing costs, it is necessary to break out placement costs by
placement setting. We are unable at this time to attribute placement administrative costs at the child
level, but can attribute placement maintenance costs to the child level, and subsequently, the
placement setting category. Table 2-3 looks at the placement maintenance costs by placement
setting.
Table 2-3. WMPC-related – Placement maintenance expenditure trends by placement setting
Placement setting
Pre-implementation
Post-
implementation
FY 2015 FY 2016 FY 2017 FY 2018
Total private agency expenditures
(excluding URM, YAVFC, & OTI)
$10,773,974 $11,679,285 $14,292,362 $15,853,229
Child Caring Institution (CCI) $6,398,463 $7,471,293 $10,259,287 $11,579,262
Foster Home $4,130,134 $3,690,354 $3,369,561 $3,421,954
Independent Living $136,527 $145,742 $147,359 $142,807
Treatment Foster Care $108,850 $95,600 $110,625 $58,575
Enhanced Foster Care $0 $0 $0 $650,632
Other15 $0 $276,297 $405,531 $0
As shown in Figure 2-1, placement maintenance expenditures decreased during the baseline period,
dropping by 18 percent from FY 2015 to FY 2017, and stayed stable into FY 2018 with only a
2 percent increase from FY 2017 to FY 2018. CCI placement maintenance expenditures increased
each observable year. This increase in congregate care maintenance expenditures began in the
baseline period, with these costs increasing by 60 percent from FY 2015 to FY 2017. This trend
continued into the first year of post-implementation – although at a reduced rate – with congregate
care maintenance costs increasing 13 percent from FY 2017 to FY 2018. Not only did congregate
care maintenance expenses increase in total, but they also grew in proportion. In FY 2015,
congregate care maintenance costs made up 59 percent of all placement maintenance costs, but in
FY 2018, that proportion has grown to 73 percent. Conversely, foster home expenditures decreased
proportionally – in FY 2015, foster home expenditures made up 38 percent of all placement costs,
compared to 22 percent in FY 2018.
15Other includes MDHHS Training School and Detention.

Evaluation of Michigan’s Performance-Based
Funding Model: Second Annual Report 2-10
Figure 2-1. WMPC-related placement maintenance expenditure trends by placement setting
2.1.3.2 Revenue Trends
Table 2-4 shows the revenue totals and proportions by funding source for private agency
expenditures (excluding URM, YAVFC, and OTI) during this period. As shown in Tables 2-4 and 2-
5, the two largest funding sources for out-of-home placement services are federal Title IV-E funds
and the County Child Care Fund. Total Title IV-E revenue used each year remained fairly constant
until an increase in FY 2018. The proportion of revenue attributable to this funding category
declined in the baseline period – from 43 percent in FY 2015 to 36 percent in FY 2017. In FY 2018,
Title IV-E revenue increased to make up 40 percent of total revenue. Conversely, County Child Care
Fund and State Ward Board and Care funds have all been increasing in total.
$0
$2,000,000
$4,000,000
$6,000,000
$8,000,000
$10,000,000
$12,000,000
$14,000,000
FY 2015 FY 2016 FY 2017 FY 2018
Child Caring Institution Foster Home Independent Living
Treatment Foster Care Enhanced Foster Care

Evaluation of Michigan’s Performance-Based
Funding Model: Second Annual Report 2-11
Table 2-4. WMPC-related revenue totals by overall fund source and Fiscal Year
Overall fund source
Pre-implementation16
Post-
implementation17
FY 2015 FY 2016 FY 2017 FY 2018
Total private agency revenue
(excluding URM, YAVFC, & OTI)
$22,884,258 $22,802,050 $26,163,108 $32,212,014
Title IV-E $9,833,654 $8,515,428 $9,324,055 $12,982,042
County Child Care Fund $8,464,048 $8,786,530 $10,999,974 $12,358,796
State Ward Board and Care $3,599,011 $4,571,611 $5,508,955 $6,581,120
Limited
Term/Emergency/General Funds
$870,057 $812,806 $234,338 $9,834
Medical Services – DHS 93 $117,189 $115,675 $95,086 $71,727
Other/Unknown18 $298 $0 $700 $208,496
Table 2-5. WMPC-related revenue proportions by overall fund source and Fiscal Year
Overall fund source FY 2015
(%)
FY 2016
(%)
FY 2017
(%)
FY 2018
(%)
Total private agency revenue (excluding URM,
YAVFC, & OTI) 100 100 100 100
Title IV-E 43 37 36 40
County Child Care Fund 37 39 42 38
State Ward Board and Care 16 20 21 20
Limited Term/Emergency/General Funds 4 4 1 0
Medical Services – DHS 93 1 1 0 0
Other/Unknown18 0 0 0 1
2.1.3.3 Placement Days
Table 2-6 and Figure 2-2 show WMPC-related care-day utilization observed during the three-year
baseline period, and for the most recent fiscal year under the WMPC (FY 2018). As shown, care-day
utilization increased slightly in FY 2018, compared to the decreases in the three years prior. Total
care days increased from 293,472 in FY 2017 to 301,493 days in FY 2018—a 3 percent increase in
total care-day utilization. Kinship care and congregate care showed the largest total increase in care
days when comparing FY 2018 to FY 2017, increasing by 7 percent and 5 percent respectively.
Foster care days stayed stable, increasing only 1 percent in FY 2018.
16All pre-implementation revenue is determined by the OVERALL_FUND_SOURCE in MiSACWIS.
17Most revenue in the post-implementation period is determined by the OVERALL_FUND_SOURCE in MiSACWIS or the revenue detail on the Residential Services tab in the WMPC Cost Report for the CCI placement expenditures. However, revenue associated with the aggregate EFC Admin costs was not available and was instead estimated by assigning revenue types to the EFC Admin expense based on the revenue type split in the pre-implementation period.
18Other/Unknown revenue includes TANF and YIT revenue and the revenue associated with Kids First expenditures.

Evaluation of Michigan’s Performance-Based
Funding Model: Second Annual Report 2-12
Table 2-6. Care days by state Fiscal Year and living arrangement, all Kent County responsible
Placement setting FY 2015 FY 2016 FY 2017 FY 2018
Total care days (excluding URM, YAVFC, & OTI) 329,787 297,108 293,472 301,493
Foster Care 180,262 148,703 140,312 141,703
Kinship 70,922 78,301 81,688 87,767
Parental Home 37,717 29,700 28,069 25,522
Congregate 21,262 26,217 31,316 32,792
Emergency Shelter 1,687 1,863 2,642 3,020
Independent Living 6,191 4,675 2,610 4,724
Adoptive Home 7,103 2,944 1,301 1,547
Detention 1,812 1,246 668 1,156
Runaway 2,142 2,918 3,493 2,524
Other19 689 541 1,373 738
Figure 2-2. Care-day utilization by state Fiscal Year20
To understand shifts in out-of-home placement days and their related costs, expenditure structure
must be examined. Total out-of-home placement expenditures are influenced by two components:
(1) price of care and (2) quantity of care days; that is, how much a child welfare system spends on
out-of-home placements (expenditures) is a function of how much that collection of services costs
per day (price) and the number of care days for which it is provided (quantity).
Placement Expenditures = Price * Quantity
19Other placement setting includes hospital, out-of-state placement, and runaway service facility.
20Congregate care in this figure includes both shelter and detention.
0
20,000
40,000
60,000
80,000
100,000
120,000
140,000
160,000
180,000
200,000
2015 2016 2017 2018
Foster Care Kinship Parental Home All Congregate All Other

Evaluation of Michigan’s Performance-Based
Funding Model: Second Annual Report 2-13
In short, a change in the average cost per care day or in the number of care days would affect total
out-of-home expenditures. The number of days in care is affected by the number of children
entering care, and how long they stay in care.
Historic days per placement event are measured to determine if care-day changes correspond to a
higher volume of children in care or more days per episode. As shown in Table 2-7, placement
events are defined by a change in provider and/or placement type in MiSACWIS. Children can have
multiple placement events for their entire placement spell, and days per episode do not necessarily
represent total duration in care. Similar to the change in total care days, the number of placement
events was fairly stable during the baseline period and into FY 2018. At the same time, the median
care days per event remained similar for foster and kinship care while increasing for congregate care.
Table 2-7. Child placement events by entry year, all Kent County responsible
Child placement events Median care days per events
2015 2016 2017 2018 2015 2016 2017 2018
Total 2,475 2,311 2,260 2,241 93 84 89 95
Adoptive Home 64 22 15 15 53 70 54 74
Congregate 180 208 218 213 81 94 120 124
Detention 35 33 28 29 27 13 13 17
Emergency Shelter 91 81 99 105 16 20 24 18
Foster Care 1,114 998 956 897 126 117 110 128
Independent Living 33 24 20 33 147 189 110 88
Kinship 464 458 482 508 121 144 144 154
Other21 48 71 80 65 6 6 5 5
Parental Home 383 347 291 266 89 70 76 80
2.1.3.4 Average Daily Maintenance Unit Cost
Table 2-8 shows the average daily maintenance unit costs for out-of-home placements. “Average
unit costs” are calculated by dividing the total annual placement maintenance expenditures by total
placement days for each fiscal year. In Kent County, for out-of-home placements (excluding URM,
YAVFC, and OTI), the average daily cost per care day increased each year from FY 2015 through
FY 2018. Based on information provided by DHHS, family foster care per diem rates are $17.24 for
children aged 0-12 and $20.59 for children aged 13-18.22 There is also a difficulty of care supplement
ranging from $5-$18 a day depending on the child’s age and whether or not they are medically
21Other placement setting includes hospital, out-of-state placement, and runaway service facility.
22MDHHS FOM 905-3. Foster Care Rates: Foster Family Care and Independent Living – Effective 10/1/2012. https://dhhs.michigan.gov/OLMWEB/EX/FO/Public/FOM/905-3.pdf#pagemode=bookmarks.
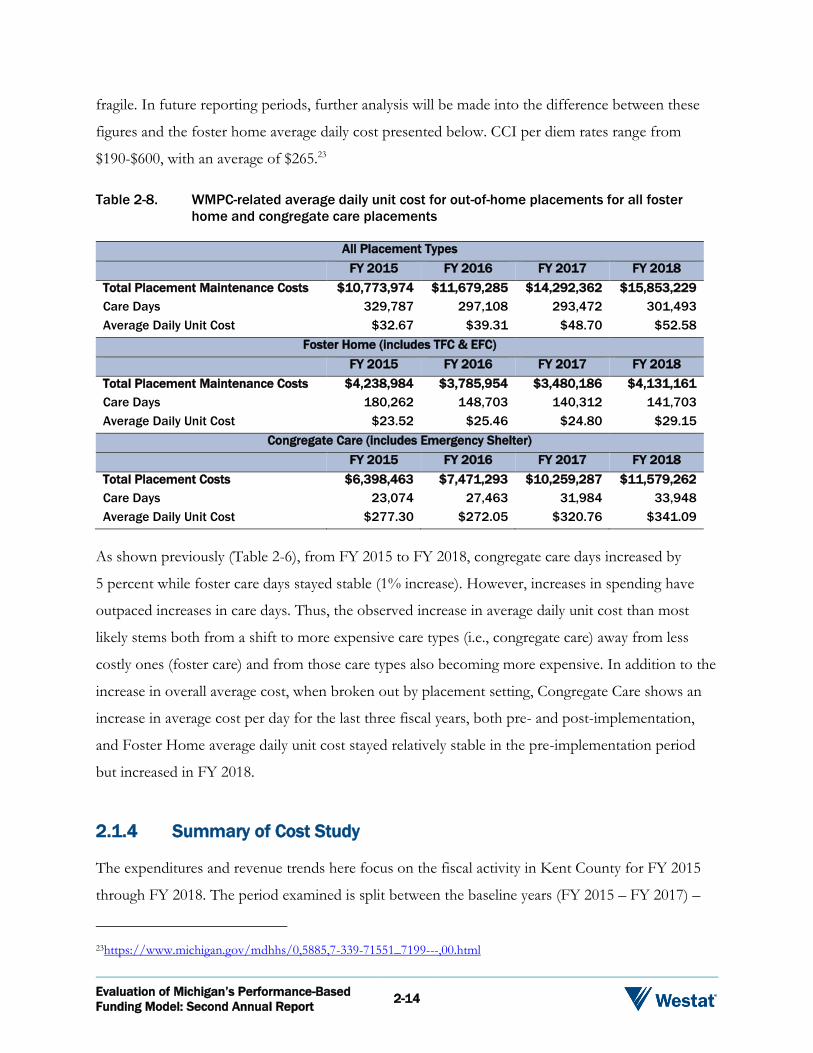
Evaluation of Michigan’s Performance-Based
Funding Model: Second Annual Report 2-14
fragile. In future reporting periods, further analysis will be made into the difference between these
figures and the foster home average daily cost presented below. CCI per diem rates range from
$190-$600, with an average of $265.23
Table 2-8. WMPC-related average daily unit cost for out-of-home placements for all foster
home and congregate care placements
All Placement Types
FY 2015 FY 2016 FY 2017 FY 2018
Total Placement Maintenance Costs $10,773,974 $11,679,285 $14,292,362 $15,853,229
Care Days 329,787 297,108 293,472 301,493
Average Daily Unit Cost $32.67 $39.31 $48.70 $52.58
Foster Home (includes TFC & EFC)
FY 2015 FY 2016 FY 2017 FY 2018
Total Placement Maintenance Costs $4,238,984 $3,785,954 $3,480,186 $4,131,161
Care Days 180,262 148,703 140,312 141,703
Average Daily Unit Cost $23.52 $25.46 $24.80 $29.15
Congregate Care (includes Emergency Shelter)
FY 2015 FY 2016 FY 2017 FY 2018
Total Placement Costs $6,398,463 $7,471,293 $10,259,287 $11,579,262
Care Days 23,074 27,463 31,984 33,948
Average Daily Unit Cost $277.30 $272.05 $320.76 $341.09
As shown previously (Table 2-6), from FY 2015 to FY 2018, congregate care days increased by
5 percent while foster care days stayed stable (1% increase). However, increases in spending have
outpaced increases in care days. Thus, the observed increase in average daily unit cost than most
likely stems both from a shift to more expensive care types (i.e., congregate care) away from less
costly ones (foster care) and from those care types also becoming more expensive. In addition to the
increase in overall average cost, when broken out by placement setting, Congregate Care shows an
increase in average cost per day for the last three fiscal years, both pre- and post-implementation,
and Foster Home average daily unit cost stayed relatively stable in the pre-implementation period
but increased in FY 2018.
2.1.4 Summary of Cost Study
The expenditures and revenue trends here focus on the fiscal activity in Kent County for FY 2015
through FY 2018. The period examined is split between the baseline years (FY 2015 – FY 2017) –
23https://www.michigan.gov/mdhhs/0,5885,7-339-71551_7199---,00.html
Evaluation of Michigan’s Performance-Based
Funding Model: Second Annual Report 2-15
the three years prior to the implementation of the Kent Model – and the first implementation year
(FY 2018). As previously stated, under the Kent Model, the WMPC does not serve all children and
families receiving child welfare services in Kent County – YAVFC, OTI, and URM are not under
the WMPC’s purview. This report excludes these children from the analysis of fiscal trends and care-
day utilization.
Overall Expenditures. From FY 2015 to FY 2018, total expenditures for services provided to children, youth, and families in out-of-home WMPC-related placements increased by 41 percent in Kent County, with the largest annual increase happening from FY 2017 to FY 2018, when total expenditures increased annually by 23 percent.
Placement Maintenance Expenditures. During the baseline period, placement maintenance expenditures decreased – dropping by 18 percent from FY 2015 to FY 2017 – and stayed stable into FY 2018 with only a 2 percent increase from FY 2017 to FY 2018. CCI placement maintenance expenditures also increased during the baseline period, and this trend continued into the first year of post-implementation – although at a reduced rate – with congregate care maintenance costs increasing 13 percent from FY 2017 to FY 2018.
Care-day utilization. The number of days spent in care increased somewhat in FY 2018 compared to the three prior years. Total care days increased from 293,472 in FY 2017 to 301,493 days in FY 2018 – a 3 percent increase in total care-day utilization.
Average Daily Unit Cost. In Kent County, the overall average daily cost per care day increased each year from FY 2015 through FY 2018 as increases in placement spending outpaced increases in care days. The increase in average daily unit cost most likely stems both from a shift to more expensive care types (i.e., congregate care) away from less costly ones (foster care) and congregate care days becoming more expensive.
2.2 Overview: Outcome Study – Safety, Permanency, and
Stability
This section of the report covers the safety and permanency outcomes for the performance-based
child welfare contract project in Kent County. The analyses focus on determining whether children
served by WMPC achieved significantly better outcomes than similarly situated children served by
private agencies in other counties that are not part of the Kent pilot. Data presented in the following
sections reflect events and outcomes during the first year of the project, i.e., FY 2018. We used
propensity score matching (PSM) to generate a comparison group. The overall Kent sample
(n=1,253) was matched with children who were associated with a private agency outside Kent
County for at least 80 percent of their placement. Children were matched on demographic

Evaluation of Michigan’s Performance-Based
Funding Model: Second Annual Report 2-16
characteristics (i.e., race, ethnicity, gender, age) and the circumstances that prompted their entry into
care (i.e., the type of abuse/neglect reported). The groups and subsequent tables are organized based
on the official start date (10/01/2017). The outcomes are presented separately for children who
were associated with WMPC prior to the official start date (referred to as legacy cases, n=798) and
children who entered a WMPC placement on or after the official start date (n=455). Table 2-9
presents the demographics of the children and indicates that the PSM created equivalent groups
(e.g., no differences across race, gender, and age).
Table 2-9. Demographics of children in care
Comparison Kent
Total N 1,253 1,253
In care prior to 10/1/2017 779 798
Entered after 10/1/2017 474 455
Age Mean/Standard Deviation M = 6.47, SD = 5.43 M = 6.62, SD = 5.4
% Male 51.9 51.7
% White 68.6 66.7
% Black/African American 45.7 47.1
% Hispanic 14.0 15.4
2.2.1 Safety
2.2.1.1 Maltreatment in Care
What percentage of children experience maltreatment while in foster care? Table 2-10 displays the
risk of maltreatment in care (MIC) at any point in the child’s episode. Specifically, we assessed the
percentage of children in each group who experienced a Cat I-III disposition while they were in an
out-of-home placement setting or still under the legal guardianship/supervision of the State. This
measure is similar to the Child and Family Service Reviews (CFSR) round three approach to MIC,
although we display the estimates in percentages rather than a rate. Overall, 17.6 percent of children
experienced MIC. There were no significant differences between children served in Kent County
and similar children served by private agencies outside of Kent County.

Evaluation of Michigan’s Performance-Based
Funding Model: Second Annual Report 2-17
Table 2-10. Risk of maltreatment in care
Group Non-victims Victims Total
Comparison, entered after 10/1/2017 88.8% (421) 11.2% (53) 100.0% (474)
Comparison, in care prior to 10/1/2017 79.2% (617) 20.8% (162) 100.0% (779)
Kent, entered after 10/1/2017 85.9% (391) 14.1% (64) 100.0% (455)
Kent, in care prior to 10/1/2017 79.6% (635) 20.4% (163) 100.0% (798)
Total 82.4% (2,064) 17.6% (442) 100.0% (2,506)
2.2.1.2 Maltreatment Recurrence
What percentage of children experience recurrence? To answer this question we isolate the most
recent Child Protective Services (CPS) report (Cat I, II, or III) prior to removal, and the most recent
CPS report (Cat I, II, or III) after removal. Table 2-11 displays the proportion of children who
experienced their second substantiated report within 365 days. Chi-square tests indicate that there
are no significant differences between children served in Kent County and similar children served in
private agencies outside Kent.
Table 2-11. Second substantiation within one year
Group No recurrence Experienced recurrence Total
Comparison, entered after
10/1/2017
97.9% (464) 2.1% (10) 100.0% (474)
Comparison, in care prior to
10/1/2017
95.0% (740) 5.0% (39) 100.0% (779)
Kent, entered after 10/1/2017 95.6% (435) 4.4% (20) 100.0% (455)
Kent, in care prior to 10/1/2017 94.0% (750) 6.0% (48) 100.0% (798)
Total 95.3% (2389) 4.7% (117) 100.0% (2506)
2.2.2 Permanency
2.2.2.1 Permanency Status and Length of Stay
Permanency is defined as a formal discharge from foster care, with the recorded reason for
discharge as reunification with parents/primary caregivers, adoption, living with relatives, or
guardianship. Table 2-12 displays the most recent permanency status for children associated with the
current evaluation as the proportion of children who exited care, the proportion of children who are
still in care, and their associated length of stay in days. Both median and mean lengths of stay are
presented. For children who entered after 10/1/2017, more children in Kent exited care during
FY 2018 (12.31% vs. 8.23%). Children in Kent County who entered after 10/1/2017, and exited,
tended to stay fewer days in care on average (106.9 as compared with 149.6 days). This difference is
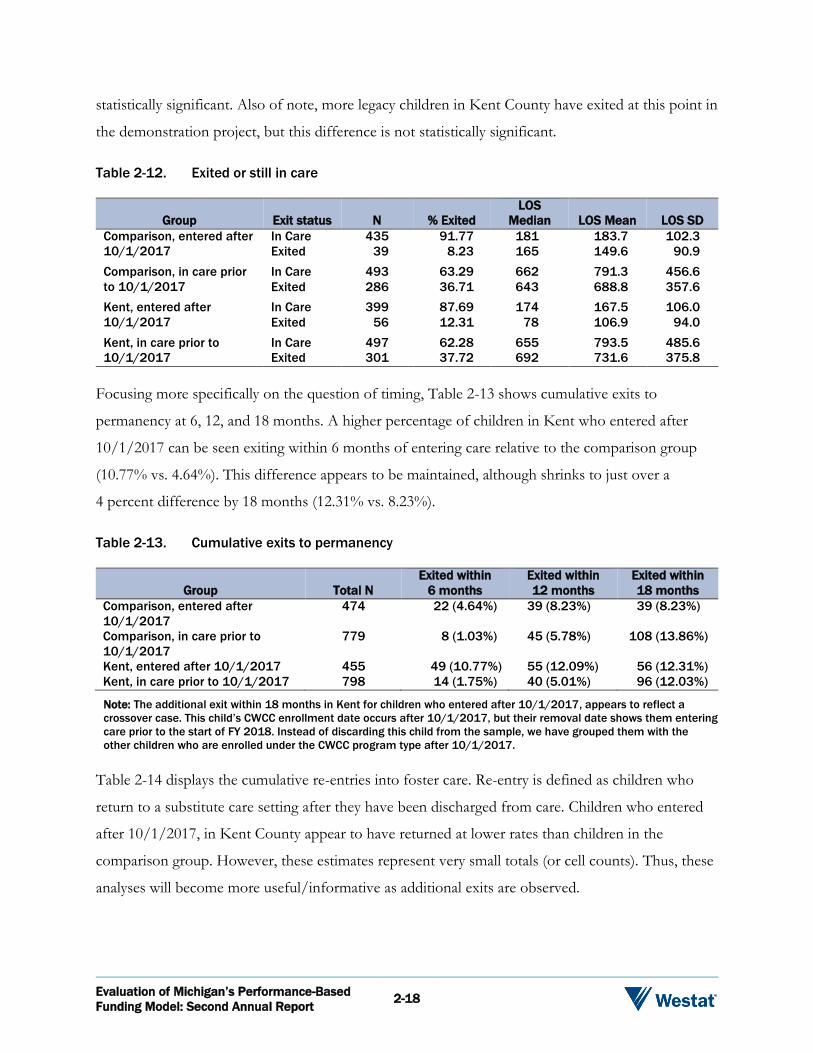
Evaluation of Michigan’s Performance-Based
Funding Model: Second Annual Report 2-18
statistically significant. Also of note, more legacy children in Kent County have exited at this point in
the demonstration project, but this difference is not statistically significant.
Table 2-12. Exited or still in care
Group Exit status N % Exited
LOS
Median LOS Mean LOS SD
Comparison, entered after
10/1/2017
In Care 435 91.77 181 183.7 102.3
Exited 39 8.23 165 149.6 90.9
Comparison, in care prior
to 10/1/2017
In Care 493 63.29 662 791.3 456.6
Exited 286 36.71 643 688.8 357.6
Kent, entered after
10/1/2017
In Care 399 87.69 174 167.5 106.0
Exited 56 12.31 78 106.9 94.0
Kent, in care prior to
10/1/2017
In Care 497 62.28 655 793.5 485.6
Exited 301 37.72 692 731.6 375.8
Focusing more specifically on the question of timing, Table 2-13 shows cumulative exits to
permanency at 6, 12, and 18 months. A higher percentage of children in Kent who entered after
10/1/2017 can be seen exiting within 6 months of entering care relative to the comparison group
(10.77% vs. 4.64%). This difference appears to be maintained, although shrinks to just over a
4 percent difference by 18 months (12.31% vs. 8.23%).
Table 2-13. Cumulative exits to permanency
Group Total N
Exited within
6 months
Exited within
12 months
Exited within
18 months
Comparison, entered after
10/1/2017
474 22 (4.64%) 39 (8.23%) 39 (8.23%)
Comparison, in care prior to
10/1/2017
779 8 (1.03%) 45 (5.78%) 108 (13.86%)
Kent, entered after 10/1/2017 455 49 (10.77%) 55 (12.09%) 56 (12.31%)
Kent, in care prior to 10/1/2017 798 14 (1.75%) 40 (5.01%) 96 (12.03%)
Note: The additional exit within 18 months in Kent for children who entered after 10/1/2017, appears to reflect a
crossover case. This child’s CWCC enrollment date occurs after 10/1/2017, but their removal date shows them entering
care prior to the start of FY 2018. Instead of discarding this child from the sample, we have grouped them with the
other children who are enrolled under the CWCC program type after 10/1/2017.
Table 2-14 displays the cumulative re-entries into foster care. Re-entry is defined as children who
return to a substitute care setting after they have been discharged from care. Children who entered
after 10/1/2017, in Kent County appear to have returned at lower rates than children in the
comparison group. However, these estimates represent very small totals (or cell counts). Thus, these
analyses will become more useful/informative as additional exits are observed.

Evaluation of Michigan’s Performance-Based
Funding Model: Second Annual Report 2-19
Table 2-14. Cumulative re-entries
Group Total exits
Returned within
6 months
Returned within
12 months
Returned within
18 months
Comparison, entered after
10/1/2017
39 4 (10.26%) 4 (10.26%) 4 (10.26%)
Comparison, in care prior to
10/1/2017
286 3 (1.05%) 3 (1.05%) 3 (1.05%)
Kent, entered after 10/1/2017 56 4 (7.14%) 4 (7.14%) 4 (7.14%)
Kent, in care prior to 10/1/2017 301 15 (4.98%) 15 (4.98%) 15 (4.98%)
Table 2-15 displays a breakdown of the different permanency categories by study group. For
children who entered after 10/1/2017, the vast majority of recorded discharges were exits to
reunification; this fraction is approaching (but has not yet reached) significance in Kent County.
Note that these differences are assessed within each group’s column, with the percentages reflecting
each discharge reason’s share within the group’s total.
Table 2-15. Permanency categories by study group
Discharge
reason
Comparison,
entered after
10/1/2017
Comparison, in
care prior to
10/1/2017
Kent, entered
after
10/1/2017
Kent, in care
prior to
10/1/2017 Total
Living with Other
Relatives
2.6% (1) 0.3% (1) 1.8% (1) 1.3% (4) 1.0% (7)
Guardianship 15.4% (6) 6.3% (18) 5.4% (3) 8.6% (26) 7.8% (53)
Adoption 7.7% (3) 48.3% (138) 1.8% (1) 46.2% (139) 41.2% (281)
Reunification 74.4% (29) 45.1% (129) 91.1% (51) 43.9% (132) 50.0% (341)
Total 100.0% (39) 100.0% (286) 100.0% (56) 100.0% (301) 100.0% (682)
Given that reunification and adoption comprise the two most common types of permanency overall,
Table 2-16 focuses on the length of time that children take to exit. The amount of time (in days) is
summarized with means, medians, and standard deviations. Children in Kent County who entered
after 10/1/2017 exited to reunification significantly faster than those in the comparison group
(102.2 vs. 153.2 days). No other differences were statistically significant.
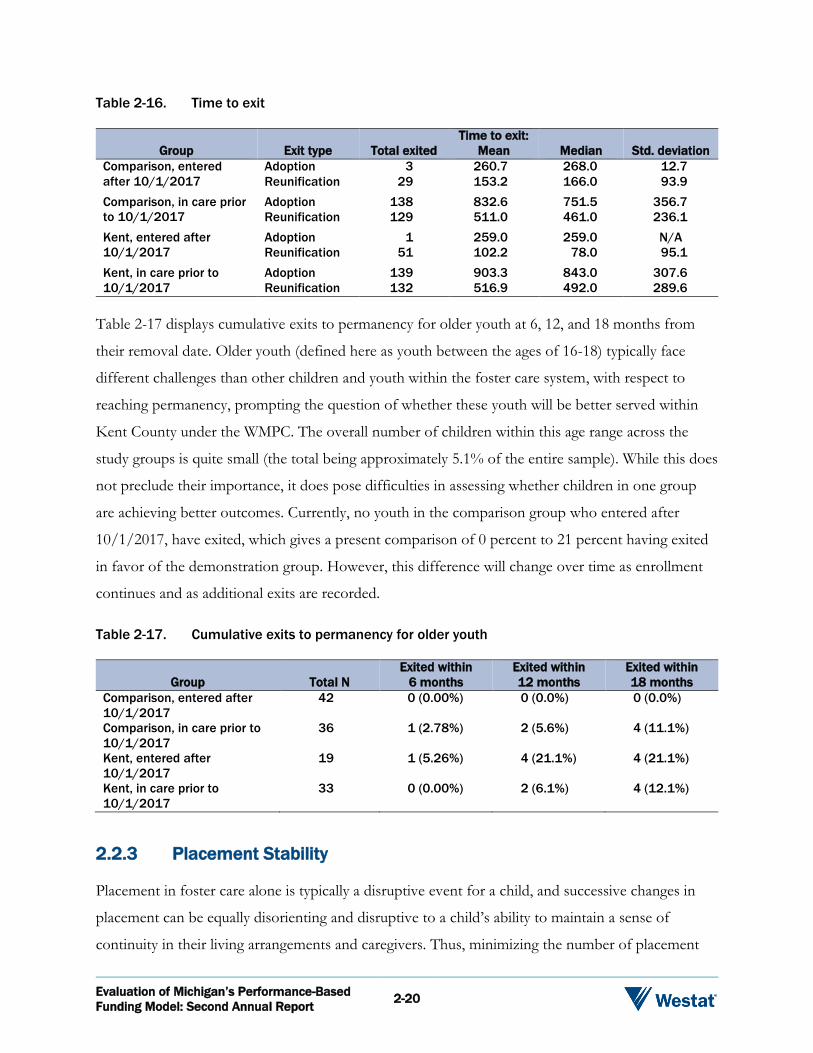
Evaluation of Michigan’s Performance-Based
Funding Model: Second Annual Report 2-20
Table 2-16. Time to exit
Group Exit type Total exited
Time to exit:
Mean Median Std. deviation
Comparison, entered
after 10/1/2017
Adoption 3 260.7 268.0 12.7
Reunification 29 153.2 166.0 93.9
Comparison, in care prior
to 10/1/2017
Adoption 138 832.6 751.5 356.7
Reunification 129 511.0 461.0 236.1
Kent, entered after
10/1/2017
Adoption 1 259.0 259.0 N/A
Reunification 51 102.2 78.0 95.1
Kent, in care prior to
10/1/2017
Adoption 139 903.3 843.0 307.6
Reunification 132 516.9 492.0 289.6
Table 2-17 displays cumulative exits to permanency for older youth at 6, 12, and 18 months from
their removal date. Older youth (defined here as youth between the ages of 16-18) typically face
different challenges than other children and youth within the foster care system, with respect to
reaching permanency, prompting the question of whether these youth will be better served within
Kent County under the WMPC. The overall number of children within this age range across the
study groups is quite small (the total being approximately 5.1% of the entire sample). While this does
not preclude their importance, it does pose difficulties in assessing whether children in one group
are achieving better outcomes. Currently, no youth in the comparison group who entered after
10/1/2017, have exited, which gives a present comparison of 0 percent to 21 percent having exited
in favor of the demonstration group. However, this difference will change over time as enrollment
continues and as additional exits are recorded.
Table 2-17. Cumulative exits to permanency for older youth
Group Total N
Exited within
6 months
Exited within
12 months
Exited within
18 months
Comparison, entered after
10/1/2017
42 0 (0.00%) 0 (0.0%) 0 (0.0%)
Comparison, in care prior to
10/1/2017
36 1 (2.78%) 2 (5.6%) 4 (11.1%)
Kent, entered after
10/1/2017
19 1 (5.26%) 4 (21.1%) 4 (21.1%)
Kent, in care prior to
10/1/2017
33 0 (0.00%) 2 (6.1%) 4 (12.1%)
2.2.3 Placement Stability
Placement in foster care alone is typically a disruptive event for a child, and successive changes in
placement can be equally disorienting and disruptive to a child’s ability to maintain a sense of
continuity in their living arrangements and caregivers. Thus, minimizing the number of placement
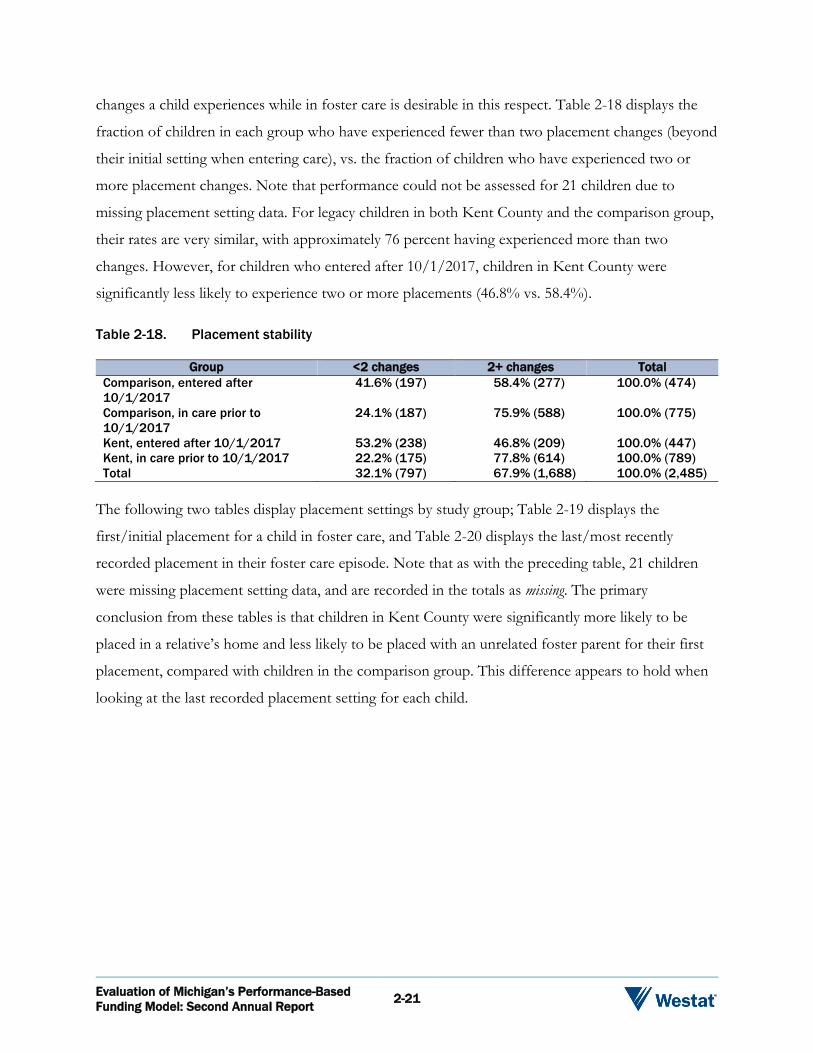
Evaluation of Michigan’s Performance-Based
Funding Model: Second Annual Report 2-21
changes a child experiences while in foster care is desirable in this respect. Table 2-18 displays the
fraction of children in each group who have experienced fewer than two placement changes (beyond
their initial setting when entering care), vs. the fraction of children who have experienced two or
more placement changes. Note that performance could not be assessed for 21 children due to
missing placement setting data. For legacy children in both Kent County and the comparison group,
their rates are very similar, with approximately 76 percent having experienced more than two
changes. However, for children who entered after 10/1/2017, children in Kent County were
significantly less likely to experience two or more placements (46.8% vs. 58.4%).
Table 2-18. Placement stability
Group <2 changes 2+ changes Total
Comparison, entered after
10/1/2017
41.6% (197) 58.4% (277) 100.0% (474)
Comparison, in care prior to
10/1/2017
24.1% (187) 75.9% (588) 100.0% (775)
Kent, entered after 10/1/2017 53.2% (238) 46.8% (209) 100.0% (447)
Kent, in care prior to 10/1/2017 22.2% (175) 77.8% (614) 100.0% (789)
Total 32.1% (797) 67.9% (1,688) 100.0% (2,485)
The following two tables display placement settings by study group; Table 2-19 displays the
first/initial placement for a child in foster care, and Table 2-20 displays the last/most recently
recorded placement in their foster care episode. Note that as with the preceding table, 21 children
were missing placement setting data, and are recorded in the totals as missing. The primary
conclusion from these tables is that children in Kent County were significantly more likely to be
placed in a relative’s home and less likely to be placed with an unrelated foster parent for their first
placement, compared with children in the comparison group. This difference appears to hold when
looking at the last recorded placement setting for each child.
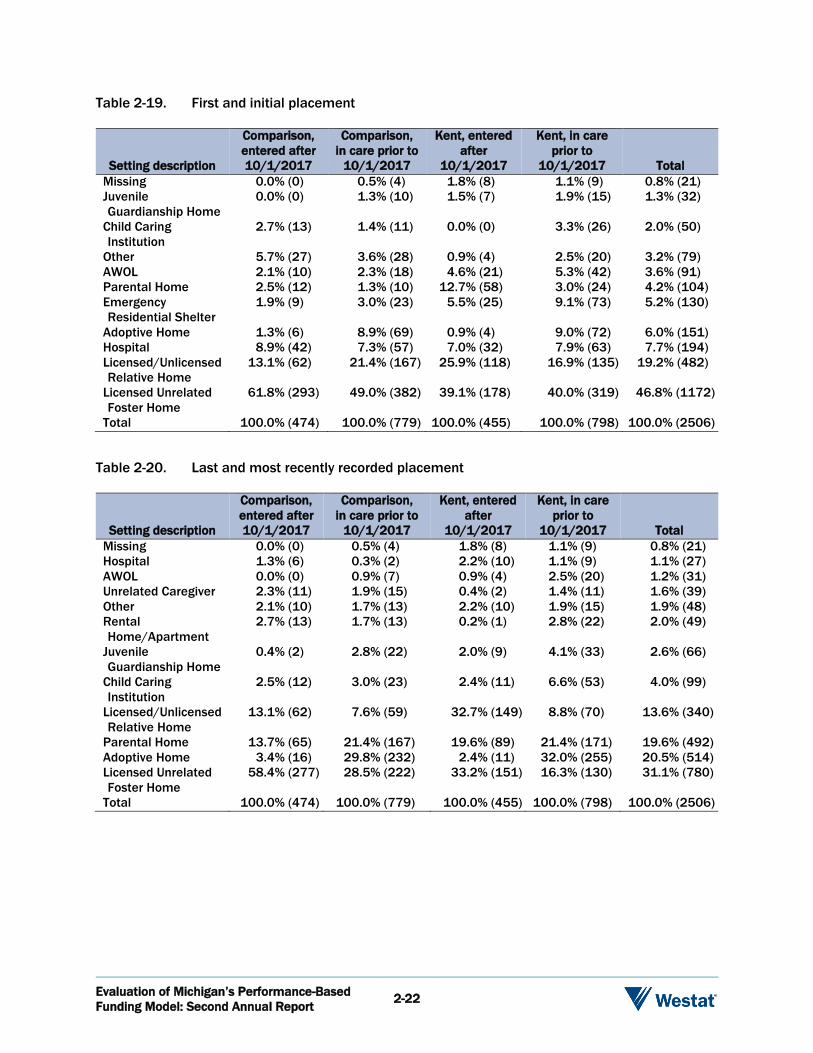
Evaluation of Michigan’s Performance-Based
Funding Model: Second Annual Report 2-22
Table 2-19. First and initial placement
Setting description
Comparison,
entered after
10/1/2017
Comparison,
in care prior to
10/1/2017
Kent, entered
after
10/1/2017
Kent, in care
prior to
10/1/2017 Total
Missing 0.0% (0) 0.5% (4) 1.8% (8) 1.1% (9) 0.8% (21)
Juvenile
Guardianship Home
0.0% (0) 1.3% (10) 1.5% (7) 1.9% (15) 1.3% (32)
Child Caring
Institution
2.7% (13) 1.4% (11) 0.0% (0) 3.3% (26) 2.0% (50)
Other 5.7% (27) 3.6% (28) 0.9% (4) 2.5% (20) 3.2% (79)
AWOL 2.1% (10) 2.3% (18) 4.6% (21) 5.3% (42) 3.6% (91)
Parental Home 2.5% (12) 1.3% (10) 12.7% (58) 3.0% (24) 4.2% (104)
Emergency
Residential Shelter
1.9% (9) 3.0% (23) 5.5% (25) 9.1% (73) 5.2% (130)
Adoptive Home 1.3% (6) 8.9% (69) 0.9% (4) 9.0% (72) 6.0% (151)
Hospital 8.9% (42) 7.3% (57) 7.0% (32) 7.9% (63) 7.7% (194)
Licensed/Unlicensed
Relative Home
13.1% (62) 21.4% (167) 25.9% (118) 16.9% (135) 19.2% (482)
Licensed Unrelated
Foster Home
61.8% (293) 49.0% (382) 39.1% (178) 40.0% (319) 46.8% (1172)
Total 100.0% (474) 100.0% (779) 100.0% (455) 100.0% (798) 100.0% (2506)
Table 2-20. Last and most recently recorded placement
Setting description
Comparison,
entered after
10/1/2017
Comparison,
in care prior to
10/1/2017
Kent, entered
after
10/1/2017
Kent, in care
prior to
10/1/2017 Total
Missing 0.0% (0) 0.5% (4) 1.8% (8) 1.1% (9) 0.8% (21)
Hospital 1.3% (6) 0.3% (2) 2.2% (10) 1.1% (9) 1.1% (27)
AWOL 0.0% (0) 0.9% (7) 0.9% (4) 2.5% (20) 1.2% (31)
Unrelated Caregiver 2.3% (11) 1.9% (15) 0.4% (2) 1.4% (11) 1.6% (39)
Other 2.1% (10) 1.7% (13) 2.2% (10) 1.9% (15) 1.9% (48)
Rental
Home/Apartment
2.7% (13) 1.7% (13) 0.2% (1) 2.8% (22) 2.0% (49)
Juvenile
Guardianship Home
0.4% (2) 2.8% (22) 2.0% (9) 4.1% (33) 2.6% (66)
Child Caring
Institution
2.5% (12) 3.0% (23) 2.4% (11) 6.6% (53) 4.0% (99)
Licensed/Unlicensed
Relative Home
13.1% (62) 7.6% (59) 32.7% (149) 8.8% (70) 13.6% (340)
Parental Home 13.7% (65) 21.4% (167) 19.6% (89) 21.4% (171) 19.6% (492)
Adoptive Home 3.4% (16) 29.8% (232) 2.4% (11) 32.0% (255) 20.5% (514)
Licensed Unrelated
Foster Home
58.4% (277) 28.5% (222) 33.2% (151) 16.3% (130) 31.1% (780)
Total 100.0% (474) 100.0% (779) 100.0% (455) 100.0% (798) 100.0% (2506)

Evaluation of Michigan’s Performance-Based
Funding Model: Second Annual Report 2-23
2.2.4 Summary of Outcome Study
The outcomes focus on safety, permanency, and placement stability. The outcomes were estimated
and displayed across four unique groups of children. These groups included children in Kent prior
to 10/01/2017, a matched group of children associated with counties other than Kent prior to
10/01/2017, children associated with WMPC after 10/01/2017, and a matched group of children
associated with counties other than Kent after 10/01/2017. Propensity score procedures were used
to create the matched groups. Children in the matched comparison group spent at least 80 percent
of their time served by a private agency outside Kent County.
Safety. No significant differences emerged between children in Kent County and children in the matched comparison group with regard to safety. For the purposes of the current evaluation, safety is defined as maltreatment in care or recurrence of maltreatment.
Permanency. For children who entered care after 10/01/2017, children in Kent County were significantly more likely to achieve permanency as compared with children in the matched comparison group (12.31% vs. 8.23%). Moreover, when children exited care, they exited care more quickly in Kent County (106.9 days) as compared with children in the matched comparison group (149.6 days). This difference was largely attributed to the timing of reunification (see Table 2-16). No significant differences emerged when comparing the risk of re-entry to care.
Placement Stability. Children in Kent County were significantly less likely to experience two or more placement changes (46.8%) as compared with similar children outside Kent County (58.4%)
Evaluation of Michigan’s Performance-Based
Funding Model: Second Annual Report 3-1
3. Case Studies: The Nature and Practice of Child
Welfare in Three Michigan Counties
3.1 Overview
Child welfare services in Michigan are administered through the MDHHS Children’s Services
Agency (CSA). Public and private child-placing agencies across the state are expected to promote
safety, permanency, and well-being in the families they serve through approximately 13 guiding
principles, including, for example, that safety is the first priority of the child welfare system; the ideal
place for children is with their families, therefore, agencies will ensure children remain in their own
homes whenever safely possible; services are tailored to families and children to meet their unique
needs; and decision-making is outcome-based, research-driven and continuously evaluated for
improvement. Agencies are expected to integrate these guiding principles into their policies and
practices.
In addition, in 2013, MDHHS established strategies to implement long-term, systemic reforms in
Michigan’s child welfare system. Those strategies, as noted previously, are commonly referred to as
Strengthening Our Focus on Children and Families in Michigan and include three primary
components: (1) MiTEAM practice model, (2) continuous quality improvement approach, and
performance-based child welfare. These guiding principles are implemented in all agencies statewide;
however, for the pilot, Kent County is also implementing a case rate funding model to see if, in
combination with these other guiding principles, the case rate provides for more flexible and
efficient programming and services for families, and ultimately produces more effective outcomes
for child-welfare involved children and families, especially those experiencing out-of-home care.
These components are the foundation of the overall evaluation and were used to guide the activities
of the process evaluation, in particular. The next section describes the evaluation team’s approach to
the process evaluation, and then presents key findings from it for Kent, Ingham, and Oakland
counties.
Evaluation of Michigan’s Performance-Based
Funding Model: Second Annual Report 3-2
3.2 Case Study Approach
As noted previously, the process evaluation is designed using a case study approach to the three
participating counties. Because the evaluation is describing child welfare case practice across Kent,
Ingham, and Oakland counties, including similarities and differences among them, a case study
design is appropriate. Specifically, case studies are used when the desire is to describe a phenomenon
in terms of “how” and “why” rather than the “what” (e.g., specific outcomes the practice produces).
In addition, case studies allow for the consideration of the context in which the phenomenon of
interest occurs. In Michigan, as in most states, child welfare practice is fundamentally rooted in
federal and state law, agency policies and procedures, and to a large extent, how those are
operationalized and implemented at the agency level. As such, it is imperative to study child welfare
practice within the context in which it occurs; it is not appropriate to assume that all agencies
understand and implement state policies and practices in the same way or experience the same
facilitators and challenges to doing so. A case study design, by primarily relying on qualitative
methods, helps ensure opportunities exist to obtain multiple perspectives to inform research
questions (and activities of interest), resulting in a more comprehensive and multi-level
understanding of child welfare practice in each county. It also allows for similarities and differences
across the agencies/counties to be uncovered and examined.
In Ingham and Oakland counties, the process evaluation findings will stand alone, providing the
framework for understanding child welfare practice in both counties.24 In Kent, process evaluation
findings also will be used to understand child welfare practice in the county, but will also provide
context in which outcomes and costs will be evaluated understood. Section 3.4 of this report
provides process evaluation findings by county. The chapter ends with comparisons across the three
counties; a summary of key findings can be found in Chapter 4.
3.3 Process Evaluation Data Collection
In October 2018, the process evaluation team conducted on-site visits to MDHHS and Kent,
Ingham, and Oakland counties to gather process evaluation data; data collection activities included a
total of 56 interviews and focus groups (see Table 3-1 for a summary of the full data collection
24As noted in the outcome section, Kent County is the focus of the outcome study, where outcomes are compared to those in a statewide sample, as identified by propensity score matching.
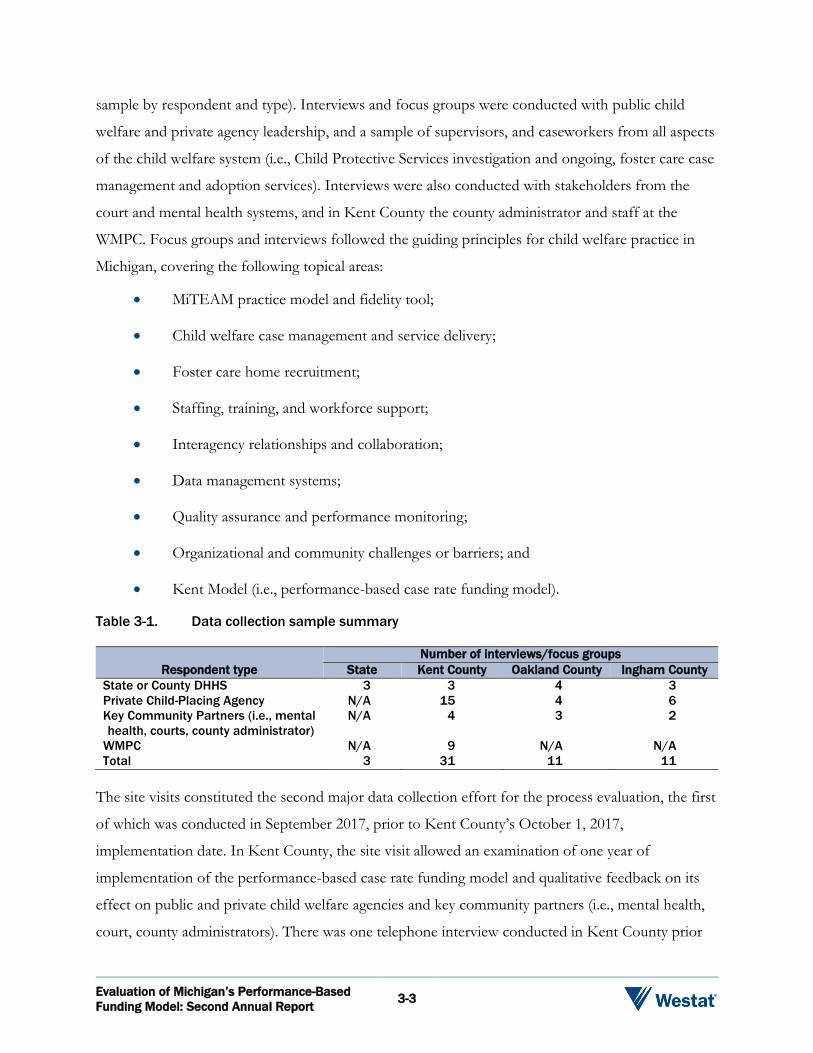
Evaluation of Michigan’s Performance-Based
Funding Model: Second Annual Report 3-3
sample by respondent and type). Interviews and focus groups were conducted with public child
welfare and private agency leadership, and a sample of supervisors, and caseworkers from all aspects
of the child welfare system (i.e., Child Protective Services investigation and ongoing, foster care case
management and adoption services). Interviews were also conducted with stakeholders from the
court and mental health systems, and in Kent County the county administrator and staff at the
WMPC. Focus groups and interviews followed the guiding principles for child welfare practice in
Michigan, covering the following topical areas:
MiTEAM practice model and fidelity tool;
Child welfare case management and service delivery;
Foster care home recruitment;
Staffing, training, and workforce support;
Interagency relationships and collaboration;
Data management systems;
Quality assurance and performance monitoring;
Organizational and community challenges or barriers; and
Kent Model (i.e., performance-based case rate funding model).
Table 3-1. Data collection sample summary
Respondent type
Number of interviews/focus groups
State Kent County Oakland County Ingham County
State or County DHHS 3 3 4 3
Private Child-Placing Agency N/A 15 4 6
Key Community Partners (i.e., mental
health, courts, county administrator)
N/A 4 3 2
WMPC N/A 9 N/A N/A
Total 3 31 11 11
The site visits constituted the second major data collection effort for the process evaluation, the first
of which was conducted in September 2017, prior to Kent County’s October 1, 2017,
implementation date. In Kent County, the site visit allowed an examination of one year of
implementation of the performance-based case rate funding model and qualitative feedback on its
effect on public and private child welfare agencies and key community partners (i.e., mental health,
court, county administrators). There was one telephone interview conducted in Kent County prior
Evaluation of Michigan’s Performance-Based
Funding Model: Second Annual Report 3-4
to the site visit as a key staff member was leaving the agency. In addition to the on-site data
collection activities, evaluation staff observed (via telephone) meetings, including the Child Welfare
Partnership Council (CWPC), the Kent County Directors Steering Committee (DSC), and the WAC
(WMPC Advisory Committee). For Ingham and Oakland counties, the comparison counties, data
collected during the site visits provide insights into the child welfare service delivery system (with a
focus on foster care) in each of the counties, including challenges and facilitators to serving child
welfare-involved children and families.
The main findings of these site visits are summarized in the sections that follow and are organized
by the primary process evaluation research questions and subquestions. Specifically:
RQ1: Do the counties adhere to the state’s guiding principles in performing child welfare practice?
RQ2: Do child placing agencies adhere to the MiTEAM practice model when providing child welfare services?
– Subquestion: What resources (strategies, infrastructure) are necessary to support the successful delivery of child welfare services?
– Subquestion: What factors facilitate and inhibit effective implementation of child welfare practice, in general, and, importantly, the Kent Model (in Kent County)?
– Subquestion: (Kent County) What resources are necessary to support the successful implementation of the Kent Model (i.e., performance-based case rate funding model)?
The section begins with a detailed description of the participating counties to provide a context in
which to understand process findings.
3.4 County Descriptions: Overall and in Child Welfare
In this first section, the demographic makeup of each of the three counties participating in the
evaluation is presented, to provide context for them. Kent County is implementing the
performance-based case rate funding model, while Ingham and Oakland counties are serving as the
comparison counties for the process evaluation, representing child welfare “services as usual.”
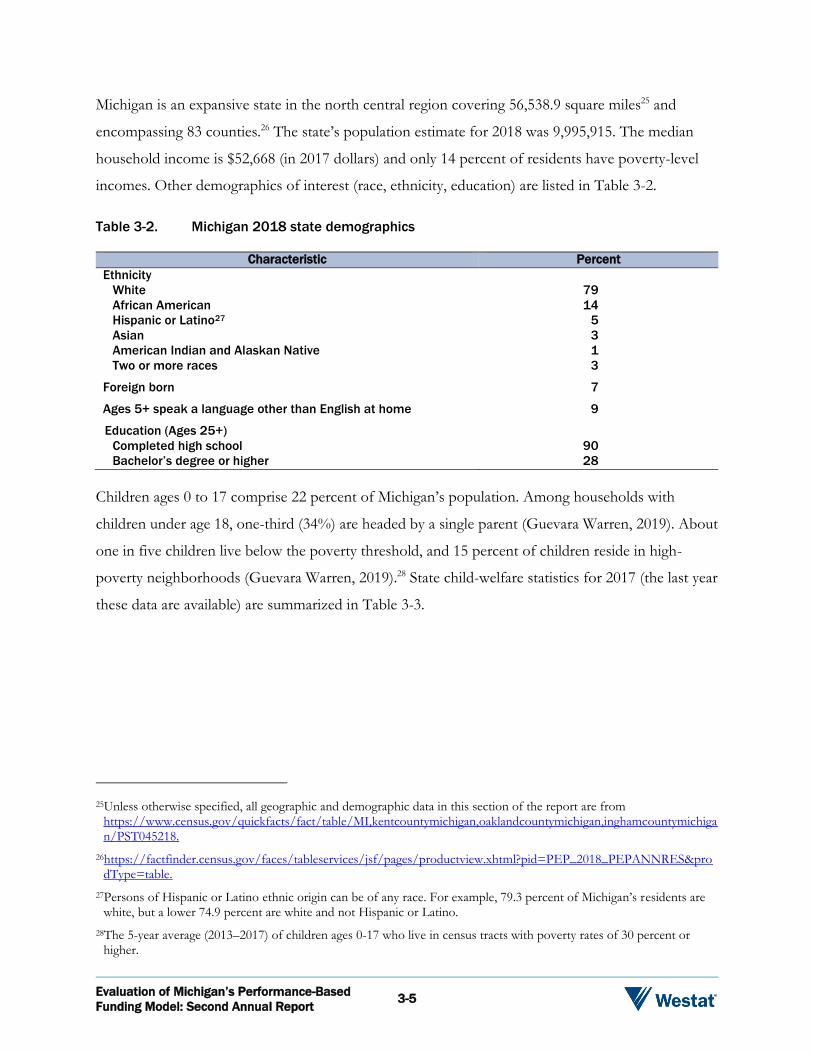
Evaluation of Michigan’s Performance-Based
Funding Model: Second Annual Report 3-5
Michigan is an expansive state in the north central region covering 56,538.9 square miles25 and
encompassing 83 counties.26 The state’s population estimate for 2018 was 9,995,915. The median
household income is $52,668 (in 2017 dollars) and only 14 percent of residents have poverty-level
incomes. Other demographics of interest (race, ethnicity, education) are listed in Table 3-2.
Table 3-2. Michigan 2018 state demographics
Characteristic Percent
Ethnicity
White 79
African American 14
Hispanic or Latino27 5
Asian 3
American Indian and Alaskan Native 1
Two or more races 3
Foreign born 7
Ages 5+ speak a language other than English at home 9
Education (Ages 25+)
Completed high school 90
Bachelor’s degree or higher 28
Children ages 0 to 17 comprise 22 percent of Michigan’s population. Among households with
children under age 18, one-third (34%) are headed by a single parent (Guevara Warren, 2019). About
one in five children live below the poverty threshold, and 15 percent of children reside in high-
poverty neighborhoods (Guevara Warren, 2019).28 State child-welfare statistics for 2017 (the last year
these data are available) are summarized in Table 3-3.
25Unless otherwise specified, all geographic and demographic data in this section of the report are from https://www.census.gov/quickfacts/fact/table/MI,kentcountymichigan,oaklandcountymichigan,inghamcountymichigan/PST045218.
26https://factfinder.census.gov/faces/tableservices/jsf/pages/productview.xhtml?pid=PEP_2018_PEPANNRES&prodType=table.
27Persons of Hispanic or Latino ethnic origin can be of any race. For example, 79.3 percent of Michigan’s residents are white, but a lower 74.9 percent are white and not Hispanic or Latino.
28The 5-year average (2013–2017) of children ages 0-17 who live in census tracts with poverty rates of 30 percent or higher.
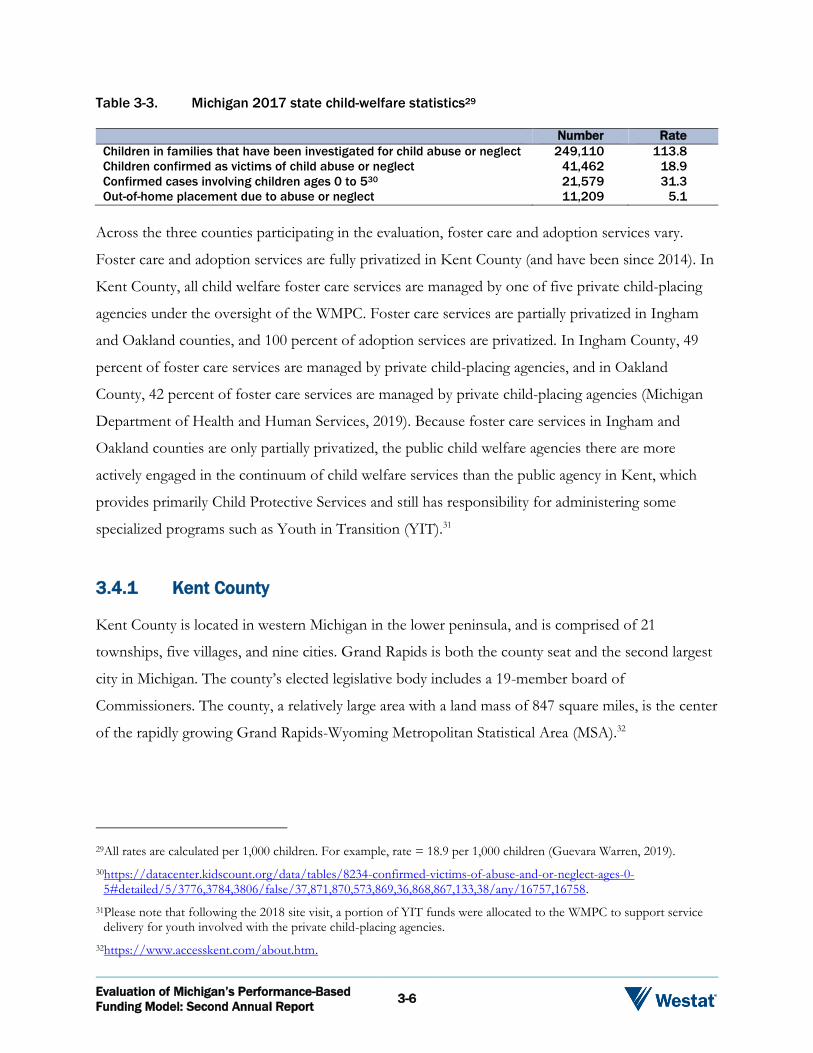
Evaluation of Michigan’s Performance-Based
Funding Model: Second Annual Report 3-6
Table 3-3. Michigan 2017 state child-welfare statistics29
Number Rate
Children in families that have been investigated for child abuse or neglect 249,110 113.8
Children confirmed as victims of child abuse or neglect 41,462 18.9
Confirmed cases involving children ages 0 to 530 21,579 31.3
Out-of-home placement due to abuse or neglect 11,209 5.1
Across the three counties participating in the evaluation, foster care and adoption services vary.
Foster care and adoption services are fully privatized in Kent County (and have been since 2014). In
Kent County, all child welfare foster care services are managed by one of five private child-placing
agencies under the oversight of the WMPC. Foster care services are partially privatized in Ingham
and Oakland counties, and 100 percent of adoption services are privatized. In Ingham County, 49
percent of foster care services are managed by private child-placing agencies, and in Oakland
County, 42 percent of foster care services are managed by private child-placing agencies (Michigan
Department of Health and Human Services, 2019). Because foster care services in Ingham and
Oakland counties are only partially privatized, the public child welfare agencies there are more
actively engaged in the continuum of child welfare services than the public agency in Kent, which
provides primarily Child Protective Services and still has responsibility for administering some
specialized programs such as Youth in Transition (YIT).31
3.4.1 Kent County
Kent County is located in western Michigan in the lower peninsula, and is comprised of 21
townships, five villages, and nine cities. Grand Rapids is both the county seat and the second largest
city in Michigan. The county’s elected legislative body includes a 19-member board of
Commissioners. The county, a relatively large area with a land mass of 847 square miles, is the center
of the rapidly growing Grand Rapids-Wyoming Metropolitan Statistical Area (MSA).32
29All rates are calculated per 1,000 children. For example, rate = 18.9 per 1,000 children (Guevara Warren, 2019).
30https://datacenter.kidscount.org/data/tables/8234-confirmed-victims-of-abuse-and-or-neglect-ages-0-5#detailed/5/3776,3784,3806/false/37,871,870,573,869,36,868,867,133,38/any/16757,16758.
31Please note that following the 2018 site visit, a portion of YIT funds were allocated to the WMPC to support service delivery for youth involved with the private child-placing agencies.
32https://www.accesskent.com/about.htm.

Evaluation of Michigan’s Performance-Based
Funding Model: Second Annual Report 3-7
In 2018, Kent County had an estimated population of 653,786, with a population density of
711.5 residents per square mile. The median household income is $57,302, and 10 percent of county
residents are living below the poverty threshold. Other demographics of interest (race, ethnicity,
education) are listed in Table 3-4.
Table 3-4. Kent County 2018 demographics
Characteristic Percent
Ethnicity
White
African American
Hispanic or Latino
Asian
American Indian and Alaska Native
Two or more races
82
11
11
3
1
3
Foreign born 8
Ages 5+ speak a language other than English at home 12
Education (Ages 25+)
Completed high school
Bachelor’s degree or higher
90
35
Children ages 0 to 17 comprise 24 percent of the population of Kent County. Single parent
households account for 31 percent of households with children.33 Ten percent of children in Kent
County are in families with poverty-level incomes, and 14 percent of children live in high-poverty
neighborhoods; these findings are lower than state proportions. Kent County child welfare statistics
for 2017 are summarized in Table 3-5. The rates shown are all lower than the rates in Ingham
County, but nearly double those in Oakland County.
Table 3-5. Kent County 2017 child welfare statistics34
Number Rate
Children in families that have been investigated for child abuse or neglect 18,640 117.6
Children confirmed as victims of child abuse or neglect 3,146 19.8
Confirmed cases involving children ages 0 to 5 1,591 30.1
Out-of-home placement due to abuse or neglect 775 4.9
33https://mlpp.org/kcdbprofiles2019/Kent.pdf.
34All rates are calculated per 1,000 children. For example, rate = 19.8 per 1,000 children (https://mlpp.org/kcdbprofiles2019/Kent.pdf).
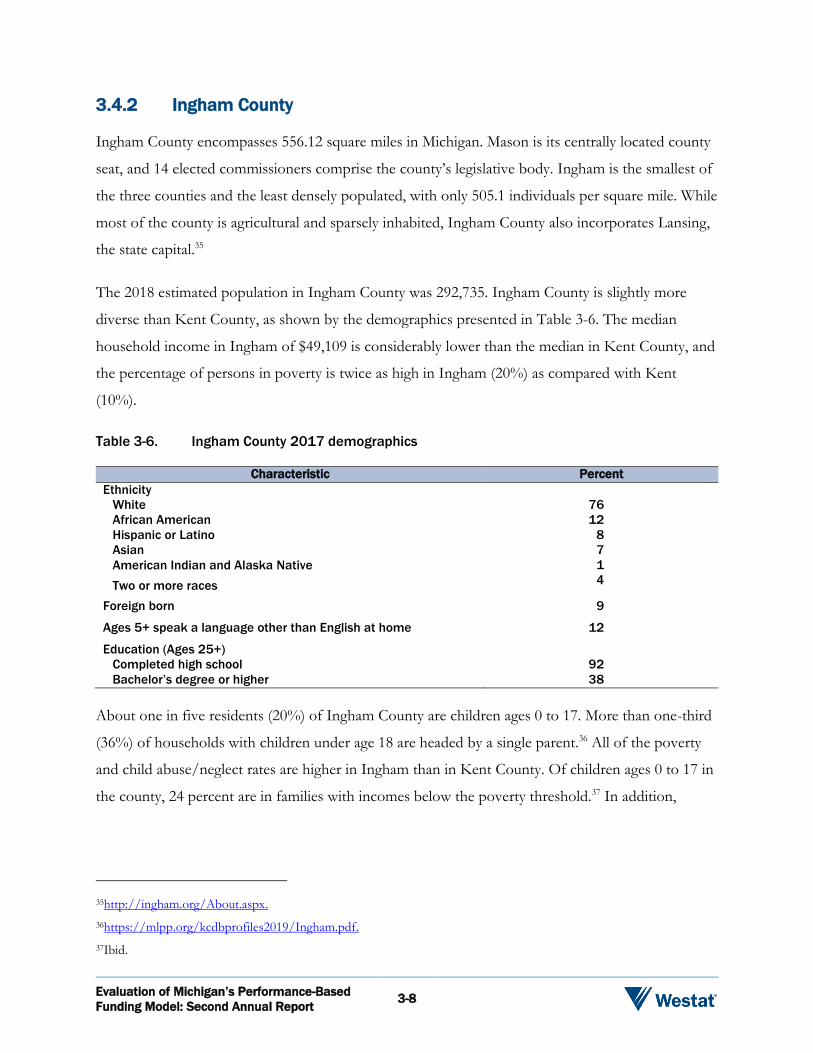
Evaluation of Michigan’s Performance-Based
Funding Model: Second Annual Report 3-8
3.4.2 Ingham County
Ingham County encompasses 556.12 square miles in Michigan. Mason is its centrally located county
seat, and 14 elected commissioners comprise the county’s legislative body. Ingham is the smallest of
the three counties and the least densely populated, with only 505.1 individuals per square mile. While
most of the county is agricultural and sparsely inhabited, Ingham County also incorporates Lansing,
the state capital.35
The 2018 estimated population in Ingham County was 292,735. Ingham County is slightly more
diverse than Kent County, as shown by the demographics presented in Table 3-6. The median
household income in Ingham of $49,109 is considerably lower than the median in Kent County, and
the percentage of persons in poverty is twice as high in Ingham (20%) as compared with Kent
(10%).
Table 3-6. Ingham County 2017 demographics
Characteristic Percent
Ethnicity
White
African American
Hispanic or Latino
Asian
American Indian and Alaska Native
Two or more races
76
12
8
7
1
4
Foreign born 9
Ages 5+ speak a language other than English at home 12
Education (Ages 25+)
Completed high school
Bachelor’s degree or higher
92
38
About one in five residents (20%) of Ingham County are children ages 0 to 17. More than one-third
(36%) of households with children under age 18 are headed by a single parent.36 All of the poverty
and child abuse/neglect rates are higher in Ingham than in Kent County. Of children ages 0 to 17 in
the county, 24 percent are in families with incomes below the poverty threshold.37 In addition,
35http://ingham.org/About.aspx.
36https://mlpp.org/kcdbprofiles2019/Ingham.pdf.
37Ibid.

Evaluation of Michigan’s Performance-Based
Funding Model: Second Annual Report 3-9
21 percent of all children in Ingham County live in high-poverty neighborhoods.38 Ingham County
child welfare statistics for 2017 are summarized in Table 3-7.
Table 3-7. 2017 Ingham County 2017 child welfare statistics39
Number Rate
Children in homes that have been investigated for child abuse or neglect 8,895 154.5
Children confirmed as victims of child abuse or neglect 1,812 31.5
Confirmed cases involving children ages 0 to 5 976 50.2
Out-of-home placement due to abuse or neglect 524 9.1
3.4.3 Oakland County
Oakland County is located in east Michigan and borders Wayne County, the home of Detroit City.
Situated within the Detroit-Warren-Dearborn MSA, Oakland County extends across 867.66 square
miles and includes 62 cities, townships, and villages. Troy is the county’s largest city and Pontiac is
the county seat. Unlike Kent and Ingham counties, its governance includes an elected County
Executive along with a board of 21 Commissioners.40 Oakland County is also the most densely
populated of the three counties, with 1,385.7 persons per square mile.
Based on population size, Oakland is the second largest county in Michigan (second to Wayne
County). In 2017, the county’s population was estimated at 1,259,201. Other demographics of
interest (race, ethnicity, education) are listed in Table 3-8, which shows that Oakland County has the
most highly educated population among the participating three counties. Similarly, Oakland appears
to be a relatively affluent county, as the median household income is $73,369, compared with a
median of $57,302 in Kent County, and the percentage of persons in poverty in Oakland (8%) is the
lowest among the three counties.
38Ibid.
39All rates are calculated per 1,000 children in the specified age group For example, rate = 31.5 cases per 1,000 children ages 0 to 17 (https://mlpp.org/kcdbprofiles2019/Ingham.pdf).
40https://explorer.naco.org/.
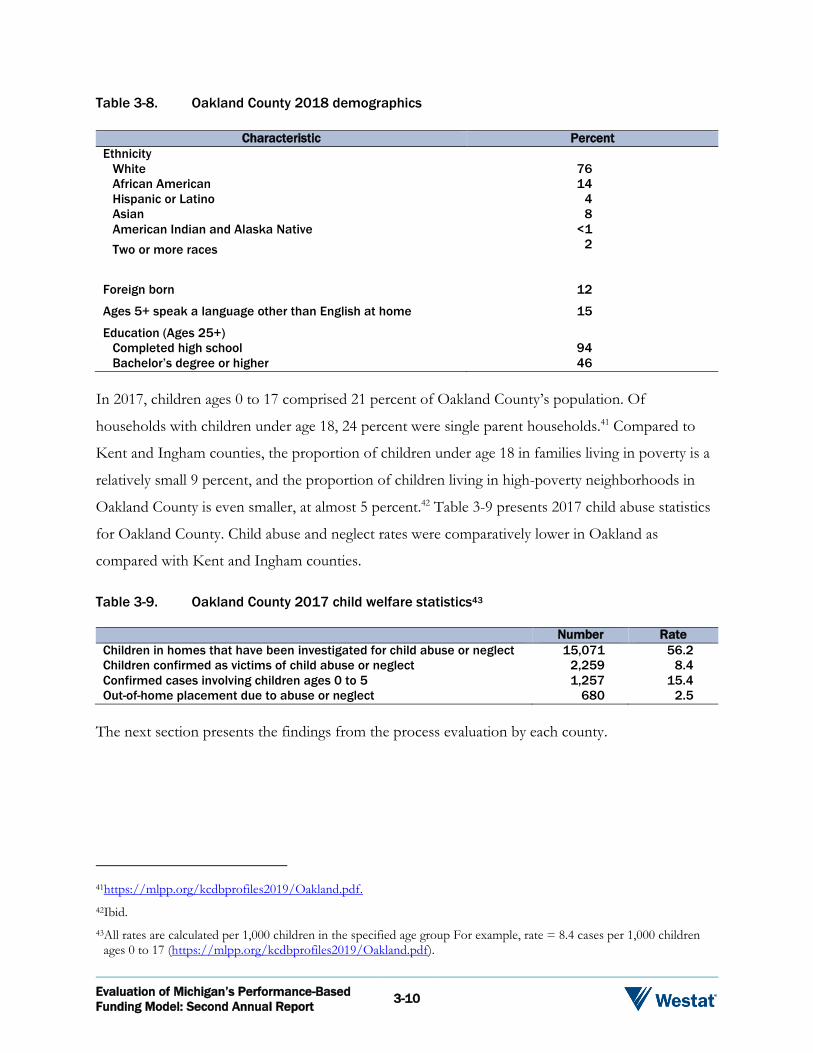
Evaluation of Michigan’s Performance-Based
Funding Model: Second Annual Report 3-10
Table 3-8. Oakland County 2018 demographics
In 2017, children ages 0 to 17 comprised 21 percent of Oakland County’s population. Of
households with children under age 18, 24 percent were single parent households.41 Compared to
Kent and Ingham counties, the proportion of children under age 18 in families living in poverty is a
relatively small 9 percent, and the proportion of children living in high-poverty neighborhoods in
Oakland County is even smaller, at almost 5 percent.42 Table 3-9 presents 2017 child abuse statistics
for Oakland County. Child abuse and neglect rates were comparatively lower in Oakland as
compared with Kent and Ingham counties.
Table 3-9. Oakland County 2017 child welfare statistics43
Number Rate
Children in homes that have been investigated for child abuse or neglect 15,071 56.2
Children confirmed as victims of child abuse or neglect 2,259 8.4
Confirmed cases involving children ages 0 to 5 1,257 15.4
Out-of-home placement due to abuse or neglect 680 2.5
The next section presents the findings from the process evaluation by each county.
41https://mlpp.org/kcdbprofiles2019/Oakland.pdf.
42Ibid.
43All rates are calculated per 1,000 children in the specified age group For example, rate = 8.4 cases per 1,000 children ages 0 to 17 (https://mlpp.org/kcdbprofiles2019/Oakland.pdf).
Characteristic Percent
Ethnicity
White
African American
Hispanic or Latino
Asian
American Indian and Alaska Native
Two or more races
76
14
4
8
<1
2
Foreign born 12
Ages 5+ speak a language other than English at home 15
Education (Ages 25+)
Completed high school
Bachelor’s degree or higher
94
46
Evaluation of Michigan’s Performance-Based
Funding Model: Second Annual Report 3-11
3.5 Process Evaluation Findings
3.5.1 Kent County
In Kent County, all child welfare foster care case management services are provided by one of five
private child-placing agencies (Michigan Department of Health and Human Services, 2019), under
the oversight of the WMPC. In contrast to Ingham and Oakland counties, whose structure and
operations represent the standard per diem model of child welfare practice in Michigan, the
following discussion of Kent County child welfare practice represents the first year of
implementation of the Kent Model.
Kent County is the fourth largest county in Michigan, but has the second highest number of Child
Protective Services (CPS) reports. According to county stakeholders, child welfare has been a
priority for the community for many years. Public institutions (such as Kent County DHHS, the
judiciary, and the county administrator) regularly collaborate on initiatives with private agencies and
religious and philanthropic organizations through a number of active boards and committees. One
stakeholder described the ethos of the community:
It’s a view that Kent County does sort of its own thing, but Kent County takes care of its own. That’s what we do. We firmly believe in the importance of doing that. But it’s all about your priorities and where you place your priorities. And for us, having a healthy community where children can grow up safe and be successful and be protected, well, those are very important things. And you can’t assign a dollar amount to that. But if you have funding that can help make those things happen, why not utilize it in that way?
During the most recent evaluation site visit, the evaluation team conducted 31 interviews or focus
groups in Kent County with agency leaders, supervisors, and caseworkers at Kent County DHHS
and each of the five child-placing agencies, as well as with representatives from the County
Administrator’s Office, the Family Division of the 17th Circuit Court, and a public mental health
partner agency. In addition, the evaluation team interviewed most of the current WMPC staff,
including the Chief Executive Officer, Chief Operating Officer, Chief Financial Officer, Director of
Care Coordination, three of four Care Coordinators, and Performance and Quality Improvement
staff.44 Through these data collection activities, the evaluation team obtained information on a range
44The outgoing Performance and Quality Improvement Director was interviewed via telephone prior to her departure from the WMPC.
Evaluation of Michigan’s Performance-Based
Funding Model: Second Annual Report 3-12
of topics (see Section 3.3). This section summarizes key findings related to the research questions
established for the process study.
Overarching Research Question 1: Do the
Counties Adhere to the State’s Guiding
Principles In Performing Child Welfare Practice?
Subquestion: What Factors Facilitate And Inhibit Effective Implementation of
Child Welfare Practice, in General, and, Importantly, the Kent Model?
Subquestion: What Resources Are Necessary to Support the Successful Implementation of
the Kent Model (i.e., Performance-Based Case Rate Funding Model)?
There are 13 guiding principles of child welfare practice in Michigan, several of which focus on child
safety, family preservation, tailoring services to the unique needs of the child and family, supporting
child welfare professionals to promote success and retention, and a robust, research-driven quality
improvement process. These are combined with three commonly established strategies to guide
child welfare practice throughout the state. These strategies, which form the basis of Strengthening
Our Focus on Children and Families in Michigan, include: (1) MiTEAM practice model,
(2) Continuous quality improvement approach, and (3) Performance-based child welfare. Logically,
the more fully a county or agency adheres to these guiding principles and implements the three
strategies, the better the outcomes will be for children and families in the child welfare system.
MDHHS designed the MiTEAM practice model as one structure through which the guiding
principles of child welfare are enacted throughout the state.
The Kent Model was designed based on the theory that the new funding (case rate) model and
oversight structure (facilitated by the WMPC) will enable foster care service providers to more fully
adhere to Michigan’s guiding principles for child welfare. Specifically, the flexibility in service
delivery and funding, collaborative partnerships, and focus on data-driven programmatic
improvement should, according to the logic of the model (Appendix 1), lead to faster and more
individualized services for families, better collaboration among community partners, better support
to agency staff, less time in care for children (especially in residential settings), increased placement
stability, and more robust data for continuous quality improvement.
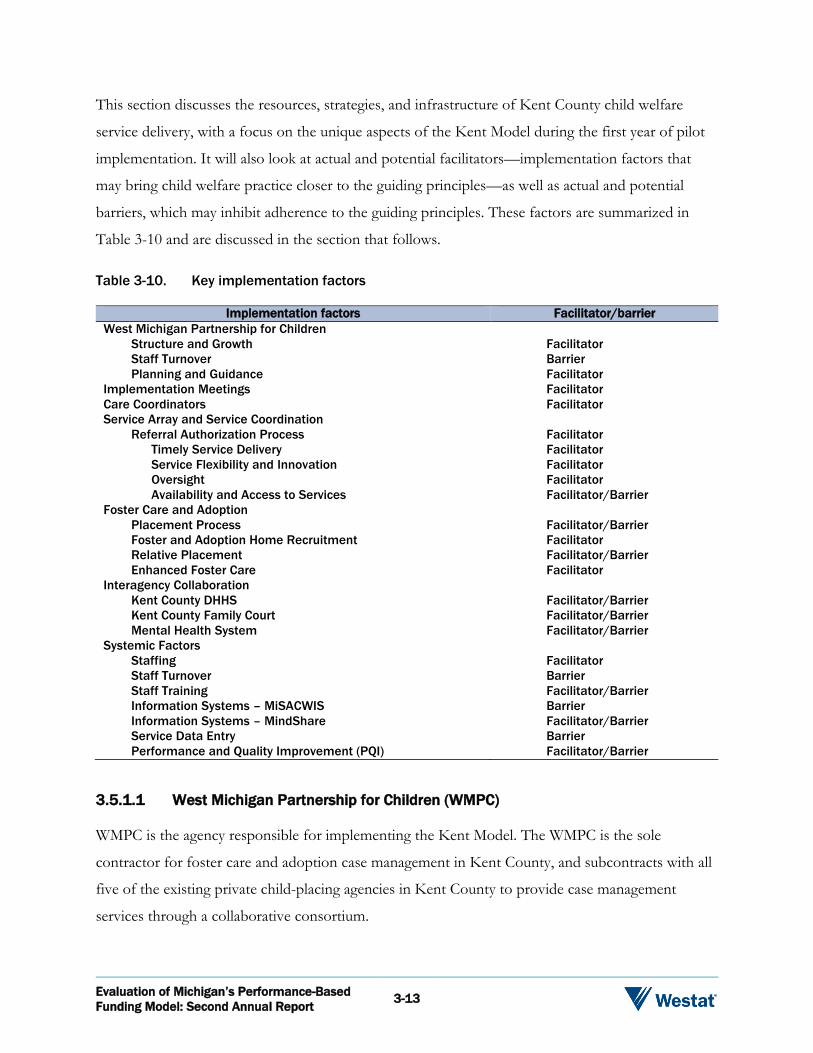
Evaluation of Michigan’s Performance-Based
Funding Model: Second Annual Report 3-13
This section discusses the resources, strategies, and infrastructure of Kent County child welfare
service delivery, with a focus on the unique aspects of the Kent Model during the first year of pilot
implementation. It will also look at actual and potential facilitators—implementation factors that
may bring child welfare practice closer to the guiding principles—as well as actual and potential
barriers, which may inhibit adherence to the guiding principles. These factors are summarized in
Table 3-10 and are discussed in the section that follows.
Table 3-10. Key implementation factors
Implementation factors Facilitator/barrier
West Michigan Partnership for Children
Structure and Growth Facilitator
Staff Turnover Barrier
Planning and Guidance Facilitator
Implementation Meetings Facilitator
Care Coordinators Facilitator
Service Array and Service Coordination
Referral Authorization Process Facilitator
Timely Service Delivery Facilitator
Service Flexibility and Innovation Facilitator
Oversight Facilitator
Availability and Access to Services Facilitator/Barrier
Foster Care and Adoption
Placement Process Facilitator/Barrier
Foster and Adoption Home Recruitment Facilitator
Relative Placement Facilitator/Barrier
Enhanced Foster Care Facilitator
Interagency Collaboration
Kent County DHHS Facilitator/Barrier
Kent County Family Court Facilitator/Barrier
Mental Health System Facilitator/Barrier
Systemic Factors
Staffing Facilitator
Staff Turnover Barrier
Staff Training Facilitator/Barrier
Information Systems – MiSACWIS Barrier
Information Systems – MindShare Facilitator/Barrier
Service Data Entry Barrier
Performance and Quality Improvement (PQI) Facilitator/Barrier
3.5.1.1 West Michigan Partnership for Children (WMPC)
WMPC is the agency responsible for implementing the Kent Model. The WMPC is the sole
contractor for foster care and adoption case management in Kent County, and subcontracts with all
five of the existing private child-placing agencies in Kent County to provide case management
services through a collaborative consortium.

Evaluation of Michigan’s Performance-Based
Funding Model: Second Annual Report 3-14
WMPC Organizational Structure
As of the time of this report, the WMPC consists of 19 staff positions and is guided by a Board of
Directors with committees developed as needed. The organizational chart is presented in
Exhibit 3-1.
WMPC Structure and Growth
In interviews with the evaluation team, WMPC respondents described their organizational structure,
current staffing, and planned growth. In October 2017, when implementation of the Kent Model
began, WMPC staff included 14 employees; five on the leadership team, one administrative
coordinator, one contracts and finance specialist, four care coordinators, and three performance and
quality improvement coordinators. The initial goal for the organization was to “start very lean” and
assess what additional positions would be necessary over time. Since implementation began, WMPC
has added five new positions to the organization:
Program Manager. Manages WMPC Care Coordinators.
The Director of Care Coordination and Innovation initially supervised four care coordinators in addition to providing general direction on the development of new initiatives and assisting in gaining buy-in from the private agencies and community partners. Over time, these combined responsibilities became too demanding for one individual. As a result, WMPC added a program manager position to support the day-to-day work of the care coordinators and assist on special cases as needed.
Business Intelligence Analyst. Reports to the Director of Performance and Quality Improvement (PQI).
The Business Intelligence Analyst is a new position; the analyst’s primary task is managing the MindShare system. This responsibility initially was assigned to the Performance and Quality Improvement Director. The change was influenced by the departure of the previous Performance and Quality Improvement Director who noted that the responsibility of managing the Performance and Quality Improvement processes along with having responsibility for the MindShare system was too great a job for one person.

Eva
lua
tion
of M
ich
iga
n’s
Pe
rform
an
ce
-Ba
se
d F
un
din
g
Mo
de
l: Se
co
nd
An
nu
al R
ep
ort
3-1
5
Exhibit 3-1. WMPC organizational structure

Evaluation of Michigan’s Performance-Based
Funding Model: Second Annual Report 3-16
Clinical Liaison. Subcontracted and funded through Network 180.45
WMPC respondents reported that they realized youth were underutilizing clinical mental health services in the community. They consulted with the mental health partner agency, Network 180, to create a subcontracted position. The individual in this position is tasked with increasing access to mental health services for children in foster care.
Accountant. Responsible for accounting tasks.
The WMPC CFO initially was responsible for implementing an accounting system for the WMPC, developing a budget, tracking revenues and expenditures, and all parts of financial operations including overseeing the detailed contracts and identifying performance benchmarks. Over time, it became clear that an accountant was needed to support the day-to-day accounting tasks of the organization. This is especially true as the CFO turns attention to developing financial policies and procedures as well as analytic work based on the case rate and MindShare data, as is planned in the coming years.
Data Coordinator. Responsible for overseeing case services data in MiSACWIS.
The WMPC saw the need to have one person oversee and coordinate data entry that was related to service data for the WMPC. Respondents shared that this has been widely reported as beneficial in reducing data entry burden on foster care caseworkers and reducing data entry error.
Additionally, WMPC respondents reported their plans for continued growth. One position planned
is a community engagement liaison. This role ideally would be filled by an individual with “lived
experience” in the foster care system as a youth or a parent, and would focus on community
engagement activities. As described by one respondent:
We don’t do a great job yet of engaging with parents and youth and other community providers and neighborhood associations. So this person would be doing that type of community engagement… I really want that person to be focused on creating advisory and support groups for parents and youth.
45Network 180 is the community mental health authority for Kent County. It connects individuals and their families to services for mental illness, substance use disorders, or developmental disabilities.

Evaluation of Michigan’s Performance-Based
Funding Model: Second Annual Report 3-17
WMPC Staff Turnover and Retention
Since implementation began, WMPC has experienced turnover in four positions: Performance and
Quality Improvement Director, Performance and Quality Improvement Coordinator, Director of
Care Coordination and Innovation, and the Administrative Coordinator. Respondents noted
challenges in retaining qualified WMPC staff:
High Level of Effort. According to one WMPC employee, start-up organizations are a unique opportunity that “require a ton of energy and a ton of lift.” To maintain the needed momentum from the planning stages into implementation after October 2017, WMPC employees were required to expend a great deal of effort. One respondent noted that there has not been a rest period yet. There were times where workers had to balance planning and implementing at the same time: as one respondent shared, “strategizing initiatives and implementing initiatives” simultaneously.
Need for Support. Adding to the challenge, the WMPC is a nonprofit child-placing agency with a culture of financial constraint in using funds for administrative costs. Some workers reported the need for additional support for the WMPC team. “WMPC needs more staff... For the amount of work that needs to happen, there needs to be additional capacity in that way,” stated one employee.
In regard to recruiting, staff noted both challenges and facilitators:
Challenge: 5-Year Pilot. One WMPC staff member highlighted the pilot’s five-year nature as a challenge to recruiting personnel, as “I guess it is communicated that it is a five-year pilot… that could probably create a narrative where it might seem like this isn’t permanent.”
Facilitator: Wide Recruiting Net. The same staff member also highlighted a recruiting strength: due to the unique nature of the work, WMPC does not need to limit recruitment efforts to job candidates from the child welfare or even social work field. “I think this is such a unique area, in that you could pull people from different backgrounds. I mean, you could hire somebody with a background in lots of different areas. It’s not just social work.”
Planning and Guidance
Kent County private agency directors, supervisors, and caseworkers identified the planning and
guidance provided during the first year of implementation as a facilitating factor. Staff highlighted
implementation meetings, the presence of care coordinators, staff training, and overall WMPC
openness and responsiveness to feedback as particularly helpful, as presented in Table 3-11.
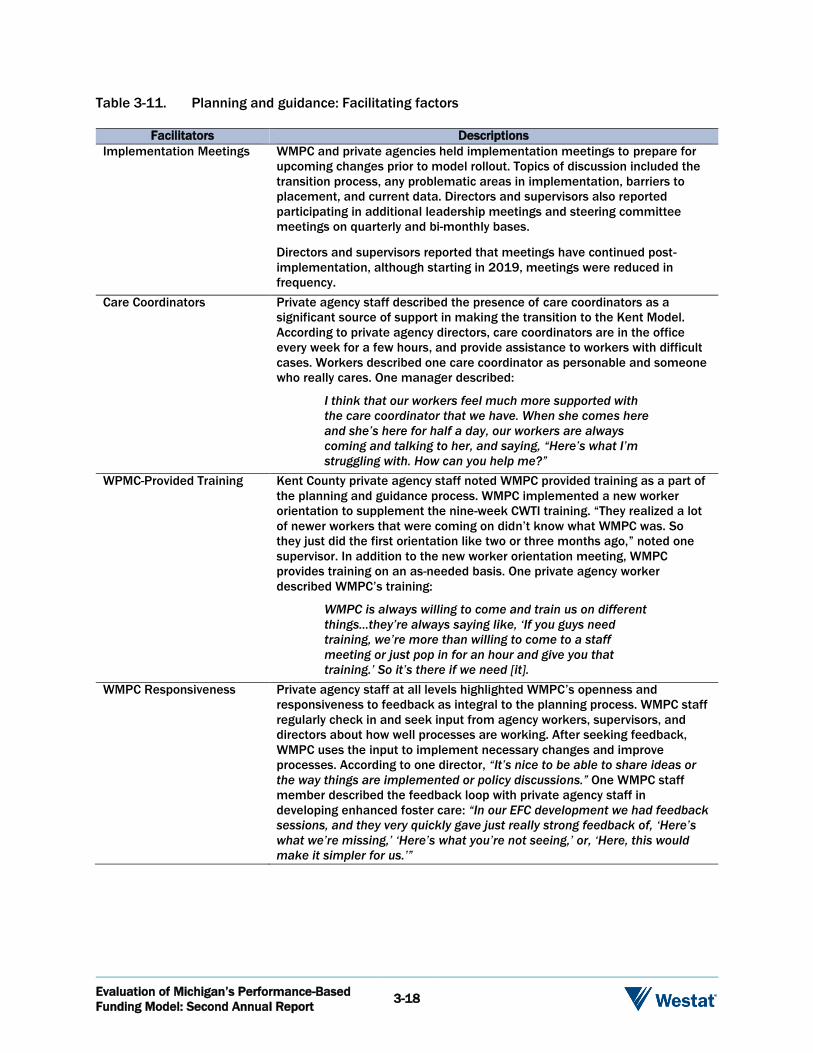
Evaluation of Michigan’s Performance-Based
Funding Model: Second Annual Report 3-18
Table 3-11. Planning and guidance: Facilitating factors
Facilitators Descriptions
Implementation Meetings WMPC and private agencies held implementation meetings to prepare for
upcoming changes prior to model rollout. Topics of discussion included the
transition process, any problematic areas in implementation, barriers to
placement, and current data. Directors and supervisors also reported
participating in additional leadership meetings and steering committee
meetings on quarterly and bi-monthly bases.
Directors and supervisors reported that meetings have continued post-
implementation, although starting in 2019, meetings were reduced in
frequency.
Care Coordinators Private agency staff described the presence of care coordinators as a
significant source of support in making the transition to the Kent Model.
According to private agency directors, care coordinators are in the office
every week for a few hours, and provide assistance to workers with difficult
cases. Workers described one care coordinator as personable and someone
who really cares. One manager described:
I think that our workers feel much more supported with
the care coordinator that we have. When she comes here
and she’s here for half a day, our workers are always
coming and talking to her, and saying, “Here’s what I’m
struggling with. How can you help me?”
WPMC-Provided Training Kent County private agency staff noted WMPC provided training as a part of
the planning and guidance process. WMPC implemented a new worker
orientation to supplement the nine-week CWTI training. “They realized a lot
of newer workers that were coming on didn’t know what WMPC was. So
they just did the first orientation like two or three months ago,” noted one
supervisor. In addition to the new worker orientation meeting, WMPC
provides training on an as-needed basis. One private agency worker
described WMPC’s training:
WMPC is always willing to come and train us on different
things...they’re always saying like, ‘If you guys need
training, we’re more than willing to come to a staff
meeting or just pop in for an hour and give you that
training.’ So it’s there if we need [it].
WMPC Responsiveness Private agency staff at all levels highlighted WMPC’s openness and
responsiveness to feedback as integral to the planning process. WMPC staff
regularly check in and seek input from agency workers, supervisors, and
directors about how well processes are working. After seeking feedback,
WMPC uses the input to implement necessary changes and improve
processes. According to one director, “It’s nice to be able to share ideas or
the way things are implemented or policy discussions.” One WMPC staff
member described the feedback loop with private agency staff in
developing enhanced foster care: “In our EFC development we had feedback
sessions, and they very quickly gave just really strong feedback of, ‘Here’s
what we’re missing,’ ‘Here’s what you’re not seeing,’ or, ‘Here, this would
make it simpler for us.’”

Evaluation of Michigan’s Performance-Based
Funding Model: Second Annual Report 3-19
3.5.1.2 Child Welfare Service Delivery Under the Kent Model
Kent County was an early adopter and champion of the MiTEAM practice model, and the
MiTEAM principles remain the foundation of child welfare practice under the Kent Model. One
year into implementation, agency staff have not seen many fundamental changes to how MiTEAM
is implemented in the Kent County child welfare system:
The way we route things, get things approved... that process has changed, but not necessarily the process of assessing parents, working the services, working with the [parents], but more the process of the way we get things approved.
From the practitioner point of view, the first year of implementation brought only a few major
changes to the manner in which child welfare services are delivered in Kent County, including:
Authorization process for service referrals,
New case rate funding structure, and
Enhanced Foster Care (EFC) program.
Although each of these changes saw some challenges in implementation, both agency and court staff
overwhelmingly described positive experiences with the new processes and felt that they benefitted
children and families.
Service Array and Service Coordination
Prior to the launch of the Kent Model, most services for children and families were paid through
Kent County DHHS contracts. Private agency workers had to submit a request to a Kent County
DHHS Purchase of Service (POS) monitor for approval before they could make a referral to a
service provider. Agency staff described this process as often lengthy, labor-intensive, and
inconsistent, leading to substantial delays in services for families. According to respondents, the
requirements for authorization and the responsiveness to the request often varied based on which
monitor or supervisor was involved. Former POS monitors explained that, from their end,
requirements and timeliness often varied based on changing Kent County DHHS policy or the
interpretation of policy by supervisors.
Under the Kent Model, authority for approval and payment of most services rests with the WMPC.
Each of the five private agencies works with a dedicated WMPC Care Coordinator who is

Evaluation of Michigan’s Performance-Based
Funding Model: Second Annual Report 3-20
responsible for service authorization requests. Some services, such as determinations of care (DOC)
or EFC, are authorized by either the private agency or WMPC leadership.
Staff at every level in both the five private agencies and the court, described these specific ways in
which this new way of authorizing services is a facilitator to better child welfare practice:
More efficient service delivery and more timely receipt of services by families,
More opportunity for flexible and innovative case planning, and
More collaborative and responsive oversight.
Staff also described implementation challenges, which included:
Learning curves for WMPC staff, especially those who came from fields other than child welfare;
Learning curves for private agency staff with new processes and particularly, new ways of entering services into MiSACWIS; and
Lack of forms or procedures for new processes or programs (e.g., EFC).
Efficient and Timely Service Delivery
In creating care coordinator positions, the WMPC intended to streamline the service authorization
process to make service approvals faster, more responsive, and more consistent. At the end of the
first year of implementation, agency staff noted that most approvals now come within days or even
hours, rather than weeks or months. An agency director summed up the intended impact of this
increased efficiency in service authorization:
So that has a huge impact on how quickly clients are getting services because it’s all about engaging the parents quickly and as holistically as we can. And the longer those approvals were taking in the past, then you’re just losing that traction with your families. So that has definitely been a huge impact.
Private agency staff attributed this change to specific facilitators associated with the Kent Model, as
listed in Table 3-12.
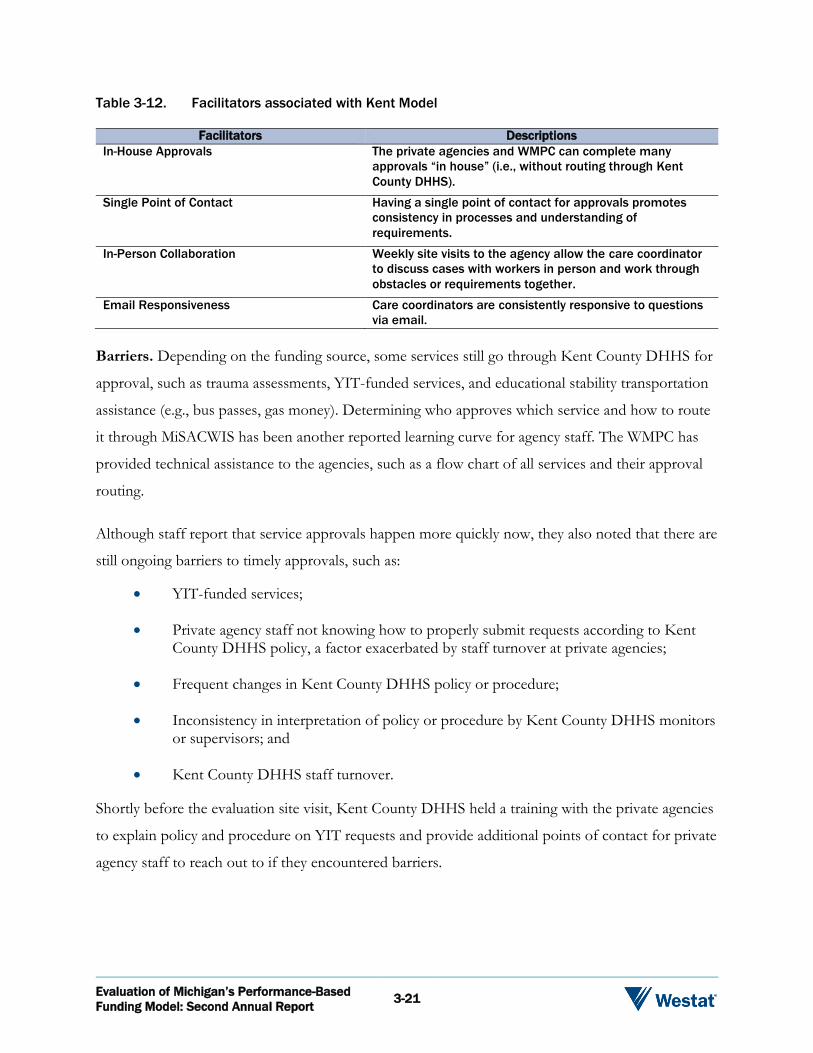
Evaluation of Michigan’s Performance-Based
Funding Model: Second Annual Report 3-21
Table 3-12. Facilitators associated with Kent Model
Facilitators Descriptions
In-House Approvals The private agencies and WMPC can complete many
approvals “in house” (i.e., without routing through Kent
County DHHS).
Single Point of Contact Having a single point of contact for approvals promotes
consistency in processes and understanding of
requirements.
In-Person Collaboration Weekly site visits to the agency allow the care coordinator
to discuss cases with workers in person and work through
obstacles or requirements together.
Email Responsiveness Care coordinators are consistently responsive to questions
via email.
Barriers. Depending on the funding source, some services still go through Kent County DHHS for
approval, such as trauma assessments, YIT-funded services, and educational stability transportation
assistance (e.g., bus passes, gas money). Determining who approves which service and how to route
it through MiSACWIS has been another reported learning curve for agency staff. The WMPC has
provided technical assistance to the agencies, such as a flow chart of all services and their approval
routing.
Although staff report that service approvals happen more quickly now, they also noted that there are
still ongoing barriers to timely approvals, such as:
YIT-funded services;
Private agency staff not knowing how to properly submit requests according to Kent County DHHS policy, a factor exacerbated by staff turnover at private agencies;
Frequent changes in Kent County DHHS policy or procedure;
Inconsistency in interpretation of policy or procedure by Kent County DHHS monitors or supervisors; and
Kent County DHHS staff turnover.
Shortly before the evaluation site visit, Kent County DHHS held a training with the private agencies
to explain policy and procedure on YIT requests and provide additional points of contact for private
agency staff to reach out to if they encountered barriers.
Evaluation of Michigan’s Performance-Based
Funding Model: Second Annual Report 3-22
3.5.1.3 Flexibility and Innovation in Case Planning
Another goal of the pilot was that the case rate would allow for more flexibility in spending to
enable staff to better meet the individualized needs of families. In the first year of implementation,
agency staff report that they have begun to use these opportunities for more innovative case
planning. They described feeling a greater freedom to advocate for the needs of families and find
creative solutions to them, without running into bureaucratic barriers. Examples of various ways in
which private agency staff can use innovation in case planning are provided below.
According to agency staff, the WMPC has encouraged creative case planning mainly through the
care coordinators, who frequently brainstorm and troubleshoot cases with workers. An agency
director described that WMPC would “step in and say, okay, how about we try this? And use their funding in
creative ways to try to get the best outcomes for kids, when through the system, that would not happen.” Staff also
described receiving appropriate pushback from WMPC when necessary, including increased
financial oversight and accountability. Despite this, agency staff continue to report that WMPC gives
them more freedom than they previously had, to do what is best for their families.
Although WMPC has attempted to get private agency staff out of the “scarcity mentality” to think
more creatively about how to meet the needs of families, some private agency staff are still aware
that the case rate is flexible, but not infinite: “That was my only worry. Even with like EFC and stuff, I feel
like approvals are so quick about a lot of things. I am worried about like, I’m going to run out of money?”
Private agency staff shared examples of how the flexibility of case rate funding and the streamlined
WMPC approval process enables non-traditional case planning, including:
Daycare assistance for a family that would not qualify for assistance from Kent County Department
of Health and Human Services
Approval of the daily rate for an unlicensed, relative foster home that could not afford to care for the
child without assistance
A security system for a foster home caring for a teenager who frequently ran away and would
otherwise have been put into a residential setting
Domestic violence counseling for a Spanish-speaking father with no insurance
Various therapy services not covered by a client’s insurance or Medicaid
Prevention-support services
Before…to get some of the services we knew would benefit our kids, we had to
be over the cliff already. Where now it’s like, okay, we see that we’re coming up
on the cliff: can we do something now to stop us from getting to that point? And
it’s been way easier for those things to happen.
Evaluation of Michigan’s Performance-Based
Funding Model: Second Annual Report 3-23
3.5.1.4 Service Availability and Accessibility
Kent County is considered one of the most resource-rich counties in Michigan when it comes to
services for children and families. Although the pilot has made approval for service referrals faster,
agencies still encounter difficulty accessing certain services for their clients due to provider
availability, wait lists, or qualification standards.
In particular, agency staff discussed that the criteria for obtaining mental health services for children
has been tightening recently: “We’ve seen kids being denied for services that would have previously been
accepted.” Staff noted that it can take intensive and time-consuming advocacy to get children into the
appropriate service, and that it can be difficult to get in touch with the right person. To help foster
care workers navigate that process, the WMPC recently created a WMPC staff position, discussed
above, to serve as a clinical liaison between private agencies and the mental health system. In
addition, agencies often have problems finding mental health providers who accept clients’
insurance. One agency staff person observed that although Kent County has many great services:
“In so many ways, insurance dictates what services [clients can access].” Finally, agency staff also mentioned
encountering scarcity of or barriers to affordable housing and child care, and domestic violence
counseling (particularly for male perpetrators).
3.5.1.5 Foster Care Placement
The placement of children in foster homes in Kent County continues to occur through the Child
Placement Network (CPN). With implementation of the Kent Model, the WMPC took over
facilitation of the CPN. When a child is taken into care in Kent County, a conference call is
immediately convened with representatives from all five private child-placing agencies, Kent County
DHHS, and the WMPC. The case is reviewed to determine if any of the five private agencies have
an appropriate placement available. If no agency volunteers a placement, the child is placed on a
“straight rotation,” meaning that the next agency in the rotation must take the child whether or not
they have a home available.

Evaluation of Michigan’s Performance-Based
Funding Model: Second Annual Report 3-24
Agencies shared consistent feedback on facilitators and barriers to the placement process:
Facilitators
Bed Borrowing. WMPC has been working to make the CPN process more cooperative between agencies by encouraging “bed borrowing,” or the sharing of homes and case management resources. Historically, agencies have been territorial over their resource homes, but staff feel that mindset has begun changing.
Help Finding Placements. WMPC works actively with agencies to find placements for children. Most agency staff appreciated this, although some felt micromanaged or that the WMPC was pushing too hard to keep children out of residential care, even if the worker felt residential care would be in the best interests of the child.
Barriers
Straight Rotation. Straight rotation is a struggle for agencies because they cannot decline a placement if it is their turn in the rotation. WMPC has addressed this by allowing agencies to skip their next rotation if they volunteer a placement when it is not their turn.
High Caseloads. Agencies often do not want to take a placement even if they have a bed available because worker caseloads are too high. WMPC has addressed this by encouraging agencies to share placement and case management resources, as mentioned above.
Case Information Sharing. CPS workers no longer attend the CPN calls, and the Kent County DHHS representative often does not have the detailed information about the child and family that the private agency worker needs at case transfer. Although case transfer meetings are technically a requirement, both Kent County DHHS and private agency staff reported that these rarely happen.
3.5.1.6 Foster Home Recruitment, Licensing, Training and Retention
As part of the pilot, the WMPC assumed responsibility for the Kent County Licensing Foster Care
Coalition. The first activity was to rename and rebrand the coalition as Foster Kent Kids. At the end
of the first year, new materials were being printed in preparation for the new marketing effort.
Recruitment and licensing staff at the private agencies expressed the hope that the WMPC would
increase its role in foster care and adoption recruitment, which remains difficult and highly
competitive between the private agencies, despite recent efforts to collaborate as a coalition. In
addition, staff felt the state licensing process has been consistently growing more burdensome on
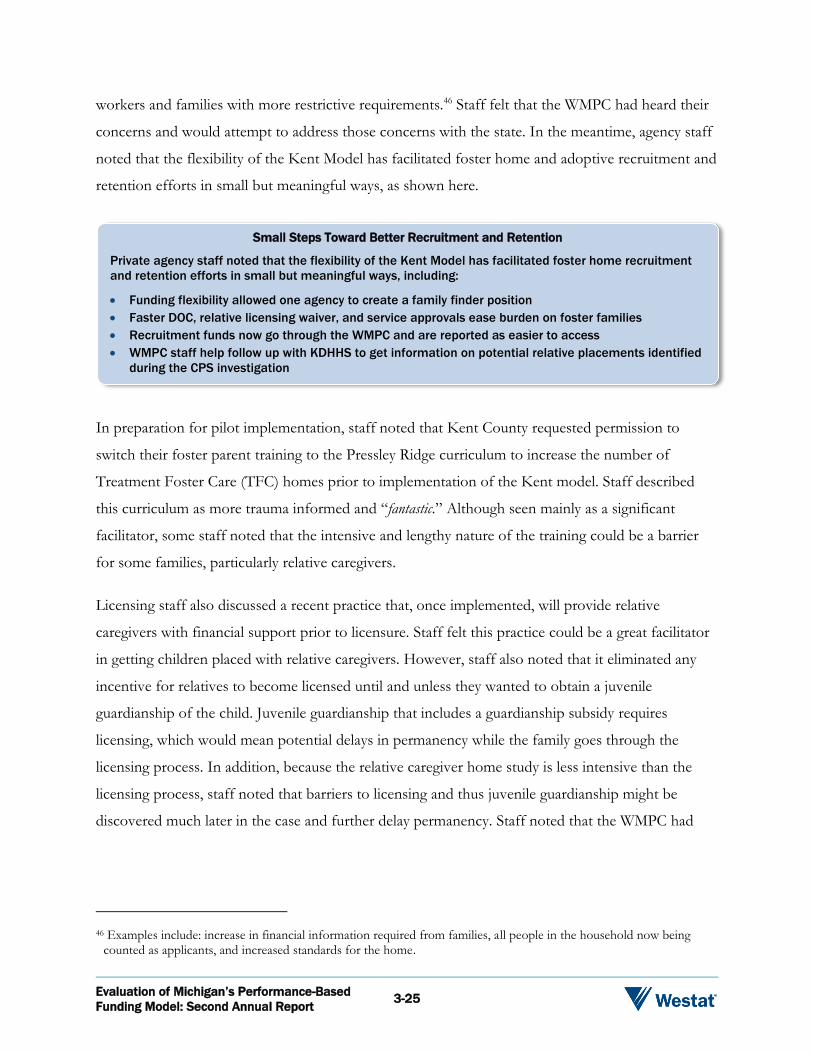
Evaluation of Michigan’s Performance-Based
Funding Model: Second Annual Report 3-25
workers and families with more restrictive requirements.46 Staff felt that the WMPC had heard their
concerns and would attempt to address those concerns with the state. In the meantime, agency staff
noted that the flexibility of the Kent Model has facilitated foster home and adoptive recruitment and
retention efforts in small but meaningful ways, as shown here.
In preparation for pilot implementation, staff noted that Kent County requested permission to
switch their foster parent training to the Pressley Ridge curriculum to increase the number of
Treatment Foster Care (TFC) homes prior to implementation of the Kent model. Staff described
this curriculum as more trauma informed and “fantastic.” Although seen mainly as a significant
facilitator, some staff noted that the intensive and lengthy nature of the training could be a barrier
for some families, particularly relative caregivers.
Licensing staff also discussed a recent practice that, once implemented, will provide relative
caregivers with financial support prior to licensure. Staff felt this practice could be a great facilitator
in getting children placed with relative caregivers. However, staff also noted that it eliminated any
incentive for relatives to become licensed until and unless they wanted to obtain a juvenile
guardianship of the child. Juvenile guardianship that includes a guardianship subsidy requires
licensing, which would mean potential delays in permanency while the family goes through the
licensing process. In addition, because the relative caregiver home study is less intensive than the
licensing process, staff noted that barriers to licensing and thus juvenile guardianship might be
discovered much later in the case and further delay permanency. Staff noted that the WMPC had
46 Examples include: increase in financial information required from families, all people in the household now being counted as applicants, and increased standards for the home.
Small Steps Toward Better Recruitment and Retention
Private agency staff noted that the flexibility of the Kent Model has facilitated foster home recruitment
and retention efforts in small but meaningful ways, including:
Funding flexibility allowed one agency to create a family finder position
Faster DOC, relative licensing waiver, and service approvals ease burden on foster families
Recruitment funds now go through the WMPC and are reported as easier to access
WMPC staff help follow up with KDHHS to get information on potential relative placements identified
during the CPS investigation

Evaluation of Michigan’s Performance-Based
Funding Model: Second Annual Report 3-26
begun addressing this issue, but expressed concern that it may have fallen off the radar due to delays
in implementing the new practice.
3.5.1.7 Enhanced Foster Care (EFC)
The highest profile innovation brought by the WMPC has been the EFC program for children with
more intensive medical or behavioral needs. The goals of the program are to stabilize placements for
high-need children and incentivize relatives and other foster
parents to accept children who might otherwise have ended
up in a residential facility. EFC offers foster parents a
higher daily rate and in-home support services based on the
child’s level of need.
Prior to EFC, Kent County had Treatment Foster Care
(TFC) homes, which are foster families specially trained to
care for higher-need children. Respondents explained that
while the training and supports around EFC are similar to TFC, EFC provides support services
around the child, wherever the child is placed. Essentially, the services come to the child. With TFC,
children are moved into the placement. While more expensive than TFC, theoretically, the additional
services will pay for themselves by reducing expensive placement changes and residential stays.
WMPC respondents explained that they chose EFC because previous treatment foster care efforts
did not meet the needs of the children and families receiving them. A WMPC staff person explained:
It feels like such an influential opportunity for us to be able to expand the use of some important services to not just the kids in care, but their bio families and to the foster families. It feels like a support for the whole team, for caseworkers who were previously dealing with those struggles on their own.
Enhanced Foster Care (EFC) Implementation
WMPC developed basic program standards for EFC, which each private agency used to develop its
own EFC program. The minimum standards include three levels of service intensity and a base
staffing structure (a behavioral specialist and clinical coordinator).
I just think that the enhanced foster
care allows for foster families to
really finally get paid for the service
they provide – needs to be a
statewide piece. Foster parents are
invaluable to healing for kids and
families. We have not paid them
adequately, or provided them
support, for decades. So that’s a
beautiful example of what it needs
to look like.
– Kent County DHHS manager

Evaluation of Michigan’s Performance-Based
Funding Model: Second Annual Report 3-27
Agencies experienced a steep learning curve as they developed new processes, ironed out unforeseen
issues, and built their EFC teams. Staff from most agencies noted that they are still figuring things
out as they go, particularly when they encounter areas where the policies are not clear. WMPC staff
expressed understanding of the difficulty of “inventing the plane as they’re flying,” but also noted that this
represents the culture of innovation that WMPC is trying to create in child welfare. At the time of
the evaluation site visit, staff estimated that EFC had been in full operation for around six months.
Some agency staff wished that WMPC had facilitated greater collaboration between the five agencies
in developing their EFC programs. WMPC staff acknowledged that they see the differences in each
of the five programs and are working to help programs learn from each other, specifically in a
monthly development group with all EFC staff from each of the five private agencies.
EFC Reception
In its first year, EFC has been highly lauded by both agency staff and stakeholders, who reported
hearing positive feedback from foster families. According to a private agency director:
Enhanced Foster Care has been a great tool. I would say that’s the most innovative we’ve had available to us. We’ve been able to do a lot of early authorizations for new kids in care when we know this might be a difficult child to place...that’s been a huge benefit that we can offer and it saves some of our placements.
In that time, staff and stakeholders had a number of observations about ways in which the program
has facilitated better child welfare practice:
Fast Approval. Getting approval for EFC is very fast and easy for agencies.
More Children Eligible. EFC has a lower threshold of need than TFC, allowing more children to get services who did not qualify for TFC (3 children were in TFC at the start of implementation; 76 children were being served in EFC at the time of the site visit).
Individualized. EFC is more responsive to the individual needs of children than TFC due to the inherent flexibility of the program model and funding.
Follows Child. EFC services can follow the child, even into independent living placements.
Flexibility for Agencies. Flexible funding has allowed agencies to add EFC positions, such as in-house therapists and family finders, and get additional training for EFC staff.
Evaluation of Michigan’s Performance-Based
Funding Model: Second Annual Report 3-28
Benefits to Families. In addition to the financial benefit and supportive services, foster families have expressed feeling more validated and appreciated.
Aside from implementation challenges, staff did not see many barriers to the EFC program.
However, some staff offered cautions for its future:
Appropriate Placements. EFC should not be used to “force” placements that are not in the best interests of the child, (i.e., offering the higher daily rate to foster families to maintain the placement if [a] the EFC services are not needed or appropriate, or [b] the placement does not otherwise meet the needs of the child).
Monitor EFC Participants. WMPC should monitor the demographics of the children in EFC to prevent any potential bias in children who are (or who are not) served by it.
3.5.1.8 Interagency Collaboration
Kent County has a long history of collaboration among community partners to monitor and
improve child welfare outcomes. For many years the Kent County Family and Children’s
Coordinating Council, which consists of representatives from Kent County DHHS, the five private
agencies, the court, the County Administrator, mental health and other public agencies, and multiple
philanthropic foundations, has met on a quarterly basis to discuss and plan for the progress of the
Kent County child welfare system.
As the newest partner in the community, the WMPC has stepped up as an active participant in all
areas of child welfare collaboration. Respondents from public and private partner agencies expressed
appreciation for the WMPC’s transparency, advocacy, and energy dedicated to collaboration.
Relationships with major community partners are detailed in the rest of this section.
Kent County DHHS
The collaborative relationship between Kent County DHHS and the five private child-serving
agencies in Kent County evolved during the shift toward privatization of foster care services, and is
now undergoing further evolution with the advent of the WMPC and the Kent Model. This
evolution has presented both facilitators and barriers. Respondents described the current
relationship as highly collaborative on the administrative level; however, on the line-staff level, some
tension exists as Kent County DHHS workers and supervisors work to figure out how they can
contribute to the vision of collaborative foster care services under the pilot.

Evaluation of Michigan’s Performance-Based
Funding Model: Second Annual Report 3-29
During the first year of implementation, staff from Kent County DHHS tried to support WMPC
and private agency staff with training and technical assistance on processing service authorizations
previously processed by POS monitors. Kent County DHHS convened “strike teams” to meet
regularly with WMPC and the private agencies to work on various aspects of case management.
Kent County DHHS staff reported that these teams stopped meeting about three months into
implementation, leaving Kent County DHHS with little involvement in the pilot. In particular,
former POS monitors (now rebranded as Performance-Based Funding Specialists or PBFS), who
now are responsible for reviewing funding streams for WMPC services, expressed a sense of
frustration at their perceived “clerical” responsibilities to review funding streams for WMPC
services. They also expressed confusion about how to “reinvent themselves as social workers” given
their changing role in the child welfare system.
Overall, both Kent County DHHS and private agency staff expressed the need for better
communication and clarity of roles between public and private agencies. In particular, staff wanted
consistent processes for addressing and following up on day-to-day casework issues. As one private
agency staff person expressed:
Now that we’re so much more removed from DHHS, our CPS workers, we’re just not having as much communication about the cases… I don’t know if I’d call it strain, but there’s not as much collaboration when cases are coming in that there used to be.
Kent County Family Court
The Kent County Family Court is the ultimate decisionmaker with regard to outcomes for child
welfare cases in Kent County. The court orders children into foster care and holds quarterly hearings
to review progress on their cases. The review hearings are also the primary point of interaction
between the court and the private agencies, as foster care workers must testify at every hearing
regarding the progress of the case. Judges make the final decision regarding reunification or
termination of parental rights, meaning that permanency outcomes are dependent on the court.
Historically, the court has taken an active interest in efforts to improve the child welfare system.
Respondents reported that, despite some misgivings prior to implementation, most Kent County
judges are supportive and engaged with regard to the Kent Model. This judicial investment may be a
result of the efforts of judges who have actively championed the new model, as well as the WMPC,
whose members meet monthly with court representatives to discuss implementation, disseminate

Evaluation of Michigan’s Performance-Based
Funding Model: Second Annual Report 3-30
information to judges, and address issues. “I think the WMPC’s been really intentional about partnering with
the court,” noted a private agency staff person.
From the private agency perspective, two themes emerged regarding the current relationship with
the court:
1. Judges’ Discretion. According to respondents, each judge has an individualized process in his or her courtroom and an individual perspective on child welfare cases. For example, private agency staff mentioned that some judges place a strong priority on family reunification and delay termination of parental rights as long as possible. This may be a factor to look at when interpreting outcomes.
2. Court Testimony. All private agency staff discussed that foster care workers are often not treated well by judges and attorneys when testifying in court, particularly new workers who do not have experience giving testimony. Staff noted that this poor treatment and fear of testifying was an exacerbating factor in worker turnover. Currently, the court is launching a training to prepare new workers for court testimony and procedures.
Court respondents discussed the role of accountability that the court holds, and judges monitor the
progress of the pilot through the quarterly case review hearings. In the first year, judges felt they
were beginning to see faster service referrals. However, court staff emphasized: “We’re all waiting for
the results…feeling, really, that we’re ones who have kind of laid everything on the line.”
Mental Health System
Network 180 is the community behavioral health authority for Kent County, overseen by MDHHS’
Community Mental Health division. It contracts with the individual community mental health
providers and manages service approvals for clients, including all children with mild to intensive
needs who require care who require behavioral health services.
Like the other community partners in Kent County, Network 180 has a history of strong
collaboration with the child welfare system. Network 180 received a System of Care grant,47 which is
credited with supporting increased levels of collaboration in recent years:
47A System of Care is a spectrum of effective, community-based services and supports for children and youth with or at risk for mental health or other challenges, and their families, which is organized into a coordinated network, builds meaningful partnerships with families and youth, and addresses their cultural and linguistic needs to help them function better at home, in school, in the community, and throughout life (http://cfpsystemofcare.org/parents/systems-of-care).

Evaluation of Michigan’s Performance-Based
Funding Model: Second Annual Report 3-31
I think one of the facilitators is having that shared charge through systems coming from federal, state, on down. I think dollars that support that collaboration, which the System of Care grant kind of offered us, was wonderful. I think the more time we spend together, the more we realize the same outcomes that we’re going towards and that we each just bring expertise.
When community partners are able to spend more time together, the respondent explained, they
found they were able to get work done considerably faster than before.
One respondent noted that the relationships between Network 180, Kent County DHHS, and the
private agencies shifted when the WMPC entered the picture, causing public and private system
partners to work even closer together: “I kind of think of WMPC in many ways as an extension of my team
in my work. I am texting them, emailing them, and meeting with them probably more than I meet with mental
health.” Kent County DHHS, WMPC, and Network 180 meet frequently to work on issues such as
data sharing, case review, and service delivery. For example, previously, Network 180 had one
clinical liaison to assist with all child welfare cases in both Kent County DHHS and the five private
agencies. In the first year of implementation, WMPC and Network 180 developed a second liaison
position to handle WMPC cases, with shared supervision and funding between the two
organizations. Agency staff also mentioned that WMPC had been helpful in facilitating the process
for obtaining trauma assessments, which staff described as “somewhat cumbersome” and confusing.
Although the collaboration at the leadership level seems to be a facilitator, at the worker level,
respondents reported that bureaucracy remains a barrier to effective collaboration around service
delivery. Agency workers often have difficulty contacting people, or even knowing whom to contact
at Network 180. In addition, Network 180 has undergone internal administrative and budgetary
challenges in the past year; this is likely to be a contributing factor to current bureaucratic barriers in
the mental health system. Private agency staff explained that “a lot of programming got cut,” in addition
to tightened restrictions that left some foster children ineligible for services they had previously
received.
3.5.1.9 Systemic Factors
As described in the previous section, child welfare agency staff rely on interagency partnerships to
address the needs of the families they serve. Intra-agency characteristics and processes also have
Evaluation of Michigan’s Performance-Based
Funding Model: Second Annual Report 3-32
implications for child welfare practice and service provision. Interview and focus group discussions
of these characteristics and processes are summarized in this section.
Staffing
Private Agencies. During focus group discussions, private agency directors acknowledged that the
past year has been a year of transition characterized by many staffing and structural changes, some
related to the Kent Model and some purely internal to the agency. Although these transitions
presented challenges, respondents expressed their belief that the changes would become significant
facilitators toward better child welfare practice in their agencies. Some changes discussed were
specific to the pilot and related to the hiring of staff, which included:
Hiring for the Model. Respondents from one agency discussed hiring staff to implement services related to the Kent Model, including enhanced foster care staff as well as additional caseworkers and program managers.
New Staffing Models. Respondents from one agency described recent implementation of a staffing model suggested by WMPC, in which staff are divided into two “pods,” each with a team of two supervisors, four caseworkers, two case aids, and a buffer worker. Supervisors collaborate within their “pod” to leverage resources, manage staff, and maintain coverage of cases. Case aids support case management staff by providing transportation and helping with parenting time.
“Buffer” Workers. Respondents from the agency with new staffing models also reported that the agency staff used the financial flexibility of the case rate to “strategically over-hire” and create the buffer worker position. Buffer workers receive CWTI while assisting caseworkers and gaining hands-on experience; when a caseworker leaves the agency, the buffer worker is already on board and prepared to lend support or move into case management. Similarly, respondents from another agency indicated that because the flexibility of the Kent Model affords proactive hiring, the agency plans to hire an additional contingent worker to participate in training and to prepare to fill a position when needed.
Kent County DHHS. To forestall concerns over job loss, public agency leadership assured their
staff that although the position of POS monitor would become obsolete with the implementation of
the pilot, no individual employees would lose their jobs. A major intent was to keep everybody on
board throughout the transition, and agency supervisors noted that the message of job retention was
clear. In the first year since implementation, the POS monitor position has transitioned to a
Performance-Based Funding Specialist (PBFS) position. The PBFS is responsible for verifying the
accuracy of the fund source on all foster care expenditures in order to draw from the correct

Evaluation of Michigan’s Performance-Based
Funding Model: Second Annual Report 3-33
funding streams. Kent County DHHS workers and supervisors described an overall sense of
dissatisfaction among the PBFS workers due to:
Lack of job-specific training and inconsistent messages from supervisors and managers,
Lack of opportunity to use social work skills in what is perceived to be an entirely clerical role, and
Feeling cut off from children and families.
In terms of general Kent County DHHS hiring, one respondent alluded to efforts to increase staff
diversity by recruiting and hiring individuals from diverse racial and ethnic groups as well as those
with proficiency in various languages. The respondent pointed out that families might be more apt
to engage with staff who look like them or speak their language. Recruitment efforts of public
agencies have been successful to some extent, but the respondent noted that a higher starting salary
would help attract more prospective employees.
Staff Turnover
Staff turnover is known as such a major barrier to child welfare practice that the state devoted a
specific guiding principle to reduce it—fostering agency staff success and retention through regular
professional development and mentorship opportunities. Agency directors, supervisors, and workers
from both public and private agencies all agreed that staff turnover is a major challenge that affects
foster care in particular, but adoption and licensing as well. When staff depart, remaining staff must
pick up the cases left behind while continuing to manage their own caseloads. During focus group
discussions, private agency directors indicated that staff turnover has increased in the past year. A
director noted that in the past, foster care workers remained with the agency for two to six years, but
recently several have left within their first year. Another director noted that it has been difficult to
retain caseworkers for even four to six months; the one-year mark is a major milestone. Agency staff
identified numerous factors that contribute to staff turnover, which are outlined in Table 3-13.
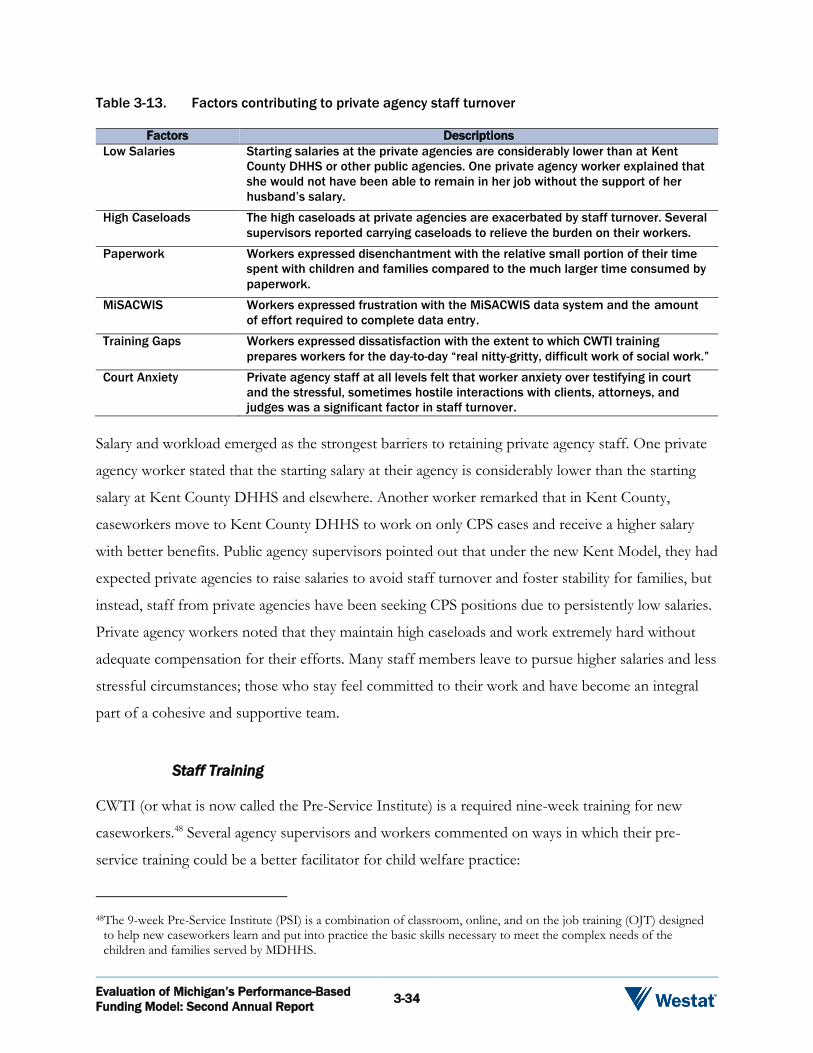
Evaluation of Michigan’s Performance-Based
Funding Model: Second Annual Report 3-34
Table 3-13. Factors contributing to private agency staff turnover
Factors Descriptions
Low Salaries Starting salaries at the private agencies are considerably lower than at Kent
County DHHS or other public agencies. One private agency worker explained that
she would not have been able to remain in her job without the support of her
husband’s salary.
High Caseloads The high caseloads at private agencies are exacerbated by staff turnover. Several
supervisors reported carrying caseloads to relieve the burden on their workers.
Paperwork Workers expressed disenchantment with the relative small portion of their time
spent with children and families compared to the much larger time consumed by
paperwork.
MiSACWIS Workers expressed frustration with the MiSACWIS data system and the amount
of effort required to complete data entry.
Training Gaps Workers expressed dissatisfaction with the extent to which CWTI training
prepares workers for the day-to-day “real nitty-gritty, difficult work of social work.”
Court Anxiety Private agency staff at all levels felt that worker anxiety over testifying in court
and the stressful, sometimes hostile interactions with clients, attorneys, and
judges was a significant factor in staff turnover.
Salary and workload emerged as the strongest barriers to retaining private agency staff. One private
agency worker stated that the starting salary at their agency is considerably lower than the starting
salary at Kent County DHHS and elsewhere. Another worker remarked that in Kent County,
caseworkers move to Kent County DHHS to work on only CPS cases and receive a higher salary
with better benefits. Public agency supervisors pointed out that under the new Kent Model, they had
expected private agencies to raise salaries to avoid staff turnover and foster stability for families, but
instead, staff from private agencies have been seeking CPS positions due to persistently low salaries.
Private agency workers noted that they maintain high caseloads and work extremely hard without
adequate compensation for their efforts. Many staff members leave to pursue higher salaries and less
stressful circumstances; those who stay feel committed to their work and have become an integral
part of a cohesive and supportive team.
Staff Training
CWTI (or what is now called the Pre-Service Institute) is a required nine-week training for new
caseworkers.48 Several agency supervisors and workers commented on ways in which their pre-
service training could be a better facilitator for child welfare practice:
48The 9-week Pre-Service Institute (PSI) is a combination of classroom, online, and on the job training (OJT) designed to help new caseworkers learn and put into practice the basic skills necessary to meet the complex needs of the children and families served by MDHHS.

Evaluation of Michigan’s Performance-Based
Funding Model: Second Annual Report 3-35
Day-to-Day Responsibilities. As mentioned above, some staff felt that training did not adequately prepare them for the day-to-day responsibilities (e.g., paperwork) of casework.
Kent County Specific. The standardized statewide training does not explain the procedures and processes specific to Kent County.
MiSACWIS. Training on MiSACWIS is too general, contributing to frustration with using the system. Staff reported learning the ins and outs of the system, including workarounds, from coworkers on the job.
Michigan requires 32 hours of training annually, which can be mandatory training and/or optional
training that caseworkers and supervisors choose on their own. Agency staff referred to various
training requirements related to such topics as the Health Insurance Portability and Accountability
Act (HIPAA), sexual harassment, trauma, mandated-reporting, and security for MiSACWIS.
Respondents also referred to other training offered on topics including human trafficking, workplace
safety, media, legal principles, and court procedures. An agency supervisor noted the importance of
facilitating training opportunities by inviting experts into the agency to train staff and sending staff
out to resources in the community. One private agency director described secondary trauma training
for workers to identify and address the physical and emotional exhaustion and burnout they
experience. Similarly, in a separate discussion, a public agency respondent referred to implementing
cross training opportunities that foster team cohesiveness and center on topics like secondary
trauma, mental health, first aid, worker safety, implicit bias, supervision, and the sanctuary model.
Public agency supervisors also described a couple of training activities underway. A supervisor
referred positively to a pilot training where training “units”—supervisors who focus specifically on
new workers—are organized to train, support, and mentor new workers for six months. When new
workers come on board, they are each assigned a mentor who helps ensure their successful
transition during the six-month period. Another supervisor explained that they also have been
receiving more training on “numbers and spreadsheets.” When staff in their division receive quarterly
reports, a specialist meets with them to review the spreadsheets and help them interpret the data.
The specialist also advises staff on what they should be looking for and provides 80 cases to
examine in order to help workers better understand the process. Other public agency respondents
talked about an overemphasis on data and metrics, a major shift in the culture of some parts of the
agency.
Evaluation of Michigan’s Performance-Based
Funding Model: Second Annual Report 3-36
Staff Training Needed
Private agency and Kent County DHHS staff referred to various training needs, and suggested that
WMPC conduct some of the trainings to ensure consistency across agencies:
MiSACWIS. An agency supervisor pointed out that MiSACWIS data entry is an essential job component, yet agency staff never received appropriate training on use of the entire system. Similarly, another supervisor noted that MiSACWIS training should encompass specific aspects of the system that private agency staff will use during daily operations.
Court Process. A supervisor suggested that it would be helpful to receive formal training on the court process in Kent County; respondents agreed that the experience of providing testimony in court is often intimidating and overwhelming for new staff. Court staff reported that a court orientation training for new workers is being developed.
Licensing. A supervisor pointed out that licensing staff would benefit from the availability of additional licensing training sessions throughout the year because registration fills up quickly.
Position-Specific Training. A public agency worker described moving into the position of MiTEAM specialist without guidance or clear documentation regarding key responsibilities associated with the position. Other workers pointed to similar experiences in which they have been assigned to a position but have not received any training or clearly defined duties. They expressed concerns about their lack of training and the potential for errors on important tasks.
Kent Model. Public agency workers agreed that they need training and guidance relevant to their new roles under the Kent Model. Respondents indicated that they need more clearly defined duties and additional training on the Kent Model. A worker referred to participation in a recent case transfer to foster care training as “irrelevant” and “completely pointless” because it covered content related to well-known procedures such as forensic interviewing and home visitation rather than new policies and procedures specific to the Kent Model.
3.5.1.10 Information Systems
MiSACWIS
The MiSACWIS data management system was implemented in spring of 2014. The system was
meant to facilitate child welfare practice by providing accurate and timely case management
information to each county’s DHHS workers and partnering agencies. Public agency staff, private
agency staff, and court staff all expressed a desire for the information-sharing and data analysis
Evaluation of Michigan’s Performance-Based
Funding Model: Second Annual Report 3-37
potential MiSACWIS was meant to bring to Michigan child welfare practice. However, according to
respondents, numerous operational issues over the five years since MiSACWIS launched have made
the system as much a barrier as a facilitator for practitioners and courts.
Overall, on the positive side, several respondents reported that MiSACWIS has improved over time
and made some aspects of their work easier. Some mentioned that there are more documents
uploaded in the system, and that it is starting to resemble “an electronic record.” Respondents felt
there was a greater emphasis on document completeness within MiSACWIS in Kent County than
elsewhere in the state.
However many respondents also reported frustration that MiSACWIS still has many operational
issues that prevent the system from facilitating casework the way it was intended. These issues
include:
Difficulties with entering and saving data efficiently, and accessing case information;
Inability to get meaningful data out of the system;
Lack of user-friendly and intuitive navigation processes; and
Time needed for data entry, often due to the need for multiple “clicks” to move throughout the system or the need to check too many boxes, which can also result in data entry errors.
As reported in the first annual report, private agency workers reported that they are still unable to
see public agency investigative reports or early case histories. WMPC Performance and Quality
Improvement staff shared frustration that they do not have more direct access to the actual “source”
data, are not able to view all areas within MiSACWIS, and have limitations with the specificity
desired in reports.
Increased Accountability. Respondents at multiple levels described an increased focus on
accountability and the push from Kent County DHHS and the WMPC to document performance in
MiSACWIS; as one stated “I think the data entry is the same. I think the accountability for data entry has
increased.” A few mentioned increased pressure not only on the caseworkers but on MDHHS and the
federal consent decree mandating fixes to the system. One respondent stated, “Yeah, probably just more
accountability. You can feel the pressure. There’s more pressure, for sure, which is, I think, frustrating as a worker
sometimes.”
Evaluation of Michigan’s Performance-Based
Funding Model: Second Annual Report 3-38
As mentioned above, entering data into MiSACWIS was described as time-consuming and
burdensome. Many respondents cited the time needed for data entry as a barrier. Several workers
reported they spend over 65 percent of their time on paperwork and data entry. Others reported
they have “stacks” of service data waiting to be entered. A few commented on the focus of
caseworker jobs shifting too far toward data entry and contributing to staff turnover. As one stated:
And it’s become a lot more of a data entry job than it is a social worker job. And I feel like that has made it extremely more difficult to retain workers because they feel like their job is to try and figure out this convoluted computer system and what exact box they need to check to prove that they’ve been out in the field doing the social work to try and get the families back together.
Another cited:
...foster care has reports due and that’s data-driven, ...you have to get those reports in, but then they go to a foster home and they only spend five minutes because they know they have to get back. Then I hear from the foster parent going, ‘That worker doesn’t spend any time here. I don’t know how they can help me.’ So the push-pull that I think foster care feels has got to be tremendous.
WMPC Service Data Entry. Private agency and WMPC respondents reported challenges
pertaining to entering service data in MiSACWIS. These focused on entering unpaid services and
accurately routing WMPC “consortium” services and Kent County DHHS-paid case services into
the system. WMPC staff shared that initially they did not think through all of the issues related to
MiSACWIS data requirements for case services, specifically the detailed nature of what had to be
entered, determining the routing for funding determination (WMPC or Kent County DHHS ), and
assigning the costs for WMPC services. One respondent described it as “a whirlwind” to figure out
the best business processes and identify costs with the shift to WMPC for most service payments.
Private agency staff at all levels shared their frustrations about the lack of understanding about the
processes and need to train the workforce correctly. The system requires not only a service
authorization, but a manual payment also has to be created for each service referral. Adding to the
confusion, WMPC-paid services are entered differently than Kent County DHHS-funded services.
Workers and supervisors were not always clear initially about identifying the funding source for
every service. Additionally, there are some services that are reviewed by WMPC first and then
authorized by Kent County DHHS (e.g., trauma assessments) while other services (e.g., YIT) remain

Evaluation of Michigan’s Performance-Based
Funding Model: Second Annual Report 3-39
with Kent County DHHS, although WMPC still has some role in the financial transaction.49 Private
agency workers with cases in counties surrounding Kent reported having to work even harder to
figure out and stick to the new system—they have a partial caseload with one way to authorize
services and a WMPC caseload done another way.
Issues with unpaid services focused primarily on the burden to keep up with the data entry into
MiSACWIS. The need to enter all services was cited as critical, as it feeds court reports; however,
several workers reported they have little motivation to keep up with this. One respondent shared,
“We’ll get to that after we verify the well-being of our kids everywhere. We do the reports after we go to court. We just
don’t have enough time.”
The WMPC addressed these challenges in several ways, which were credited with improving data
timeliness and data quality. WMPC staff, along with help from MDHHS, developed a
comprehensive spreadsheet for staff to use as a reference. The spreadsheets list almost all services
and providers, and identifies if the service was paid or unpaid. The spreadsheet was mentioned as
being especially helpful around the loss of institutional knowledge that occurs with staff turnover.
The second change initiated was hiring a data coordinator at the WMPC to consolidate data entry
and remove some of the burden from caseworkers and supervisors. The five private agencies and
the WMPC shared the cost to fund the new position. The new data coordinator is now responsible
for creating the manual payment in MiSACWIS, a step that many reported as too time consuming
for workers to complete. WMPC respondents reported they are now able to provide some
administrative support around MiSACWIS data entry, which allows caseworkers more time to focus
on their primary job function of helping children and families. In the words of one respondent, this
change “has been a huge lift off the workforce.”
One recommendation was suggested to address the aforementioned challenges. Court
representatives mentioned an easy-to-read case addendum that was piloted over two years ago. The
addendum was essentially a summary written up based on the caseworker’s assessment. This was a
49Please note that following the 2018 site visit, a portion of YIT funds was allocated to the WMPC to support service delivery for youth involved with the private child-placing agencies.
Evaluation of Michigan’s Performance-Based
Funding Model: Second Annual Report 3-40
supplement to the MiSACWIS reports, and was described as working “beautifully” and “everyone
liked it.”
MindShare
MindShare is the data management and analytic system adopted by the WMPC. It uses predictive
analytics for child welfare cases with the goal of being an “early warning” system to flag cases that
need intervention. Ideally, these analytics would become a significant facilitator for the guiding
principle calling for a focus on data and quality improvement. Several respondents hailed its ability
to quickly identify missing data and identify trends. MindShare’s analyses are based on the data
imported into the system, and the quality of the analysis depends on the quality and quantity of
available data in the system.
At the time of the site visit (just over one year post-implementation), MindShare was not yet fully up
and running due to these major challenges:
Identifying Data Elements. One of the major challenges in the first year of implementation was revisiting the scope of data elements needed and properly identifying each and every data element. These activities were necessary to execute an updated data sharing agreement with MDHHS in order to share MiSACWIS data with MindShare. Understanding the level of detail needed for each data element and identifying exactly where data items were attainable was described as a significant learning curve for WMPC staff.
Developing Data Sharing Agreement. WMPC staff described not fully understanding the formality of developing a data sharing agreement. They reported that they were initially advised to develop a somewhat “looser” data sharing request and work within an assumption of “the spirit” of data sharing; however, they ultimately realized that a data sharing agreement with MDHHS is a legal document that requires absolute specificity of each and every data element.
Performance Indicators and Dashboards. Developing the performance indicators and accompanying data dashboards within MindShare was another challenge. WMPC respondents reported spending substantial time identifying the right performance indicators, business process rules, and classifications to produce desired performance dashboards. The initial dashboard consisted of an Active Children’s List that contained a dataset (e.g., demographics, current placement) of all of the children under the care of the WMPC. Respondents shared that even this was more accessible data then they had in the past, and one respondent mentioned having the ability to review racial disproportionality data in the past year.
Evaluation of Michigan’s Performance-Based
Funding Model: Second Annual Report 3-41
Data Transfer. One respondent reported a challenge with the structure of the data transfer whereby WMPC is not able to see all the levels within the MiSACWIS system, described as an inability to directly view their “source data.” This was reported as potentially limiting the WMPC’s ability to effectively and efficiently interpret certain data inconsistencies or nuances in the data.
To assist WMPC staff, a representative from the Department of Management and Budget developed
a data dictionary/crosswalk of data elements in MiSACWIS and MindShare, and identified the
system from which each data element would be extracted. The WMPC then renegotiated a data
sharing agreement with MDHHS through a process that took several months. MDHHS respondents
reported that the new data request was included in prioritization with the other MDHHS data
priorities, including updates and developments to MiSACWIS. At one point, concerns about this
were shared with a State Senator and this was credited for moving the process to completion.
The delay in getting MindShare up and running has created some concerns with stakeholders about
whether the Kent Model would be able to serve families the way the county had planned without the
full use of data and predictive analytics the WMPC originally envisioned:
It’s absolutely a key piece of this model. And so if we do not have the right data and we don’t have accurate data, we can’t problem solve on a timely basis when issues come up. I just don’t think that anything is going to be all that different than it was before. Will there at least be a significant piece of this model missing that would have a negative impact on the performance of the system overall.
3.5.1.11 Performance Measurement and Continuous Quality Improvement
Continuous Quality Improvement (CQI) efforts were well underway in Kent County child welfare
before the Kent Model was implemented. In the last annual report, respondents reported being
engaged in the Quality Service Review (conducted in September 2016), and quarterly management
reviews with the public agency, courts, and representatives of other private agencies to review data
on removal rates and services. Several private agencies had an internal CQI process. The Quality
Service Review (QSR) report describes data collected between 2014 and 2016 (prior to the launch of
the pilot). Given that the data collection on service quality and agency processes (Kent Model
evaluation) are incongruent, QSR results are not described in this report. The primary focus of this
section will be on the WMPC performance measurement activities and results of fidelity tool analysis
conducted, which are presented in the following section.
Evaluation of Michigan’s Performance-Based
Funding Model: Second Annual Report 3-42
The WMPC Performance and Quality Improvement division is responsible for the development and
implementation of strategies, plans, and tools for monitoring, and CQI of WMPC and its
subcontractors. Staff in this division provide oversight of the private child-placing agency providers
to ensure they are fulfilling the terms of their performance-based contract. The WMPC Performance
and Quality Improvement handbook states:
WMPC’s Continuous Quality Improvement (CQI) Plan is designed to ensure that consistent, high quality services are delivered to the children and families assigned to its care. The goals of WMPC CQI Plan are to improve the permanency, safety, and well-being of children in out-of-home care in Kent County toward achievement of all Implementation, Sustainability and Exit Plan (ISEP) and Child and Family Service Review (CSFR) outcomes; to reduce the possibility of adverse occurrences; and to maintain a system for continuous quality improvement.
Soon after its formation, the WMPC hired a Performance and Quality Improvement director who
spent the first year of implementation: (1) detailing job descriptions and hiring staff, (2) developing a
CQI process to conduct audits and ongoing case reviews, and (3) leading the development of
performance indicators for the MindShare data analytic system dashboard with the ultimate goal of
providing monitoring and oversight in real time. The WMPC sought to develop a process that added
value but not additional work for caseworkers. The MDHHS Division of Child Welfare Licensing
(DCWL) already conducts annual audits on multiple compliance areas (policy, licensing, and
contract compliance) and the WMPC did not want to duplicate these efforts. The WMPC CQI
process was described as assessing the implementation of DCWL corrective action plans, with more
of a “quality audit” focus instead of a compliance focus. There are also data-driven quarterly case
review meetings with private agency staff. Protocols are detailed in the WMPC Performance and
Quality Improvement handbook.
Private agency leadership agreed that the WMPC CQI approach is not redundant of internal agency
efforts nor of DCWL audits, but rather addresses quality outcomes and presents performance data
across the five private agencies, something that did not happen prior to the WMPC. One respondent
described it as “a very different approach,” and others described the processes as supportive, strength-
based, and focused on best practices that are replicable. Shared data was repeatedly referred to as
meaningful and accessible. Many respondents were excited about the timeliness of seeing data from
MindShare as well as the user-friendly presentation of it, which was contrasted with historical
reports available from MiSACWIS. In the words of one respondent:
Evaluation of Michigan’s Performance-Based
Funding Model: Second Annual Report 3-43
I think good data monitoring is a really good support for us because we can’t make changes if we don’t know them [sic] at the time there’s a problem happening. If we find out two months down the line, well, that worker’s already quit and it’s done, whatever it might be.
Performance data are reviewed regularly with various stakeholders in Kent County and MDHHS,
including presentations at Child Welfare Partnership Council (CWPC) meetings.
At the time of the site visit, the Performance and Quality Improvement division at WMPC was
organized with a director and three coordinators, each specializing primarily, but not exclusively, on
overseeing one of the main processes of the division. These included: (1) MindShare and data,
(2) annual audits, and (3) the CQI process and quarterly meetings with each of the private agencies
to review performance measures and outcomes as well as strategize on improvements. A brief
summary of the quarterly case review process and the audit is provided below (note that issues
associated with MindShare are primarily discussed in the prior section).
Quarterly Case Reviews
Performance and Quality Improvement coordinators compile monthly service reports that are
shared with the WMPC Care Coordination team. These data help to identify trends in service
utilization such as the number of referrals to assessments and/or supportive services made by
private agency workers. The reports help WMPC staff assess if private agency workers need help
identifying service referrals, understanding barriers to timely appointments, identifying why specific
service referrals may be used more or less by a particular agency, and monitoring wait lists for
services. The data reports are shared with private agency staff on a quarterly basis and provide an
opportunity for Performance and Quality Improvement workers to hear directly, from the case work
perspective, what issues they face in their practice.
One challenge described was inconsistent and fluctuating data on key performance indicators. This
was reported to be a result of data entry errors in MiSACWIS and missing check boxes that result in
nullifying a contact; staff turnover was also identified as contributing to data entry errors. Ultimately
the WMPC envisions connecting service utilization to outcomes such as permanency and
reunification in real time within MindShare’s Provider Services and Activity Management (PSAM)
program.
Evaluation of Michigan’s Performance-Based
Funding Model: Second Annual Report 3-44
Audits
WMPC audits are conducted annually. They consist of a contract review and a sample case review
from each partner agency, including interviews with a sample of foster parents and biological
parents. Interviews are conducted with key leadership staff and a sample of supervisors from both
regular and enhanced foster care, to include newly hired (in the position less than six months) and
more experienced (in the position for 12 months or more) supervisors. Critical incidents are also
reviewed, as well as the policies and procedures followed. As stated earlier in this section, the most
recent DCWL assessment and corrective action plans and progress toward meeting goals are
included in the audit, as well as agency CQI plans that are compared to the Council of Accreditation
(COA) standards. The audit includes discussion of how the WMPC can support improvement and
changes to areas with identified limitations and barriers.
Performance Measurement and CQI Challenges
WMPC respondents described challenges primarily centered on navigating their role in a newly
designed program, the pace of growth in the first year of implementation, and staffing challenges.
Specific challenges discussed included:
Staff Turnover. Turnover has occurred in the Performance and Quality Improvement Director position as well as some of the Performance and Quality Improvement coordinators.
Staff Skills. Staff skills may need to be enhanced. The WMPC system-change focus requires a capacity-building evaluative “lens” as well as evaluation skills, and these are not necessarily the skills in which data staff are routinely trained. An additional issue mentioned is that the pay scale for Performance and Quality Improvement staff may not be high enough for the level of skill required for the job.
Support for Performance and Quality Improvement. The need for more Performance and Quality Improvement support, including logistical and administrative support for the Performance and Quality Improvement coordinators, especially in light of the staff turnovers, has not been a priority for WMPC.
Child Welfare Systemic Knowledge. Performance and Quality Improvement staff were predominantly new to child welfare and foster care, and some respondents described feeling initially overwhelmed at their lack of understanding of the intricacies of the system. Respondents also shared that having a specialized focus in one area of CQI, they sometimes miss the bigger picture and context of where their work fits into the life of a caseworker or agency leadership.

Evaluation of Michigan’s Performance-Based
Funding Model: Second Annual Report 3-45
Communication. There was some mention of less communication between leadership and workers, and a feeling that not only information, but the context surrounding data requests are not trickling down to the Performance and Quality Improvement workers.
Another challenge reported previously refers to “building the plane while you are learning to fly,” an
adage commonly found in startup efforts; that is, the need to create the CQI processes while also
building the infrastructure can be daunting. Respondents shared feeling pressured, anxious, and a
sense that every request is “urgent” while at the same time they described a lack of sufficient
recognition of their needs. Some respondents described that the same fast paced and crisis-oriented
work environment that exists within the private agencies’ day-to-day work has too often bled over to
the WMPC. In the words of one respondent:
...we are all in this crisis space and that where that [sic] moving very quick and not having time to check in, and be like, is this a reasonable ask or not. That piece isn’t always there and that’s where I’m hopeful as we move forward that there is more time to, at least, can we pause a second. That’s our little PQI [Performance and Quality Improvement] team is sort of—that’s kind of how we’ve operated because especially with data we need it to be accurate. If we’re sending something out there, it has to be right. And in order for us to do that, it’s going to take a little time to validate.
The importance of building relationships between the WMPC and private agency staff is critical.
Although agency leadership were positive about CQI efforts, WMPC respondents shared that
establishing relationships with private agency staff, especially at the worker level, was sometimes a
challenge. The vision of the Kent Model is one of a true partnership with collective ownership of
performance measurement and collaborative search for ideas and solutions. One respondent offered
an explanation about the challenges of bringing in a data-driven performance measurement
approach:
...data is uncomfortable, and seeing performance numbers is uncomfortable. And it’s about having authentic and transparent conversations. And so I know that engaging with our agencies and our partners, performance in itself, if it’s not meeting benchmarks, can feel very punitive. And trying to change the narrative in the discussion to that—When this data is presented to you, we’re hoping to create inroads about solutions to improve performance. We’re not creating a dialogue that would make someone feel that their performance reflects anything about the partnership and their role and their responsibility.
Respondents shared the importance of agency feedback on the CQI activities and the need to
“create a space” for honest dialogue so that strategies to improve can be developed. Respondents
hoped that in the future, more partnering with the WMPC care coordinators would be a positive
direction and could also help them understand more about the foster care system.

Evaluation of Michigan’s Performance-Based
Funding Model: Second Annual Report 3-46
Performance and Quality Improvement Division Changes Proposed
The Performance and Quality Improvement division was in a state of transition at the time of site
visit interviews. One coordinator was leaving and a new Performance and Quality Improvement
Director had just started. To address some of the challenges, proposed changes were in active
discussion, including changing the approach from staff assigned to one of three specialized areas, to
assigning one Performance and Quality Improvement coordinator to an agency, similarly to how the
care coordination teams are structured. It was thought that this would help build relationships,
provide more context for all of the CQI activities, and provide the opportunity for more of an in-
depth understanding of the agency’s data and barriers. Plans were also in development for more
frequent data analyses and identification of issues that would be put together in a “data pack” to
include key performance indicators, fidelity data, and more. This type of analysis was described as
providing more of a “deep dive” into the data.
Overarching Research Question 2: Do Child
Placing Agencies Adhere to the MiTEAM Practice
Model When Providing Child Welfare Services?
To answer this research question, in this section, the evaluation team presents feedback from site
visit interviews and focus groups on the MiTEAM practice model and fidelity assessment and
review, followed by a presentation of findings from the analysis of MiTEAM fidelity data.
3.5.1.12 MiTEAM Practice Model
As mentioned earlier in this report, Kent County was an early adopter and champion of the
MiTEAM practice model, and the MiTEAM principles remain the foundation of child welfare
practice in Kent County. The tenets of the MiTEAM practice model underscore the importance of
serving families in a manner that promotes inclusion, mutual respect, and recognition of each
family’s unique strengths and needs. Respondents at all levels described MiTEAM as fully integrated
into casework practice.

Evaluation of Michigan’s Performance-Based
Funding Model: Second Annual Report 3-47
Respondents from public and private agencies both mentioned that when MiTEAM was first rolled
out there was a lot of momentum; it was an exciting and collaborative time, but more recently the
initial unity between public and private agencies has faltered. In the words of one supervisor,
I really was on board with MiTEAM philosophy and concepts right from the get-go. This was going to be our opportunity to unify the five agencies in DHS into one child welfare workforce. This was going to be the magic. We were going to get trainings together. We were going to be able to talk with people from other programs and agencies about what they do. And we were going to learn from each other and grow together. But although all the leaders stood up at the front and made this pledge that this is what we want, it doesn’t feel like it has taken root. And in fact, it’s all kind of backslid into silos in my opinion.
Some of the changes in momentum were attributed to decentralizing the MiTEAM training.
Agencies now train their own staff on the model. Workers and supervisors reported that the training
seems redundant because the MiTEAM practice model is already built into their casework practice.
Workers referred to MiTEAM as “a basic model of social work” and “base expectations of your job.”
Kent County practices what agency leadership call “Enhanced MiTEAM.” Public and private agency
respondents reported that the term “enhanced” was a way to “bring more focus” to enhancing
practices such as engagement, teaming, assessment, and mentoring. In the words of one respondent,
...We’re going to enhance our skills. So it was a soft message to everybody to say, “We know you’re doing great stuff. But we just want to try to help make it even a little bit better.
MiTEAM Fidelity Assessments
MDHHS requires agencies to assess and report on the extent to which practice occurs as intended
as well as the quality of service provision. In this section, the evaluation team summarizes interview
and focus group respondents’ perceptions of MiTEAM fidelity and service quality assessments;
these data are collected and analyzed for Kent County only.
Each quarter, supervisors complete one MiTEAM Fidelity Tool per caseworker they supervise, and
also complete data entered into a state database. Fidelity results described in this section must be
interpreted with caution due to considerable amount of missing data, limitations of the Fidelity Tool,
and the fact that the tool has not been tested for reliability and validity. As demonstrated in the
fidelity analysis in the next section, overall, most caseworkers in Kent County’s five private agencies

Evaluation of Michigan’s Performance-Based
Funding Model: Second Annual Report 3-48
implement MiTEAM practices as designed.50 While private agency supervisors reported using the
MiTEAM Fidelity Tools, some agency staff struggle to complete them. One private agency
supervisor explained that they use the tool to reflect on the caseworkers they supervise,
I just kind of tried to look at it as I’m reflecting—I know what she’s doing, I know her. We have supervision, I know the level of work that she’s doing, but then I was able to sit down and reflect it on a piece of paper.
Across private agencies, staff reported that the Fidelity Tool is time-consuming, redundant, not user-
friendly (i.e., there are only Yes/No response options), and they are not sure that the value of the
tool outweighs the challenges of completing it (and in a timely manner). There was also confusion
reported among licensing and adoption staff as to whether or not they should complete the fidelity
tool because it does not apply to their work (e.g., there is a lot of language in the tool about engaging
the birth family). One private supervisor recommended, “It would be helpful if they had…a
different Fidelity Tool for each department, so one for CPS, one for foster care, one for adoption,
and one for licensing.” Staff also explained that they do not commonly receive the results from the
Fidelity Tools, so there is no way to use the information in regard to their practices. MDHHS Staff
reported that there are reports available to review with staff containing results of the fidelity tool,
and perhaps the access and use of these reports is an area that would benefit from additional
training.
MiTEAM Fidelity Tool Data Analysis
MDHHS provided the evaluation team with quarterly fidelity reports for Kent County, beginning
with the fourth quarter of 2016 (nine reports in total). We examine changes in the percentage of
caseworkers who implement behaviors associated with the practice model as it was designed, overall,
and by each MiTEAM competency. Fidelity results described in this section must be interpreted
with caution. For all nine quarters for which the evaluation team received fidelity reports, data were
missing from at least one of the five private agencies in Kent County. For the most recent quarter of
data examined (fourth quarter of 2018), only two of the private agencies reported fidelity data. The
substantial amount of missing data limits the degree to which we can extract meaning from the data
and generalize findings across the five private agencies in Kent County. Additionally, several items in
50Note that there has not been an assessment of validity and reliability of the fidelity tool, so the evaluation team refrains from making a determination that practice(s) is(are) conducted with fidelity.

Evaluation of Michigan’s Performance-Based
Funding Model: Second Annual Report 3-49
the instrument are applicable to more than one MiTEAM competency. This can make it difficult to
isolate changes in fidelity that are unique to individual MiTEAM competencies and strategize about
how to increase fidelity for certain competencies if scores are low, or maintain high levels of fidelity
where scores are high.
Overall, fidelity reports indicate that most caseworkers in Kent County’s five private agencies
implement MiTEAM practices in accordance with the model’s design; across the nine quarters, the
percentage of caseworkers who implemented MiTEAM behaviors as they were intended ranged
from 88 percent to 97 percent. Although the percentages are high overall, they steadily increased
between the fourth quarter of 2016 and the fourth quarter of 2018, and declined slightly through the
end of 2018 (Figure 3-1).
Figure 3-1. Percentage of sampled caseworkers implementing MiTEAM with fidelity by quarter
A comparison of fidelity data by MiTEAM competency indicates that, similar to the overall trend,
fidelity peaked at the end of 2017 and declined in 2018 for each competency. As mentioned above,
although the percentages of caseworkers implementing MiTEAM behaviors as they were designed
was high overall, an examination of data for the end of each year (fourth quarter) indicates that
fidelity was highest in 2016 and 2017 for engagement, and in 2018 for teaming. Service satisfaction
was also highest for engagement over the past two years. Considered together, these findings may
imply that caseworker adherence to the principles related to engagement may be associated with
family satisfaction (Figure 3-2). (Additional data on fidelity for each MiTEAM competency is in
Appendix 4.)
88%
92%93%
95%
97%
92%
94% 94%
92%
2016 Q4(n=1,651)
2017 Q1(n=2,479)
2017 Q2(n=2,447)
2017 Q3(n=2,285)
2017 Q4(n=783)
2018 Q1(n=1,211)
2018 Q2(n=1,411)
2018 Q3(n=1,482)
2018 Q4(n=1,846)

Evaluation of Michigan’s Performance-Based
Funding Model: Second Annual Report 3-50
Figure 3-2. Percentage of sampled caseworkers implementing MiTEAM competencies with
fidelity
The evaluation team also divided the fidelity items into quartiles based on the range of percentages
for each quarter. That is, items in which the highest percentage of workers implemented the
practices as intended during one quarter were grouped in the top quartile, and items in which the
lowest percentage of workers implemented the practices as intended were grouped in the bottom
quartile. An examination of quartile groupings for methods used to assess fidelity (i.e., observation,
documentation review, interview with the family, supervision)51 indicated that the percentage of
caseworkers implementing MiTEAM practices as they were designed varied depending on the
method used to assess fidelity. For example, of the four fidelity assessment methods, supervision
was the only one in which all caseworkers achieved scores that would indicate they were practicing
with fidelity for one quarter. The percentage of workers with scores that would indicate they were
practicing with fidelity at the end of each year was highest for supervision in 2016 and 2017, and for
documentation review in 2018 (Figure 3-3).
51Observation: The supervisor observes a worker interacting with a family he/she serves; Document review: The supervisor reviews all the worker’s documentation for a selected family; Interview with the family: The supervisor interviews a family member who was present during the observation; Supervision: The supervisor discusses various aspects of a case with the worker.
90%
97%95%
93%
98%
91%
87%
97%
92%90%
96%
89%
2016 Q4 2017 Q4 2018 Q4
Teaming Engagement Assessment Mentoring

Evaluation of Michigan’s Performance-Based
Funding Model: Second Annual Report 3-51
Figure 3-3. Percentage of sampled caseworkers implementing MiTEAM with fidelity, by
assessment method
These findings are not surprising based on the responses supervisors and caseworkers provided
during focus groups to questions about fidelity assessments. As discussed previously, respondents
shared that some questions in the Fidelity Tool are not applicable to the specific work in which
some caseworkers are engaged (i.e., licensing, adoption), but they find the “shadowing” and
feedback (which likely occurs through the supervision component) helpful.
As mentioned at the beginning of this section, the results described must be interpreted with caution
given the considerable amount of missing data and limitations of the Fidelity Tool.
3.5.1.13 Service Satisfaction
To assess the extent to which clients are satisfied with services provided through the five Kent
County private service agencies, the agencies regularly administer client satisfaction surveys to the
children and families they serve. Foster parents, parents, and youth who receive foster care and
adoptive services from the private agencies complete surveys about the agency, caseworkers
involved with their case, services provided, and case processes. This section summarizes these data
for the year prior (2016-2017) and then subsequent to (2017-2018) implementation of the Kent
Model.
Each of the five private agencies determines the timing of data collection (e.g., once per year, twice
annually), the respondent pool (e.g., parents and foster parents, all service recipients), and the types
of questions to be asked. Across agencies, respondents reported on the extent to which they agreed
30%
83%
20%
4%
72%60%
27%
55%
0%
53%
100%
42%
2016 Q4 2017 Q4 2018 Q4
Observation (n=30 items) Documentation review (n=25 items)
Interview (n=11 items) Supervision (n=19 items)
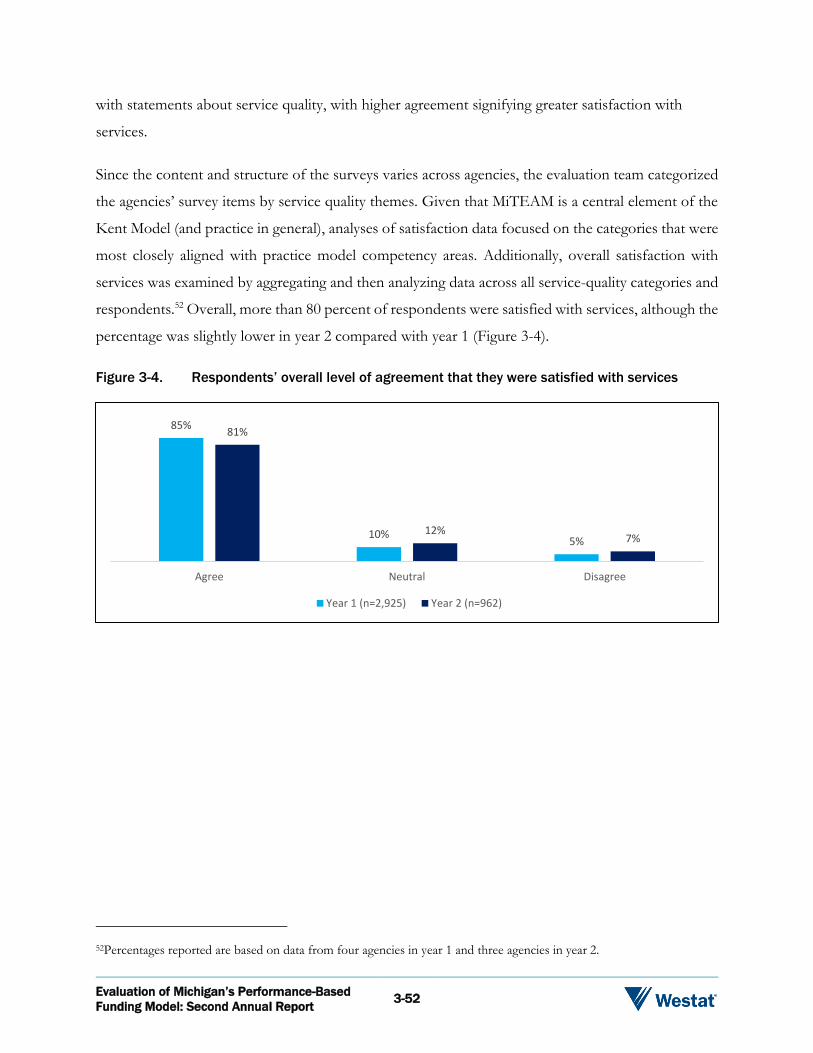
Evaluation of Michigan’s Performance-Based
Funding Model: Second Annual Report 3-52
with statements about service quality, with higher agreement signifying greater satisfaction with
services.
Since the content and structure of the surveys varies across agencies, the evaluation team categorized
the agencies’ survey items by service quality themes. Given that MiTEAM is a central element of the
Kent Model (and practice in general), analyses of satisfaction data focused on the categories that were
most closely aligned with practice model competency areas. Additionally, overall satisfaction with
services was examined by aggregating and then analyzing data across all service-quality categories and
respondents.52 Overall, more than 80 percent of respondents were satisfied with services, although the
percentage was slightly lower in year 2 compared with year 1 (Figure 3-4).
Figure 3-4. Respondents’ overall level of agreement that they were satisfied with services
52Percentages reported are based on data from four agencies in year 1 and three agencies in year 2.
85%
10%5%
81%
12%7%
Agree Neutral Disagree
Year 1 (n=2,925) Year 2 (n=962)

Evaluation of Michigan’s Performance-Based
Funding Model: Second Annual Report 3-53
In years 1 and 2, foster parents reported they were more satisfied with services than parents
(Figure 3-5).
Figure 3-5. Percentage of parents and foster parents who agreed they were satisfied with
services
The percentage of respondents who agreed that they were satisfied with services related to Teaming
(e.g., My caseworker involved me in the planning process for the child(ren) in my home),
Assessment (e.g., My caseworker meets with me in the foster home every month), and Mentoring
(e.g., My caseworker helped me understand the foster care system and my individual rights) declined
between years 1 and 2. The percentage of respondents who were satisfied with services related to
Engagement, the fourth MiTEAM competency (e.g., My caseworker treats me with respect),
remained stable at 91 percent over time.
In addition, when comparing survey item categories related to the four MiTEAM competencies,
satisfaction was highest for services related to engagement and lowest for services related to
teaming. These findings and those reported in the paragraph above suggest that while parents, foster
parents, and youth perceive that they are respected by their caseworker and at their respective
agency, agency staff may need to strategize about how to increase opportunities for family members
to make meaningful contributions to case-planning processes. (Additional data on satisfaction with
services related to each MiTEAM competency is in Appendix 5.)
Satisfaction survey data must be interpreted with caution. Although private agencies in Kent County
administer consumer satisfaction surveys to meet the Council on Accreditation’s requirements and
can use results to identify areas of strength or in need of improvement, the data reported have
75%
90%
77% 81%
Parents Foster parents
Year 1 (n=1,449) Year 2 (n=518)
Evaluation of Michigan’s Performance-Based
Funding Model: Second Annual Report 3-54
limitations. For example, the number of respondents from some agencies was considerably higher
than the number of respondents from other agencies, so cross-agency patterns that emerged may be
influenced heavily by the agency with the majority of respondents. Additionally, some data were
excluded from analyses for several reasons:
Data for clients in Kent County were aggregated with data for clients in other counties the agency serves.
An agency did not provide item-level responses, so the evaluation team could not aggregate the agency’s data with data from other agencies.
An agency did not collect data during the target date range (September 29, 2016 through September 30, 2017 for year 1; October 1, 2017 through September 30, 2018 for year 2).
We will continue to examine service satisfaction data in subsequent years of the evaluation to
determine if the patterns that emerged during years 1 and 2 are maintained or change over time.
3.5.1.14 Summary of Kent County Findings
Kent County developed the current pilot with the aim of improving outcomes for children in foster
care by (1) increasing the efficiency and flexibility of service delivery to meet the needs of children
and families, and (2) using data and predictive analytics for rapid identification and response to
issues. After one year of implementation, court and private agency staff report seeing substantial
improvement in the timeliness of service authorizations. Staff also described beginning to see more
innovative thinking around services during case planning, something actively encouraged by care
coordinators. Of particular note, the EFC programs have become a primary means of quickly
stabilizing placements and targeting supports to high-need foster children and their caregivers.
Staff and stakeholders described the first year of implementation as largely smooth, thanks in large
part to the intensive pre-implementation planning process, with some “hiccups” along the way.
Through regular meetings and communication, WMPC and the private agencies have been
collaborating to work through challenges as they arise, and agency staff feel WMPC has been open
to feedback and responsive to concerns.
Perhaps the most significant challenge has been getting MindShare, WMPC’s data and analytics
system, to identify the necessary data elements to extract from MiSACWIS, and obtain approval of
the new data sharing agreement when being prioritized with other department priorities.

Evaluation of Michigan’s Performance-Based
Funding Model: Second Annual Report 3-55
Respondents from the court and county government in particular expressed a strong desire to see
MindShare fully implemented, as it was intended to be one of the pillars of the Kent model. At the
same time, stakeholders expressed concern over the quality of the data entered in MiSACWIS.
Four of the five private agencies described a strong collaborative relationship with WMPC, and a
growing collaboration among the five private agencies themselves. WMPC also meets regularly with
judges and court staff, and respondents felt most judges now feel more positive about the potential
of the Kent Model as a result. The Kent County DHHS, although an active partner during the
planning process, is reported to be largely uninvolved and perhaps underutilized during the first year
of implementation.
The evaluation team also examined certain systemic factors with the potential to affect the pilot. As
is common in most child welfare agencies, staff turnover, both at WMPC and the private agencies,
while not specifically measured by the evaluation team, was reported by respondents as “high,”
which respondents attributed to salaries incommensurate with the high demands of the job. Agency
workers also reported frustration with the amount of paperwork required and the difficulty of
entering data into MiSACWIS, as well as anxiety over testifying in court. WMPC is attempting to
address each of these issues through various strategies.
3.5.2 Ingham County
In Ingham County, 49 percent of foster care services and 100 percent of adoption services are
managed by private agencies (Michigan Department of Health and Human Services, 2019). The
payment structure for foster care services is applied in accordance with the per diem model. During
the most recent evaluation site visit, the evaluation team conducted five interviews and six focus
groups in Ingham County with agency leaders, supervisors, and workers in Ingham County DHHS
and two private child-placing agencies, as well as representatives from the county court system and
mental health partner agency. Through data collection activities, the evaluation team obtained
information on a range of topics related to child welfare services and practice (see Section 3.2). This
section summarizes key findings from the collection of those data.
Evaluation of Michigan’s Performance-Based
Funding Model: Second Annual Report 3-56
Overarching Research Question 1: Do the
Counties Adhere to the State’s Guiding
Principles in Performing Child Welfare Practice?
Subquestion: What Resources (Strategies, Infrastructure) Are Necessary to Support the
Successful Delivery of Child Welfare Services?
The degree to which workers can provide child welfare services effectively depends on a number of
factors, including the quality of interagency partnerships, intra-agency characteristics, and
community assets. This section provides a summary of resources that facilitates implementation of
effective child welfare practice in Ingham County.
3.5.2.1 Collaboration
Child welfare staff in public and private agencies, as well as representatives from local mental health
and court agencies, described interagency partnerships in Ingham County. Overall, respondents
described positive relationships between staff in the private agencies and Ingham County DHHS.
Respondents from both types of agencies reported that they maintain effective communication and
collaborate often. The agencies have regular interagency meetings, such as a monthly Director’s
Meeting and bimonthly meetings with program managers and supervisors, each with representation
from Ingham County DHHS and the private agencies. According to respondents, Ingham County
DHHS also plans a number of trainings to which they invite private agency staff.
Ingham County’s court administrator and other court officials participate on the Child Welfare
Coordinating Council, which also has representation from Ingham County DHHS, private child
welfare agencies, and Community Mental Health (CMH). Council members meet quarterly to
provide updates and share relevant information about each agency (e.g., activities, events).
Representatives from Ingham County DHHS and the court system reported positive and collegial
relationships, with respondents stating that both entities strive to improve collaborative processes
(e.g., increase communication and teaming). One child welfare agency supervisor stated,
We team with the courts and with the service providers that work [in the human trafficking and drug] areas. There’s a team approach to those cases, where there’s team meetings every week and all the stakeholders are there and talk about the cases to try to

Evaluation of Michigan’s Performance-Based
Funding Model: Second Annual Report 3-57
move those cases along and get the intensive services that they’re going to need to overcome those barriers to getting their kids home.
Another key child welfare partner is CMH, a local mental health agency that serves individuals with
high or intensive mental health needs. During interviews and focus groups, public agency staff
described the strength of the partnership, which they partially attributed to the fact that CMH and
Ingham County DHHS are located in the same building. Staff from both agencies collaborate
regularly on various activities, such as supporting youth transitioning out of residential care and
planning various trainings.
Additionally, CMH provides a range of services that may be particularly beneficial to children the
child welfare agencies serve. CMH recently added Treatment Foster Care Oregon (TFCO) to its
menu of service options. Services available through TFCO and Families Forward support children
with emotional disturbance and behavior issues (Community Mental Health, n.d.). Other services
CMH provides include:
Outpatient and in-home treatment,
Emergency services,
Urgent care (e.g., children who are recently discharged from the hospital and need intense levels of services to stabilize),
Mobile crisis services (emergency service therapists serve children and families in the community and in family homes to help with de-escalation and crisis intervention), and
Early intervention services (work that focuses on improving parents’ attachment to children aged 7 and under).
Ingham County child welfare staff identified a
number of partnerships they have established
with other community-based organizations. For
example, staff from Ingham County DHHS and
the private agencies maintain positive
relationships with representatives from local law
enforcement agencies, hospitals, and faith-based
coalitions, as well as other service providers in
the community (see text box).
Other Partner Agencies
Angel House Program (services for teenage
girls in foster care who are pregnant or have
a child)
Capital Area Community Services (services
to support families living in poverty)
Firecracker Foundation (services for children
who have experienced sexual trauma)
High Fields (provides wraparound services)
Small Talk (conducts assessments of child
sexual abuse)
Team Court Program

Evaluation of Michigan’s Performance-Based
Funding Model: Second Annual Report 3-58
3.5.2.2 Systemic Factors
As described in the previous section, child welfare agency staff rely on interagency partnerships to
address the needs of the families they serve. Intra-agency characteristics and processes also have
implications for child welfare practice and service provision. Interview and focus group discussions
of these characteristics and processes are summarized in this section.
Staff Training
Respondents from public and private child welfare agencies reported strategic decision-making in
how agency leaders identify mandatory trainings for staff. Respondents stated that agency leaders
review trends in agency data, annual audit findings, and data from service quality measures to
determine which trainings match staff needs. For example, an examination of one agency’s data
revealed that workers were not entering contact data on time, so an Initial Service Plan training was
offered to retrain staff on processes and requirements. When retraining is necessary, respondents
from one private agency reported that agency leaders look for opportunities to empower staff by
having those staff with expertise in certain areas train their colleagues on specific topics. Another
private agency recently implemented a new training plan to supplement and reinforce concepts
covered in the CWTI training.
Across public and private agencies, staff identified a nonexclusive, combined total of 45 different
trainings that are required or optional to complete. The most common trainings respondents
identified were related to:
Structured decision-making;
Trauma, secondary trauma, and trauma-screening tools;
Licensing; and
Online security.
Other trainings that staff found especially engaging and beneficial included those on:
Active shooters,
Independent living/voluntary care,

Evaluation of Michigan’s Performance-Based
Funding Model: Second Annual Report 3-59
Performance development, and
Interaction with foster parents and biological parents.
An Ingham County DHHS supervisor who participated in active shooter training described it as
“eye-opening” and stated that the training offered “some great ideas, if something happens. We do get threats,
as most people do.” Another Ingham County DHHS worker had a very positive experience with a
training for licensing staff, stating:
Every year in licensing, we have a huge conference around June or July, and it’s the only training that I find beneficial because it’s really just tailored to our job, and I feel like a lot of trainings that we have to attend are not.
Supervisors in one private agency reported that they found it beneficial to be in close proximity to
Michigan State University because it shares information about course offerings available to agency
staff. Supervisors also described a performance development training, which the agency’s Human
Resources department planned, as comprehensive and including topics and activities that helped
them effectively manage staff (e.g., guidance for “supporting and motivating” staff). One focus
group respondent described the training as “a really nice training” and “absolutely awesome.”
Although a range of trainings are available to agency staff to address service delivery gaps and needs,
there was variation among agency staff around the extent to which they found trainings useful. As
one private agency worker stated, “When we go to CWTI there’s like one to two days of MiSACWIS
training. And I feel like most of my learning with MiSACWIS was on the job learning. I don’t feel like I learned
much in the training.” However, another worker from the same agency reported having a “better
MiSACWIS training,” noting that individual components of training spanned over multiple days.
Respondents reported that it can be difficult for agency staff to find time to participate in trainings
they may find useful or necessary. One director described a strategy to address this issue, by
engaging in efforts to “map out when our trainings are so that we don’t have a lot of them at one time in a month.
And for this month I put a moratorium on training because we’re really short staffed.” In general, staff in public
and private agencies implied that trainings were most useful when they were specific to their role at
the agency or real-time needs.
Evaluation of Michigan’s Performance-Based
Funding Model: Second Annual Report 3-60
Child Welfare Agency Processes and Structure
Staff in both public and private child welfare agencies talked about the number of cases that workers
are expected to carry, as well as processes for managing caseloads. For example, several workers
across agencies reported having responsibility for 15 or more cases, even though each worker is
expected to maintain a maximum of 13 cases. Supervisors did not indicate that they supervised more
workers than the agency-established norm, but they did report that increased caseloads for workers
often requires increased supervisor oversight. Respondents also stated that they perceived there has
been an increase in focus on data tracking and reporting.
Leaders in public and private agencies reported they were committed to helping supervisors increase
their skills and mentorship opportunities in an effort to maintain staff. One private agency recently
implemented a new organizational structure to facilitate access to upper management. This new
structure gives each caseworker additional support and resources by adding two levels of supervision
and a quality assurance staff member, all of whom have substantive child welfare experience. One
respondent described how agency managers support staff, stating,
Every day in our jobs, we’re trying to look outside the box. How can we do it better? How can we do it more quality service and people-first related? So I think what helps is it’s trickling down and it continues to trickle down so that our staff see it, because they see that our upper management are trying to help us do that for our families.
3.5.2.3 Foster Parent Licensing, Recruitment, and Training
Previous sections described processes within Ingham County child welfare agencies to ensure
families’ needs are met, including establishing and maintaining interagency partnerships and
enhancing skills through training opportunities. This section focuses on processes for recruiting and
supporting foster families.
Both public and private agency staff reported various strategies for recruiting foster families. For
example, Ingham County DHHS staff reported that licensing staff participate in at least two
recruitment events a month, during which they engage with members of the community to discuss
foster care needs and build relationships with potential foster parents. As an Ingham County DHHS
worker explained, “In licensing, we have to do the minimum of two what we call recruitment events a month. And
so that’s just us showing our faces in the community, getting the word out about the foster care needs in Ingham
County.”
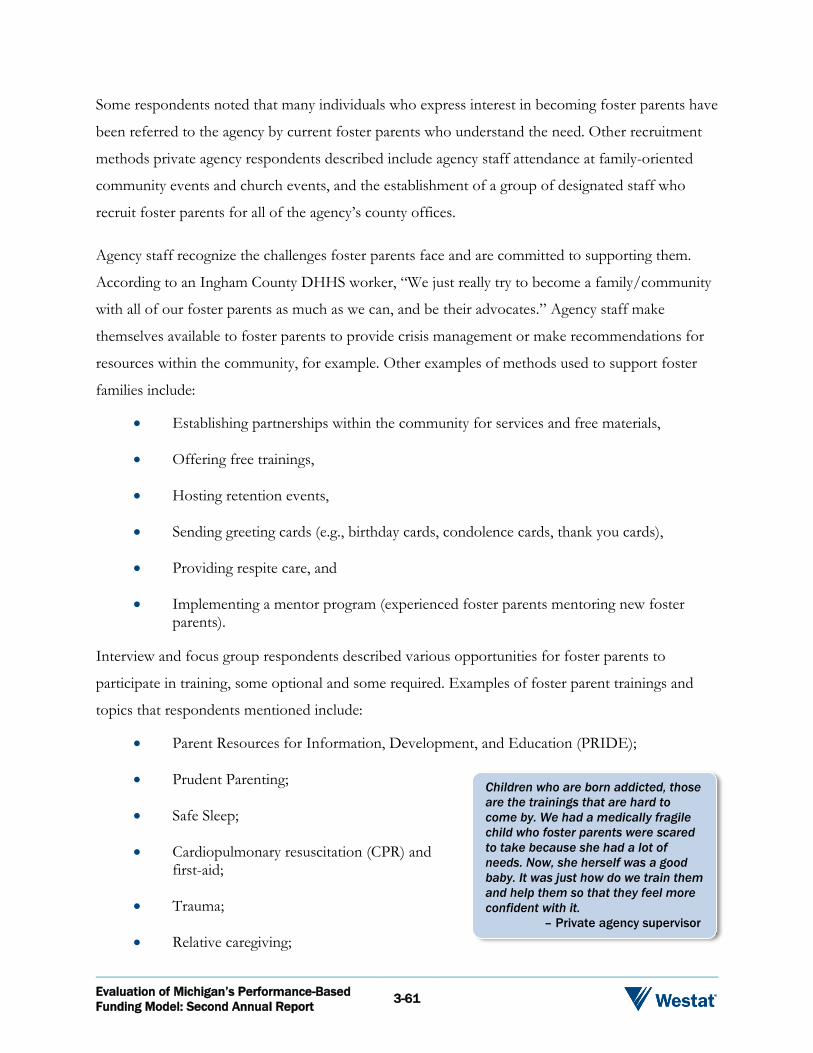
Evaluation of Michigan’s Performance-Based
Funding Model: Second Annual Report 3-61
Some respondents noted that many individuals who express interest in becoming foster parents have
been referred to the agency by current foster parents who understand the need. Other recruitment
methods private agency respondents described include agency staff attendance at family-oriented
community events and church events, and the establishment of a group of designated staff who
recruit foster parents for all of the agency’s county offices.
Agency staff recognize the challenges foster parents face and are committed to supporting them.
According to an Ingham County DHHS worker, “We just really try to become a family/community
with all of our foster parents as much as we can, and be their advocates.” Agency staff make
themselves available to foster parents to provide crisis management or make recommendations for
resources within the community, for example. Other examples of methods used to support foster
families include:
Establishing partnerships within the community for services and free materials,
Offering free trainings,
Hosting retention events,
Sending greeting cards (e.g., birthday cards, condolence cards, thank you cards),
Providing respite care, and
Implementing a mentor program (experienced foster parents mentoring new foster parents).
Interview and focus group respondents described various opportunities for foster parents to
participate in training, some optional and some required. Examples of foster parent trainings and
topics that respondents mentioned include:
Parent Resources for Information, Development, and Education (PRIDE);
Prudent Parenting;
Safe Sleep;
Cardiopulmonary resuscitation (CPR) and first-aid;
Trauma;
Relative caregiving;
Children who are born addicted, those
are the trainings that are hard to
come by. We had a medically fragile
child who foster parents were scared
to take because she had a lot of
needs. Now, she herself was a good
baby. It was just how do we train them
and help them so that they feel more
confident with it.
– Private agency supervisor

Evaluation of Michigan’s Performance-Based
Funding Model: Second Annual Report 3-62
Reunification;
Cross-cultural awareness;
Behavior management; and
Children with disabilities.
Overarching Research Question 2: Do Child
Placing Agencies Adhere to the MiTEAM Practice
Model When Providing Child Welfare Services?
There are two parts to this section, MiTEAM and fidelity assessments. Within these sections, the
evaluation team summarizes respondent discussions of efforts to implement the MiTEAM practice
model as it was intended.
3.5.2.4 MiTEAM Practice Model
Statewide, child welfare agency workers are expected to deliver services aligned with the MiTEAM
practice model. The tenets of the MiTEAM practice model underscore the importance of serving
families in a manner that promotes inclusion, mutual respect, and recognition of each family’s
unique strengths and needs. During interviews and focus groups, agency leaders, supervisors, and
direct line workers in public and private agencies in Ingham County described their perceptions and
feelings about the practice model, innovation and flexibility around implementation of MiTEAM,
and expectations about it.
MiTEAM Strengths and Challenges
Interview and focus group respondents described strengths of the practice model as well as
challenges to implementing it. In terms of strengths, supervisors and workers in one agency stated
that the practice helps families feel at ease during meetings (e.g., enabling families to determine
whom to include in case-related meetings), and that MiTEAM helps families have more clarity about
their case. For example, one private agency worker stated,

Evaluation of Michigan’s Performance-Based
Funding Model: Second Annual Report 3-63
Parents seem to report that it’s helpful for them. Like when we sit down, most of the time—especially when we have them in cases that may not be going too well or that there seems to be a lot of confusion going on—the parents will leave the meeting feeling relieved and more clear [about] the expectations.
While some respondents stated that MiTEAM components are common child welfare practices that
workers were already implementing, several respondents expressed concern about the limited
applicability of the practice model to the work they do; in particular, those staff who do not work
with families directly (e.g., licensing workers). One public agency supervisor explained, “Because [my
workers] don’t have direct client interactions, the MiTEAM model has been difficult for them to implement,” while a
public agency worker stated, “Sometimes, it’s difficult to fit our position into some of the exercises that we’ve been
expected to do with the MiTEAM case model.”
Several supervisors and workers from one private agency described various methods for ensuring
workers are aware of expectations to implement the practice model, as intended. For example,
respondents referenced an individual designated as a liaison to the agency, with whom agency staff
can consult about implementation of the practice model. As one supervisor explained, the liaison
“informs us as much as she can about any upcoming trainings, any changes, anything that we need to know of as far
as how to implement it and continue to use it.”
When asked about the extent to which workers can be innovative and flexible in how they work
with families, supervisors and workers in the private agencies described flexibility in relation to
meetings with families. Respondents explained that the agencies afford workers opportunities to
meet each family at a time and location that is most convenient for them. Although some
respondents said that this has been common practice for some time, one caseworker acknowledged
that being flexible to accommodate families often results in an extension of the work day for the
worker:
You’re kind of forced to be flexible as well. A lot of time, if [they] have school-aged children, most of the families can’t meet until four or five. So you just have to be flexible and be willing to meet after hours if you need to, and scheduling that for yourself in a way that you don’t get burned out.

Evaluation of Michigan’s Performance-Based
Funding Model: Second Annual Report 3-64
3.5.2.5 Fidelity Assessments and Quality Reviews
MDHHS requires agencies to assess and report on the extent to which practice occurs as intended
as well as the quality of service provision. In this section, the evaluation team summarizes interview
and focus group respondents’ perceptions of fidelity and service quality assessments. As noted, for
the purposes of the evaluation, fidelity data was collected and analyzed for Kent County only.
Awareness of Fidelity Tool and Assessments
Statewide, supervisors use the MiTEAM Fidelity Tool to assess the extent to which caseworkers
implement the practice model as intended. During interviews and focus groups, most respondents
indicated that they were aware of the MiTEAM Fidelity Tool and its components. Several
respondents in Ingham County expressed support for the intention of the fidelity assessments—to
identify worker strengths and areas in which they can improve how they deliver services to families.
For example, some respondents were aware of the distinction between data used to measure
progress on achieving outcomes, and data used to assess the extent to which service provision is
aligned with MiTEAM competencies to improve practice. Other respondents stated that through the
fidelity assessment process, supervisors have the ability to coach the workers they supervise and help
them improve their skills, particularly when they have difficult cases, and identify staff support
needs.
There was, however, variation in how much respondents knew about the tool and how it is used.
For example, at one agency, most workers mentioned supervisor shadowing as part of the fidelity
assessment process, and implied that feedback on what supervisors observed during the shadowing
would help workers improve practice. Conversely, supervisors from one agency stated that they do
not use the Fidelity Tool at all because it is not relevant to the workers they supervise
(e.g., licensing). Other respondents at the same agency stated that supervisors complete the tool in
its entirety but have difficulty answering the questions for staff in positions such as licensing for
which questions are not relevant, and they enter “not applicable” in response to the majority of
items. Several respondents reported that they were unfamiliar with the tool, uncertain of the extent
to which the tool is used to assess or improve fidelity to the practice model, or did not receive
feedback after being observed. As one worker explained,

Evaluation of Michigan’s Performance-Based
Funding Model: Second Annual Report 3-65
I’ve only been shadowed once and didn’t have any feedback. I had to ask. I didn’t have a form…there was nothing that was gone over. And I think even for newer workers, they’re not being shadowed in the field like they should be.
Assessment of Service Quality
In addition to the fidelity assessments, there is also statewide measurement of the quality of services
that workers provide in public and private child welfare agencies. For example, MDHHS’ Division
of Continuous Quality Improvement (DCQI) conducts QSRs in each county every three years to
assess case practice quality. The most recent QSR in Ingham County was conducted in February
2018. All cases reviewed had scores in the acceptable range for three child and family status
indicators (safety: threat of harm, living arrangement, and independent living skills), while two
practice performance indicators (assessment and understanding, implementing interventions/case
planning) were identified as needing improvement (Michigan Department of Health and Human
Services, 2018). As one respondent acknowledged during the evaluation site visit, “They did come in
and review cases and gave us some guidance in the areas that we needed to improve.”
In addition to the state QSRs, interview and focus group respondents described other methods used
in their agencies to assess the quality of services that workers provide. For example, respondents in
one private agency described participation in an initiative that promotes service quality. Initiative
members, composed of agency staff at multiple levels, meet on a monthly basis to review agency-
level data being tracked, and strategize about how to address deficiencies and improve practice.
Similarly, respondents from the public agency and one private agency described designated staff who
regularly monitor service quality. Additional methods that respondents described as being used in
their agency to assess service quality include:
Direct calls to families to inquire about service quality,
Monthly meetings to discuss the status of open cases,
Quarterly audits of case files, and
Oversight of case practice by a designated Quality Team.

Evaluation of Michigan’s Performance-Based
Funding Model: Second Annual Report 3-66
3.5.2.6 Performance Monitoring and Reporting
Interview and focus group respondents described a range
of tools that agency staff use to track progress toward
achieving case goals in a timely manner and meet agency
or state-reporting requirements. In addition to reports on
the use of MiSACWIS and the platform’s Book of Business to meet the state’s data entry and case
management requirements, respondents described other tools that they created, which are tailored to
their individual needs. For example, several respondents created spreadsheets or other tools using
Microsoft Office programs (e.g., Word, Excel, Access), to store case data and help them maintain
awareness of tasks to be completed and timelines for completion. Respondents from one private
agency described a database that has existed for a number of years that agency staff use to enter, and
from which they extract relevant data for reports or case files.
Subquestion: What Factors Facilitate and Inhibit Effective Implementation of Child Welfare
Practice?
As mentioned previously, the ability of child welfare workers to provide effective child welfare
practice depends on a number of factors, including the quality of interagency partnerships, and intra-
agency and community characteristics. This section provides a summary of factors that facilitate or
inhibit child welfare service delivery in Ingham County, including those related to collaborative
partnerships, agency characteristics and process, performance assessments, and recruitment and
retention of foster and adoptive homes.
3.5.2.7 Collaboration
Public and Private Agencies
Interview and focus group respondents described collaborative partnerships among staff in public
and private child welfare agencies. Factors that respondents from private agencies cited as facilitators
to these relationships included:
Ease with which private agency staff work with Ingham County DHHS licensing staff—”We work very [well] together, as a team, between their department and our department. So we have a good collaboration going and I’m very happy because it helps,”
Because the work that we do can get
to be hectic, it’s almost impossible to
do without being organized.
– Agency worker
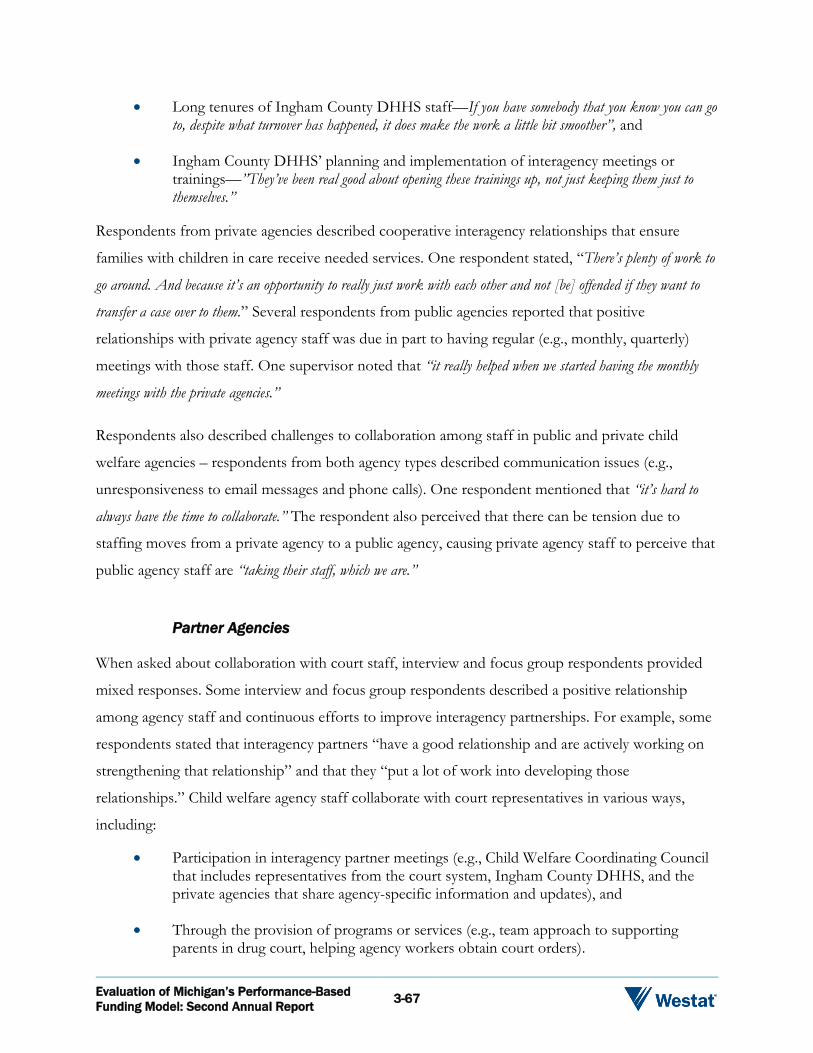
Evaluation of Michigan’s Performance-Based
Funding Model: Second Annual Report 3-67
Long tenures of Ingham County DHHS staff—If you have somebody that you know you can go to, despite what turnover has happened, it does make the work a little bit smoother”, and
Ingham County DHHS’ planning and implementation of interagency meetings or trainings—”They’ve been real good about opening these trainings up, not just keeping them just to themselves.”
Respondents from private agencies described cooperative interagency relationships that ensure
families with children in care receive needed services. One respondent stated, “There’s plenty of work to
go around. And because it’s an opportunity to really just work with each other and not [be] offended if they want to
transfer a case over to them.” Several respondents from public agencies reported that positive
relationships with private agency staff was due in part to having regular (e.g., monthly, quarterly)
meetings with those staff. One supervisor noted that “it really helped when we started having the monthly
meetings with the private agencies.”
Respondents also described challenges to collaboration among staff in public and private child
welfare agencies – respondents from both agency types described communication issues (e.g.,
unresponsiveness to email messages and phone calls). One respondent mentioned that “it’s hard to
always have the time to collaborate.” The respondent also perceived that there can be tension due to
staffing moves from a private agency to a public agency, causing private agency staff to perceive that
public agency staff are “taking their staff, which we are.”
Partner Agencies
When asked about collaboration with court staff, interview and focus group respondents provided
mixed responses. Some interview and focus group respondents described a positive relationship
among agency staff and continuous efforts to improve interagency partnerships. For example, some
respondents stated that interagency partners “have a good relationship and are actively working on
strengthening that relationship” and that they “put a lot of work into developing those
relationships.” Child welfare agency staff collaborate with court representatives in various ways,
including:
Participation in interagency partner meetings (e.g., Child Welfare Coordinating Council that includes representatives from the court system, Ingham County DHHS, and the private agencies that share agency-specific information and updates), and
Through the provision of programs or services (e.g., team approach to supporting parents in drug court, helping agency workers obtain court orders).

Evaluation of Michigan’s Performance-Based
Funding Model: Second Annual Report 3-68
Respondents from private child-placing agencies described a somewhat tenuous relationship with
the court system, which can make effective collaboration challenging. Workers are often intimidated
by the court process, and respondents implied that sometimes going to court is the most challenging
part of a caseworker’s job. One respondent perceived that judges may not have a complete
understanding of child welfare policy and suggested that increased awareness of partner agencies’
policies and mandates may help partners understand worker practices and improve interagency
relationships. As the private agency supervisor explains,
A lot of the judges don’t really understand some of the policy. They have the best interest for the child at heart, but they don’t really understand policy and why we do the things that we do, so they get frustrated with us.
In response to questions about partnerships with mental health agencies, interview and focus group
participants mainly discussed their experiences working with CMH, a local mental health provider.
One respondent explained that relationships among staff in Ingham County DHHS and CMH has
improved over time because agency directors “worked really hard on trying to ease that.” The respondent
perceived that collaboration between CMH and private
child welfare agencies is more challenging because while
Ingham County DHHS and CMH are located in the same
building, private agencies are “disconnected a little bit both
physically and just figuratively.” Despite the perceived
disconnection between private agencies and CMH, one
respondent described communication among the agencies
as “a work in progress.” A respondent from a private agency articulated that “the transparency maybe is
what I would say is most helpful,” relative to discussions among agency representatives about how to
work through agency-specific challenges or limitations (e.g., reduced staff availability). Although
most barriers that respondents described relative to CMH affected service delivery (e.g., waiting lists
for CMH services), one private agency supervisor described communication issues that have made
collaboration with CMH challenging. The respondent stated, “You don’t get updates from CMH on your
case. You just don’t. You can ask them and they give you the runaround and you need to get all this stuff signed.”
In the court, the judge does
yell at them. It's like, ‘I'm
done.’ They'll come back and
quit. Right on the spot. ‘I'm
done.’
– Agency supervisor

Evaluation of Michigan’s Performance-Based
Funding Model: Second Annual Report 3-69
3.5.2.8 Systemic Factors
A number of systemic factors are associated with effective service delivery in Ingham County. These
factors include staffing (e.g., training needs and staff turnover) and service monitoring processes,
among others. These factors are discussed in detail below.
Staff Training
Although dozens of trainings are available to staff to help them meet state, county, or agency
requirements, or as optional trainings, gaps still exist. Overall, respondents from public and private
agencies agreed that more MiSACWIS training is needed. An Ingham County DHHS worker
suggested that trainings should be developed by individuals who “have actually done the position, or
worked in MiSACWIS…I just think that would be more helpful, more beneficial.” Respondents emphasized
that training on how to navigate MiSACWIS and upload materials should be enhanced through the
Child Welfare Training Institute (CWTI), and should be provided on a continuous basis throughout
the year. Agency staff also agreed that new workers would benefit from more opportunities to
shadow experienced staff while also attending the CWTI to observe various situations they could
encounter, before they begin the job.
Other topics on which respondents suggested training would be useful include:
Adoption,
Behavioral management,
De-escalation,
Medical passports,
Identification of illegal substances,
Relationship building,
Relative placement, and
Organization and time management.
Some of these suggested trainings were available to staff at the time of the evaluation site visit, but
some respondents reported that more opportunities to participate in trainings on specific topics
would be very helpful.
I think our workers need training on
customer service. I think it’s an
ongoing issue of losing foster care
homes, just because of the way they
were treated or not communicated
with.
– Agency supervisor
Evaluation of Michigan’s Performance-Based
Funding Model: Second Annual Report 3-70
Child Welfare Service Delivery
Child welfare staff indicated that Ingham County has a number of strengths that have facilitated the
agencies’ efforts to serve children and families effectively. Specifically, respondents report ample
resources and services available in the community, including public transportation, which is
extremely helpful for parents who do not have a car or cannot drive. Public transportation allows
them to attend visitations, get to and from work, and access needed services.
Not surprisingly, interview and focus group respondents reported they have faced a number of
barriers to effective service provision. For example, for many services, private agency workers are
required to obtain approval from Ingham County DHHS before the services can be provided. This
extra step is a reported barrier because it often takes a substantial amount of time before approvals
are granted. Additionally, although Ingham County service providers offer a range of services
throughout the community, there are critical services (e.g., adoption support and mental health
services) that workers report having difficulty accessing because of limited availability – the slots for
such services are often filled. One of the most common challenges identified by respondents is the
lack of affordable and temporary housing in the county. As one concerned respondent noted,
I would say we have a housing crisis. I would go to the level of, we do not have adequate housing in our county for the families that we service, ranging from the young adults that I have trying to be independent on their own to our birth families that just do not have places to live.
Child welfare staff often have difficulty locating housing for families for a number of reasons,
including lack of affordability, criminal and eviction histories that may preclude them from entering
into lease agreements, long waiting lists for low-income housing, and limited availability at county
shelters. The housing issue has implications for reunification of children with their parents, as well as
young adults aging out of foster care. They may have longer stays in care if parents or independent
youth are unable to secure adequate housing.
One agency worker explained,
I would think the biggest barrier for services would be housing for our clients, because there’s just not enough. They opened the waiting list, but again, it’s just a waiting list. So there’s not a guarantee of when they could obtain housing.

Evaluation of Michigan’s Performance-Based
Funding Model: Second Annual Report 3-71
Another barrier cited as affecting service provision is the lack of hospital beds for children who need
psychiatric care. One interview respondent provided an example of a case that was active at the time
of data collection, illustrating the gravity of the situation:
There’s a kid in the lobby who is waiting to be psychiatrically hospitalized. And they’ve been waiting for two days because we can’t find a bed. And the issue with that is that they can’t always go home because we’re saying that they need to be psychiatrically hospitalized.
Staff Turnover
Respondents in both public and private agencies described staff turnover in Ingham County child
welfare as a major challenge to serving families effectively. Agency staff associated continuous staff
turnover with caseloads above the normal range, which reportedly compromises the quality of
services delivered to children and families. In particular, respondents perceived that moving foster
families from caseworker to caseworker creates instability in the placement, as families are unable to
build trusting relationships with workers because of frequent reassignments. Because foster families
are often recruited by word of mouth, these types of challenges can also affect the agency’s ability to
recruit and retain foster families.
Public and private agency respondents also report that the lack of experienced staff to mentor or
support new staff contributes to turnover. The lack of mentors who understand the intricacies of
effective casework and are knowledgeable about available resources, contributes to a steep learning
curve for new staff, leaving them without adequate coaching and mentoring. As one worker
explained,
I think something that’s changed is because we’ve had so much [more] turnover than before, when people get into casework, there was always a lot of people that had been there for a number of years that you could go and talk to and get a lot of support from. And now it feels like the oldest person there has been there for a year.
Private agency respondents expressed that having consistent senior managers available to offer
support is extremely important. Staff utilize supervisors and co-workers to “bounce ideas off each
other” and get help or advice when they need extra guidance.
Other reported reasons for turnover run the gamut from stress associated with child welfare work,
to job responsibilities that are “nearly impossible” to complete in a 40-hour week, to better pay and
benefits at other agencies or in different fields of work. Another turnover issue respondents

Evaluation of Michigan’s Performance-Based
Funding Model: Second Annual Report 3-72
described is the lack of experience among new staff and incongruence between new staff
expectations and actual social work responsibilities. Specifically, respondents noted that most new
workers are hired soon after graduating from college and with limited practical social work
experience. The characteristics associated with the job accompanied by their own lack of experience
plus “a lack of seasoned colleagues to lean on” prove challenging to new staff, and is sometimes reported
as “too much to handle.” But turnover is not reserved for new staff only. Supervisor positions are also
at risk of turnover. One respondent described the challenges in hiring and retaining supervisors,
stating,
They are required to have so many years of experience in a certain relatable field, in human services field and a certain degree…it’s really hard because people aren’t staying in child welfare. So we don’t see supervisors staying three or four years.
Caseloads
County supervisors with over 45 years of combined experience working at Ingham County DHHS
explained that although worker responsibilities have increased, there have been no reductions in
caseload size. Staff discussed how job demands have increased because of the focus on data tracking
and reporting, in addition to long-standing and time-consuming responsibilities, such as entering
data in MiSACWIS (and managing the associated data entry challenges), transporting families when
necessary, and facilitating parent/child visitations. The increases in responsibilities, compounded by
high caseloads, has resulted in less time available to devote to families. One worker acknowledged,
“When our caseloads are too high, then that affects our ability to provide the necessary attention to all of our cases, and
then we get behind.”
Respondents in one agency described the common practice of “caseload shuffling.” That is, caseloads
are transferred to different workers to account for staff who leave the agency, or to relieve staff with
higher than usual caseloads. Some workers expressed concern for the families on their caseload who
get reassigned to a different worker (e.g., they may have established a positive and trusting
relationship prior to the transfer). Respondents also described challenges related to how high
caseloads affect workers at multiple agencies. For example, some respondents stated that when
Ingham County DHHS workers request to assign cases to private agency workers, the private agency
workers can decline them if they do not have the capacity to take on more cases at that time.
Ingham County DHHS workers must then add those cases to their already large caseloads.
Evaluation of Michigan’s Performance-Based
Funding Model: Second Annual Report 3-73
Some respondents suggested that staff such as case aides and case technicians are needed to assist
workers with administrative tasks, such as uploading documents, entering data (e.g., contacts), filing
paperwork, and making copies of documents needed for court. Respondents stated that workers
would have more time to devote to the families they serve if they had help with administrative tasks.
3.5.2.9 Information Systems
As mentioned earlier in this report, child welfare staff is required to report case data in MiSACWIS.
The main benefit of the database, as described by respondents, is that it is a statewide database that
enables users to extract needed documents. However, users seeking relevant information must rely
on others to upload and enter complete information in a timely manner. During focus groups,
workers reported that they use the Book of Business, which is accessible through MiSACWIS and
provides a snapshot of case-level information. Some respondents stated that the Book of Business
helps workers stay on top of tasks that need to be completed. As one respondent indicated, the
Book of Business provides a mechanism for agency staff to “have that real-time look at…where they are
with entering their data so that they’re capturing what they’re doing.”
Although respondents identified some benefits to MiSACWIS, most of them described a number of
challenges to using the system. Examples of complaints that respondents described in relation to
MiSACWIS include:
Considerable time necessary to enter or access data,
Redundancy of information in the system,
System is not user-friendly and is difficult to learn,
Constant system glitches or crashes, and
Inadequate support from the MiSACWIS Help Desk (e.g., substantial amount of time necessary to get issues resolved).

Evaluation of Michigan’s Performance-Based
Funding Model: Second Annual Report 3-74
3.5.2.10 Performance Measurement and Quality Assurance
Agency staff report a variety of data to meet agency and state requirements. Although respondents
understood the importance of the data and their utility in improving practice, some stated that it can
be difficult to meet expectations for regular data reporting. For example, some respondents
described the substantial amount of time required for data entry, which minimizes time they could
be spending with families on their caseload. One agency worker perceived that there was
overemphasis on data, stating, “It just seems like there’s just so much discussion about numbers and metrics, and
we’re forgetting about the people and the reality.” The worker underscored the importance of making time
to record data by continuing, “You have to record everything before you go home that night or else it didn’t
happen.” Respondents from two different agencies stated that time lags in the collection or reporting
of some required data can make it difficult to use the data effectively (e.g., agencies receive some
reports several years after data were collected).
Another reporting requirement is the MiTEAM
Fidelity Tool. Although some respondents
expressed support for and an understanding of the
value of the fidelity assessments, most respondents
across positions (i.e., directors, supervisors, workers)
and agencies, described challenges related to the
fidelity assessment process. Specifically, respondents
described limitations that included:
Substantial time and effort necessary to complete the Fidelity Tool and then not receiving feedback on areas of strength or in need of improvement (e.g., worker- or agency-level results).
Difficulty understanding how to use the tool, particularly when assessing new workers or workers in positions for which items in the Fidelity Tool may not apply (e.g., licensing).
Inability to complete the Fidelity Tool due to time limitations or extenuating circumstances (e.g., the case closed before the Fidelity Tool was completed, a worker resigned from his or her position before the supervisor submitted the Fidelity Tool).
Shifting attention from case management to completing the tool, which is viewed as an administrative task.
You put a lot of information in
[MiSACWIS] but you don't get a
whole lot of anything out of it…I
would have to singly click through
several pages in order to get bits
and pieces of compliance
information.
– Agency supervisor
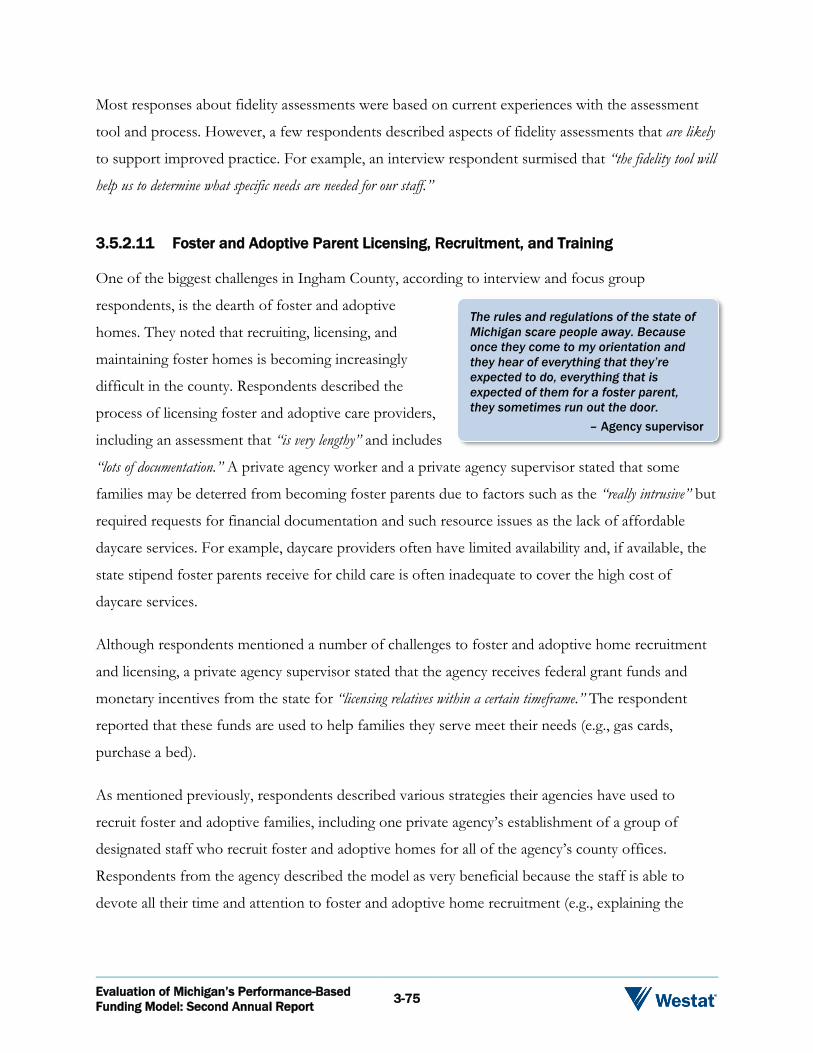
Evaluation of Michigan’s Performance-Based
Funding Model: Second Annual Report 3-75
Most responses about fidelity assessments were based on current experiences with the assessment
tool and process. However, a few respondents described aspects of fidelity assessments that are likely
to support improved practice. For example, an interview respondent surmised that “the fidelity tool will
help us to determine what specific needs are needed for our staff.”
3.5.2.11 Foster and Adoptive Parent Licensing, Recruitment, and Training
One of the biggest challenges in Ingham County, according to interview and focus group
respondents, is the dearth of foster and adoptive
homes. They noted that recruiting, licensing, and
maintaining foster homes is becoming increasingly
difficult in the county. Respondents described the
process of licensing foster and adoptive care providers,
including an assessment that “is very lengthy” and includes
“lots of documentation.” A private agency worker and a private agency supervisor stated that some
families may be deterred from becoming foster parents due to factors such as the “really intrusive” but
required requests for financial documentation and such resource issues as the lack of affordable
daycare services. For example, daycare providers often have limited availability and, if available, the
state stipend foster parents receive for child care is often inadequate to cover the high cost of
daycare services.
Although respondents mentioned a number of challenges to foster and adoptive home recruitment
and licensing, a private agency supervisor stated that the agency receives federal grant funds and
monetary incentives from the state for “licensing relatives within a certain timeframe.” The respondent
reported that these funds are used to help families they serve meet their needs (e.g., gas cards,
purchase a bed).
As mentioned previously, respondents described various strategies their agencies have used to
recruit foster and adoptive families, including one private agency’s establishment of a group of
designated staff who recruit foster and adoptive homes for all of the agency’s county offices.
Respondents from the agency described the model as very beneficial because the staff is able to
devote all their time and attention to foster and adoptive home recruitment (e.g., explaining the
The rules and regulations of the state of
Michigan scare people away. Because
once they come to my orientation and
they hear of everything that they’re
expected to do, everything that is
expected of them for a foster parent,
they sometimes run out the door.
– Agency supervisor
Evaluation of Michigan’s Performance-Based
Funding Model: Second Annual Report 3-76
process to potential foster families, offering encouragement and support to families), enabling
licensing workers to focus on other responsibilities.
3.5.2.12 Summary of Ingham County
The recurring theme among agency leaders, supervisors, workers, and partners in Ingham County is
that the priority is to provide optimal services to families with children in care by capitalizing on
community resources (e.g., strategic partnerships) and agency strengths (e.g., mentorship
opportunities, knowledge of experienced workers). Although respondents described many
challenges to service provision, they often countered them with suggestions for strategies to
overcome them (e.g., support to complete administrative tasks, increased shadowing).
Although the pilot is currently being implemented in Kent County only, interview and focus group
respondents in Ingham County provided valuable insights about child welfare agency processes that
may be important to consider if the model were to be implemented in Ingham County in the future.
For example, private agency workers in Ingham County reported that they are required to obtain
approval from Ingham County DHHS before certain services can be provided, and it can take a
substantial amount of time to receive approvals. The Kent Model was designed to grant approvals
expeditiously, and to provide more flexibility and innovation in service delivery (West Michigan
Partnership for Children, n.d.). Therefore, the Kent Model should improve turnaround times for
service approvals, if implemented in other counties as well.
The evaluation team will continue to examine qualitative data collected from key staff and
stakeholders in Ingham County during annual site visits to identify changes in agency structure and
policies, as well as child welfare practice. These data will be integrated into Ingham’s updated case
study and presented in subsequent reports.
3.5.3 Oakland County
In Oakland County, 42 percent of foster care services and 100 percent of adoption services are
managed by private agencies (Michigan Department of Health and Human Services, 2019). As in
Ingham County, the payment structure for child welfare services is applied in accordance with the
per diem model.
Evaluation of Michigan’s Performance-Based
Funding Model: Second Annual Report 3-77
During the most recent annual site visit, the evaluation team conducted interviews and focus groups
with agency directors/managers, supervisors, and workers from Oakland County DHHS and private
child-placing agencies in the county. Given that Oakland County DHHS contracts with over
20 child-placing agencies for foster care services, the evaluation team, in consultation with Oakland
County DHHS leadership, selected a sample of five private agencies with the largest foster care
population from which to collect process evaluation data. The evaluation team conducted interviews
and focus groups with clusters of Oakland County DHHS staff based on their role in the agency
(e.g., directors, supervisors, workers). Workers from four private agencies participated in one focus
group, while supervisors from six private agencies participated in another focus group. In addition,
stakeholders, including a county circuit court judge, a family attorney (e.g., defense attorney) who
also serves as a court-appointed special advocate and guardian ad litem, and a prosecutor,
participated in interviews.
During interviews and focus groups, respondents discussed resources, strategies, and challenges to
successful implementation of child welfare services. The sections that follow contain summaries of
the discussions.
Research Question 1: Do the Counties Adhere
to the State’s Guiding Principles in Performing
Child Welfare Practice?
Subquestion: What Resources (Strategies, Infrastructure) Are Necessary to Support the
Successful Delivery of Child Welfare Services?
3.5.3.1 Collaboration
Interview and focus group respondents in Oakland County described the range of collaborative
interagency partnerships that exist among staff in public and private child welfare agencies, with staff
from other agencies within and near Oakland County, and with staff in the county court system.
More than respondents in either Kent or Ingham counties, respondents in Oakland County reported
significant cross-county interaction with other public and private child welfare agency staff, as well
as with the courts. This section contains descriptions of the partnerships.
Evaluation of Michigan’s Performance-Based
Funding Model: Second Annual Report 3-78
Public and Private Agency Relationships
Representatives from Oakland County DHHS
collaborate with staff from 26 private agencies in
Oakland County for service provision and to secure
foster homes. Private agencies and Oakland County
DHHS also have partnerships with agencies in other
counties in the surrounding area. Staff from Oakland
County’s public and private agencies frequently communicate via email to discuss case progress,
milestones, and decisions. To facilitate lines of communication and to build rapport between public
and private agencies, Oakland County DHHS holds quarterly meetings with private agency leaders
and supervisors to discuss issues, performance goals, and to work together to resolve issues. In
addition to quarterly meetings, respondents from Oakland County DHHS discussed plans to offer
training sessions on-site at private agencies in the future.
Court System
Respondents from public and private agencies described collaboration with the county’s court
system as generally productive. Compared to surrounding counties, respondents reported that the
Oakland County court system runs well. For example, one respondent stated, “I don’t see as many of the
delays that I see in other counties, which it can [sic] create so many challenges.” Staff from Oakland County
DHHS interact daily with court attorneys to obtain general court guidance and ensure that petitions
are legally sufficient. Oakland County DHHS workers are required to submit reports to attorneys
two weeks before court hearings and include attorneys in family team meetings.
Supervision and Support
In addition to interagency partnerships, interview and focus group respondents described intra-
agency relationships. For example, respondents from public and private agencies highlighted the
importance of staff supervision and support in child welfare, which can support internal
collaborative processes. According to one private agency worker, “I think in this field, too you have to
have a supportive supervisor and a supervisor that knows what they’re doing.” Some supervisors reported
meeting with their staff biweekly and others monthly, to discuss case progress and review key
performance indicators. Oakland County DHHS respondents spoke about proactively working with
…to have everyone here show up for our
quarterly meetings where we can have a
discussion. Where we cannot just look at
issues, but also just talk about, ‘Now that
we’re here, what can we do to improve
things? What can we do to improve our
communication?’
– Agency Supervisor
Evaluation of Michigan’s Performance-Based
Funding Model: Second Annual Report 3-79
staff to reinforce the connection between data and child and family outcomes. “We’re just doing a little
bit more education and having more conversations because we’re seeing that there is a gap for some and they’re not
understanding,” reported one respondent.
3.5.3.2 Information Systems
Respondents from public and private agencies identified benefits of the state-mandated MiSACWIS
system in helping them manage case data. Overall, respondents from both public and private
agencies supported the idea of using a data management system with centralized information. Staff
reported that the platform improves case management and inter- and intra-agency communication.
According to one private agency respondent, “Utilizing a SACWIS system does work… everybody having
access to the same information, it works.” A worker noted that the ability to access full case records helps
to keep them informed about the nuances of cases, which in turn assists with the search for adoptive
families. A private agency supervisor noted that one positive aspect of MiSACWIS is that it can be
used to track case deadlines, stating, “I like that piece because I can use that to track what is due or what’s
coming up due, and my staff can do that as well.” Respondents reported that while MiSACWIS is not a
perfect system, it has improved and become more usable.
Public and private agency staff use MiSACWIS in quality assurance, monitoring, and accountability
efforts. Per MiSACWIS key performance indicators and the Book of Business (a component of
MiSACWIS), supervisors ensure that their staff’s service plans are up-to-date and that they conduct
timely face-to-face contacts. Supervisor reports of the frequency of meetings with their workers
ranges from weekly and bimonthly, with the purpose being to review performance. Staff from
Oakland County DHHS and private agencies also meet to review performance indicators at the
agency level. For example, one private agency respondent explained,
Every single time we meet, they bring [up performance indicators]. And they bring it up as a quarter, they put it up on a PowerPoint. They have every single agency listed. And they have it in a graph so you can see. And they have the goals and where everyone’s at. And then look at last quarter versus this quarter. And have a lot of conversation about how can we improve and, again, is it a training issue? Is it a resource issue? So we [have] a lot of conversation about that.
Evaluation of Michigan’s Performance-Based
Funding Model: Second Annual Report 3-80
Private agency staff note that Oakland County DHHS has strict standards for tracking data in
reports, more so than in neighboring counties. Respondents also reported that the Oakland County
courts have high expectations, particularly when compared to other counties, for workers to submit
court reports within a specific time window.
3.5.3.3 Foster Home Recruitment and Support
Interview and focus group respondents also described processes for managing foster care cases, and
recruiting and supporting foster families. In Oakland County, once foster care cases are transferred
to a private agency, Oakland County DHHS is required to review and approve placement exception
requests and service referrals. After case transfer, responsibility for service referrals rests with the
private agencies. Purchase of service (POS) monitors provide oversight of and manage all referrals
to contracted service providers. Thus, all private agency staff must work via POS monitors for any
service referral. POS monitors’ responsibilities include:
Approving service referrals requested by foster care workers (any service with an associated financial payment);
Advising workers on appropriate services and assisting them with referral and application processes; and
Tracking referral progress and following up with service providers to assess level of family engagement.
One stakeholder stated that placement of children with a relative or in a foster home depends on
agency type. According to the stakeholder, Oakland County DHHS is responsible for placement
with relatives and the private agencies are responsible for children placed in foster homes or licensed
relative placements. Public agency respondents reported that caseworkers are strongly encouraged to
seek out relatives when making placement decisions. As described by one respondent,
We really push and push and push and push staff in regards to looking at relatives or relative placements. Because oftentimes when they first come to us saying, ‘We can’t find a placement, we need a shelter, we need this.’ We push back, and we push back, until they dig deep and oftentimes they find someone so they don’t have to go through that whole process. And I think it’s important for kids to be with their relatives regardless.
Evaluation of Michigan’s Performance-Based
Funding Model: Second Annual Report 3-81
Substantial attention is paid to the recruitment, licensing, and retention of foster and adoptive
homes. Private agency staff conduct two recruitment events per month to raise awareness and
interest in becoming a foster parent. One private agency worker highlighted multiple community
events to recruit and retain foster homes, stating:
We do stuff for retention quarterly, at least. Our Trunk or Treat is coming up, which is partially retention. We do a Christmas party. We do an Easter egg hunt. We do a summer event, back-to-school. And the foster parents appreciate that stuff, and they come to it.
Overarching Research Question 2: Do Child
Placing Agencies Adhere to the MiTEAM
Practice Model When Providing Child Welfare
Services?
3.5.3.4 MiTEAM Practice Model
MiTEAM is the current practice model for all child welfare agencies, public and private, in Michigan.
The tenets of the MiTEAM practice model underscore the importance of serving families in a
manner that promotes inclusion, mutual respect, and recognition of each family’s unique strengths
and needs. Public and private agency workers, supervisors, and leaders in Oakland County described
their perceptions of the practice model and implementation of MiTEAM fidelity assessments, which
are summarized below.
MiTEAM Strengths and Challenges
Public and private agency staff responded positively about the general idea of the practice model.
“The idea is good. Like, it has a good concept,” reported one Oakland County DHHS supervisor. Staff
reported that the MiTEAM practice model aligns well with standard social work operating
procedures. Private agency leaders, supervisors, and workers reported seeing the benefit of
supervisors spending more time with their staff in the field and workers conducting family team
meetings. While respondent feedback was generally positive about the principles of the MiTEAM
model, some were critical of the practice model’s practicality; this theme was reported consistently
across the three counties. Public agency supervisors noted that some elements of the practice model
do not relate to the work their staff perform. For example, one respondent reported:

Evaluation of Michigan’s Performance-Based
Funding Model: Second Annual Report 3-82
We’re not social workers, we’re case managers… We’re investigators. And we investigate abuse and neglect. And this is what [sic] this model is truly for social workers. And it sounds great. I wish we could do all that work but we can’t.
Frontline staff also noted that the expectations to follow the MiTEAM model sometimes feels
unrealistic; specifically, workers stated that unique situations sometimes require innovative responses
that do not always align with MiTEAM competencies. As one respondent explained, “I feel that the
expectations are unrealistically [sic] because we do encounter situations where it’s not always going to be able to follow
the model exactly to the T.”
Oakland County currently has two MiTEAM specialists who respondents described as agency
leaders who coach staff on best practices to increase proficiency in MiTEAM competencies. One
respondent described the role of the specialists, stating:
Right now we have two MiTEAM specialists. And their role, obviously, is to really function as far as doing all MiTEAM related tasks. So they do some of our FTMs, as far as removals, they go out in the field with staff and observations.
MiTEAM specialists do not carry caseloads. One agency leader indicated that the MiTEAM
specialist position is changing to a MiTEAM quality assurance analyst position. The respondent
estimated that MiTEAM analysts will spend about 85 percent of their job focusing on data and data
quality, and 15 percent of their job on MiTEAM-oriented tasks.
3.5.3.5 Fidelity Assessments and Quality Service Reviews
MDHHS requires agencies to assess and report on the extent to which practice occurs as intended
as well as the quality of service provision. MDHHS conducted the most recent QSR in Oakland
County in September 2018, just prior to the evaluation team’s site visit. Because the evaluation site
visit took place within close proximity of the QSR visit, many agency staff were unable to distinguish
between QSR and evaluation data collection activities, assuming the latter was a follow-up to the
former, and expressed frustration at the substantial amount of time that was required to participate
in both efforts. In fact, in one group, respondents were quite vocal about this frustration; upon
reminding them that the focus group was voluntary, two staff got up and left the room.
Evaluation of Michigan’s Performance-Based
Funding Model: Second Annual Report 3-83
MiTEAM Fidelity Tool
MDHHS requires child welfare agencies throughout the state to collect and report on the extent to
which caseworkers implement the MiTEAM practice model, as intended. The MiTEAM practice
model requires all child welfare staff to document their use of four key competencies in their work:
Teaming, Engagement, Assessment, and Mentoring. Statewide, MDHHS assesses the extent to
which caseworkers implement the practice model as intended using the MiTEAM Fidelity Tool,
which is designed to be completed each quarter by supervisors on a random sample of cases; data
are uploaded to a state database. Public agency leaders and supervisors discussed criticisms of fidelity
assessments, such as the “very limited feedback” they receive after completing the assessments, and
that the fidelity tool “took up so much time from stuff that I needed to be working on, other stuff
that relates to [a] child’s safety.” One agency leader stated:
We’re spending a lot of time doing this. We’re kind of questioning if it’s actually sidetracking the process because they really see the benefit of spending more time with their staff out in the field coaching and helping them to be able to communicate effectively.
Other staff described the fidelity tool as helping as a coaching tool, but because cases are randomly
selected, those that are chosen are not the problematic ones. Obviously, the problematic cases
would benefit more from the shadowing activities, although there is value in shadowing other cases
as well, as staff benefit from any constructive and well-delivered feedback. But, as one supervisor
noted:
Even with the fidelity tool, it picks what cases we need to shadow which is hard because if I have a problem—if one of my workers has a problem case, I’m going to want to go out on that one, one, to support them, and two, to make sure that whatever needs to be handled is handled. I mean, and you can reject cases but if you reject a case, you need to tell them why. You got to have a good reason.
Finally, frontline staff noted that implementing the Fidelity Tool takes time – time which they would
prefer to spend working with children and families.
Quality Service Review (QSR)
In September 2018, the MDHHS’ Division of Continuous Quality Improvement conducted the
most recent QSR to comprehensively assess case practice in Oakland County. Sixteen cases were
randomly selected from a sample that was stratified based on children’s age, placement type, and
case status. Indicators of service quality are rated on a six-point rating scale; those scoring a four or

Evaluation of Michigan’s Performance-Based
Funding Model: Second Annual Report 3-84
higher are in the acceptable range, and those scoring a three or lower are in the unacceptable range
(Michigan Department of Health and Human Services, 2018). Of the 13 indicators, 8 of Oakland
County’s scores were in the acceptable range for at least 80 percent of cases. Indicators with
acceptable ratings were:
Safety: exposure to threats,
Safety: behavioral risk,
Stability,
Living arrangements,
Physical health,
Emotional functioning,
Learning and development, and
Independent living skills (Michigan Department of Health and Human Services, 2018).
One agency leader described the considerable amount of information about service quality that is
shared regularly during meetings:
They have every single agency listed. And they have it in a graph so you can see. And they have the goals and where everyone’s at. And then look at last quarter versus this quarter. And have a lot of conversation about how can we improve and, again, is it a training issue? Is it a resource issue? So we a lot of conversation about that.
Although not stated explicitly in interviews or focus groups, increased awareness about the quality of
services agencies provide, particularly when each agency can compare its performance to others, may
lead to increased efforts within each agency to identify its strengths and weaknesses and strategize
about how to address deficiencies and improve service quality.
Subquestion: What Factors Facilitate and Inhibit Effective Implementation of Child Welfare
Practice?
As mentioned previously, the effectiveness of child welfare practice varies based on factors that
include the quality of interagency partnerships and intra-agency characteristics. This section provides
a summary of factors that facilitate or inhibit child welfare service delivery in Oakland County.
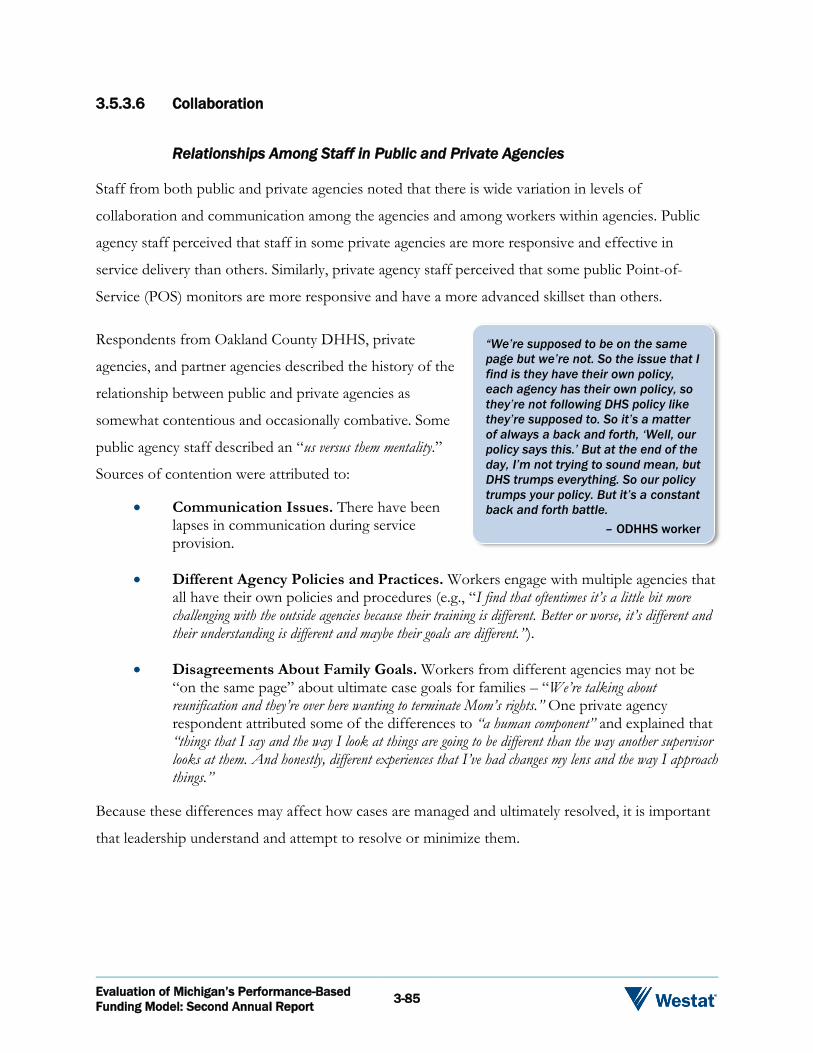
Evaluation of Michigan’s Performance-Based
Funding Model: Second Annual Report 3-85
3.5.3.6 Collaboration
Relationships Among Staff in Public and Private Agencies
Staff from both public and private agencies noted that there is wide variation in levels of
collaboration and communication among the agencies and among workers within agencies. Public
agency staff perceived that staff in some private agencies are more responsive and effective in
service delivery than others. Similarly, private agency staff perceived that some public Point-of-
Service (POS) monitors are more responsive and have a more advanced skillset than others.
Respondents from Oakland County DHHS, private
agencies, and partner agencies described the history of the
relationship between public and private agencies as
somewhat contentious and occasionally combative. Some
public agency staff described an “us versus them mentality.”
Sources of contention were attributed to:
Communication Issues. There have been lapses in communication during service provision.
Different Agency Policies and Practices. Workers engage with multiple agencies that all have their own policies and procedures (e.g., “I find that oftentimes it’s a little bit more challenging with the outside agencies because their training is different. Better or worse, it’s different and their understanding is different and maybe their goals are different.”).
Disagreements About Family Goals. Workers from different agencies may not be “on the same page” about ultimate case goals for families – “We’re talking about reunification and they’re over here wanting to terminate Mom’s rights.” One private agency respondent attributed some of the differences to “a human component” and explained that “things that I say and the way I look at things are going to be different than the way another supervisor looks at them. And honestly, different experiences that I’ve had changes my lens and the way I approach things.”
Because these differences may affect how cases are managed and ultimately resolved, it is important
that leadership understand and attempt to resolve or minimize them.
“We’re supposed to be on the same
page but we’re not. So the issue that I
find is they have their own policy,
each agency has their own policy, so
they’re not following DHS policy like
they’re supposed to. So it’s a matter
of always a back and forth, ‘Well, our
policy says this.’ But at the end of the
day, I’m not trying to sound mean, but
DHS trumps everything. So our policy
trumps your policy. But it’s a constant
back and forth battle.
– ODHHS worker
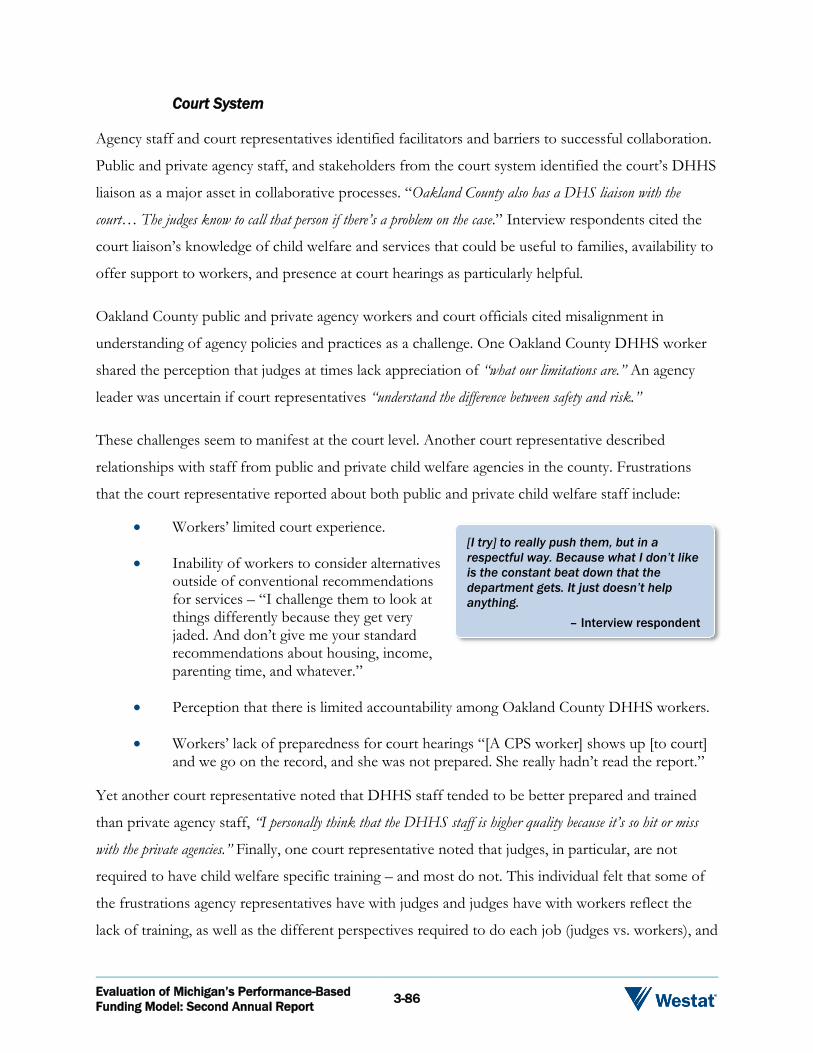
Evaluation of Michigan’s Performance-Based
Funding Model: Second Annual Report 3-86
Court System
Agency staff and court representatives identified facilitators and barriers to successful collaboration.
Public and private agency staff, and stakeholders from the court system identified the court’s DHHS
liaison as a major asset in collaborative processes. “Oakland County also has a DHS liaison with the
court… The judges know to call that person if there’s a problem on the case.” Interview respondents cited the
court liaison’s knowledge of child welfare and services that could be useful to families, availability to
offer support to workers, and presence at court hearings as particularly helpful.
Oakland County public and private agency workers and court officials cited misalignment in
understanding of agency policies and practices as a challenge. One Oakland County DHHS worker
shared the perception that judges at times lack appreciation of “what our limitations are.” An agency
leader was uncertain if court representatives “understand the difference between safety and risk.”
These challenges seem to manifest at the court level. Another court representative described
relationships with staff from public and private child welfare agencies in the county. Frustrations
that the court representative reported about both public and private child welfare staff include:
Workers’ limited court experience.
Inability of workers to consider alternatives outside of conventional recommendations for services – “I challenge them to look at things differently because they get very jaded. And don’t give me your standard recommendations about housing, income, parenting time, and whatever.”
Perception that there is limited accountability among Oakland County DHHS workers.
Workers’ lack of preparedness for court hearings “[A CPS worker] shows up [to court] and we go on the record, and she was not prepared. She really hadn’t read the report.”
Yet another court representative noted that DHHS staff tended to be better prepared and trained
than private agency staff, “I personally think that the DHHS staff is higher quality because it’s so hit or miss
with the private agencies.” Finally, one court representative noted that judges, in particular, are not
required to have child welfare specific training – and most do not. This individual felt that some of
the frustrations agency representatives have with judges and judges have with workers reflect the
lack of training, as well as the different perspectives required to do each job (judges vs. workers), and
[I try] to really push them, but in a
respectful way. Because what I don’t like
is the constant beat down that the
department gets. It just doesn’t help
anything.
– Interview respondent
Evaluation of Michigan’s Performance-Based
Funding Model: Second Annual Report 3-87
if there was a more “common base” from which each practiced (even a training that they were
required to complete together) some of these challenges could be resolved.
3.5.3.7 Systemic Factors
Respondents from public and private agencies provided insight on systemic factors that affect
service delivery, including staff turnover, caseloads, supervision and support, and training.
Staff Turnover
Respondents from Oakland County DHHS, private agencies, and the court system identified staff
turnover as a challenge to addressing the needs of children and families. Respondents stated that
turnover negatively affects child welfare workers’ capacity to take on new cases, limits their time to
manage the cases that they have, and impedes monitoring and accountability efforts. One agency
leader stated, “We’re always dealing with turnover.”
Public and private agency staff identified multiple factors they perceived are associated with staff
turnover, including high levels of stress because of the nature of the job. According to Oakland
County DHHS leaders, some employees simply do not fit in the fast-paced, high-pressure child
welfare environment. Others who are appropriate for this type of work often find it difficult to meet
the demands of the job. One respondent explained:
It’s like one or two weeks in after training and, ‘I just can’t, this it is too much.’ Because once the caseload gets to the normal pace, we had a lot of workers who just could not do it. The stress level. All the factors that come with the type of work that we do. The media. It’s a lot of pressure.
Some staff turnover within Oakland County DHHS was attributed to lateral movement—workers
seeking positions in other departments within the agency or positions in other counties. According
to public agency staff, once workers have a foot in the door at Oakland County DHHS, they
leverage their training and experience to obtain a new job. One interview respondent provided an
example, stating, “When Collections is hiring and Adult Services pulls people, we have a lot more people leave.”
Within private agencies, respondents reported that staff frequently leave their position to work in a
public agency. Both workers and directors attributed these movements to a discrepancy in pay
between private agencies and Oakland County DHHS, although both public and private agency staff
cited general dissatisfaction with pay as a contributing factor in worker turnover.

Evaluation of Michigan’s Performance-Based
Funding Model: Second Annual Report 3-88
When asked about factors related to worker retention in public and private agencies, despite the
challenges, respondents stated that helping children and families, and staff/co-worker support are
reasons for persevering in the job. Respondents from Oakland County DHHS also stated that the
agency has implemented new initiatives to address worker turnover, including MiTEAM subgroups
and an employee retention workroom.
Caseloads and Staff Support
Workers in Oakland County are expected to carry a maximum of 13 cases, although some workers
reported carrying up to 15 cases on occasion. Both public and private agency workers reported that
they are unable to perform all of their job duties and responsibilities within a normal workweek with
the 13:1 caseload ratio. According to one private agency worker, “sometimes you have to work more than
40 hours a week just to get everything done.” Workers cited an increasing amount of required data entry
per case as a major challenge. When asked what percentage of time a private agency worker typically
spends on paperwork, one response was nearly 80 percent.
Workers reported that even though they frequently need more than 40 hours per week to complete
job tasks and responsibilities, they do not receive overtime pay. Workers do have the option to
“flex” their time, however, reducing hours on specified workdays to offset workdays that exceed
eight hours. Workers reported that the flex time option was not helpful, as the flexed hours must be
used within a week. One worker described the challenge of using flex time with a full workload,
stating:
It seems counterintuitive that if you’re already overloaded and over extended to take time off. It’s not helpful. It’s not like you can lay around on the couch and read a book, like when you’ve got reports do and families to see.
When asked what would help with caseloads, public and private agency staff recommended the use
of case aides to assist with clerical and administrative tasks; this was also reported in Ingham.
Reports from private agency staff who currently use aides were generally positive. Oakland County
DHHS supervisors described past experiences with case aides in their agency as “utopia” and
“wonderful.”
In terms of staff support, Oakland County DHHS supervisors reported a lack of communication
between themselves and their section managers. Specifically, decisions about casework practice
Evaluation of Michigan’s Performance-Based
Funding Model: Second Annual Report 3-89
sometimes comes from “the top down” without consideration of supervisor opinions, despite the fact
that supervisors are knowledgeable about their workers’ skillsets and professional lives. This leads to
supervisors reporting feelings of being unsupported or unheard. For example, one supervisor stated,
“…they will completely bypass us, not ask our opinions, so it almost feels like we are not—like we have no say.”
Staff Training
Private agency supervisors and workers expressed concerns about the degree to which CWTI
training provides staff with the necessary knowledge, skills, and abilities to do their job effectively.
One worker described shadowing as a more effective way of learning, stating, “Everyone I’ve spoken to
says they learned more shadowing than they do actually at the training.” Another supervisor identified the
length of the training as an additional barrier, explaining:
I think the training can be a barrier for new workers, too, because it’s so long and they’re out of the office for such a [sic] extended period of time that they don’t really get that—I mean, they have mentors and such, but the amount of time that they’re at CWTI really impacts their ability to learn the day-to-day operations of how foster care works.
Public and private agency staff also perceived that MiTEAM training is too long and has limited
utility. One worker described the training as, “kind of one size fits all training ... I don’t feel like it was
effective for what they were trying to communicate.”
Some public and private agency staff highlighted gaps between training offered and training needs
for both workers and foster parents. For example, one private agency director reported that training
on handling behavioral problems would be beneficial for both workers and foster parents,
explaining:
We have been looking at different models that we could implement here because I don’t feel that the staff have what they need in order to be successful. I feel like it’s very challenging to have a child in your home who is exhibiting behaviors, and I don’t think our staff ever get the training to be able to really pick up the phone or sit with a foster parent and say, ‘This is how you solve that problem.’ They don’t. It doesn’t exist.
Another interview respondent suggested that child welfare staff could benefit from having guidance
on how to interact with court system representatives, including judges and prosecutors. The
respondent expressed, “[Oakland County DHHS] workers don’t always like talking to attorneys. I think
somewhere in some of their training, they’re taught that attorneys are scary and they shouldn’t have to tell them
anything and not to trust them and it really shows.”
Evaluation of Michigan’s Performance-Based
Funding Model: Second Annual Report 3-90
Child Welfare Service Delivery
Private agency respondents described POS monitors as frequently unresponsive and difficult to
contact via phone or email. Further, they reported that the communication challenges impede their
ability to move forward with cases. As one respondent stated, “I always just kind of feel like we’re on the
front line doing all of the work and like, please just sign my DOC… I can’t do my job until you do yours.” Private
agency workers reported that they often handle communication challenges and non-responsiveness
by sending email correspondence, to have a record of communication attempts, and escalating
requests to public agency supervisors or other agency leaders.
From the perspective of the POS monitors, there is variation in the degree to which Oakland
County DHHS and private agency workers communicate effectively and coordinate to deliver
services. For example, when providing case oversight, workers from some agencies provide more
case information to monitors than others. In addition to variations in level of interactions between
POS monitors and private agency staff, public agency monitors reported that they are sometimes
excluded from important case junctions, such as meetings about placement changes or family team
meetings. Public agency monitors also reported feeling burdened by the high level of oversight they
must conduct. According to one frontline worker:
I will definitely say for sure, I’ve had a lot of difficulties with private agencies, even just trying to make sure they’re actually doing the work they’re required to do as well per policy. I feel like I have to be a dictator by reaching out to them…
Private and public agency respondents on all levels cited the need for additional services for children
and families in Oakland County. As one Oakland County DHHS supervisor stated, “We need more
services, always and forever.” Services most needed included in-home intervention programs, which were
described as especially important in preventing removals. In addition, respondents reported the need
for more parenting classes and in-home clinical counseling, such as Families Together/Building
Solutions (FTBS) and Families First. One worker reported a long wait for certain services: “The
waiting list for FTBS is too long that the family can go almost 20 days with no services.” When there are
openings, demand severely outweighs supply.
Evaluation of Michigan’s Performance-Based
Funding Model: Second Annual Report 3-91
3.5.3.8 Information Systems
MiSACWIS
While public and private agency staff described some of the benefits of using MiSACWIS,
respondents also highlighted a number of perceived inefficiencies in the system. They reported that
MiSACWIS requires a substantial amount of data entry and “clicking” through several screens or
sections, and that the system is not very user friendly. As a result, workers reported that they spend a
lot of time doing paperwork. Respondents reported that the success and usefulness of MiSACWIS is
contingent on all users uploading accurate and timely information, which does not always happen.
Private agency staff reported that data entry errors and delayed document uploading translate into
unnecessary delays in obtaining service approvals, refusal of services, or higher costs for services.
One worker stated:
It’s a system that has so many moving parts, and you need everybody to be kind of engaged in those moving parts. And if you have one cog in the wheel, it stops, and then it just becomes more of a headache than a help to our work.
3.5.3.9 Foster and Adoptive Home Recruitment and Support
Interview and focus group respondents described challenges related to managing foster care cases,
and recruiting and supporting foster families. For example, when public agency staff need to engage
private agencies for foster homes, some workers perceived that private agencies “cherry-pick” cases
depending on the case goal—termination or reunification. Oakland County DHHS respondents
reported that the “cherry picking” of cases is motivated by private agencies that have “foster families
that want to adopt.” They described this dynamic as “very frustrating because when we go to remove a child, like
I said, we’re not looking to terminate if we don’t have to.” Relatedly, Oakland County DHHS staff voiced
concerns over occasional differences between staff in public and private agencies on their personal
feelings, as opposed to policy guidelines, about whether to reunify the child and parents or terminate
parental rights, particularly since they may affect outcomes. A similar dynamic was reported in
Ingham.
Respondents from both public and private agencies reported that private agency staff were hesitant
to “borrow beds” for Oakland County DHHS placements. Private agency staff attributed the hesitancy
to financial concerns. As one private agency worker stated, “We don’t do borrowed beds with DHS because
no one ever gets paid. We pay the foster parent but we never get paid for it.”
Evaluation of Michigan’s Performance-Based
Funding Model: Second Annual Report 3-92
Many private agency workers reported a number of challenges to successful foster home and
adoptive recruitment, licensing, and retention efforts. Respondents from both public and private
agencies reported difficulty maintaining enough licensed homes for children needing out-of-home
care. One Oakland County DHHS respondent stated, “Our biggest issues now with that is that nobody has
enough [foster] homes.” A respondent from a private agency supported the sentiment and indicated that
at the time of data collection, foster care home availability was lower than usual, stating, “I don’t have
the homes…I have very few homes. This is the least amount of homes that I’ve had since I’ve ever worked here.”
Respondents reported particular difficulty finding homes for certain subpopulations, including:
Teenagers,
Children with special needs, and
Large sibling groups.
Respondents from private agencies cited foster parents’ perceived lack of financial support as a
major barrier to recruitment and retention. Agency workers also described child care funding for
foster parents as inadequate. “We’re not giving foster parents enough. They want to be supported,” reported
one supervisor. A respondent noted that the dollar amount that foster parents receive to support
children in care has stagnated over the years:
Since the time I’ve been in the field, we’ve only increased the rate for foster parents, I believe, one time. We’ve never increased the amount that they get for determination of care. We have never increased the amount that they receive for clothing allowance in the time that I’ve been working there. And in fact, the clothing inventory sheet that we use, that is the state process to say this is how many pieces of clothing a child should have, has never been revised since I’ve worked here. So that hasn’t caught up.”
Private agency staff reported that foster parents are frequently recruited through word of mouth;
one respondent estimated that 95 percent of families are recruited this way. While this recruitment
strategy can be beneficial when foster parents have positive experiences, it can also be detrimental to
recruitment efforts when foster parents have unsatisfactory experiences. According to one private
agency respondent, “foster parents are at the point now where they don’t want to recruit people. They can’t imagine
asking somebody to do the job that they’re currently doing.” Other respondents reported fear of state scrutiny
may be a reason that parents hesitate to become licensed foster care providers. One respondent
stated that due to concerns about maltreatment in care, the respondent’s agency has a specialized
unit to conduct maltreatment investigations when children are placed in foster homes. Parents fear
the investigation, with the belief that the unit “is out to get” them. Private agency respondents also
Evaluation of Michigan’s Performance-Based
Funding Model: Second Annual Report 3-93
cited a generally negative societal view of the child welfare/foster care system as a challenge to
recruiting and retaining foster homes.
3.5.3.10 Summary of Oakland County
Information in this section should be interpreted with caution, as data collection in Oakland County
was structured differently than how it was structured in Ingham and Kent counties. For example,
workers from four private agencies participated in one focus group, and supervisors from six private
agencies participated in another focus group. Ideally, for each agency selected for participation in
site visit activities, the evaluation team conducts a series of interviews and focus groups, each
composed of respondents with a similar role in the agency (e.g., agency leaders, supervisors, and
workers). Each series of interviews and focus groups is conducted with a single agency’s staff. Data
collection is set up this way because having multiple staff from one agency share feedback about
inter- and intra-agency processes and activities, strengths, challenges, and other elements enables the
evaluation team to identify similarities and differences within and across agencies in the county, and
to delve more deeply into agency-specific characteristics and functioning. The converse may occur
with participants from across agencies participating in groups together.
During interviews and focus groups in Oakland County, agency leaders, supervisors, workers, and
partners in Oakland County described barriers (e.g., staff turnover, high caseloads) and facilitators
(e.g., support from superiors) to providing services effectively to families with children in care, as
well as agency and county processes and structures. The evaluation team will continue to examine
qualitative data collected from key staff and stakeholders in Oakland County during annual site visits
to identify changes in agency processes and policies, and changes in child welfare practice.
3.6 Cross-County Comparisons: Similarities and Differences
Kent, Ingham, and Oakland counties vary widely relative to certain characteristics, including racial
and ethnic composition, rate of confirmed cases of child abuse and neglect, and family poverty
status. Populations range from just under 300,000 people in Ingham County to over 1 million people
in suburban Oakland County. Although there may be variation in the number of families with
children in care, each county’s locale (e.g., rural, suburban), and other community characteristics,
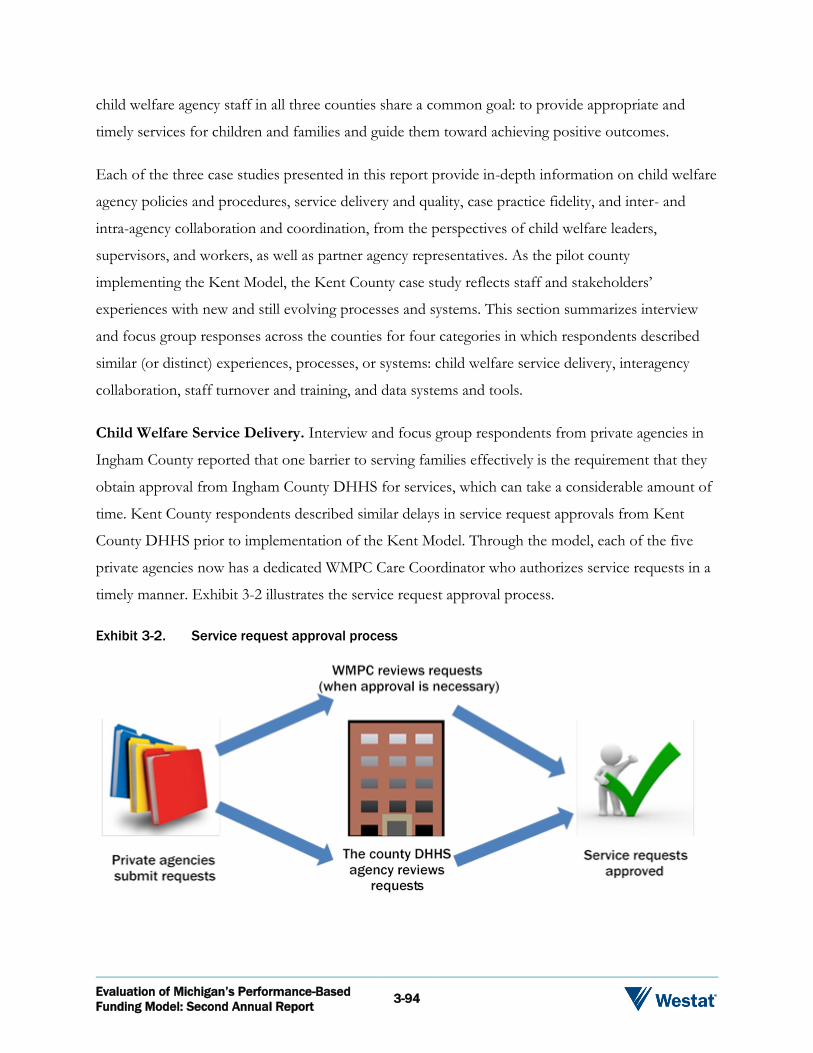
Evaluation of Michigan’s Performance-Based
Funding Model: Second Annual Report 3-94
child welfare agency staff in all three counties share a common goal: to provide appropriate and
timely services for children and families and guide them toward achieving positive outcomes.
Each of the three case studies presented in this report provide in-depth information on child welfare
agency policies and procedures, service delivery and quality, case practice fidelity, and inter- and
intra-agency collaboration and coordination, from the perspectives of child welfare leaders,
supervisors, and workers, as well as partner agency representatives. As the pilot county
implementing the Kent Model, the Kent County case study reflects staff and stakeholders’
experiences with new and still evolving processes and systems. This section summarizes interview
and focus group responses across the counties for four categories in which respondents described
similar (or distinct) experiences, processes, or systems: child welfare service delivery, interagency
collaboration, staff turnover and training, and data systems and tools.
Child Welfare Service Delivery. Interview and focus group respondents from private agencies in
Ingham County reported that one barrier to serving families effectively is the requirement that they
obtain approval from Ingham County DHHS for services, which can take a considerable amount of
time. Kent County respondents described similar delays in service request approvals from Kent
County DHHS prior to implementation of the Kent Model. Through the model, each of the five
private agencies now has a dedicated WMPC Care Coordinator who authorizes service requests in a
timely manner. Exhibit 3-2 illustrates the service request approval process.
Exhibit 3-2. Service request approval process

Evaluation of Michigan’s Performance-Based
Funding Model: Second Annual Report 3-95
Interagency Collaboration. In Kent and Ingham counties, respondents described collaboration
among child welfare agencies and community partners as occurring partly through interagency
councils. For example, in Kent County, the County Administrator and representatives from Kent
County DHHS private child-placing agencies, the court system, mental health, and foundations
convene quarterly through the Kent County Family and Children’s Coordinating Council. In Ingham
County, representatives from many of the same agencies (Ingham County Department of Health
and Human Services, private child-placing agencies, court system, and mental health) meet quarterly
through the Child Welfare Coordinating Council. Respondents reported that regular interagency
meetings provide an opportunity for sharing agency-specific information and updates. In Kent
County, respondents expressed appreciation for WMPC’s level of collaboration, particularly as the
newest community partner and administrator of the Kent Model.
There were similarities and differences across counties in the quality of interagency partnerships.
While respondents in Ingham County described generally positive relationships among staff in
public and private agencies, attributed to factors such as longstanding partnerships and Ingham
County DHHS’s facilitation of interagency meetings or trainings, in Oakland County, respondents
reported tensions in public-private agency staff relationships, which suggest that these may need
strengthening. In Oakland County, one concern that respondents described is differences among
agency staff in ideologies that may influence case decisions and subsequent child and family
outcomes (e.g., ”Things that I say and the way I look at things are going to be different than the way another
supervisor looks at them.”). Respondents from the three counties agreed that communication issues
made effective collaboration between public and private child welfare agencies a challenge. For
example, respondents mentioned the need for better channels of communication in Kent County,
frustration with unresponsiveness in Ingham County, and lapses in communication in Oakland
County.
Descriptions of relationships between child welfare agencies and the county court system were also
mixed. While child welfare respondents in Oakland County described collaboration with the court
system as productive and the DHHS liaison as a key contributor to effective partnering, child
welfare respondents in Kent and Ingham counties described major challenges to working with their
respective court system. For example, respondents in Kent County expressed concerns about poor
treatment of foster care workers by judges and attorneys during court testimony, and respondents in
Ingham County described workers’ intimidation with the court process.

Evaluation of Michigan’s Performance-Based
Funding Model: Second Annual Report 3-96
Staff Turnover and Training. Respondents in Kent,
Ingham, and Oakland counties described staff turnover
as a major challenge to serving families with children in
care effectively. Although agency staff who remain in
their positions for a number of years, often because they
want to help children and families, respondents reported
that it can be difficult to remain in a high-stress position with long hours and inadequate
compensation over time. Across counties, respondents stated that private agency staff frequently
seek positions in public agencies for improved salaries and benefits, or child welfare staff seek less
stressful positions.
As agency staff move to different positions within the same agency, some respondents in Kent
County noted that it would be helpful to receive training or more guidance around the new
responsibilities. Additionally, Kent County DHHS staff reported that it would be helpful to have
more training and guidance on the Kent Model to increase awareness of changing expectations and
requirements. Across the three counties, respondents described opportunities to participate in
trainings on a number of topics to improve child welfare practice. Some trainings are optional while
others are mandated by either a public or private county agency or MDHHS. Respondents identified
a number of trainings that would be useful as well as ways in which required trainings could be
improved, including:
Increased opportunities for shadowing or observations during CWTI training,
More training on MiSACWIS that delves into specific system components, and
Guidance on court processes and interactions with court representatives.
Data Systems and Tools. When asked about the utility of MiSACWIS, respondents stated that
although the state-mandated data system has improved over time, more improvements are needed.
Agency staff in Ingham and Oakland counties stated that having a central system for storing and
accessing case documents is one of the benefits of MiSACWIS, while respondents in Kent County
noted that the system made some aspects of their work easier. Additionally, respondents in Ingham
and Oakland counties stated that they use MiSACWIS’ Book of Business—for workers to monitor
progress toward completing tasks in Ingham County, and as part of supervision in Oakland County.
Turnover Effects
Constant case reallocations
Increased workload and stress
Compromised service quality
Difficulty building family trust
Inadequate support for new staff
Inadequate time for data reporting

Evaluation of Michigan’s Performance-Based
Funding Model: Second Annual Report 3-97
In terms of challenges to using MiSACWIS, respondents in both Kent and Oakland counties
identified the number of “clicks” that are often necessary to navigate the system as excessive and
time-consuming. Additionally, respondents in Oakland and Ingham counties acknowledged that the
ability of system users to access valid and reliable information depends on the extent to which other
users enter complete and accurate information in a timely manner, which does not always happen.
Respondents in all three counties expressed frustration that MiSACWIS is not user-friendly and
requires a substantial amount of time to enter data.
MDHHS also mandates that agencies use the state’s Fidelity
Tool and data system to assess and report the extent to
which workers implement the MiTEAM practice model as
intended. Respondents from all three counties discussed the
time necessary to complete the Fidelity Tool and were aware of the types of data yielded from the
assessments, but they expressed disappointment that they do not receive feedback from the
assessments that could help them improve practice. Additionally, respondents in Kent and Ingham
counties noted that questions in the Fidelity Tool do not apply to certain positions, such as licensing
workers, as they do not work directly with families.
Summary. Kent, Ingham, and Oakland counties differ in a number of ways, including
demographics, locales, populations, and foster care privatization rates. Despite the differences,
agency leaders, supervisors, workers, and partner agency staff described a number of similar agency
processes and experiences, which may help MDHHS strategize about how to support agency staff
throughout the state.
Fidelity Assessment Challenges
Time-consuming
Does not apply to all positions
Tool is not user-friendly
Evaluation of Michigan’s Performance-Based
Funding Model: Second Annual Report 4-1
4. Evaluation Year 2: What Do The Data Tell Us?
4.1 Evaluation Goals and Status
Westat and its partners, the University of Michigan School of Social Work, and Chapin Hall at the
University of Chicago, completed the second year of a rigorous five-year evaluation of the Kent
Model. Through the multi-year evaluation, the evaluation team is examining three aspects of Kent
Model implementation:
1. Contextual information about the provision of foster care services through the process evaluation;
2. The extent to which foster care service delivery is cost effective through the cost study; and
3. Changes in child safety, permanency, and stability through the outcome study.
Relevant data for Kent County are compared with data for all other counties in Michigan for the
cost (e.g., expenditures, level of care) and outcome studies (e.g., maltreatment rates for matched
comparison groups across the state), while the evaluation team gathers in-depth information on
foster care service provision among three counties in Michigan for the process evaluation. Of central
interest for the process evaluation is how various inter- and intra-agency factors affect service
delivery in Kent, Ingham, and Oakland counties. As illustrated in the evaluation logic model
(Appendix 1), increased knowledge of changes in the three interrelated evaluation components
enables MDHHS and other stakeholders to make more data-driven decisions about how to ensure
that families with children in care receive appropriate and timely services. Increased participation in
these types of high-quality services is expected to lead to improved child and family outcomes.
4.2 Summary of Evaluation Findings
Kent, Ingham, and Oakland counties vary across several characteristics, such as foster care funding
mechanisms (performance-based in Kent County, per diem in Ingham and Oakland counties),
population (ranging from under 300,000 people in Ingham County to over one million people in
Oakland County), and rates of confirmed victims of child abuse and neglect. For 2019, the number
of confirmed victims is below the state rate of 18.9 per 1,000 children in Oakland County (8.4), but
above the state rate in Kent (19.8) and Ingham Counties (31.5). Across counties, respondents

Evaluation of Michigan’s Performance-Based
Funding Model: Second Annual Report 4-2
described staff turnover as a major challenge to serving families effectively. Respondents associated
high turnover, due to factors such as low salaries and high stress, with such consequences as
inadequate service quality, which can lead to placement instability. Respondents agreed that turnover
is a challenge but acknowledged steps being taken to address it at the state level (e.g., professional
development) and locally (e.g., MiTeam subgroups).
Similarities and differences among the counties in composition and child welfare agency
characteristics and experiences are important to consider relative to the goals of the Kent Model.
The impetus for the shift from a per diem to a performance-based funding model is the Michigan
Legislature’s priority to improve child welfare outcomes through increased flexibility and innovation
in service provision for families with children in care. Although the performance-based model is
currently being piloted in Kent County, stakeholders should understand and consider contextual
variables that may affect service delivery (and related costs and outcomes), if the model were to be
implemented in other Michigan counties in the future.
During interviews and focus groups conducted as part of the process evaluation, respondents in
Kent County reported that over the past year, they observed more innovative thinking about
services during case planning and fewer bureaucratic barriers preventing them from identifying
creative solutions to addressing family needs. Caseworkers also increased reliance on Enhanced
Foster Care as a primary method of stabilizing placements and supporting high-need foster children
and caregivers.
Respondents in Kent County described the nature of interactions between child placing agencies
and the WMPC, the entity supporting and providing oversight of the Kent Model, over the past
year. They indicated that communication among agency and WMPC staff is frequent and effective,
and respondents from nearly all of the child placing agencies described the collaboration as strong.
Additionally, through the Kent Model, each of the five child placing agencies in Kent County has a
designated WMPC Care Coordinator who authorizes service requests, when required, and as
reported by respondents, in less time than was typical prior to the model’s launch. Although
respondents in Kent County described challenges to the new service authorization process (e.g.,
learning curve for some WMPC and private agency staff), they also report that the new process has
facilitated child welfare practice in several ways (e.g., increased efficiency and timeliness of services).
Evaluation of Michigan’s Performance-Based
Funding Model: Second Annual Report 4-3
In contrast, respondents in child placing agencies in Ingham County reported that the considerable
time lag between service requests and approvals can be a barrier to serving families effectively.
Although agency staff from child placing agencies in Kent County appreciate the ease with which
service requests are approved when required, they are cognizant that the funds are not unlimited. As
one respondent expressed, “I am worried about like, I’m going to run out of money?” Cost study findings
indicate that expenditures in Kent County increased between baseline (fiscal year 2017) and the first
year of Kent Model implementation (fiscal year 2018). Over this period, total expenditures in Kent
County increased by 51 percent for out-of-home placement services. Between fiscal years 2017 and
2018, expenditures for maintenance of congregate care increased by 51 percent and the number of
days children spent in care increased by 17 percent. These increases are being carefully examined
through the cost study to determine what factors are accounting for them. Findings will be used to
assist the WMPC to understand and address these increasing costs effectively.
There were significant differences in outcomes between children served by child placing agencies in
Kent County and those in a matched comparison group, in which at least 80 percent of services
were provided by a child placing agency in a Michigan county other than Kent County. Specifically,
among children who entered care after the launch of the Kent Model (October 2017), those in Kent
County were more likely than children in the comparison group to achieve permanency and exit care
in fewer days. Children in Kent County were also significantly less likely to experience more than
one placement change than their peers in other Michigan counties during the same period.
4.3 Next Steps
Evaluation data collected during the second year of the evaluation (first full year of Kent Model
implementation) provided detailed information on service delivery costs, child and family outcomes,
and processes associated with service planning and implementation. During subsequent waves of the
evaluation, the evaluation team will continue to identify and explicate factors associated with
improved outcomes for children and families in Michigan. For example, the theory underscoring the
Kent Model is that increased flexibility and innovation in service delivery is likely to lead to
improved outcomes for families with children in care. It is helpful to understand findings within and
across the process, outcome, and cost studies. For example, as mentioned previously, agency staff
from child placing agencies in Kent County support new service approval processes but

Evaluation of Michigan’s Performance-Based
Funding Model: Second Annual Report 4-4
acknowledge they do not have an unlimited pool of funds for services. Relatedly, cost study findings
indicated there were increases in Kent County’s expenditures through the first full year of Kent
Model implementation. Through the process evaluation, the evaluation team could attempt to
unpack agency staff perceptions of service needs relative to costs. Through future interviews and
focus groups, for example, the evaluation team could gauge agency staff knowledge of and
expectations related to service expenditures and how (or if) the awareness influences the services
they recommend to the families they serve.
Increased understanding of changes within and across the three evaluation components will provide
a complete picture of how and why agency processes are associated with changes in costs and
outcomes.
Evaluation of Michigan’s Performance-Based
Funding Model: Second Annual Report R-1
References
Guevara Warren, A.S. (2019). 2019 Kids count in Michigan data book: What it’s like to be a kid in Michigan. Lansing, Michigan: Michigan League for Public Policy. Retrieved from https://mlpp.org/wp-content/uploads/2019/04/2019-kcdb-master-1.pdf
Michigan Department of Health and Human Services (2018 February). Quality Service Review: Ingham County.
Michigan Department of Health and Human Services (2019 March). Children Services Administration – CPA/DHHS Split.
West Michigan Partnership for Children (n.d.). Program operations guide: FY 2018. Retrieved May 6, 2019, from https://www.wmpc.care/wp-content/uploads/2018/06/WMPC-Program-Operations-Guide-F18_v.3.pdf

Appendix 1
PBCWS Logic Model
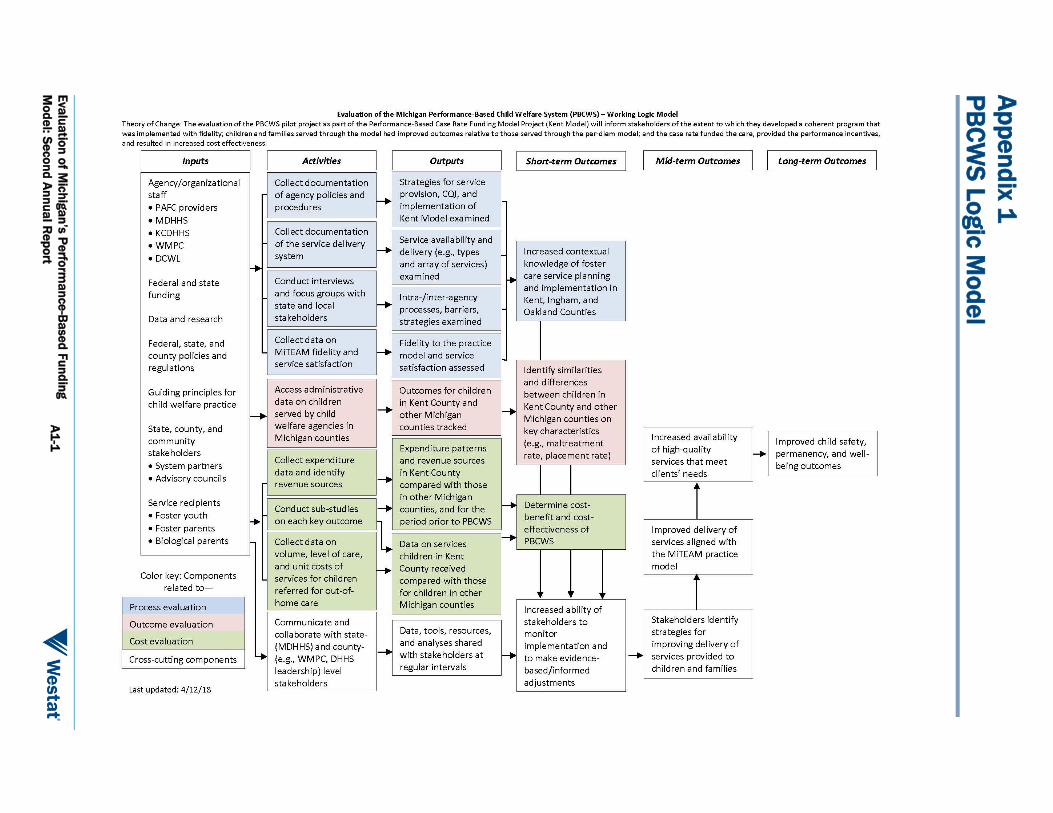
Eva
lua
tion
of M
ich
iga
n’s
Pe
rform
an
ce
-Ba
se
d F
un
din
g
Mo
de
l: Se
co
nd
An
nu
al R
ep
ort
A1
-1
Ap
pe
nd
ix 1
PB
CW
S L
og
ic M
od
el

Appendix 2
The Evaluation Plan
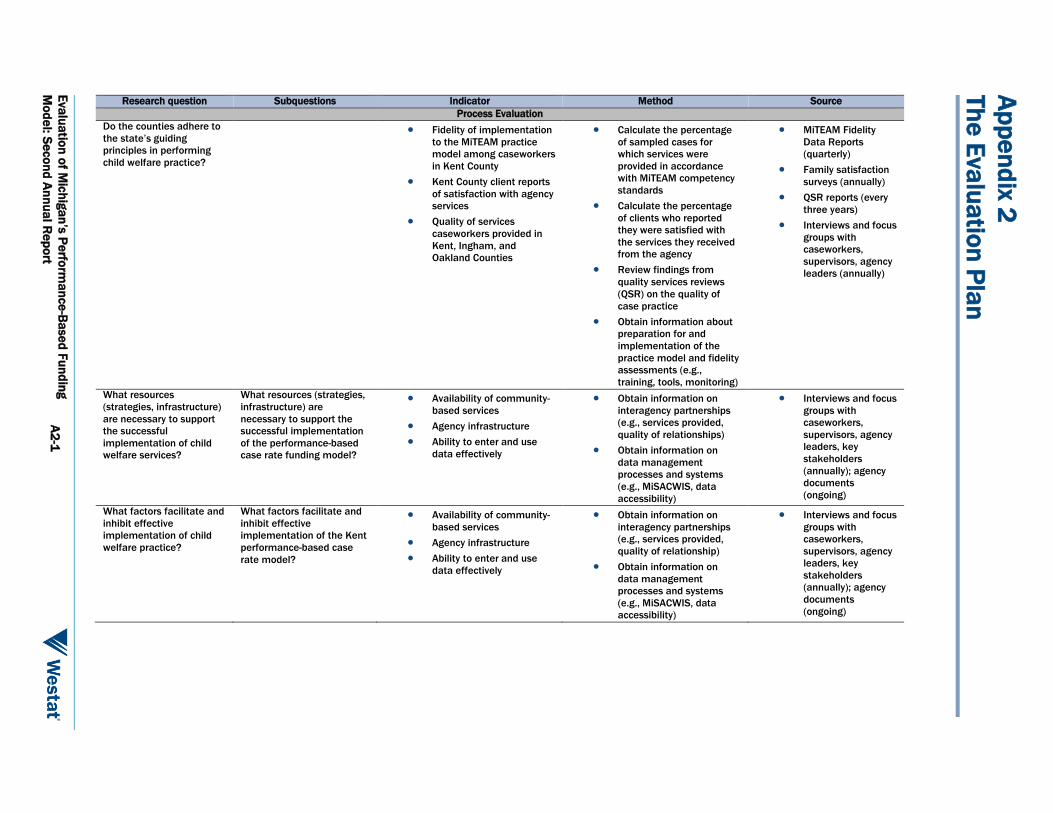
Eva
lua
tion
of M
ich
iga
n’s
Pe
rform
an
ce
-Ba
se
d F
un
din
g
Mo
de
l: Se
co
nd
An
nu
al R
ep
ort
A2
-1
Research question Subquestions Indicator Method Source
Process Evaluation
Do the counties adhere to
the state’s guiding
principles in performing
child welfare practice?
Fidelity of implementation
to the MiTEAM practice
model among caseworkers
in Kent County
Kent County client reports
of satisfaction with agency
services
Quality of services
caseworkers provided in
Kent, Ingham, and
Oakland Counties
Calculate the percentage
of sampled cases for
which services were
provided in accordance
with MiTEAM competency
standards
Calculate the percentage
of clients who reported
they were satisfied with
the services they received
from the agency
Review findings from
quality services reviews
(QSR) on the quality of
case practice
Obtain information about
preparation for and
implementation of the
practice model and fidelity
assessments (e.g.,
training, tools, monitoring)
MiTEAM Fidelity
Data Reports
(quarterly)
Family satisfaction
surveys (annually)
QSR reports (every
three years)
Interviews and focus
groups with
caseworkers,
supervisors, agency
leaders (annually)
What resources
(strategies, infrastructure)
are necessary to support
the successful
implementation of child
welfare services?
What resources (strategies,
infrastructure) are
necessary to support the
successful implementation
of the performance-based
case rate funding model?
Availability of community-
based services
Agency infrastructure
Ability to enter and use
data effectively
Obtain information on
interagency partnerships
(e.g., services provided,
quality of relationships)
Obtain information on
data management
processes and systems
(e.g., MiSACWIS, data
accessibility)
Interviews and focus
groups with
caseworkers,
supervisors, agency
leaders, key
stakeholders
(annually); agency
documents
(ongoing)
What factors facilitate and
inhibit effective
implementation of child
welfare practice?
What factors facilitate and
inhibit effective
implementation of the Kent
performance-based case
rate model?
Availability of community-
based services
Agency infrastructure
Ability to enter and use
data effectively
Obtain information on
interagency partnerships
(e.g., services provided,
quality of relationship)
Obtain information on
data management
processes and systems
(e.g., MiSACWIS, data
accessibility)
Interviews and focus
groups with
caseworkers,
supervisors, agency
leaders, key
stakeholders
(annually); agency
documents
(ongoing)
Ap
pe
nd
ix 2
Th
e E
valu
atio
n P
lan
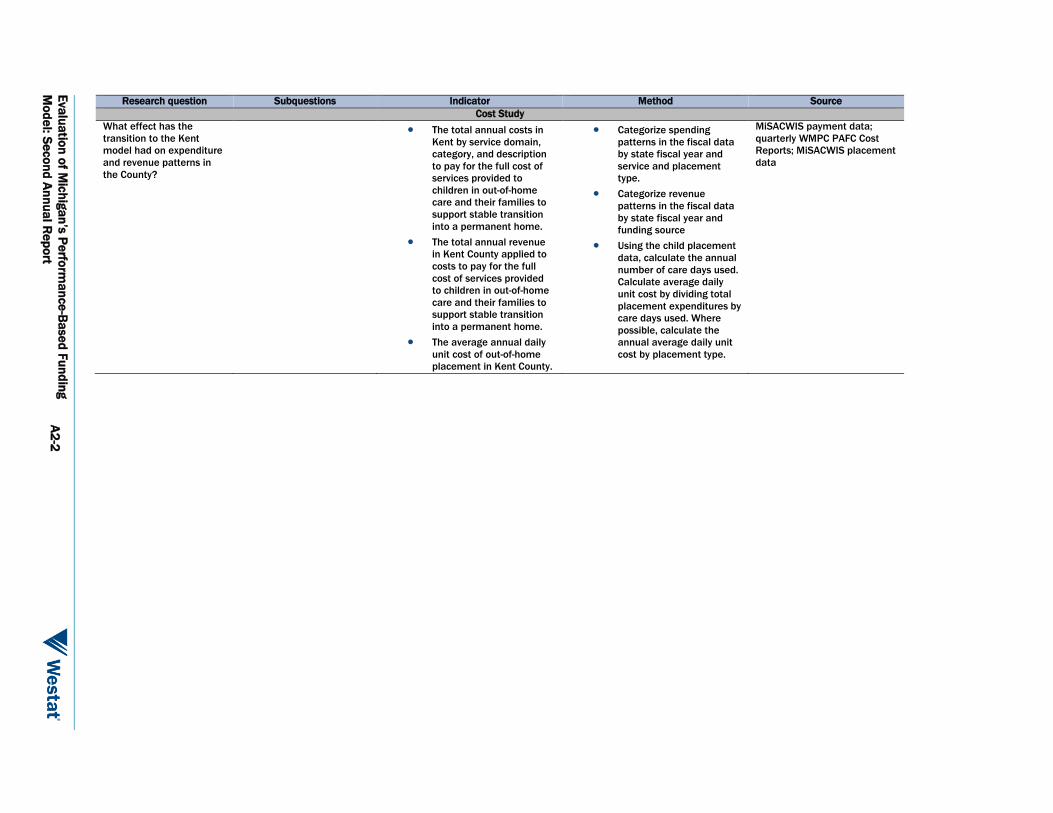
Eva
lua
tion
of M
ich
iga
n’s
Pe
rform
an
ce
-Ba
se
d F
un
din
g
Mo
de
l: Se
co
nd
An
nu
al R
ep
ort
A2
-2
Research question Subquestions Indicator Method Source
Cost Study
What effect has the
transition to the Kent
model had on expenditure
and revenue patterns in
the County?
The total annual costs in
Kent by service domain,
category, and description
to pay for the full cost of
services provided to
children in out-of-home
care and their families to
support stable transition
into a permanent home.
The total annual revenue
in Kent County applied to
costs to pay for the full
cost of services provided
to children in out-of-home
care and their families to
support stable transition
into a permanent home.
The average annual daily
unit cost of out-of-home
placement in Kent County.
Categorize spending
patterns in the fiscal data
by state fiscal year and
service and placement
type.
Categorize revenue
patterns in the fiscal data
by state fiscal year and
funding source
Using the child placement
data, calculate the annual
number of care days used.
Calculate average daily
unit cost by dividing total
placement expenditures by
care days used. Where
possible, calculate the
annual average daily unit
cost by placement type.
MiSACWIS payment data;
quarterly WMPC PAFC Cost
Reports; MiSACWIS placement
data

Eva
lua
tion
of M
ich
iga
n’s
Pe
rform
an
ce
-Ba
se
d F
un
din
g
Mo
de
l: Se
co
nd
An
nu
al R
ep
ort
A2
-3
Research question Subquestions Indicator Method Source
How does the cost of out-
of-home care in Kent
County compare to the
cost of out-of-home care in
the rest of the state of
Michigan?
The total of annual costs in
Kent by service domain,
category, and description
to pay for the cost of
services provided to
children in out-of-home
care and to their families
to support the stable
transition into a
permanent home (Kent
County costs will be
limited here to those cost
types that can also be
accurately tracked outside
of Kent County).
The total of annual costs in
Michigan for a matched
case comparison group of
children by service
domain, category, and
description to pay for the
cost of services delivered
to children in out-of-home
care and to their families
to support stable transition
into a permanent home.
The average annual daily
unit cost of out-of-home
placement in Kent County.
The average annual daily
unit cost of out-of-home
placement in the matched
case group.
Using the costs for children
that WMPC served in Kent
County and the costs for a
matched case comparison
group of children in the
remainder of the state,
compare the cost of out-of-
home care by:
1. Proportion costs by
expenditure categories for
each group
2. Average daily unit cost of out-
of-home care for each group
3. Growth rates by expenditure
category in each group over
time
MiSACWIS payment data;
quarterly WMPC PAFC Cost
Reports; MiSACWIS placement
data
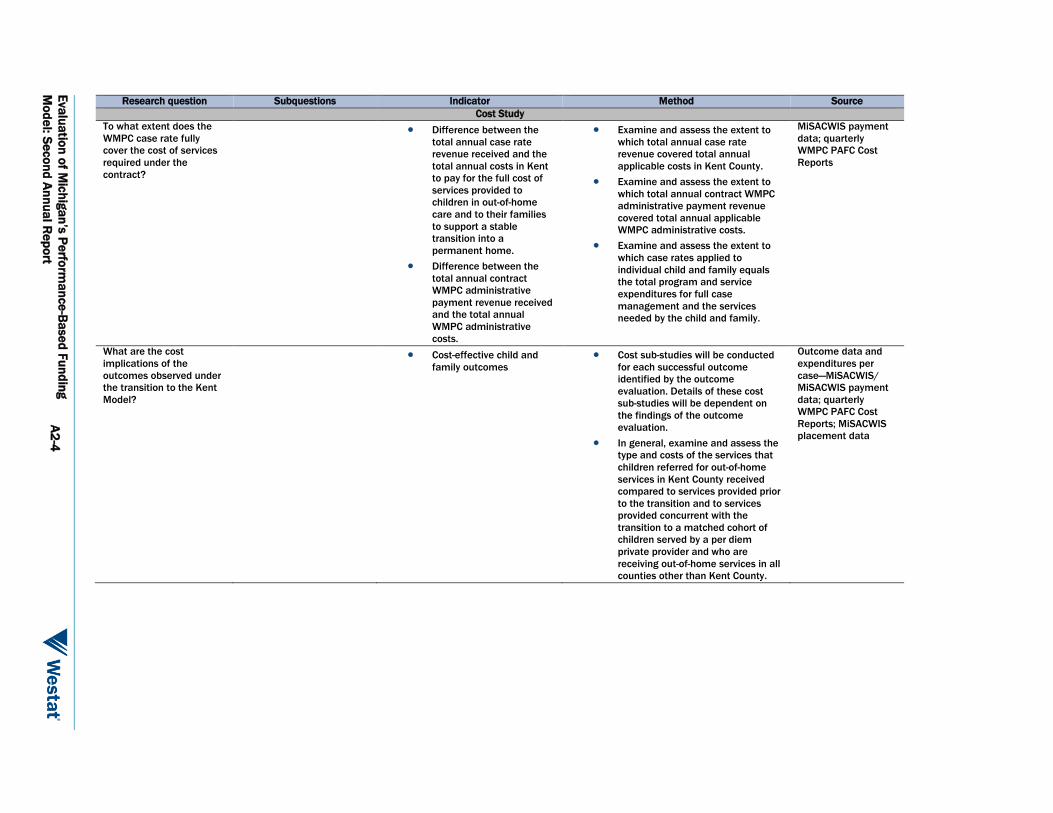
Eva
lua
tion
of M
ich
iga
n’s
Pe
rform
an
ce
-Ba
se
d F
un
din
g
Mo
de
l: Se
co
nd
An
nu
al R
ep
ort
A2
-4
Research question Subquestions Indicator Method Source
Cost Study
To what extent does the
WMPC case rate fully
cover the cost of services
required under the
contract?
Difference between the
total annual case rate
revenue received and the
total annual costs in Kent
to pay for the full cost of
services provided to
children in out-of-home
care and to their families
to support a stable
transition into a
permanent home.
Difference between the
total annual contract
WMPC administrative
payment revenue received
and the total annual
WMPC administrative
costs.
Examine and assess the extent to
which total annual case rate
revenue covered total annual
applicable costs in Kent County.
Examine and assess the extent to
which total annual contract WMPC
administrative payment revenue
covered total annual applicable
WMPC administrative costs.
Examine and assess the extent to
which case rates applied to
individual child and family equals
the total program and service
expenditures for full case
management and the services
needed by the child and family.
MiSACWIS payment
data; quarterly
WMPC PAFC Cost
Reports
What are the cost
implications of the
outcomes observed under
the transition to the Kent
Model?
Cost-effective child and
family outcomes
Cost sub-studies will be conducted
for each successful outcome
identified by the outcome
evaluation. Details of these cost
sub-studies will be dependent on
the findings of the outcome
evaluation.
In general, examine and assess the
type and costs of the services that
children referred for out-of-home
services in Kent County received
compared to services provided prior
to the transition and to services
provided concurrent with the
transition to a matched cohort of
children served by a per diem
private provider and who are
receiving out-of-home services in all
counties other than Kent County.
Outcome data and
expenditures per
case—MiSACWIS/
MiSACWIS payment
data; quarterly
WMPC PAFC Cost
Reports; MiSACWIS
placement data

Eva
lua
tion
of M
ich
iga
n’s
Pe
rform
an
ce
-Ba
se
d F
un
din
g
Mo
de
l: Se
co
nd
An
nu
al R
ep
ort
A2
-5
Research question Subquestions Indicator Method Source
Outcome Study53
Does a performance-based
case rate funding model
improve the safety of
children?
The children in foster care who
are safe from maltreatment
experienced within an out-of-
home setting.
The number of children in each group with a
CPS report occurring during a placement in
foster care/out-of-home care (as determined
by the report date or incident date when
available) resulting in a CAT I, II, or III
maltreatment disposition divided by the total
number of children in each group, to be
updated each reporting period.
MiSACWIS
The children who experience a
subsequent maltreatment event
with a disposition of
“preponderance of evidence”
within 1 year of their previous
report.
The number of children in each group with a
CPS report occurring within 1 year of their
most recently substantiated (initial) report of
maltreatment, to be updated each reporting
period. This is limited to children with a foster
care placement and associated with WMPC.
This is not inclusive of all children in Kent
County.
MiSACWIS
The average length of time
between maltreatment events
for children experiencing
maltreatment recurrence.
The average length of time between
maltreatment reports for children who were
subjects of a CAT I, II, or III maltreatment
disposition in the previous period and then
have a subsequent CAT I, II, or III
maltreatment disposition at
3 months;
6 months; and/or
12 months.
MiSACWIS
Risk of maltreatment recidivism Examine the role that race, gender, age,
history of maltreatment, and other important
covariates play in explaining recurrence of
maltreatment.
MiSACWIS
53Outcomes are measured by comparing WMPC-served children to a representative state sample (developed using propensity score matching).
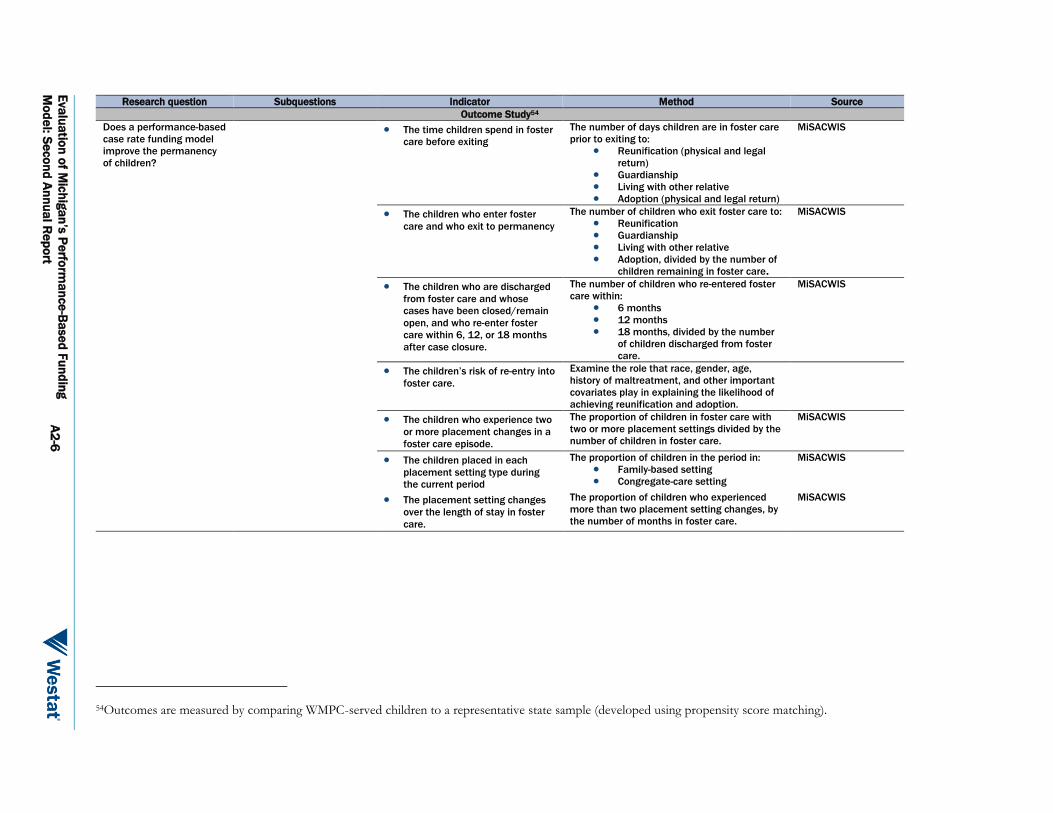
Eva
lua
tion
of M
ich
iga
n’s
Pe
rform
an
ce
-Ba
se
d F
un
din
g
Mo
de
l: Se
co
nd
An
nu
al R
ep
ort
A2
-6
Research question Subquestions Indicator Method Source
Outcome Study54
Does a performance-based
case rate funding model
improve the permanency
of children?
The time children spend in foster
care before exiting The number of days children are in foster care
prior to exiting to:
Reunification (physical and legal
return)
Guardianship
Living with other relative
Adoption (physical and legal return)
MiSACWIS
The children who enter foster
care and who exit to permanency
The number of children who exit foster care to:
Reunification
Guardianship
Living with other relative
Adoption, divided by the number of
children remaining in foster care.
MiSACWIS
The children who are discharged
from foster care and whose
cases have been closed/remain
open, and who re-enter foster
care within 6, 12, or 18 months
after case closure.
The number of children who re-entered foster
care within:
6 months
12 months
18 months, divided by the number
of children discharged from foster
care.
MiSACWIS
The children’s risk of re-entry into
foster care.
Examine the role that race, gender, age,
history of maltreatment, and other important
covariates play in explaining the likelihood of
achieving reunification and adoption.
The children who experience two
or more placement changes in a
foster care episode.
The proportion of children in foster care with
two or more placement settings divided by the
number of children in foster care.
MiSACWIS
The children placed in each
placement setting type during
the current period
The proportion of children in the period in:
Family-based setting
Congregate-care setting
MiSACWIS
The placement setting changes
over the length of stay in foster
care.
The proportion of children who experienced
more than two placement setting changes, by
the number of months in foster care.
MiSACWIS
54Outcomes are measured by comparing WMPC-served children to a representative state sample (developed using propensity score matching).
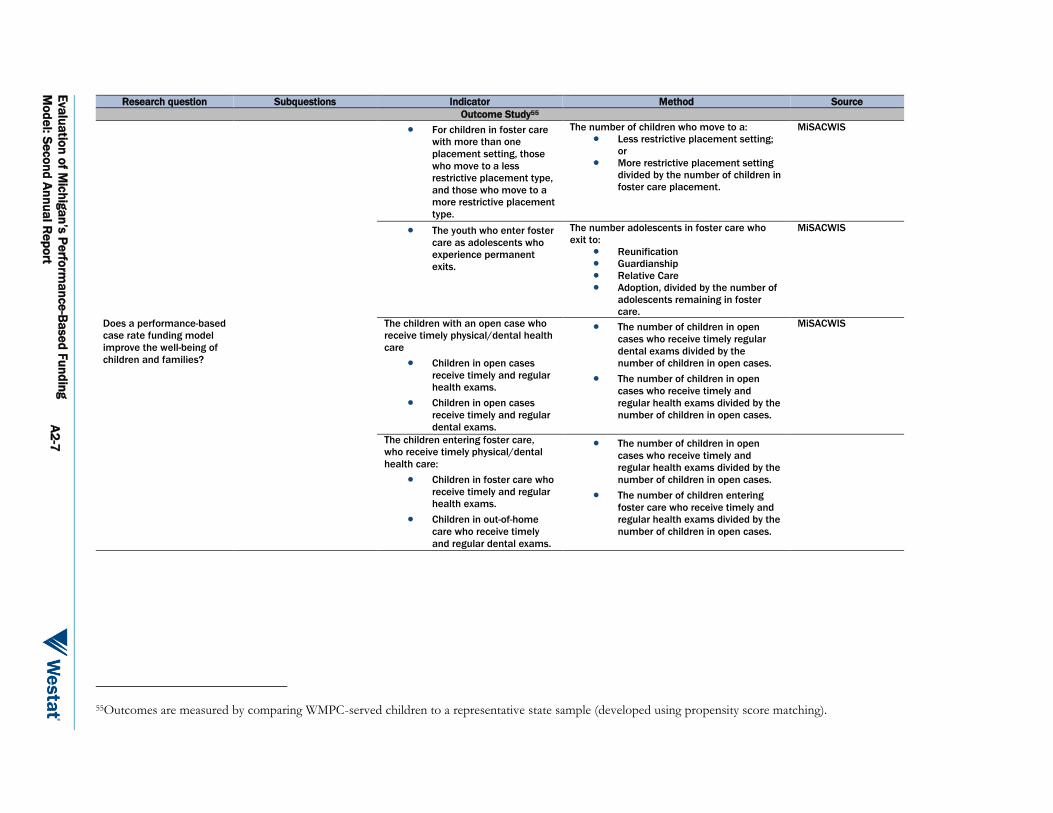
Eva
lua
tion
of M
ich
iga
n’s
Pe
rform
an
ce
-Ba
se
d F
un
din
g
Mo
de
l: Se
co
nd
An
nu
al R
ep
ort
A2
-7
Research question Subquestions Indicator Method Source
Outcome Study55 For children in foster care
with more than one
placement setting, those
who move to a less
restrictive placement type,
and those who move to a
more restrictive placement
type.
The number of children who move to a:
Less restrictive placement setting;
or
More restrictive placement setting
divided by the number of children in
foster care placement.
MiSACWIS
The youth who enter foster
care as adolescents who
experience permanent
exits.
The number adolescents in foster care who
exit to:
Reunification
Guardianship
Relative Care
Adoption, divided by the number of
adolescents remaining in foster
care.
MiSACWIS
Does a performance-based
case rate funding model
improve the well-being of
children and families?
The children with an open case who
receive timely physical/dental health
care
Children in open cases
receive timely and regular
health exams.
Children in open cases
receive timely and regular
dental exams.
The number of children in open
cases who receive timely regular
dental exams divided by the
number of children in open cases.
The number of children in open
cases who receive timely and
regular health exams divided by the
number of children in open cases.
MiSACWIS
The children entering foster care,
who receive timely physical/dental
health care:
Children in foster care who
receive timely and regular
health exams.
Children in out-of-home
care who receive timely
and regular dental exams.
The number of children in open
cases who receive timely and
regular health exams divided by the
number of children in open cases.
The number of children entering
foster care who receive timely and
regular health exams divided by the
number of children in open cases.
55Outcomes are measured by comparing WMPC-served children to a representative state sample (developed using propensity score matching).

Appendix 3
Kent Expenditure Category Mapping

Evaluation of Michigan’s Performance-Based
Funding Model: Second Annual Report A3-1
Appendix 3
Kent Expenditure Category Mapping
Service domain Service category Service description
Placement – Maint & Admin
(MA)
CCI 0740- General Residential
Placement – Maint & Admin CCI 0741-Mental Health and Behavior
Stabilization
Placement – Maint & Admin CCI 0742-Mother/Baby Residential Care
Placement – Maint & Admin CCI 0744-Sexually Reactive Residential Care
Placement – Maint & Admin CCI 0745-Shelter Residential Care
Placement – Maint & Admin CCI 0746-Substance Abuse Treatment
Placement – Maint & Admin CCI 0747-Short-Term Residential
Placement – Maint & Admin CCI 0748-Medium or High Security
Placement – Maint & Admin CCI 0749-Boot Camp Residential Care
Placement – Maint & Admin Detention – Paid 0762-State Detention – Paid
Placement – Maint & Admin Foster Home 0700-Age-Appropriate Rate
Placement – Maint & Admin Foster Home 0780-General Foster Care (FC)
Placement – Maint & Admin Independent Living 0703-Independent Living Allowance
Placement – Maint & Admin Independent Living 0782-General Independent Living
Placement – Maint & Admin Independent Living 0783-Specialized Independent Living
Placement – Admin Legislative Administrative
Rate Increase
Legislative Administrative Rate Increase
Placement – Maint & Admin MDHHS Training School –
Paid
0763-MDHHS Training School – Paid
Placement – Maint & Admin Treatment Foster Care 0788-Treatment Foster Care
Placement – Admin Trial Reunification Payment Trial Reunification Payment
Placement – Admin BP515 – Admin Payment BP515 – Admin Payment
FC Placement Service Clothing 0801-Initial Clothing Allowance 0-5
FC Placement Service Clothing 0802-Initial Clothing Allowance 6-12
FC Placement Service Clothing 0803-Initial Clothing Allowance 13-21
FC Placement Service Clothing 0804-Initial Clothing Ward Child
FC Placement Service Clothing 0821-Special Clothing Allowance 0-5
FC Placement Service Clothing 0822-Special Clothing Allowance 6-12
FC Placement Service Clothing 0823-Special Clothing Allowance 13+
FC Placement Service Clothing 0896-Semiannual Clothing Allowance 0-12
FC Placement Service Clothing 0897-Semiannual Clothing Allowance 13+
FC Placement Service Holiday Allowance 0898-Holiday Allowance
FC Placement Service Transportation Support 0809-Parental Visitation Transportation
FC Placement Service Transportation Support 0819- Sibling Visitation Transportation
FC Placement Service Transportation Support 1809-Parental Visitation Transportation
Mental Health Evaluation 0031-Psychiatric Evaluation
Mental Health Evaluation 0034-Psychological Evaluation
Mental Health Evaluation 0036-Trauma Assessment (Comprehensive
Team)
Mental Health Evaluation 0037-Trauma Assessment (Comprehensive
Transdisciplinary)
Mental Health Evaluation 0882-Mental Health/Psyc. Expenses
Residential Services One on One Supervision 0834-One on One supervision
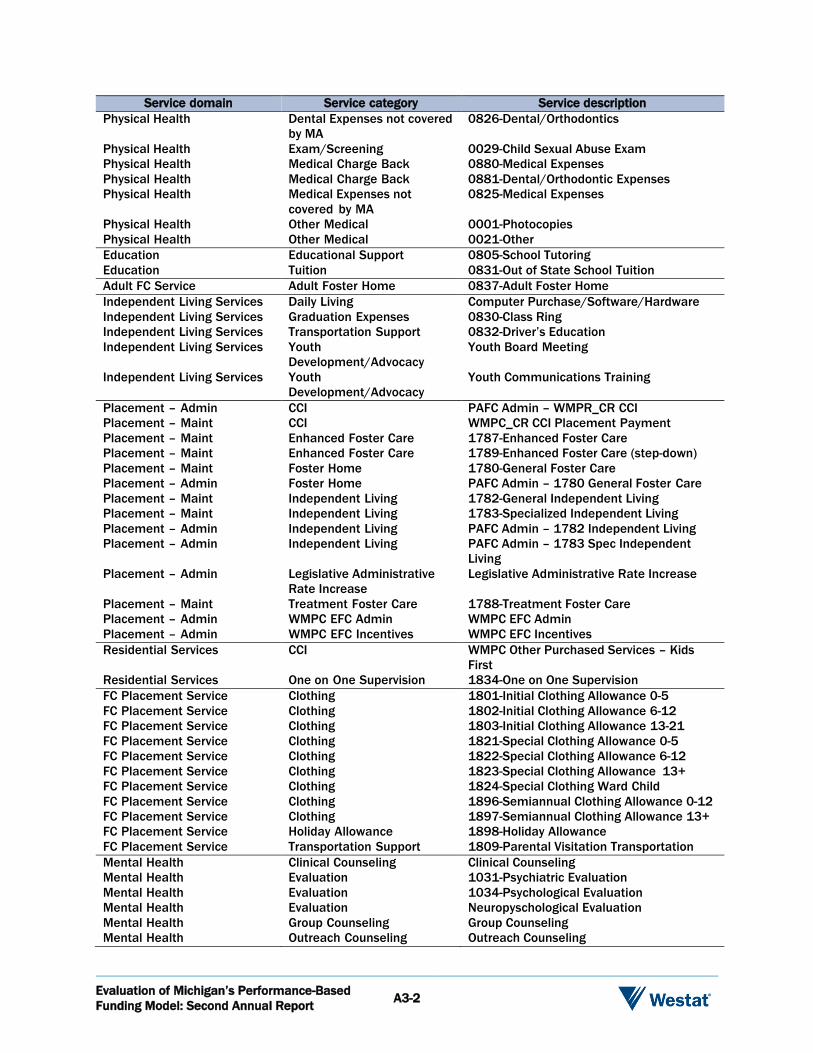
Evaluation of Michigan’s Performance-Based
Funding Model: Second Annual Report A3-2
Service domain Service category Service description
Physical Health Dental Expenses not covered
by MA
0826-Dental/Orthodontics
Physical Health Exam/Screening 0029-Child Sexual Abuse Exam
Physical Health Medical Charge Back 0880-Medical Expenses
Physical Health Medical Charge Back 0881-Dental/Orthodontic Expenses
Physical Health Medical Expenses not
covered by MA
0825-Medical Expenses
Physical Health Other Medical 0001-Photocopies
Physical Health Other Medical 0021-Other
Education Educational Support 0805-School Tutoring
Education Tuition 0831-Out of State School Tuition
Adult FC Service Adult Foster Home 0837-Adult Foster Home
Independent Living Services Daily Living Computer Purchase/Software/Hardware
Independent Living Services Graduation Expenses 0830-Class Ring
Independent Living Services Transportation Support 0832-Driver’s Education
Independent Living Services Youth
Development/Advocacy
Youth Board Meeting
Independent Living Services Youth
Development/Advocacy
Youth Communications Training
Placement – Admin CCI PAFC Admin – WMPR_CR CCI
Placement – Maint CCI WMPC_CR CCI Placement Payment
Placement – Maint Enhanced Foster Care 1787-Enhanced Foster Care
Placement – Maint Enhanced Foster Care 1789-Enhanced Foster Care (step-down)
Placement – Maint Foster Home 1780-General Foster Care
Placement – Admin Foster Home PAFC Admin – 1780 General Foster Care
Placement – Maint Independent Living 1782-General Independent Living
Placement – Maint Independent Living 1783-Specialized Independent Living
Placement – Admin Independent Living PAFC Admin – 1782 Independent Living
Placement – Admin Independent Living PAFC Admin – 1783 Spec Independent
Living
Placement – Admin Legislative Administrative
Rate Increase
Legislative Administrative Rate Increase
Placement – Maint Treatment Foster Care 1788-Treatment Foster Care
Placement – Admin WMPC EFC Admin WMPC EFC Admin
Placement – Admin WMPC EFC Incentives WMPC EFC Incentives
Residential Services CCI WMPC Other Purchased Services – Kids
First
Residential Services One on One Supervision 1834-One on One Supervision
FC Placement Service Clothing 1801-Initial Clothing Allowance 0-5
FC Placement Service Clothing 1802-Initial Clothing Allowance 6-12
FC Placement Service Clothing 1803-Initial Clothing Allowance 13-21
FC Placement Service Clothing 1821-Special Clothing Allowance 0-5
FC Placement Service Clothing 1822-Special Clothing Allowance 6-12
FC Placement Service Clothing 1823-Special Clothing Allowance 13+
FC Placement Service Clothing 1824-Special Clothing Ward Child
FC Placement Service Clothing 1896-Semiannual Clothing Allowance 0-12
FC Placement Service Clothing 1897-Semiannual Clothing Allowance 13+
FC Placement Service Holiday Allowance 1898-Holiday Allowance
FC Placement Service Transportation Support 1809-Parental Visitation Transportation
Mental Health Clinical Counseling Clinical Counseling
Mental Health Evaluation 1031-Psychiatric Evaluation
Mental Health Evaluation 1034-Psychological Evaluation
Mental Health Evaluation Neuropyschological Evaluation
Mental Health Group Counseling Group Counseling
Mental Health Outreach Counseling Outreach Counseling

Evaluation of Michigan’s Performance-Based
Funding Model: Second Annual Report A3-3
Service domain Service category Service description
Physical Health Dental Expenses not covered
by MA
1826 Dental/Orthodontics
Physical Health Medical Expenses not
covered by MA
1825-Medical Expenses
Physical Health Other Medical 1021-Other
Independent Living Services College/Post Secondary
Support
College Application Fees
Independent Living Services Daily Living Computer Purchase/Software/Hardware
Independent Living Services Graduation Expenses Senior Pictures
Independent Living Services Housing Rent/Security Deposit/Utility Deposit
Independent Living Services Transportation Support 1832-Driver’s Education
Education Educational Support 1805-School Tutoring
Education School Age Tutoring
Education Tuition 1836-Summer School

Appendix 4
Additional Fidelity Data for
Each MiTEAM Competency

Evaluation of Michigan’s Performance-Based
Funding Model: Second Annual Report A4-1
Appendix 4
Additional Fidelity Data for Each MiTEAM Competency
Figure A4-1. Percentage of sampled caseworkers implementing the Teaming competency with
fidelity
Figure A4-2. Percentage of sampled caseworkers implementing the Engagement competency
with fidelity
90%
97%
95%
2016 Q4 (n=480) 2017 Q4 (n=225) 2018 Q4 (n=555)
93%
98%
91%
2016 Q4 (n=441) 2017 Q4 (n=207) 2018 Q4 (n=463)
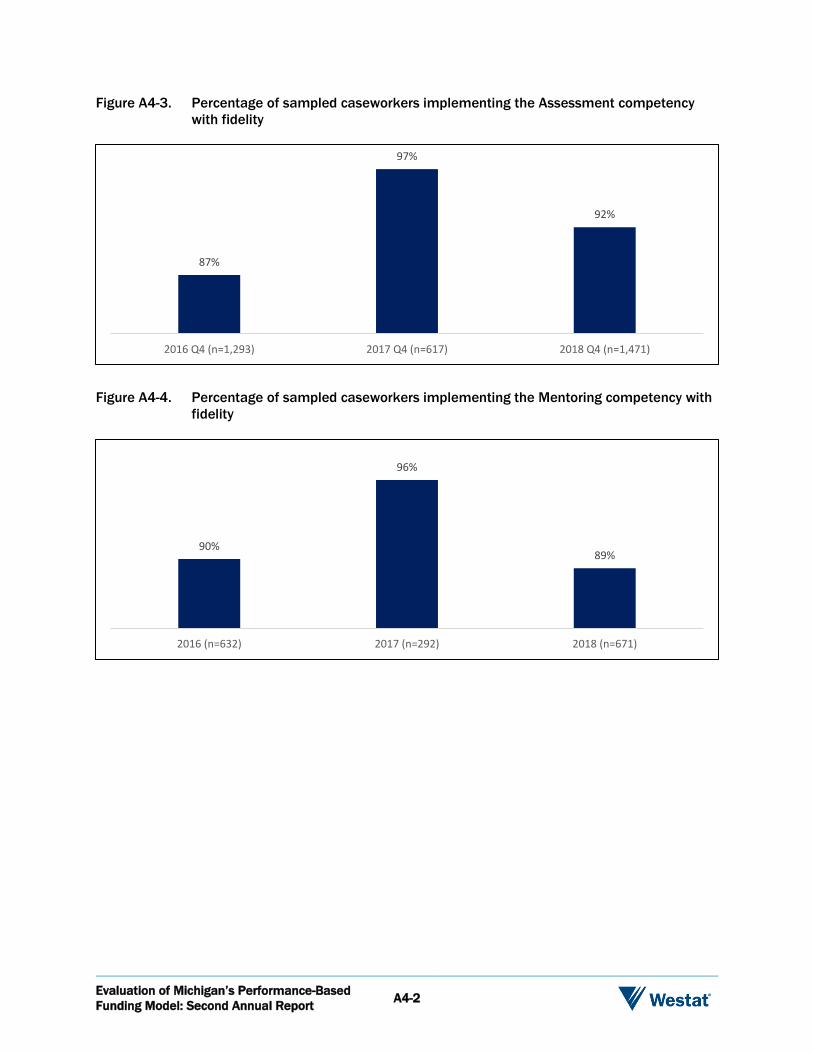
Evaluation of Michigan’s Performance-Based
Funding Model: Second Annual Report A4-2
Figure A4-3. Percentage of sampled caseworkers implementing the Assessment competency
with fidelity
Figure A4-4. Percentage of sampled caseworkers implementing the Mentoring competency with
fidelity
87%
97%
92%
2016 Q4 (n=1,293) 2017 Q4 (n=617) 2018 Q4 (n=1,471)
90%
96%
89%
2016 (n=632) 2017 (n=292) 2018 (n=671)
Appendix 5
Additional Satisfaction Data with Services
Related to Each MiTEAM Competency
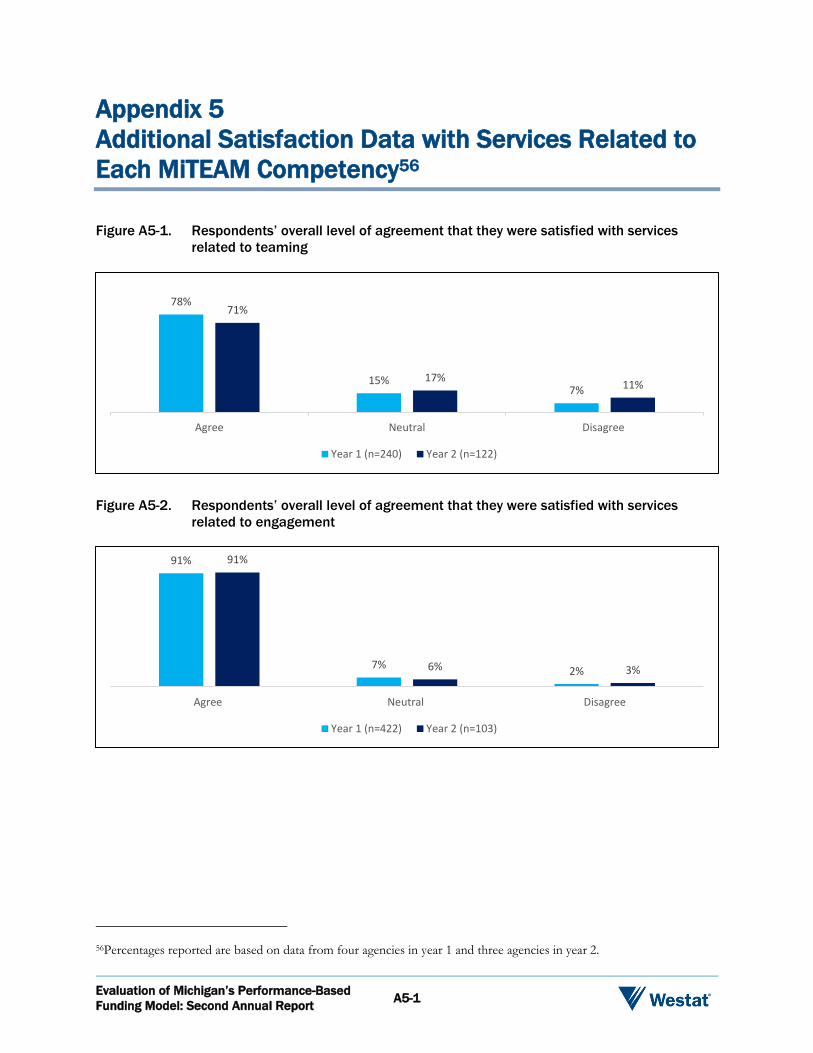
Evaluation of Michigan’s Performance-Based
Funding Model: Second Annual Report A5-1
Appendix 5
Additional Satisfaction Data with Services Related to
Each MiTEAM Competency56
Figure A5-1. Respondents’ overall level of agreement that they were satisfied with services
related to teaming
Figure A5-2. Respondents’ overall level of agreement that they were satisfied with services
related to engagement
56Percentages reported are based on data from four agencies in year 1 and three agencies in year 2.
78%
15%7%
71%
17%11%
Agree Neutral Disagree
Year 1 (n=240) Year 2 (n=122)
91%
7%2%
91%
6% 3%
Agree Neutral Disagree
Year 1 (n=422) Year 2 (n=103)
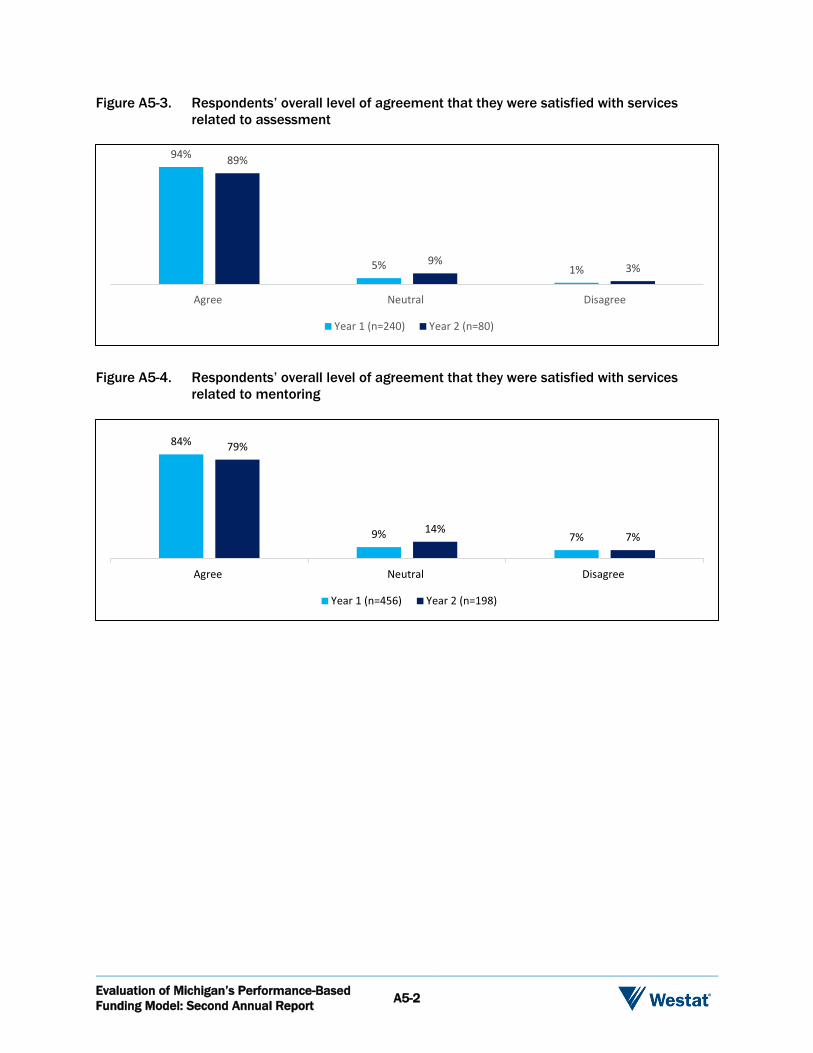
Evaluation of Michigan’s Performance-Based
Funding Model: Second Annual Report A5-2
Figure A5-3. Respondents’ overall level of agreement that they were satisfied with services
related to assessment
Figure A5-4. Respondents’ overall level of agreement that they were satisfied with services
related to mentoring
94%
5% 1%
89%
9%3%
Agree Neutral Disagree
Year 1 (n=240) Year 2 (n=80)
WMPC Network Performance Report
FISCAL YEAR 2020 QUARTER 1
1

2
In Care By Agency
200 178 172 184 162
BCS CCWM DABSJ SAM WLS
FISCAL YEAR 2020 Q1Children in Care
Racial DisproportionalityEntering Care by Month
29
17
8
October November December
WMPC
Entering Care by Agency
46
10
24
10
BCS CCWM DABSJ SAM WLS
Total Youth in Care Served
896Youth Entering Care
52Youth Discharged
95
Youth in Care and Youth Discharged Source: Mindshare Active Child List, date range 10/1/2019-12/31/2019; Youth Entering Care Source: Master Monthly Tracker, CPN Spreadsheet, updated 1/24/2020Racial Disproportionality: Mindshare, Active Child List, date range 10/1/2019-12/31/2019; U.S. Census Bureau, 2013-2017 American Community Survey 5-Year Estimates
3.2
2.6
0.9
0.7
2.8
2.4
0.90.8
2.7
1.9
0.70.6
Black/AfricanAmerican
Multi-Race Hispanicand/or Latino
White
WMPC January 2018
WMPC January 2019
WMPC FY2020 Q1
Overrepresentation
Underrepresentation

SAFETY Safety in Foster Care
Initial Service Plans
Updated Service Plans
Plan Approval
Increased Relative Placements
Licensed Foster Homes
Relative Licensing
Maltreatment in Care
PERMANENCY Reunification Community Placements
Worker-Parent Contacts
Parent-Child Contacts
Worker-Supervisor Contacts
Worker-Child Contacts
Permanency in 12 Months for Children Entering Care
Permanency in 12-23 Months
Permanency in 24+ Months
Placement Stability
Re-entry to Care in 12 Months
Reduced Days in Care in Residential
Reduced Days in Care in Emergency Shelter
Reduced Percentage of Children First Placed in Shelter
WELL-BEING Stability Family Connections Community Connections
Increased In County Placements
Community Placements
Initial Medical Exams
Yearly/Periodic Medical Exams
Initial Dental Exams
Yearly Dental Exams
3
Permanency, Well-being, and Safety are three best interest principles that are areas of focus for the West Michigan Partnership for Children foster care network in Fiscal Year 2020. To monitor progress toward these principles, network contract measures, ISEP rules, and federal measures are outlined in this quarterly report.
Network compliance in Q1
Network incompliance

Network Quarterly PerformanceWorker-Parent – 73% Parent Child – 54%
Network 12-Month Performance
Worker-Parent
Parent-Child
Monitored Measures
WMPC Contract:At least 82 percent of parents whose children have a permanency goal of reunification and are supervised by the Grantee, shall have face-to-face contact by the assigned caseworker in accordance with the guidelines in FOM by the end of FY22 with annual goals of 71 percent in FY20, 76 percent in FY21, and 82 percent in FY22.
Case workers’ timely, monthly face-to-face contacts with parents of children who have a permanency goal of reunification increase by 12% from the previous year OR at least 85% of the possible monthly face-to-face contacts occur within the time frame.
At least 65 percent of children supervised by the Grantee with a goal of reunification shall have visitation with their parent(s) in accordance with the guidelines in FOM 722-06I Policy by the end of FY22 with annual goals of 55 percent in FY20, 59 percent in FY21, and 65 percent in FY22.
4
62%66% 65% 66% 66%
69% 67% 67%74%
78%73%
69%
63% 71% 72% 85% 87% 51% 55% 55% 63% 68%
61%
44%
71%
55%
BCS CCWM DABSJ SAM WLS BCS CCWM DABSJ SAM WLS
41%
37%49% 48% 51%
46% 49% 52% 53%60%
53% 51%
Jan Feb Mar Apr May Jun Jul Aug Sept Oct Nov Dec
Source: MiSACWIS Social Work Contacts Timeliness Info View Report, retrieved January 21, 2020; MDHHS Children’s Services Agency - MMR Scorecard statewide performance, September - November, 2019
PERMANENCYWorker-Child and Worker-Supervisor Contacts
FY Goal

Network Quarterly PerformanceWorker-Child – 95% Worker-Supervisor – 99%\
Network 12-Month Performance
Worker-Child
Worker-Supervisor \
Monitored Measures
ISEP Standard:At least 95% of children will be visited by their assigned worker.At least 95% of supervisors shall meet at least monthly with each assigned case worker to review the status and progress of each case on the worker’s caseload.
5
92% 95% 92% 96% 95% 96% 95% 94% 97% 96% 96% 94%
90% 98% 94% 98% 99% 97% 100% 99% 99% 99%
90% 92%
ISEP 95%
BCS CCWM DABSJ SAM WLS BCS CCWM DABSJ SAM WLS
99% 100% 97% 99% 98% 98% 98% 100% 99% 99% 99% 98%
Jan Feb Mar Apr May Jun Jul Aug Sept Oct Nov Dec
Source: MiSACWIS Social Work Contacts Timeliness Info View Report, retrieved January 21, 2020; MDHHS Children’s Services Agency - MMR Scorecard statewide performance, September - November, 2019
PERMANENCYWorker-Child and Worker-Supervisor Contacts
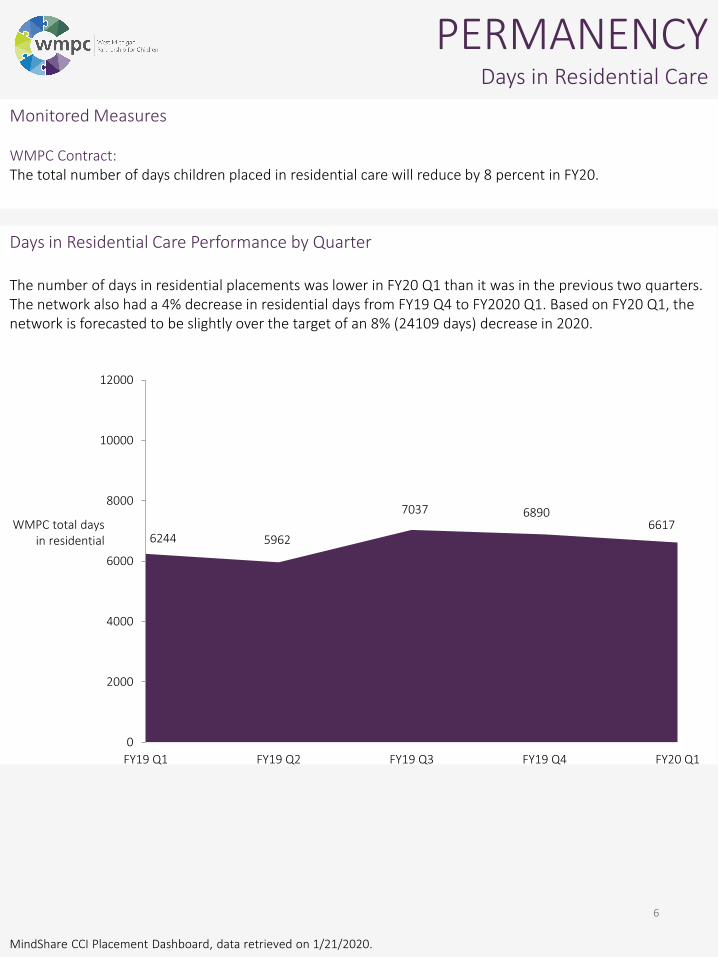
Days in Residential Care Performance by Quarter
The number of days in residential placements was lower in FY20 Q1 than it was in the previous two quarters. The network also had a 4% decrease in residential days from FY19 Q4 to FY2020 Q1. Based on FY20 Q1, the network is forecasted to be slightly over the target of an 8% (24109 days) decrease in 2020.
\
WMPC total days in residential
6
PERMANENCYDays in Residential Care
Monitored Measures
WMPC Contract: The total number of days children placed in residential care will reduce by 8 percent in FY20.
6244 5962
7037 68906617
0
2000
4000
6000
8000
10000
12000
FY19 Q1 FY19 Q2 FY19 Q3 FY19 Q4 FY20 Q1
MindShare CCI Placement Dashboard, data retrieved on 1/21/2020.

Network First Placement Shelter Performance
With just 4 of 18 youth in shelter as their first placement, the network as a whole reached the goal for the quarter.
Days in Shelter Performance by Quarter
The network’s number of days in shelter was lower in FY20 Q1 than it was in the previous four quarters. The network had an 18% decrease in shelter days from FY19 Q4 to FY20 Q1.
\
Monitored Measures
WMPC Contract: The total number of days children placed in emergency shelter will reduce by 2 percent in FY20.
The percentage of children for whom shelter is their first placement will not exceed 25 percent by the end of FY20.
7
PERMANENCYDays in Shelter and Youth in Shelter
567
992
763663
543
FY19 Q1 FY19 Q2 FY19 Q3 FY19 Q4 FY20 Q1
WMPC total days in shelter
First Placement Shelter Performance by Agency
Shelter was the first placement for 4 of the 18 children placed in shelter in Q1.
CCWM
SAM
BCS
DABSJ
WLS
22%
MindShare CCI Placement Dashboard, data retrieved on 1/21/2020.
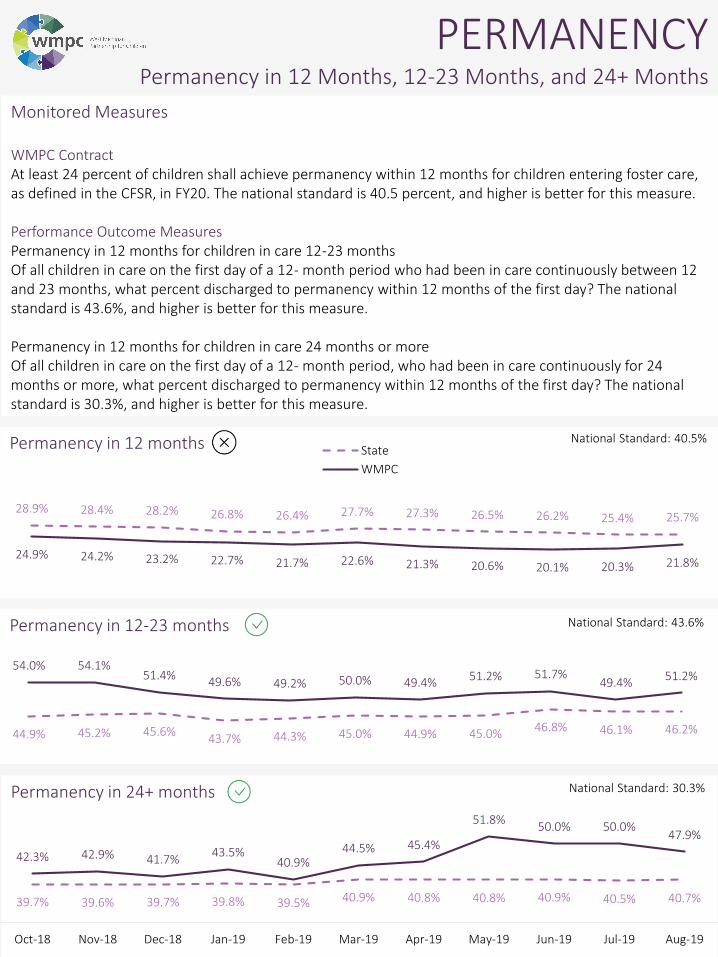
Permanency in 24+ months
PERMANENCYPermanency in 12 Months, 12-23 Months, and 24+ Months
Monitored Measures
WMPC ContractAt least 24 percent of children shall achieve permanency within 12 months for children entering foster care, as defined in the CFSR, in FY20. The national standard is 40.5 percent, and higher is better for this measure.
Performance Outcome MeasuresPermanency in 12 months for children in care 12-23 monthsOf all children in care on the first day of a 12- month period who had been in care continuously between 12 and 23 months, what percent discharged to permanency within 12 months of the first day? The national standard is 43.6%, and higher is better for this measure.
Permanency in 12 months for children in care 24 months or more Of all children in care on the first day of a 12- month period, who had been in care continuously for 24 months or more, what percent discharged to permanency within 12 months of the first day? The national standard is 30.3%, and higher is better for this measure.
39.7% 39.6% 39.7% 39.8% 39.5% 40.9% 40.8% 40.8% 40.9% 40.5% 40.7%
42.3% 42.9% 41.7%43.5%
40.9%44.5% 45.4%
51.8%50.0% 50.0%
47.9%
Oct-18 Nov-18 Dec-18 Jan-19 Feb-19 Mar-19 Apr-19 May-19 Jun-19 Jul-19 Aug-19
Permanency in 12 months
28.9% 28.4% 28.2% 26.8% 26.4% 27.7% 27.3% 26.5% 26.2% 25.4% 25.7%
24.9% 24.2% 23.2% 22.7% 21.7% 22.6% 21.3% 20.6% 20.1% 20.3% 21.8%
State
WMPC
National Standard: 40.5%
Permanency in 12-23 months
44.9% 45.2% 45.6%43.7% 44.3% 45.0% 44.9% 45.0%
46.8% 46.1% 46.2%
54.0% 54.1%51.4%
49.6% 49.2% 50.0% 49.4% 51.2% 51.7%49.4%
51.2%
National Standard: 43.6%
National Standard: 30.3%
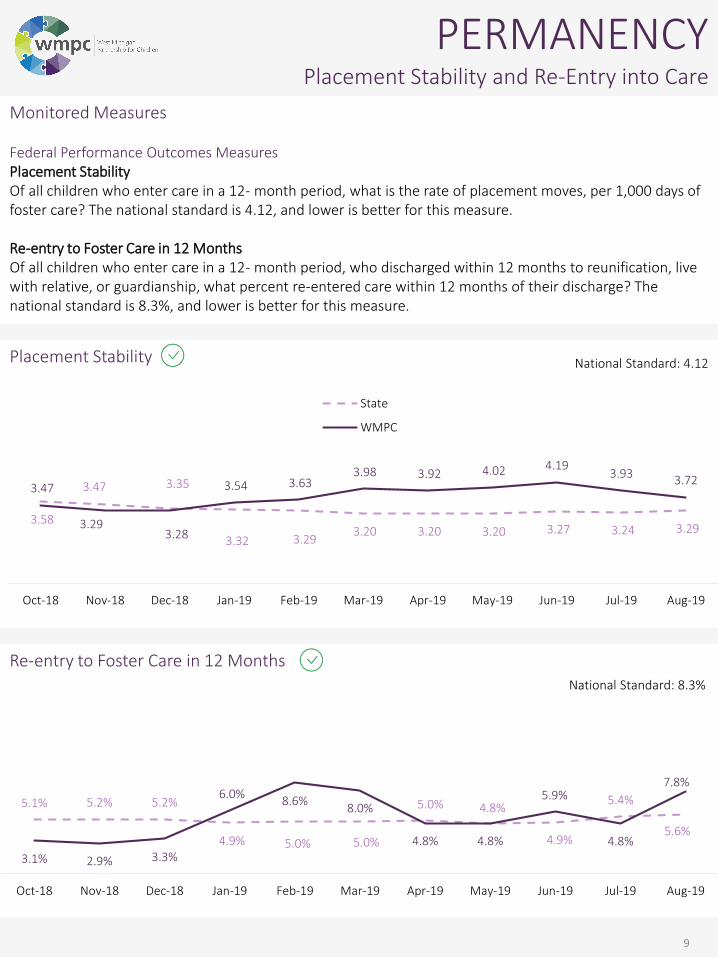
Re-entry to Foster Care in 12 Months
Placement Stability
9
PERMANENCYPlacement Stability and Re-Entry into Care
Monitored Measures
Federal Performance Outcomes MeasuresPlacement StabilityOf all children who enter care in a 12- month period, what is the rate of placement moves, per 1,000 days of foster care? The national standard is 4.12, and lower is better for this measure.
Re-entry to Foster Care in 12 MonthsOf all children who enter care in a 12- month period, who discharged within 12 months to reunification, live with relative, or guardianship, what percent re-entered care within 12 months of their discharge? The national standard is 8.3%, and lower is better for this measure.
3.58
3.47 3.35
3.32 3.29 3.20 3.20 3.20 3.27 3.24 3.29
3.47
3.29 3.28
3.54 3.63 3.98 3.92 4.02 4.19
3.933.72
Oct-18 Nov-18 Dec-18 Jan-19 Feb-19 Mar-19 Apr-19 May-19 Jun-19 Jul-19 Aug-19
State
WMPC
5.1% 5.2% 5.2%
4.9% 5.0% 5.0%
5.0% 4.8%
4.9%
5.4%
5.6%
3.1% 2.9% 3.3%
6.0%8.6%
8.0%
4.8% 4.8%
5.9%
4.8%
7.8%
Oct-18 Nov-18 Dec-18 Jan-19 Feb-19 Mar-19 Apr-19 May-19 Jun-19 Jul-19 Aug-19
National Standard: 8.3%
National Standard: 4.12
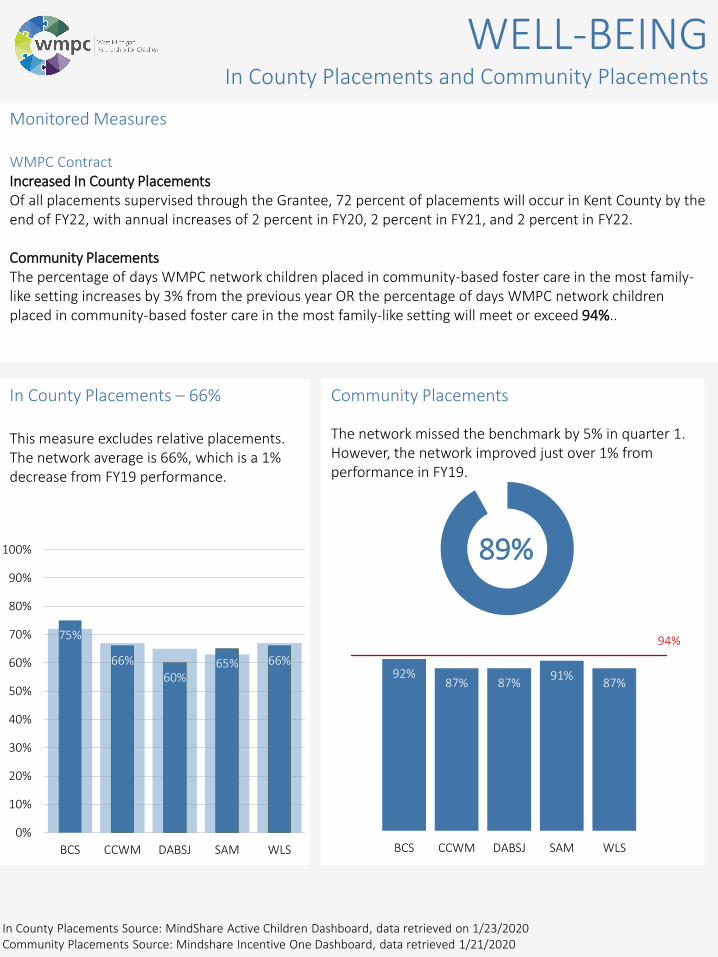
Monitored Measures
WMPC ContractIncreased In County Placements Of all placements supervised through the Grantee, 72 percent of placements will occur in Kent County by the end of FY22, with annual increases of 2 percent in FY20, 2 percent in FY21, and 2 percent in FY22.
Community PlacementsThe percentage of days WMPC network children placed in community-based foster care in the most family-like setting increases by 3% from the previous year OR the percentage of days WMPC network children placed in community-based foster care in the most family-like setting will meet or exceed 94%..
WELL-BEINGIn County Placements and Community Placements
Community Placements
The network missed the benchmark by 5% in quarter 1. However, the network improved just over 1% from performance in FY19.
92%87% 87%
91%87%
94%
BCS CCWM DABSJ SAM WLS
89%
In County Placements – 66%
This measure excludes relative placements. The network average is 66%, which is a 1% decrease from FY19 performance.
75%
66%
60%65% 66%
0%
10%
20%
30%
40%
50%
60%
70%
80%
90%
100%
BCS CCWM DABSJ SAM WLS
In County Placements Source: MindShare Active Children Dashboard, data retrieved on 1/23/2020Community Placements Source: Mindshare Incentive One Dashboard, data retrieved 1/21/2020
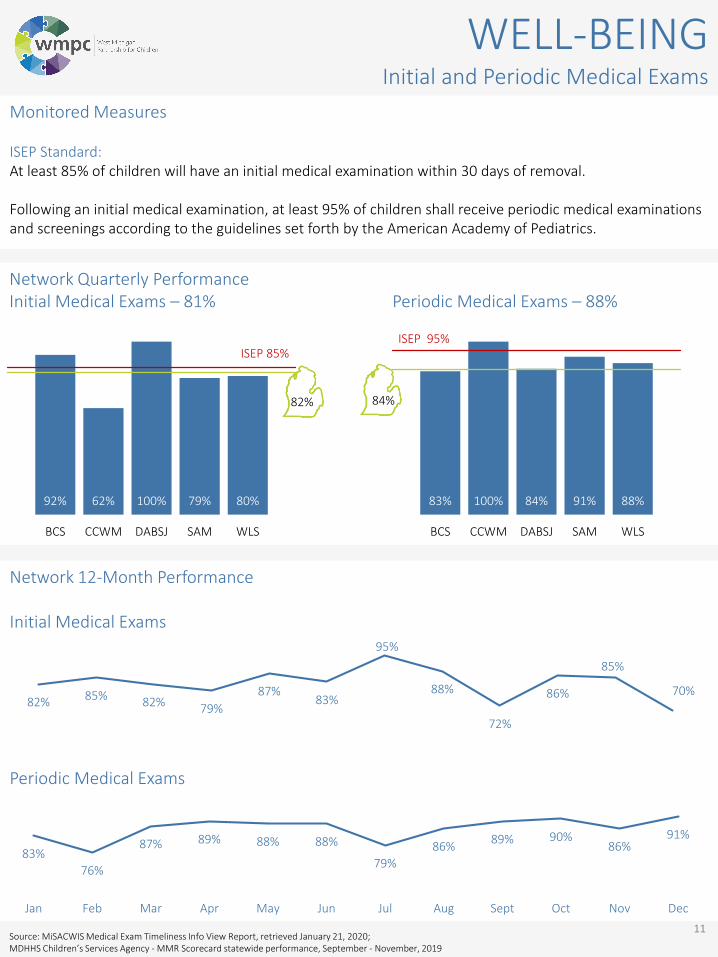
Network Quarterly PerformanceInitial Medical Exams – 81% Periodic Medical Exams – 88%
Network 12-Month Performance
Initial Medical Exams
Periodic Medical Exams
Monitored Measures
ISEP Standard:At least 85% of children will have an initial medical examination within 30 days of removal.
Following an initial medical examination, at least 95% of children shall receive periodic medical examinations and screenings according to the guidelines set forth by the American Academy of Pediatrics.
WELL-BEINGInitial and Periodic Medical Exams
11
82% 85% 82% 79%
87%83%
95%
88%
72%
86%
85%
70%
92% 62% 100% 79% 80% 83% 100% 84% 91% 88%
82% 84%
ISEP 85%ISEP 95%
BCS CCWM DABSJ SAM WLS BCS CCWM DABSJ SAM WLS
83%
76%
87% 89% 88% 88%
79%
86%89% 90%
86%91%
Jan Feb Mar Apr May Jun Jul Aug Sept Oct Nov Dec
Source: MiSACWIS Medical Exam Timeliness Info View Report, retrieved January 21, 2020; MDHHS Children’s Services Agency - MMR Scorecard statewide performance, September - November, 2019
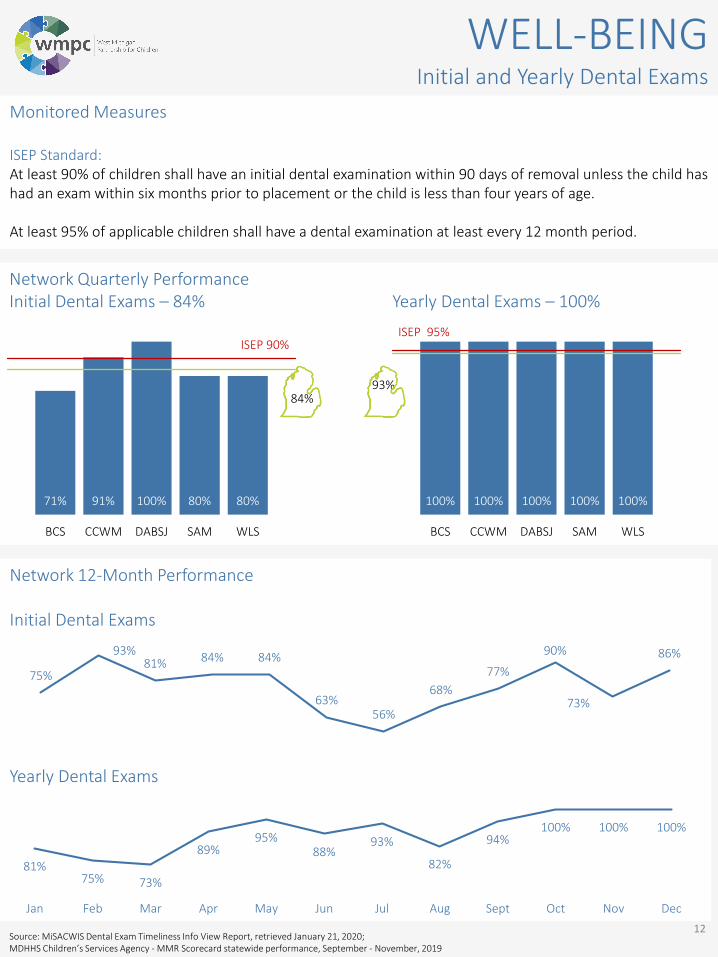
Network Quarterly PerformanceInitial Dental Exams – 84% Yearly Dental Exams – 100%
Network 12-Month Performance
Initial Dental Exams
Yearly Dental Exams
Monitored Measures
ISEP Standard:At least 90% of children shall have an initial dental examination within 90 days of removal unless the child has had an exam within six months prior to placement or the child is less than four years of age.
At least 95% of applicable children shall have a dental examination at least every 12 month period.
WELL-BEINGInitial and Yearly Dental Exams
12
75%
93%81% 84% 84%
63%56%
68%
77%
90%
73%
86%
71% 91% 100% 80% 80% 100% 100% 100% 100% 100%
84%93%
ISEP 90%ISEP 95%
BCS CCWM DABSJ SAM WLS BCS CCWM DABSJ SAM WLS
81%75% 73%
89%95%
88%93%
82%
94%100% 100% 100%
Jan Feb Mar Apr May Jun Jul Aug Sept Oct Nov Dec
Source: MiSACWIS Dental Exam Timeliness Info View Report, retrieved January 21, 2020; MDHHS Children’s Services Agency - MMR Scorecard statewide performance, September - November, 2019
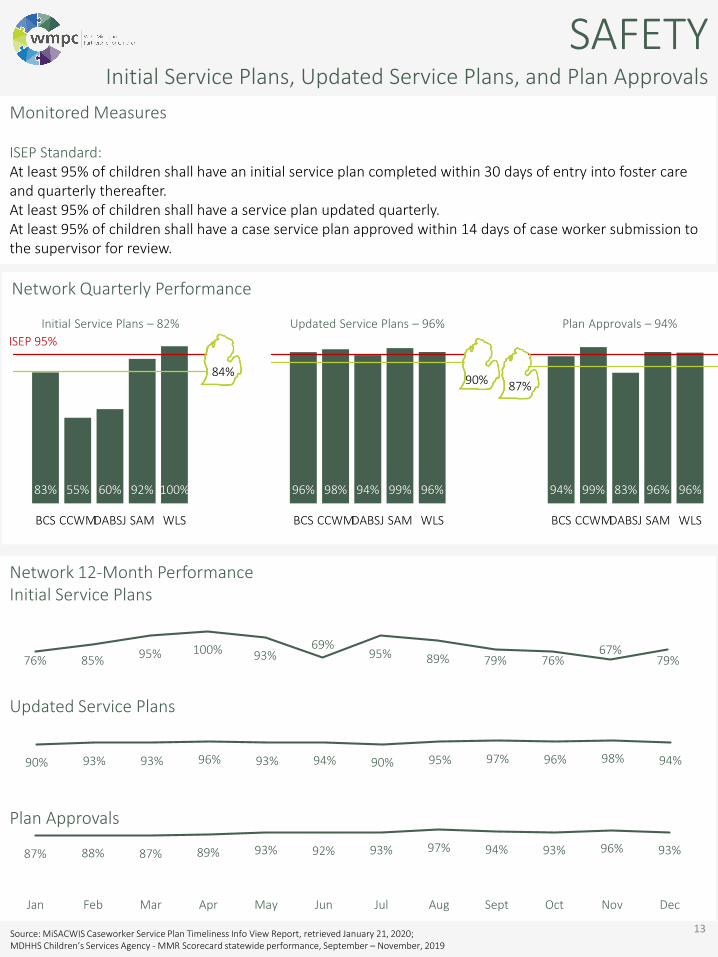
Network Quarterly Performance
Initial Service Plans – 82% Updated Service Plans – 96% Plan Approvals – 94%
Network 12-Month PerformanceInitial Service Plans
Updated Service Plans
Plan Approvals
Monitored Measures
ISEP Standard:At least 95% of children shall have an initial service plan completed within 30 days of entry into foster care and quarterly thereafter. At least 95% of children shall have a service plan updated quarterly.At least 95% of children shall have a case service plan approved within 14 days of case worker submission to the supervisor for review.
SAFETYInitial Service Plans, Updated Service Plans, and Plan Approvals
13
90% 93% 93% 96% 93% 94% 90% 95% 97% 96% 98% 94%
87% 88% 87% 89% 93% 92% 93% 97% 94% 93% 96% 93%
Jan Feb Mar Apr May Jun Jul Aug Sept Oct Nov Dec
83% 55% 60% 92% 100% 96% 98% 94% 99% 96% 94% 99% 83% 96% 96%
84%90% 87%
ISEP 95%
BCS CCWMDABSJ SAM WLS BCS CCWMDABSJ SAM WLS BCS CCWMDABSJ SAM WLS
76% 85%95% 100% 93%
69%95% 89% 79% 76%
67%79%
Source: MiSACWIS Caseworker Service Plan Timeliness Info View Report, retrieved January 21, 2020; MDHHS Children’s Services Agency - MMR Scorecard statewide performance, September – November, 2019

Monitored Measures
WMPC ContractRelative Placements The percentage of days children placed in relative care increases by 6% from the previous year OR at least 35% of all children served by the WMPC network are in relative care each year.
Relative Licensing Relatives successfully completing the licensing process will increase by 10 percent in FY20.
Licensed Foster HomesThe WMPC network will license the number of foster homes required to meet or exceed their benchmark for total number of licensed homes as determined by the Kent County AFPRR licensing calculator.
SAFETYRelative Placements, Relative Licensing, Licensed Foster Homes
14
Relative Placements
In Q1, every agency met or exceeded the target of 35%.
41%
35%
35%
36%
39%
BCS
CCWM
DABSJ
SAM
WLS
Licensed Foster Homes
Based on Q1 performance, three of the agencies are on target to meet their licensing targets for FY20.
Relative Licensing
The number relative licensed homes has decreased over the last several quarters.
82
5 7 1
13
17 12 9
15
0
5
10
15
20
BCS CCWM DABSJ SAM WLS
81 89 87 7866
FY19 Q1 FY19 Q2 FY19 Q3 FY19 Q4 FY20 Q1
Relative Licensing Source: Mindshare Agency Foster Home Table, data retrieved on 1/22/2020Relative Placements Source: Mindshare Incentive Three Dashboard, data retrieved 1/21/2020Licensed Foster Homes Source: Non-related Foster Home Dashboard, December 2019.
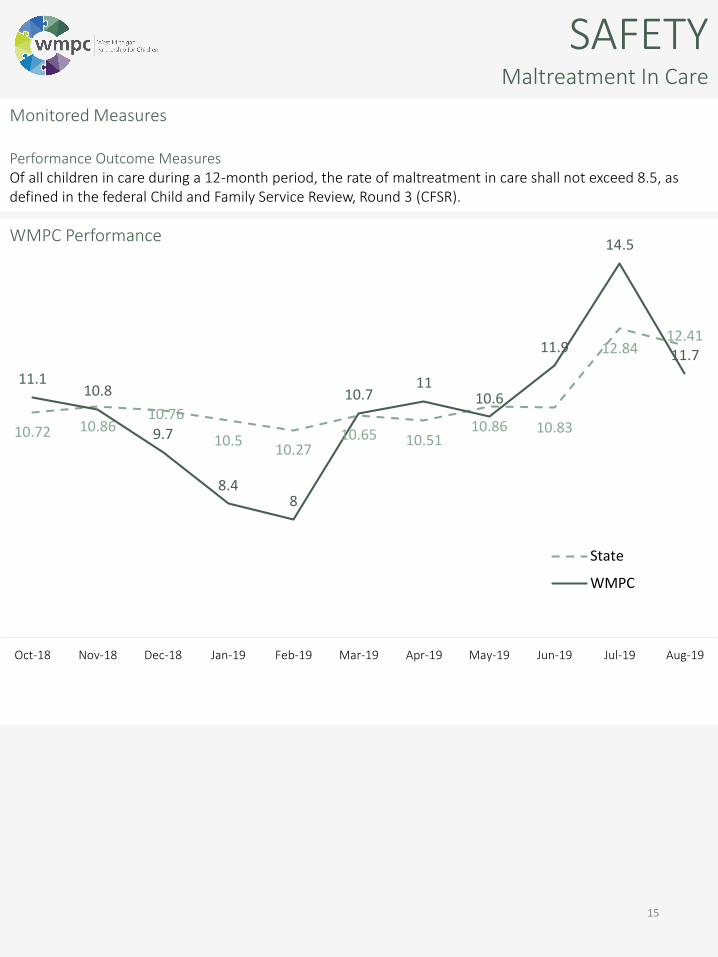
WMPC Performance
SAFETYMaltreatment In Care
Monitored Measures
Performance Outcome MeasuresOf all children in care during a 12-month period, the rate of maltreatment in care shall not exceed 8.5, as defined in the federal Child and Family Service Review, Round 3 (CFSR).
15
10.72 10.8610.76
10.510.27
10.65 10.5110.86 10.83
12.8412.41
11.110.8
9.7
8.48
10.711
10.6
11.9
14.5
11.7
Oct-18 Nov-18 Dec-18 Jan-19 Feb-19 Mar-19 Apr-19 May-19 Jun-19 Jul-19 Aug-19
State
WMPC