status of rural transport in limpopo
TRANSCRIPT

Sta
tus
of
Ru
ral
Tran
spo
rt in
Lim
po
po
Original
Submitted by:Aurecon South Africa (Pty) Ltd, 130 Suid Street, POLOKWANE, 0699
Contact Person: Lesiba LedwabaTel: +27 15 295 4408Fax: +27 15 295 2208Email: [email protected]
For attention: Mr S NkanyaniDepartment of Roads and Transport
Private Bag X9491 POLOKWANE
0700
Development of the Limpopo Rural Transport Strategy


LL IIMMPPOOPPOO RRUURRAALL TTRRAANNSSPPOORRTT SSTTRRAATTEEGGYY PPHHAASSEE 11:: SSTTAATTEE OOFF RRUURRAALL TTRRAANNSSPPOORRTT
December 2010 Update
i
INDEX
Pages 1 INTRODUCTION ...................................................................................................... 1
2 BACKD TO THE REPORT ....................................................................................... 2
3 METHODOLOGY FOR EXECUTION OF RURAL TRANSPORT SURVEYS............ 3
3.1 Rural Household Survey ................................................................................... 3
3.1.1 Development of Rural Household Surveys ................................................. 3
3.1.2 Sample Size ............................................................................................... 4
3.1.3 Identification and Training of Surveyors ..................................................... 4
3.1.4 Survey Execution ....................................................................................... 4
3.1.5 Data Capturing and Processing .................................................................. 6
3.1.6 Data Analysis ............................................................................................. 6
3.2 Subsistence Farmer Surveys ............................................................................ 6
3.2.1 Development of Subsistence Farmer Surveys ............................................ 6
3.2.2 Sample Size ............................................................................................... 6
3.2.3 Survey Execution ....................................................................................... 6
3.2.4 Data Analysis ............................................................................................. 7
3.3 Bulk Transport Survey ....................................................................................... 7
3.3.1 Development of the Bulk Transport Survey ................................................ 7
3.3.2 Sample Size ............................................................................................... 7
3.3.3 Survey Execution ....................................................................................... 7
3.3.4 Data Analysis ............................................................................................. 7
3.4 Public Transport Service ................................................................................... 7
3.4.1 Development .............................................................................................. 7
3.4.2 Sample Size ............................................................................................... 7
3.4.3 Survey Execution ....................................................................................... 8
3.4.4 Data Analysis ............................................................................................. 8
4 RESULTS OF DATA ANALYSIS .............................................................................. 9
4.1 Rural Household Survey Results ....................................................................... 9
4.1.1 Household Profile ..................................................................................... 10
4.1.2 Household Economic Activity ................................................................... 26
4.1.3 Household Education ............................................................................... 31

LL IIMMPPOOPPOO RRUURRAALL TTRRAANNSSPPOORRTT SSTTRRAATTEEGGYY PPHHAASSEE 11:: SSTTAATTEE OOFF RRUURRAALL TTRRAANNSSPPOORRTT
December 2010 Update
ii
4.1.4 Household Travelling Patterns ................................................................. 37
4.1.5 Transport Usage ...................................................................................... 47
4.1.6 Transportation of Goods........................................................................... 50
4.1.7 Travel Patterns to Remote Places ............................................................ 52
4.1.8 Attitude towards Transport ....................................................................... 54
4.1.9 Transport Hindering Aspects .................................................................... 57
4.1.10 Perceived Transport Needs ...................................................................... 62
4.2 Subsistence Farmer Survey Results ............................................................... 62
4.3 Bulk Transport Survey Results ........................................................................ 63
4.4 Public Transport Operators Survey Results ..................................................... 64
5 SUMMARY OF FINDINGS ..................................................................................... 65
6 IMPLICATIONS OF FINDINGS ON RURAL TRANSPORT PLANNING IN THE LIMPOPO PROVINCE .................................................................................................. 66

LL IIMMPPOOPPOO RRUURRAALL TTRRAANNSSPPOORRTT SSTTRRAATTEEGGYY PPHHAASSEE 11:: SSTTAATTEE OOFF RRUURRAALL TTRRAANNSSPPOORRTT
December 2010 Update
iii
TABLES
Table 1: Limpopo Rural Transport Study Areas ________________________________ 3
Table 2: Limpopo Rural Transport Strategy – Surveyors Training Dates ____________ 4
Table 3: Limpopo Rural Transport Strategy – Data Collection Dates _______________ 5
Table 4: Limpopo Rural Transport Strategy - Number of Households Interviewed _____ 5
Table 5: Average Number of Persons per Household __________________________ 10
Table 6: Extent of Disability in Rural Areas __________________________________ 11
Table 7: Dwelling Type within the Study Area ________________________________ 13
Table 8: Vehicle Ownership per Household __________________________________ 15
Table 9: Livestock Ownership per District ___________________________________ 25
Table 10: Employment Status by Gender per district ___________________________ 27
Table 11: Reasons for Not Using Modes for Educational Trips in the Limpopo _______ 36
Table 12: Reasons why Mode is never used for Work Trips in the Limpopo Province _ 42
Table 13: Average waiting time for Public Transport per District __________________ 48
Table 14: Types of Goods Transported per District ____________________________ 51
Table 15: Level of Satisfaction towards Minibus Taxi Mode _____________________ 55
Table 16: Level of Satisfaction with Bus Service ______________________________ 56
FIGURES
Figure 1: Age Group per Gender __________________________________________ 11
Figure 2: Disability Types ________________________________________________ 12
Figure 3: Dwelling type per District ________________________________________ 14
Figure 4: Vehicle Ownership by mode per district _____________________________ 16
Figure 5: Percentage of Household per Income Group _________________________ 17
Figure 6: Capricorn District Household Income Groups _________________________ 18
Figure 7: Mopani District Household Income Groups __________________________ 18
Figure 8: Sekhukhune District Household Income Groups ______________________ 19
Figure 9: Vhembe District Household Income Groups __________________________ 20
Figure 10: Waterberg District Household Income Groups _______________________ 20
Figure 11: Total Household Monthly Expenditures ____________________________ 21
Figure 12: Monthly Transport Expenditure per District __________________________ 22
Figure 13: Access to Water per District _____________________________________ 23
Figure 14: Access to Sanitation per district __________________________________ 23
Figure 15: Sources of Energy per Rural Household ___________________________ 24
Figure 16: Livestock Ownership per District __________________________________ 26 Figure 17: Employment Status in Rural Areas of the Limpopo Province ____________ 27
Figure 18: Employment Status by Gender per District __________________________ 28
Figure 19: Employment Type per District ____________________________________ 29
Figure 20: Contribution of Social Grants to Rural Household Income ______________ 30
LL IIMMPPOOPPOO RRUURRAALL TTRRAANNSSPPOORRTT SSTTRRAATTEEGGYY PPHHAASSEE 11:: SSTTAATTEE OOFF RRUURRAALL TTRRAANNSSPPOORRTT
December 2010 Update
iv
Figure 21: Main Source of Income in Rural Areas of Limpopo ___________________ 31
Figure 22: Education level of Fathers per District _____________________________ 31
Figure 23: Education Level of Mothers per district _____________________________ 32
Figure 24: School Going Trends of Children per District ________________________ 33
Figure 25: Gender Ratio per School going children in each District _______________ 33
Figure 26: Mode regularly used for Educational Trips __________________________ 34
Figure 27: Preferred Mode for Educational Trips ______________________________ 35
Figure 28: Mode Never Used for Educational Trips ____________________________ 35
Figure 29: Income Spent On Educational Trips _______________________________ 36
Figure 30: Mode Regularly Used to Work ___________________________________ 37
Figure 31: Mode Regularly Used to Work in the Limpopo Province _______________ 38
Figure 32: Mode Favoured by Main Income Earners ___________________________ 39
Figure 33: Favoured Mode to Travel to Work in the Limpopo Province _____________ 39 Figure 34: Mode never used for Work Trips __________________________________ 40
Figure 35: Mode Never Used to Work in the Limpopo Province __________________ 41
Figure 36: Income Spent by Income Earners on Transport to Travel to Work ________ 42
Figure 37: Extent of Weekday Travel by Households in Limpopo Province _________ 43
Figure 38: Weekday Trip Purpose in the Limpopo Province _____________________ 44
Figure 39: Transport Mode Use for Weekday Travel ___________________________ 44
Figure 40: Extent of Weekend Travel in Study Area ___________________________ 45
Figure 41: Weekend Trip Purpose in the Limpopo Province _____________________ 46
Figure 42: Transport Mode Used for Weekend Travel __________________________ 46
Figure 43: The Average Walking Time to a Public Transport Service ______________ 47
Figure 44: Day of the Week where Passengers wait longer for Public Transport _____ 49
Figure 45: Percentage of Households waiting longer than usual for Public Transport at the end of the Month ___________________________________________________ 50
Figure 46: Mode Used when Transporting Goods _____________________________ 52
Figure 47: Remote Travel Purpose ________________________________________ 53
Figure 48: Frequency of Travel to Remote Places _____________________________ 53
Figure 49: The Level of Satisfaction with Public Taxi Service ____________________ 55
Figure 50: The Level of Satisfaction with Bus Service __________________________ 57
Figure 51: Challenges encountered by Minibus Taxi Users in Limpopo ____________ 58
Figure 52: Challenges encountered by Bus Service Users in Limpopo _____________ 59 Figure 53: Challenges encountered by Train Users in Limpopo __________________ 59
Figure 54: Challenges encountered by Animal Drawn Carts Users ________________ 60
Figure 55: Challenges encountered by Cycling _______________________________ 61
Figure 56: Challenges encountered by Pedestrians ___________________________ 61

LL IIMMPPOOPPOO RRUURRAALL TTRRAANNSSPPOORRTT SSTTRRAATTEEGGYY PPHHAASSEE 11:: SSTTAATTEE OOFF RRUURRAALL TTRRAANNSSPPOORRTT
December 2010 Update
i
DEFINITIONS
Brick structure - house made of bricks Donkey Cart - own or hired donkey pulled cart for transporting goods or people Heavy truck - commercial heavy trucks (2 – 4 axles Horseback - travelling on horseback Hut - house made of mud or grass Informal house - includes shacks normally made of corrugated iron Lift - travel by getting free rides from motorists Light truck - commercial small pick- up trucks Motorcycle - own motorcycle Public Bus - public transport – subsidized buses Public Taxi - public transport – minibus taxis Public Bakkie - public transport – LDV’s used for transporting people Private Bakkie - own or hired light delivery vehicles Private bus - bus operating without a subsidy associated with high fares Private Car - own vehicle Private Taxi - includes metre taxis, privately hired vehicles (i.e. school transport) Shova-kalula - bicycles used by scholars for travelling to school Sigyagyawi - a go cart that runs between two points that are above the
ground (i.e. one mountain to one another) Stone structure - house made of stones Tent - tent used as a dwelling place Train - public transport - train
Unemployment - Wheel Cart - own or hired wheel cart for transporting goods or people

LL IIMMPPOOPPOO RRUURRAALL TTRRAANNSSPPOORRTT SSTTRRAATTEEGGYY PPHHAASSEE 11:: SSTTAATTEE OOFF RRUURRAALL TTRRAANNSSPPOORRTT
December 2010 Update
1
1 INTRODUCTION
As part of the compilation of the Rural Transport Strategy for the Limpopo Province, the execution of household surveys together with subsistence farmer, bulk transport and public transport surveys were required to address transport issues for the rural communities in the province.
This document presents the Final Status Quo Report. The purpose of this report is to provide a reflection of the current transport needs of households in the rural areas within the province through the presentation of findings observed at 10 rural areas identified by the District Municipalities and their Local Municipalities as well as transport needs of subsistence farmers, bulk transporters and public transport operators. The outline of the report is as follows: • Chapter 1 (this section) presents an introduction; • Chapter 2 provides background to the project; • Chapter 3 sets out the methodology followed for the execution of the rural transport
surveys; • Chapter 4 presents the discussion of rural transport aspects, as observed through the
rural transport surveys conducted in the province; • Chapter 5 summarises the Status Quo Report findings and • Chapter 6 provides an interpretation on the implications of the findings on rural transport
planning in the Limpopo Province.
LL IIMMPPOOPPOO RRUURRAALL TTRRAANNSSPPOORRTT SSTTRRAATTEEGGYY PPHHAASSEE 11:: SSTTAATTEE OOFF RRUURRAALL TTRRAANNSSPPOORRTT
December 2010 Update
2
2 BACKGROUND TO THE REPORT
The Department of Roads and Transport (DRT) of the Limpopo Province appointed AFRICON to compile its Rural Transport Strategy.
The project is divided into four distinct phases as follows:
• Phase 0: Mobilisation, Project Scoping and Inception; • Phase 1: Status Quo Analysis; • Phase 2: Intervention Strategy; • Phase 3: Development of an Implementation Plan.
Phase 0 , focussed on confirming the project scope and work programme with the client, and establishing communication channels.
Phase 1 performed an investigation of the status quo of rural transport and determining the nature of transport problems faced by social groupings through representative sampling of regions.
Phase 2 , which will commence after the approval of this report, will develop an intervention strategy, i.e. specific projects to be implemented in order to address the needs determined in Phase 1. Phase 3 will develop an Implementation Plan, listing projects to be implemented during a 3-year period and indicating budget requirements per year.
The objectives of the study are the following: • The provision of data to the DRT that will assist to quantify the actual rural
transport needs; • The development of a practical and implementable action programme with clear budgets
and timeframes – taking into cognisance the progress made in terms of the compilation and implementation of the Non-Motorised Transport Strategy, including Social Transport.

LL IIMMPPOOPPOO RRUURRAALL TTRRAANNSSPPOORRTT SSTTRRAATTEEGGYY PPHHAASSEE 11:: SSTTAATTEE OOFF RRUURRAALL TTRRAANNSSPPOORRTT
December 2010 Update
3
3 METHODOLOGY FOR EXECUTION OF RURAL TRANSPORT SURVEYS
This chapter explains the methodology which was employed in the execution of rural transport surveys in the Limpopo Province. There are four types of surveys which were undertaken to determine the transportation needs of the rural community in the province. The surveys undertaken include household surveys, subsistence farmer surveys, bulk transport surveys and public transport surveys.
3.1 Rural Household Survey The household surveys were undertaken in five District Municipalities of the province namely Capricorn, Mopani, Sekhukhune, Vhembe and Waterberg. Two Local Municipalities were selected by each District Municipality. In each Local Municipality, one study area was selected. The brief provided to the District Municipalities and their constituent Local Municipalities to aid the selection of study areas was to select villages within their jurisdiction that will illustrate the rural characteristics of the districts and the province.
The areas chosen by each of the District Municipalities, in association with their Local Municipalities, are shown in Table 1 .
Table 1: Limpopo Rural Transport Study Areas
DISTRICT MUNICIPALITY
LOCAL MUNICIPALITY
STUDY AREA
Capricorn Lepelle-Nkumpi Mafefe Blouberg Eldorado
Mopani Giyani Xitlakati Letaba Lemondokop
Sekhukhune Tubatse Shakung Makhuduthamage Leolo Moela
Vhembe Makhado Khomela Mutale Bende Mutale
Waterberg Lephalale Maeteletsa Mogalakwena Vianna
3.1.1 Development of Rural Household Surveys The objective of a survey need to be specific, clear-cut and definite and should aim at developing statistical information about the subject in hand – it is therefore very important to provide sufficient background information as well as the objective the survey wishes to achieve.
For the Limpopo Rural Transport Strategy (LRTS), the primary objective of developing the rural household surveys was to collect data for the purposes of determining transport needs of the rural community in the province. The main areas of data collection that were considered for the household surveys are as follows:

LL IIMMPPOOPPOO RRUURRAALL TTRRAANNSSPPOORRTT SSTTRRAATTEEGGYY PPHHAASSEE 11:: SSTTAATTEE OOFF RRUURRAALL TTRRAANNSSPPOORRTT
December 2010 Update
4
1. Socio-economic aspect (economic activity, education and household composition); 2. Travel demand aspects (household travelling patterns, transport usage, potential travel
patterns and perceived transport needs); 3. Transport Supply (attitude towards transport services, transport hindering aspects).
3.1.2 Sample Size The sample size in each study area shown in Table 4: was capped at 200 dwelling units. In total a sample size of 2000 dwelling units was envisaged to collate rural transport needs within the province.
3.1.3 Identification and Training of Surveyors Data was collected in a questionnaire format. In each study area 8 local enumerators were used for with the assistance of the Local Municipality. Table 2 shows the training dates in each study area.
Table 2: Limpopo Rural Transport Strategy – Surveyo rs Training Dates
DISTRICT MUNICIPALITY
LOCAL MUNICIPALITY
STUDY AREA TRAINING DATE
Capricorn Lepelle-Nkumpi Mafefe 9 June 2009
Blouberg Eldorado 10 June 2009
Mopani Giyani Xitlakati 15 May 2009
Letaba Lemondokop 26 May 2009
Sekhukhune Tubatse Shakung 8 June 2009
Makhuduthamage Leolo Moela 8 June 2009
Vhembe Makhado Khomela 10 June 2009 Mutale Bende Mutale 1 September 2009
Waterberg Lephalale Maeteletsa 18 May 2009
Mogalakwena Vianna 7 May 2009
3.1.4 Survey Execution The surveys were executed over three days in each study area. Table 3 shows the period in which rural household surveys were conducted in each study area.

LL IIMMPPOOPPOO RRUURRAALL TTRRAANNSSPPOORRTT SSTTRRAATTEEGGYY PPHHAASSEE 11:: SSTTAATTEE OOFF RRUURRAALL TTRRAANNSSPPOORRTT
December 2010 Update
5
Table 3: Limpopo Rural Transport Strategy – Data Co llection Dates
DISTRICT MUNICIPALITY
LOCAL MUNICIPALITY
STUDY AREA DATA COLLECTION
DATES
Capricorn Lepelle-Nkumpi Mafefe 17 – 19 June 2009
Blouberg Eldorado 22 – 24 June 2009
Mopani
Giyani Xitlakati 18 – 20 May 2009
Letaba Lemondokop 26 – 28 June 2009
Sekhukhune Tubatse Shakung 10 – 12 June 2009
Makhuduthamage Leolo Moela 10 – 12 June 2009
Vhembe Makhado Khomela 22 – 24 June 2009
Mutale Bende Mutale 2 – 4 September 2009
Waterberg Lephalale Maeteletsa 19 – 21 May 2009
Mogalakwena Vianna 12 – 14 May 2009
It is evident that the household surveys were performed over a total duration of 27 days spread over the months of May, June and September. Table 4 shows the number of questionnaires completed per study area.
Table 4: Limpopo Rural Transport Strategy - Number of Households Interviewed
DISTRICT MUNICIPALITY
LOCAL MUNICIPALITY
STUDY AREA NUMBER OF
QUESTIONNAIRES COMPLETED
Capricorn Lepelle-Nkumpi Mafefe 199
Blouberg Eldorado 174
Mopani Giyani Xitlakati 198
Letaba Lemondokop 200
Sekhukhune Tubatse Shakung 200
Makhuduthamage Leolo Moela 200
Vhembe Makhado Khomela 200 Mutale Bende Mutale 200
Waterberg Lephalale Maeteletsa 200
Mogalakwena Vianna 200
From the table above it is evident that a total 1,971 questionnaires were received back after the completion of the household survey.

LL IIMMPPOOPPOO RRUURRAALL TTRRAANNSSPPOORRTT SSTTRRAATTEEGGYY PPHHAASSEE 11:: SSTTAATTEE OOFF RRUURRAALL TTRRAANNSSPPOORRTT
December 2010 Update
6
3.1.5 Data Capturing and Processing Following the surveys execution, the data collected in the survey forms were captured and processed. For this purpose, a basic data spreadsheet was designed to enable capturing and processing of the data in an orderly, user-friendly manner, in accordance with field entries and numbering of the survey forms.
3.1.6 Data Analysis Once captured and processed, the data was analysed in terms of the following main survey categories: • Household Profile • Household Economic Activity • Household Education • Household Travelling Patterns • Transport Usage • Transportation of Goods • Travel Potential • Attitude towards Public Transport Services • Transport Hindering Aspects; and • Perceived Transport Needs
3.2 Subsistence Farmer Surveys The agricultural sector plays an important role in both the creation of employment as well as food production for the rural communities that were surveyed and therefore subsistence farmers play a vital role with regard to economic development and food production. For that purpose it was decided that the transport requirements of the subsistence farmers residing in the chosen villages need to be assessed to ensure that any hindering aspects are addressed as part of this project.
3.2.1 Development of Subsistence Farmer Surveys The main objective of the subsistence farmer survey is to gather information on the transport needs of the rural agricultural sector in the rural community.
The three main areas of data collection that were considered are as follows: • Economic activity; • Poverty alleviation; and • Accessibility and mobility conditions.
3.2.2 Sample Size It was recommended that 5 subsistence farmers be interviewed per study area except in cases where there were less than 5 farms in the vicinity of the study area.
3.2.3 Survey Execution The data collection supervisors deployed by the Study Team were responsible for the execution of subsistence farmer surveys. In all areas surveyed by the Study Team, subsistence farming
LL IIMMPPOOPPOO RRUURRAALL TTRRAANNSSPPOORRTT SSTTRRAATTEEGGYY PPHHAASSEE 11:: SSTTAATTEE OOFF RRUURRAALL TTRRAANNSSPPOORRTT
December 2010 Update
7
was only evident in Bende Mutale (Mutale LM), Khomela (Makhado LM) and Xitlakati Village (Tzaneen LM).
3.2.4 Data Analysis The data captured was analysed per study area. The results of the data analysis are shown in Section 4 .
3.3 Bulk Transport Survey Bulk transporters play an important role in the provision of goods to rural communities as well as from rural communities to markets. Addressing the mobility barriers faced by these bulk movers, act as a catalyst for ensuring these communities are able to receive goods on time.
3.3.1 Development of the Bulk Transport Survey The main objective of this survey was to gather information on transport needs of companies involved in the transportation of goods to and from rural communities. The main areas of data collection which were considered are as follows: • Economic activity and • Accessibility/Mobility conditions.
3.3.2 Sample Size The sample size for bulk transport surveys was 3 transportation companies serving the study area except in cases where there were less than 3 bulk transport movers in the vicinity of the study area.
3.3.3 Survey Execution The data collection supervisors deployed by the Study Team were responsible for the execution of subsistence farmer surveys. Bulk transport was only evident in Bende Mutale (Mutale LM), Khomela (Makhado LM) and Xitlakati Village (Tzaneen LM).
3.3.4 Data Analysis The results of the data analysis are shown in Section 4 . 3.4 Public Transport Service The public transport service surveys entailed the interviewing of bus companies and the taxi associations providing public transport services in the study area.
3.4.1 Development The primary objective of this survey was to determine transportation needs of public transport operators in rural areas. The main areas of data collection which were considered in the survey are as follows: (1) Public transport operations in study area and (2) Accessibility/Mobility conditions.
3.4.2 Sample Size The sample size was not limited to a specific number – the aim was to understand the extent of challenges being experienced by the public transport operators when providing public transport

LL IIMMPPOOPPOO RRUURRAALL TTRRAANNSSPPOORRTT SSTTRRAATTEEGGYY PPHHAASSEE 11:: SSTTAATTEE OOFF RRUURRAALL TTRRAANNSSPPOORRTT
December 2010 Update
8
services to the rural communities residing in the surveyed areas. However, only one private (non-subsidized) bus company was interviewed as part of the public transport surveys.
3.4.3 Survey Execution Similar to subsistence farmers and bulk transport surveys, the data collection supervisors deployed by the Study Team were responsible for the execution of Public Transport Service Surveys. 3.4.3.1 Minibus Taxi Service The Data Collection supervisors were however unable to engage with the public transport operators, in particular the minibus taxi service providers. Subsequently it was agreed with the client that the Taxi Council should be engaged to facilitate data collection for the study. A meeting was held with the Taxi Council on 1 August 2009, where the following was agreed with the Taxi Council:
• The Minibus Taxi Survey designed particularly for the study was left with the Taxi Council representatives for consideration and completion.
• The Taxi Council would be invited to participate in data collection in Bende Mutale village (Vhembe District Municipality).
The date for data collection in the only village left after 1 August 2009 was 1 September - 4 September 2009. The date was communicated to the client. However the Taxi Council could not join the Study Team during this period due to the following reasons: (1) lack of resources (transport) and (2) distance from Polokwane to Bende Mutale village. To that effect the Study Team has not received any correspondence from the Taxi Council with regard to the Minibus Taxi Survey. Therefore public transport service needs of the minibus taxi operators are not included in this report. 3.4.3.2 Bus Service Two meetings were held with the Bus Company on 4 June 2009 as well as 15 June 2009. The purpose of the first meeting was to outline the objectives of the study to the bus operators and leave a Bus Survey Form designed for the study with the stakeholder for consideration and completion. The meeting of the 15th June 2009 was to discuss the bus operators’ inputs into the study. 3.4.4 Data Analysis The results of the data analysis are shown in Section 4 .

LL IIMMPPOOPPOO RRUURRAALL TTRRAANNSSPPOORRTT SSTTRRAATTEEGGYY PPHHAASSEE 11:: SSTTAATTEE OOFF RRUURRAALL TTRRAANNSSPPOORRTT
December 2010 Update
9
4 RESULTS OF DATA ANALYSIS
This chapter provides the results of the analysis of the rural household surveys, the subsistence farmer surveys, the bulk transport surveys and the public transport service surveys. 4.1 Rural Household Survey Results Household surveys were executed in the following areas: • Mafefe in Lepelle-Nkumpi Local Municipality (Capricorn District); • Xitlakati Village in Giyani Local Municipality (Mopani District); • Shakung Village in Tubatse Local Municipality (Sekhukhune District); • Khomela Village in Makhado (Vhembe District); • Maeteletsa Village in Lephalale Local Municipality (Waterberg); • Eldorado Village in Blouberg Local Municipality (Capricorn District); • Lemondokop Village in Letaba Local Municipality (Mopani District); • Leolo Moela Village in Makhuduthamage Local Municipality (Sekhukhune District); • Bende Mutale Village in Mutale Local Municipality (Vhembe District) and • Vianna Village in Mogalekwena Local Municipality (Waterberg District). For purposes of this report, the results of the surveys are presented per district and aggregated for the province, in terms of the following main survey categories: • Household Profile; • Household Economic Activity; • Household Education; • Household Travelling Patterns; • Transport Usage; • Transportation of Goods; • Travel Potential; • Attitude towards Public Transport Services; • Transport Hindering Aspects; and • Perceived Transport Needs.

LL IIMMPPOOPPOO RRUURRAALL TTRRAANNSSPPOORRTT SSTTRRAATTEEGGYY PPHHAASSEE 11:: SSTTAATTEE OOFF RRUURRAALL TTRRAANNSSPPOORRTT
December 2010 Update
10
4.1.1 Household Profile The sections below outline the rural household profile within the Limpopo Province: 4.1.1.1 Household Size
Table 5 shows the number of persons in each household for the sampled rural areas.
Table 5: Average Number of Persons per Household
DISTRICT LOCAL
MUNICIPALITY FATHER MOTHER CHILDREN
EXTENDED FAMILY
MEMBERS TOTAL
AVERAGE HH SIZE
Capricorn Lepelle-Nkumpi 117 191 817 85 1210 6.1
Blouberg 96 153 580 211 1040 5.2
DM Total 2250 5.6
Mopani Letaba 107 189 703 355 1354 6.8
Giyani 133 163 604 205 1105 5.5
DM Total 2459 6.2
Sekhukhune Tubatse 129 188 791 247 1355 6.8
Makhuduthamage 104 193 796 466 1559 7.8
DM Total 2914 7.3
Vhembe Mutale 144 193 493 27 857 4.3
Makhado 122 185 531 122 960 4.9
DM Total 1817 4.6
Waterberg Lephalale 92 190 650 358 1290 6.5
Mogalakwena 95 177 876 510 1658 8.3
DM Total 2948 7.4
Limpopo 1139 1822 13991 2586 19538 6.3
Percentage (%) 6% 9% 72% 13% 100% The following observations are made from Table 5 : • On average, each household in the rural areas comprises of 6.3 persons per household. • Out of the five districts that were surveyed, the Waterberg District recorded the highest
number of persons per household with an average of 7.4 people, followed by Sekhukhune District with an average of 7.3 persons per household.
• Capricorn, Mopani and Vhembe Districts have the lowest average household size. • The Vhembe District has the smallest household size at an average of 4.6 persons per
household. • Mogalakwena and Makhuduthamage Local Municipalities have the highest average
household size, with approximately 8.3 and 7.8 persons per household, respectively. • Children contribute the highest number of persons in households at an average of 72% at
the provincial level, followed by extended family members (13%), mothers (9%) and fathers (6%).

LL IIMMPPOOPPOO RRUURRAALL TTRRAANNSSPPOORRTT SSTTRRAATTEEGGYY PPHHAASSEE 11:: SSTTAATTEE OOFF RRUURRAALL TTRRAANNSSPPOORRTT
December 2010 Update
11
Figure 1 shows the age group per gender for the surveyed villages in the form of a Bell Curve.
Figure 1: Age Group per Gender
57%
51%
51%
51%
48%
50%
45%
43%
43%
49%
49%
49%
52%
50%
55%
57%
0 - 6
7 - 12
13 - 17
18 - 29
30 - 44
45 - 59
60 - 64
65 - 65+
% of Households
Age
Gro
upFEMALESMALES
The following are observed: • Females are the more dominant gender in the age group from 30 to 65+. This indicates
the notion that most fathers are presently not residing in the rural areas as they have to seek employment opportunities in other areas.
• Between the age of 0 to 29, males are the dominant gender, with the exception of the age group between 7 and 12, where the aggregate amount of males is 49% at the provincial level.
• On average, the rural areas of the Limpopo Province have approximately 1% more females than males.
4.1.1.2 Level of Disability Disability refers to a restricted capability to perform particular activities. Table 6 shows the proportion of households with persons with disabilities in the rural areas surveyed.
Table 6: Extent of Disability in Rural Areas
DESCRIPTION CAPRICORN MOPANI SEKHUKHUNE VHEMBE WATERBERG TOTAL
Number of HHs with Disability 29 1 18 34 80 162 Total No. Of HH Surveyed 373 398 400 400 400 1971 % Disability 7.8% 0.3% 4.5% 8.5% 20.0% 8.2%
From the table above, it is evident that Waterberg District has the highest number of persons with disabilities. Mopani has the lowest number of persons and Sekhukhune has the second

LL IIMMPPOOPPOO RRUURRAALL TTRRAANNSSPPOORRTT SSTTRRAATTEEGGYY PPHHAASSEE 11:: SSTTAATTEE OOFF RRUURRAALL TTRRAANNSSPPOORRTT
December 2010 Update
12
lowest number of disabilities per household.
Figure 2 indicates the prevailing disabilities in the rural areas that were surveyed.
Figure 2: Disability Types
Sight25%
Physical18%
Communication
8%
Hearing22%
Emotional12%
Intellectual13%
Other3%
Sight Physical Communication HearingEmotional Intellectual Other
Blindness is the most common type of disability among households in the study area representing an average of 25% of households with disabilities. Deafness and physical disability represent 22% and 18% respectively. 4.1.1.3 Type of Dwelling Unit Table 7 provides an overview of the different dwelling types in the rural communities surveyed. The following was observed per district: • Capricorn : 75% of dwellings in the district are made of bricks, followed by those made
with stone representing 13% of dwellings surveyed. There are no dwellings in the form of tents. The total dwellings in the Capricorn district amount to 350, representing the district with the least amount of dwellings out of the five districts included in the survey. Capricorn has the highest proportion of brick houses of all the areas that were surveyed.
• Mopani : 64% of dwellings in the Mopani district constitute those made of bricks. Only about 1% of dwellings are of an informal nature.
• Sekhukhune : Dwellings made of bricks are prominent in the Sekhukhune district constituting approximately 62% of all dwelling types in the area. Huts and informal types of dwellings represent approximately 18% and 17% respectively. Sekhukhune district has the highest proportion of informal settlements of all areas that were surveyed.
• Vhembe : Similar to the districts mentioned above, most dwelling types in the rural areas of Vhembe are made of bricks, followed by huts constituting about 61% and 34%

LL IIMMPPOOPPOO RRUURRAALL TTRRAANNSSPPOORRTT SSTTRRAATTEEGGYY PPHHAASSEE 11:: SSTTAATTEE OOFF RRUURRAALL TTRRAANNSSPPOORRTT
December 2010 Update
13
respectively. Vhembe has the highest proportion of huts of all the areas that were surveyed.
• Waterberg : 68% of dwellings types in the rural areas of Waterberg are made of bricks. Informal types of dwellings constitute about 14% of dwellings in the area.
• Limpopo Province : At the provincial level, 66% of dwelling units in the areas that were surveyed are made of bricks, whilst 11% are made of stones.
Table 7: Dwelling Type within the Study Area
DISTRICT MUNICIPALITY BRICKS STONES HUT INFORMAL TENT OTHER TOTAL
Capricorn 263 46 22 14 1 4 350
Mopani 254 101 39 2 0 0 396
Sekhukhune 248 12 70 69 2 0 401
Vhembe 225 6 125 11 2 0 369
Waterberg 267 40 28 56 1 0 392
Total 1257 205 284 152 6 4 1908 Percentages
DISTRICT MUNICIPALITY BRICKS STONES HUT INFORMAL TENT OTHER TOTAL
Capricorn 75.1% 13.1% 6.3% 4.0% 0.3% 1.1% 100%
Mopani 64.1% 25.5% 9.8% 0.5% 0.0% 0.0% 100%
Sekhukhune 61.8% 3.0% 17.5% 17.2% 0.5% 0.0% 100%
Vhembe 61.0% 1.6% 33.9% 3.0% 0.5% 0.0% 100% Waterberg 68.1% 10.2% 7.1% 14.3% 0.3% 0.0% 100%
Total 65.9% 10.7% 14.9% 8.0% 0.3% 0.2% 100%
Figure 3 is a graphical representation of the different types and amounts of dwellings found in the survey area. The following observations are made from the above figure: • Capricorn has the highest number of dwelling units made of bricks (75%) followed by the
Waterberg (68%) and Mopani (64%) districts. • The rural areas surveyed in the Vhembe district have the highest number of huts (34%),
followed by rural areas in the Sekhukhune district (18%). • Sekhukhune district has the highest proportion of informal settlements. • Tents constitute less than 1% of types of dwellings used in all districts.

LL IIMMPPOOPPOO RRUURRAALL TTRRAANNSSPPOORRTT SSTTRRAATTEEGGYY PPHHAASSEE 11:: SSTTAATTEE OOFF RRUURRAALL TTRRAANNSSPPOORRTT
December 2010 Update
14
Figure 3: Dwelling type per District
0%
10%
20%
30%
40%
50%
60%
70%
80%
90%
100%
Capricon Mopani Sekhukhune Vhembe Waterberg Total
% o
f H
ouse
hold
s
District
Bricks Stones Hut Informal Tent Other
4.1.1.4 Vehicle Ownership Table 8 and Figure 4 show the type of vehicles owned by households in the surveyed villages. The following observations are made from Table 8 : • Capricorn : The types of vehicles owned in the rural areas of the Capricorn District include
animal-drawn carts (47%), horse/donkeys (15%), bicycles (14%) and light trucks (10%). • Mopani : 45% of households own animal-drawn carts, followed by 35% that own horses or
donkeys. None of the surveyed rural households in the Mopani District own cars, tractors or taxis making Mopani district the area with the lowest ownership of motorised transport.
• Sekhukhune : Approximately 53% of the households in Sekhukhune own animal- drawn carts, 21% own horses/ donkeys and 13% own light trucks. None of the households in the rural areas of the district own motorbikes.
• Vhembe: Prominent vehicle types in the rural areas of the Vhembe district are animal-drawn carts and horses/donkeys constituting 54% and 22% of vehicle types in the area.
• Waterberg: Animal-drawn carts represent the highest proportion of vehicle types owned by households in the district at 38%, followed by light trucks at 21%.
• Limpopo Province : Animal-drawn carts are collectively the most owned mode of transport in the rural areas of the Limpopo Province, followed by the ownership of horse or donkeys. The least owned modes of transport are heavy trucks, private cars, motorbikes, wheel-barrows, taxis and tractors.

LL IIMMPPOOPPOO RRUURRAALL TTRRAANNSSPPOORRTT SSTTRRAATTEEGGYY PPHHAASSEE 11:: SSTTAATTEE OOFF RRUURRAALL TTRRAANNSSPPOORRTT
December 2010 Update
15
Table 8: Vehicle Ownership per Household
CAPRICORN MOPANI SEKHUKHUNE VHEMBE WATERBERG TOTAL
NON-MOTORISED TRANSPORT
Bicycle 26 19 9 22 60 136
Horse/ Donkey 29 53 42 67 46 237
Animal-Drawn Cart 90 68 108 162 159 587
Wheelbarrow/ Handheld 2 6 5 1 1 15
Total Non-Motorised 147 146 164 252 266 975
MOTORISED TRANSPORT
Motorbike 2 1 1 6 5 15
Car 2 0 2 6 3 13
Taxi 15 0 2 12 43 72
Tractor 3 0 2 2 0 7
Truck Light 19 2 26 6 85 138
Truck Heavy 2 1 5 15 8 31
Other 0 1 0 0 4 5
Total Motorised 43 5 38 47 148 281
Total (All vehicle Types) 190 151 202 299 414 1256
Percentages NON-MOTORISED TRANSPORT
Bicycle 13.7% 12.6% 4.5% 7.4% 14.5% 10.8% Horse/Donkey 15.0% 35.1% 20.8% 22.4% 11.1% 18.9% Animal -Drawn Cart 47.0% 45.0% 53.5% 54.2% 38.4% 46.7% Wheelbarrow/ Handheld 1.0% 4.0% 2.5% 0.3% 0.2% 1.2% Total Non-Motorised 77.4% 96.7% 81.2% 84.3% 64.3% 77.6%
MOTORISED TRANSPORT
Motorbike 1.1% 0.7% 0.5% 2.0% 1.2% 1.2% Car 1.0% 0.0% 1.0% 2.0% 0.7% 1.0% Taxi 8.0% 0.0% 1.0% 4.0% 10.4% 5.7% Tractor 2.0% 0.0% 1.0% 0.7% 0.0% 0.6% Truck Light 10.0% 1.3% 12.9% 2.0% 20.5% 11.0%
Truck Heavy 1.0% 0.7% 2.5% 5.0% 1.9% 2.5% Other 0.0% 0.7% 0.0% 0.0% 1.0% 0.4% Total Motorised 22.6% 3.3% 18.8% 15.7% 35.7% 22.4% Total (All vehicle Types) 100% 100% 100% 100% 100% 100.0%
Figure 4 below shows vehicle ownership by district.

LL IIMMPPOOPPOO RRUURRAALL TTRRAANNSSPPOORRTT SSTTRRAATTEEGGYY PPHHAASSEE 11:: SSTTAATTEE OOFF RRUURRAALL TTRRAANNSSPPOORRTT
December 2010 Update
16
Figure 4: Vehicle Ownership by mode per district
The observation that can be made per mode in each district is as follows: • Taxis, light trucks and bicycles are dominant in the Waterberg District. • Heavy Trucks, Horse/Donkeys and car ownership is dominant in the Vhembe district. • There is no tractor, car and taxi ownership in the Mopani District. • Capricorn has the highest number of households that own tractors.
4.1.1.5 Income Level per Household Figure 5 shows the level of monthly income per household for the rural areas surveyed. From Figure 5 , the following observations can be made: • The majority (approximately 44%) of households in the study areas earn less than R500
per month, followed by about 18% of households earning less than R1500 per month and 12% of households earning less than R1000 per month.
• Approximately 4% of households in the survey area earn more than R5000, with 1% earning between R5001 and R6000 and 3% earning above R6000 per month.

LL IIMMPPOOPPOO RRUURRAALL TTRRAANNSSPPOORRTT SSTTRRAATTEEGGYY PPHHAASSEE 11:: SSTTAATTEE OOFF RRUURRAALL TTRRAANNSSPPOORRTT
December 2010 Update
17
Figure 5: Percentage of Household per Income Group
0% 10% 20% 30% 40% 50%
0 - R500
R501 - R1000
R1001 - R1500
R1501 - R3000
R3000 - R5000
R5001 - R6000
R6001+
% of households
Inco
me
Gro
up
Figure 6 to Figure 10 indicates the different income levels per district. 4.1.1.5.1 Household Income in Capricorn District Municipality Most households in the district of Capricorn earn less than R500 per month (55%), followed by those who earn between R1501 and R3000 (13.5%). Only about 1% of households in the area earn between R5001 and R6000, with approximately 1% of households earning more than R6001 per month.
Households earning less than R500 comprise of income from child grants and seasonal employment. Those receiving pension and various types of part-time jobs can earn up to R1000 per month. More professional qualified personnel such as doctors, teachers and engineers earn over R6001. The major source of income for the households that were surveyed is welfare grants which include pension, child grant and disability grant.

LL IIMMPPOOPPOO RRUURRAALL TTRRAANNSSPPOORRTT SSTTRRAATTEEGGYY PPHHAASSEE 11:: SSTTAATTEE OOFF RRUURRAALL TTRRAANNSSPPOORRTT
December 2010 Update
18
Figure 6: Capricorn District Household Income Group s
55%
13%12%
14%
5%
1%
1%
Capricorn
0 - R500 R501 - R1000 R1001 - R1500 R1501 - R3000
R3000 - R5000 R5001 - R6000 R6001+
4.1.1.5.2 Household Income in Mopani District Municipality Figure 7 below shows the differing income group levels of households within the Mopani District. Just as in the district of Capricorn, the majority of households in the rural areas of Mopani district earn less than R500 per month (67%). Households earning more than R6000 represent approximately 3% of households in the rural areas surveyed. Approximately 17% of households in the area earn between R1001 and R3000, with those earning between R1001 and R1500 representing about 8% of the households.
Figure 7: Mopani District Household Income Groups
67%
6%
8%
11%
5%
2%
3%
Mopani
0 - R500 R501 - R1000 R1001 - R1500 R1501 - R3000
R3000 - R5000 R5001 - R6000 R6001+

LL IIMMPPOOPPOO RRUURRAALL TTRRAANNSSPPOORRTT SSTTRRAATTEEGGYY PPHHAASSEE 11:: SSTTAATTEE OOFF RRUURRAALL TTRRAANNSSPPOORRTT
December 2010 Update
19
4.1.1.5.3 Household Income in Sekhukhune District Municipality Similar to the districts discussed above, the majority of rural households in the district of Sekhukhune earns less than R500 per month (59%) followed by those earning between R1001 and R1500 (19%). Only a small portion of households in the area earn between R5000 and R6000.
Figure 8: Sekhukhune District Household Income Grou ps
59%
6%19%
7%
4%
0%
4%
Sekhukhune
0 - R500 R501 - R1000 R1001 - R1500 R1501 - R3000
R3000 - R5000 R5001 - R6000 R6001+
4.1.1.5.4 Household Income in Vhembe District Municipality Figure 9 shows income categories in Vhembe District. Unlike the districts discussed above, approximately 85% of rural households in the Vhembe District earn less than R3000 per month (with 22.3% earning less than R500, 21.3% between R501 and R1000, 21% between R1501 and R3000 and 20.8% between R1001 and R1500). Only about 1% of households earn between R5001 and R6000 and about 4.8% earning over R6000 per month.

LL IIMMPPOOPPOO RRUURRAALL TTRRAANNSSPPOORRTT SSTTRRAATTEEGGYY PPHHAASSEE 11:: SSTTAATTEE OOFF RRUURRAALL TTRRAANNSSPPOORRTT
December 2010 Update
20
Figure 9: Vhembe District Household Income Groups
22%
21%
21%21%
9%
1%
5%
Vhembe
0 - R500 R501 - R1000 R1001 - R1500 R1501 - R3000
R3000 - R5000 R5001 - R6000 R6001+
4.1.1.5.5 Household Income in Waterberg District Municipality Approximately 55% of rural households in the Waterberg district earn between R1001 and R3000 month (33% of households earn between R1001 and R1500 and approximately 22% earn between R1501 and R3000 on a monthly basis). In addition to this, approximately 21% of rural households in the survey area earn less than R500 per month. Only 1% of households earn between R5001 and R6000 in a month.
Figure 10: Waterberg District Household Income Grou ps
21%
13%
33%
22%
9%
1%
2%
Waterberg
0 - R500 R501 - R1000 R1001 - R1500 R1501 - R3000
R3000 - R5000 R5001 - R6000 R6001+

LL IIMMPPOOPPOO RRUURRAALL TTRRAANNSSPPOORRTT SSTTRRAATTEEGGYY PPHHAASSEE 11:: SSTTAATTEE OOFF RRUURRAALL TTRRAANNSSPPOORRTT
December 2010 Update
21
4.1.1.6 Income Expenditure per Household This section assesses the patterns in income expenditure in the survey area. The main categories that were used to conduct this assessment are: food, school fees; savings; transport; account payments; building material; electricity; insurance policies; hair salon; paraffin; offerings and others. Figure 11 below shows the average expenditure patterns per rural household within the study area.
Figure 11: Total Household Monthly Expenditures
Food31%
Transport10%
Electricity4%
Paraffin1% School Fees
22%
Account Payments23%
Insurance Policies1%
Offerings1%
Savings0%
Building Material2%
Hair Salon0%
Others5%
The majority of households in the survey area spend most of their income on food (31%), account payments (23%) and school fees (22%). Households spend approximately 10% of their income on transport expenses, which is within the stipulated standard for the nation.
Figure 12 shows a comparison of transport expenditure between the five districts. Observations made are as follows: • Both Mopani and Sekhukhune Districts spend the most on transportation at rates of 28%
and 25%, respectfully. • All districts show an expenditure on transport of more than the provincial average of 10%. • The Capricorn District shows the least amount of money spent on transportation at a rate
of 11%.

LL IIMMPPOOPPOO RRUURRAALL TTRRAANNSSPPOORRTT SSTTRRAATTEEGGYY PPHHAASSEE 11:: SSTTAATTEE OOFF RRUURRAALL TTRRAANNSSPPOORRTT
December 2010 Update
22
Figure 12: Monthly Transport Expenditure per Distri ct
CapriconR 2 217
11%
MopaniR 5 668
28%
SekhukhuneR 5 062
25%
VhembeR 4 818
23%
WaterbergR 2 775
13%
4.1.1.7 Access to Basic Resources The section below provides an analysis on access to basic needs such as water, energy and ablution in the rural communities.
• Access to Water
Figure 13 shows the different sources of water available in the rural areas that were surveyed for the study. These sources include rivers, taps, boreholes, etc. The following observations were made: o Capricorn : The most prominent source of water in the surveyed rural areas of
Capricorn is the Community tap, representing 46% of sources of water available. Only 3% of households have access to a river.
o Mopani : All of the households in the survey areas of Mopani district have communal taps as the only source of water.
o Sekhukhune : 51% of households have access to taps on their own premises followed by 41% who use water from a river.
o Vhembe : 54% of rural households in the surveyed area have access to community taps and about 46% have taps on their own premises.
o Waterberg : 57% of households have taps on their own premises followed by 42% which collect water from communal taps.

LL IIMMPPOOPPOO RRUURRAALL TTRRAANNSSPPOORRTT SSTTRRAATTEEGGYY PPHHAASSEE 11:: SSTTAATTEE OOFF RRUURRAALL TTRRAANNSSPPOORRTT
December 2010 Update
23
Figure 13: Access to Water per District
0%
10%
20%
30%
40%
50%
60%
70%
80%
90%
100%
Capricon Mopani Sekhukhune Vhembe Waterberg
% o
f H
ou
se
ho
lds
District
Community Tap Tap on Premises Borehole Access to a River Other
• Access to Sanitation
The type of ablution used per district is shown in Figure 14.
Figure 14: Access to Sanitation per district
0%
10%
20%
30%
40%
50%
60%
70%
80%
90%
100%
Capricorn Mopani Sekhukhune Vhembe Waterberg
% o
f Hou
seho
lds
District
Pit Flushabe None Other
From Figure 14 it is evident that Capricorn District has the largest amount of households that have access to flushable toilets. Approximately 37% of households in the Sekhukhune District do not have access to toilets.

LL IIMMPPOOPPOO RRUURRAALL TTRRAANNSSPPOORRTT SSTTRRAATTEEGGYY PPHHAASSEE 11:: SSTTAATTEE OOFF RRUURRAALL TTRRAANNSSPPOORRTT
December 2010 Update
24
• Access to Energy Figure 15 shows the source of energy used per district.
Figure 15: Sources of Energy per Rural Household
0%
10%
20%
30%
40%
50%
60%
70%
80%
90%
100%
Capricorn Mopani Sekhukhune Vhembe Waterberg
% o
f Hou
seho
lds
District
Firewood Animal Dung Electricity Paraffin Candles Gas
The majority of households in the Waterberg, Capricorn and Mopani Districts use mostly firewood as a source of energy. 51%, 45% and 43% of households in the districts of Vhembe, Waterberg and Capricorn use electricity as a source of energy. Animal dung is only used in the districts of Sekhukhune and Vhembe. Paraffin is mostly used in the households of the Mopani and Sekhukhune Districts. Sekhukhune District is the only district where households use candles as a source of energy.
4.1.1.8 Livestock Ownership The table below assesses the different types of livestock owned by households per district. The following observations were made: • Capricorn: 38% of livestock owned by rural households surveyed comprises chickens
and 28% comprise goats. No household owns doves, pigeons and geese in the areas surveyed.
• Mopani: The majority of livestock owned by rural households in the Mopani District comprise of chicken (45%) followed by cattle (26%) and goats (19%).
• Sekhukhune: Similar to both the Capricorn and Mopani Districts, the majority of livestock that households have consist of chicken representing 31% of the entire livestock population surveyed.
• Vhembe: 34% of the livestock population of rural households surveyed comprises of chicken followed by Cattle with 29%.

LL IIMMPPOOPPOO RRUURRAALL TTRRAANNSSPPOORRTT SSTTRRAATTEEGGYY PPHHAASSEE 11:: SSTTAATTEE OOFF RRUURRAALL TTRRAANNSSPPOORRTT
December 2010 Update
25
• Waterberg: 49% of livestock owned by rural households of Waterberg District comprise of chicken, 22% of cattle and 18% of goats. No geese and horses are owned by any of the rural households surveyed.
• Limpopo Province : The ownership of chicken is prominent in all the districts with Waterberg having the highest number of chicken. Households in the district of Sekhukhune have the highest number of horses and also have the majority of sheep, goats and donkeys. Sekhukhune is the only district where households own geese.
Table 9: Livestock Ownership per District
ANIMAL DISTRICT MUNICIPALITY
TOTAL CAPRICORN MOPANI SEKHUKHUNE VHEMBE WATERBERG
Cattle 278 643 696 1200 628 3445 Sheep 144 68 226 56 28 522 Goats 583 468 944 889 526 3410 Donkey 192 28 489 178 170 1057 Horses 6 12 64 8 0 90 Pigs 69 77 166 272 12 596 Chickens 792 1102 1190 1386 1404 5874 Ducks 2 36 50 60 33 181 Doves 0 41 28 25 30 124 Pigeons 0 0 6 0 20 26 Geese 0 0 6 0 0 6
Percentages
ANIMAL CAPRICORN MOPANI SEKHUKHUNE VHEMBE WATERBERG TOTAL
Cattle 13.5% 26.0% 18.0% 29.5% 22.0% 22.5% Sheep 7.0% 2.7% 5.8% 1.4% 1.0% 3.4% Goats 28.2% 18.9% 24.4% 21.8% 18.4% 22.2% Donkey 9.3% 1.1% 12.7% 4.4% 6.0% 6.9% Horses 0.3% 0.5% 1.7% 0.2% 0.0% 0.6% Pigs 3.3% 3.1% 4.3% 6.7% 0.4% 3.9% Chickens 38.3% 44.5% 30.8% 34.0% 49.2% 38.3% Ducks 0.1% 1.5% 1.3% 1.5% 1.2% 1.2% Doves 0.0% 1.7% 0.7% 0.6% 1.1% 0.8% Pigeons 0.0% 0.0% 0.2% 0.0% 0.7% 0.2% Geese 0.0% 0.0% 0.2% 0.0% 0.0% 0.0%
Figure 16 is a graphical illustration of Table 9 .

LL IIMMPPOOPPOO RRUURRAALL TTRRAANNSSPPOORRTT SSTTRRAATTEEGGYY PPHHAASSEE 11:: SSTTAATTEE OOFF RRUURRAALL TTRRAANNSSPPOORRTT
December 2010 Update
26
Figure 16: Livestock Ownership per District
4.1.2 Household Economic Activity This section assesses household employment status and the type of employment per household. 4.1.2.1 Employment Status per Household Figure 17 shows employment status for rural areas within the province. The following observations are made: • 34% of people that were interviewed are unemployed. 9% of households are employed on
a permanent basis and 11% on a conditional (temporal) basis. • 53% of people interviewed consist of school-going persons, with 28% of them being post-
matric students, 10% attending school and 15% attending pre-school. • Pensioners account for 2% of people that were interviewed.

LL IIMMPPOOPPOO RRUURRAALL TTRRAANNSSPPOORRTT SSTTRRAATTEEGGYY PPHHAASSEE 11:: SSTTAATTEE OOFF RRUURRAALL TTRRAANNSSPPOORRTT
December 2010 Update
27
Furthermore: • The district of Sekhukhune has the highest proportion of permanently employed persons
residing in the surveyed rural areas followed by Waterberg. • Sekhukhune also has the highest number of unemployed persons living in the rural areas,
followed by those living in the Waterberg district. • Vhembe has the lowest number of post-matric students whereas Waterberg has the
highest proportion of children attending pre-school.
Figure 17: Employment Status in Rural Areas of the Limpopo Province
0% 5% 10% 15% 20% 25% 30% 35% 40%
Permanent
Conditional
Unemployed
Student
Scholar
Pre-School
Pensioner
Others
% of Households
Em
ploy
men
t Cat
egor
y
Employment Status
Table 10 shows the employment status by gender per district.
Table 10: Employment Status by Gender per district
CAPRICORN MOPANI SEKHUKHUNE VHEMBE WATERBERG
MALE FEMALE MALE FEMALE MALE FEMALE MALE FEMALE MALE FEMALE
Permanent 18% 19% 10% 5% 32% 39% 16% 22% 23% 16%
Conditional 13% 14% 8% 7% 49% 43% 17% 19% 12% 17%
Unemployed 19% 20% 12% 16% 28% 26% 14% 12% 27% 26%
Student 23% 23% 14% 14% 28% 31% 5% 7% 29% 25%
Scholar 7% 12% 23% 22% 15% 12% 42% 37% 13% 18%
Pre-School 11% 6% 14% 11% 27% 23% 15% 30% 33% 30%
Pensioner 8% 10% 12% 25% 37% 24% 44% 42% 0% 0%
Others 0% 0% 0% 3% 80% 97% 20% 0% 0% 0%

LL IIMMPPOOPPOO RRUURRAALL TTRRAANNSSPPOORRTT SSTTRRAATTEEGGYY PPHHAASSEE 11:: SSTTAATTEE OOFF RRUURRAALL TTRRAANNSSPPOORRTT
December 2010 Update
28
Figure 18: Employment Status by Gender per District
4.1.2.2 Main Employment per District Each surveyed household was asked to define its main source of income from the following employment types: • Mining; • Agriculture; • Trade; • Manufacturing; • Public Service; • Building and Construction; • Finance, Property and Business Services; • Tourism/ Recreation; • Communications; • Transport and Storage; • Informal Business; and • Other (this includes social grants and pensions). Figure 19 indicates the various employment types for the surveyed areas.

LL IIMMPPOOPPOO RRUURRAALL TTRRAANNSSPPOORRTT SSTTRRAATTEEGGYY PPHHAASSEE 11:: SSTTAATTEE OOFF RRUURRAALL TTRRAANNSSPPOORRTT
December 2010 Update
29
Figure 19: Employment Type per District
The following was observed: • Capricorn : 33% of households in the study area are employed in the Agricultural sector
followed by the Public Services sector at 16%. No households are employed in the Tourism and the Communications sector.
• Mopani : The majority of households in the Mopani District earn their income from social grants, i.e. child, disability grants and pension. The Mining and Tourism sectors are the major types of employment in the district.
• Sekhukhune : Approximately 37% of income is earned from other sources including social grants and pension. The mining sector employs 21% of persons living in the rural survey area of Sekhukhune.
• Vhembe: Similar to Sekhukhune and Mopani Districts, households in the rural areas of Vhembe earn the majority of their income from social grants and pension pay-outs. Approximately 14% of households are employed in the Mining sector.
• Waterberg : Out of the 5 surveyed districts, rural households in the Waterberg district rely the most on social grants and pension constituting approximately 49% of all income earned in the area.

LL IIMMPPOOPPOO RRUURRAALL TTRRAANNSSPPOORRTT SSTTRRAATTEEGGYY PPHHAASSEE 11:: SSTTAATTEE OOFF RRUURRAALL TTRRAANNSSPPOORRTT
December 2010 Update
30
The extent of households that are dependent on social grants within the rural areas surveyed is shown in Figure 20 .
Figure 20: Contribution of Social Grants to Rural H ousehold Income
The following was observed: • Pension : 95% of households in the surveyed rural areas of the Sekhukhune District rely
on Pension as a source of income followed by Mopani District with 77%. Rural household in the district of Vhembe rely the least on pension (51%) out of all the five districts surveyed.
• Child Grant : 49% of rural households in the Vhembe District, 29% of households in the Waterberg District and 27% of households in the Capricorn District receive Child Grants. Rural Households in the Sekhukhune District receive the lowest percentage of Child Grants at 5%.
• Disability Grants: Disability Grants are received by 5% of the rural households in the Capricorn District. No disability grants are being administered in the other four districts that were surveyed.
4.1.2.3 Main Provincial Source of Income Figure 21 shows the main sources of income as a collective of the ten study areas in the province.
Other sources, of which the majority consists of social grants and pension, are the main sources of income in the rural areas surveyed. The Mining Sector is the second highest employer with 15% of households being employed in this sector. Both the Mining and Agricultural sector employs 26% of households in the surveyed area. No households are employed in the Communications sector and only approximately 2% are employed in the Tourism sector. The Manufacturing and Public Services sectors employ 7.2% and 7.3% of households surveyed, respectively.

LL IIMMPPOOPPOO RRUURRAALL TTRRAANNSSPPOORRTT SSTTRRAATTEEGGYY PPHHAASSEE 11:: SSTTAATTEE OOFF RRUURRAALL TTRRAANNSSPPOORRTT
December 2010 Update
31
Figure 21: Main Source of Income in Rural Areas of Limpopo
4.1.3 Household Education The level of education was assessed for fathers and mothers in the surveyed areas. Figure 22 below shows the level of education of fathers in the rural households surveyed. An average of 2.2% of fathers across all five districts has some form of tertiary education. Waterberg District has the highest number of fathers who had no schooling constituting 27% of households surveyed in the district followed by the district of Capricorn with 26%. In the Vhembe district approximately 15% of fathers have a matric qualification.
Figure 22: Education level of Fathers per District
0%
10%
20%
30%
40%
50%
60%
70%
80%
90%
100%
Capricorn Mopani Sekhukhune Vhembe Waterberg
% o
f Fat
hers
District
No Schooling Pre-Schooling Primary Secondary Matric Tertiary
LL IIMMPPOOPPOO RRUURRAALL TTRRAANNSSPPOORRTT SSTTRRAATTEEGGYY PPHHAASSEE 11:: SSTTAATTEE OOFF RRUURRAALL TTRRAANNSSPPOORRTT
December 2010 Update
32
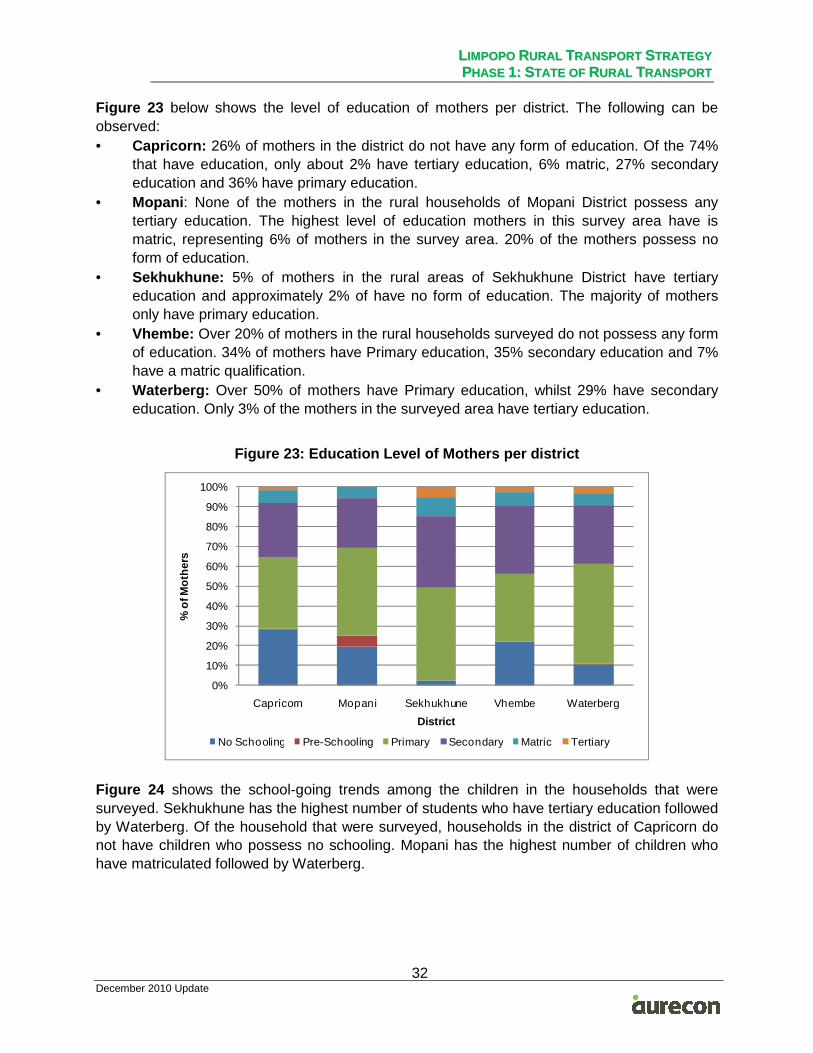
Figure 23 below shows the level of education of mothers per district. The following can be observed: • Capricorn: 26% of mothers in the district do not have any form of education. Of the 74%
that have education, only about 2% have tertiary education, 6% matric, 27% secondary education and 36% have primary education.
• Mopani : None of the mothers in the rural households of Mopani District possess any tertiary education. The highest level of education mothers in this survey area have is matric, representing 6% of mothers in the survey area. 20% of the mothers possess no form of education.
• Sekhukhune: 5% of mothers in the rural areas of Sekhukhune District have tertiary education and approximately 2% of have no form of education. The majority of mothers only have primary education.
• Vhembe: Over 20% of mothers in the rural households surveyed do not possess any form of education. 34% of mothers have Primary education, 35% secondary education and 7% have a matric qualification.
• Waterberg: Over 50% of mothers have Primary education, whilst 29% have secondary education. Only 3% of the mothers in the surveyed area have tertiary education.
Figure 23: Education Level of Mothers per district
0%
10%
20%
30%
40%
50%
60%
70%
80%
90%
100%
Capricorn Mopani Sekhukhune Vhembe Waterberg
% o
f Mot
hers
District
No Schooling Pre-Schooling Primary Secondary Matric Tertiary
Figure 24 shows the school-going trends among the children in the households that were surveyed. Sekhukhune has the highest number of students who have tertiary education followed by Waterberg. Of the household that were surveyed, households in the district of Capricorn do not have children who possess no schooling. Mopani has the highest number of children who have matriculated followed by Waterberg.
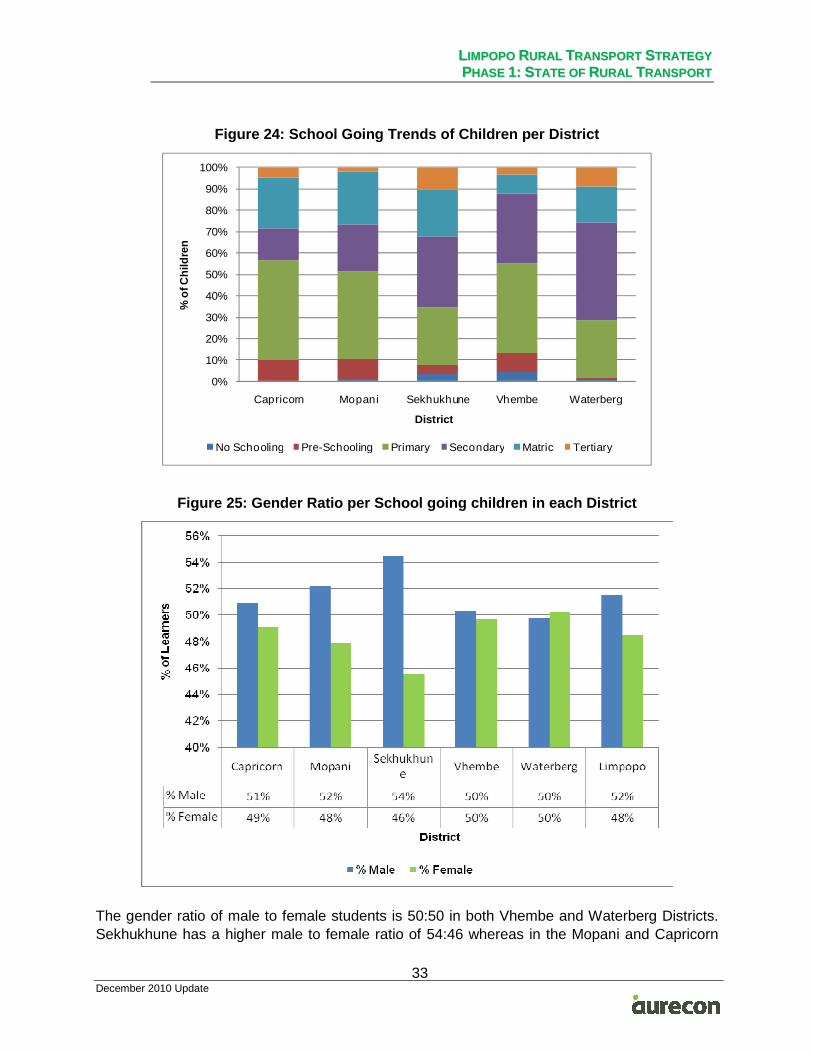
LL IIMMPPOOPPOO RRUURRAALL TTRRAANNSSPPOORRTT SSTTRRAATTEEGGYY PPHHAASSEE 11:: SSTTAATTEE OOFF RRUURRAALL TTRRAANNSSPPOORRTT
December 2010 Update
33
Figure 24: School Going Trends of Children per Dist rict
0%
10%
20%
30%
40%
50%
60%
70%
80%
90%
100%
Capricorn Mopani Sekhukhune Vhembe Waterberg
% o
f Chi
ldre
n
District
No Schooling Pre-Schooling Primary Secondary Matric Tertiary
Figure 25: Gender Ratio per School going children i n each District
The gender ratio of male to female students is 50:50 in both Vhembe and Waterberg Districts. Sekhukhune has a higher male to female ratio of 54:46 whereas in the Mopani and Capricorn

LL IIMMPPOOPPOO RRUURRAALL TTRRAANNSSPPOORRTT SSTTRRAATTEEGGYY PPHHAASSEE 11:: SSTTAATTEE OOFF RRUURRAALL TTRRAANNSSPPOORRTT
December 2010 Update
34
Districts the ratio is 52:48 and 51:49, respectively. The student gender ratio in the whole province is 52:48. 4.1.3.1 Mode used for Educational Trips Figure 26 shows the mode of transport that is regularly used for educational trips. It is evident from Figure 26 that walking is the most frequently used mode for educational trips in all the five districts, followed by buses.
Figure 26: Mode regularly used for Educational Trip s
Figure 27 shows the favoured1 mode of transport for educational trips. The majority of students choose walking to school in the Limpopo Province. Second preference is the use of buses followed by private taxis and bicycles. Figure 28 shows the mode of transport that is never used for educational trips.
The following can be observed: • Donkey carts are not used for educational trips in the Districts of Capricorn, Vhembe and
Waterberg. • Buses are rarely used for educational trips in Sekhukhune District. • The students seldom use other modes of transport except walking. • The main reasons these modes are never used for educational trips include limited access
to public transport, unavailability, non-affordability and non-safety.
1 The term “preferred” was not used as it can be misleading in the sense that certain modes of transport are not available but may possibly be preferred above other modes of transport if they were in fact available (e.g. private cars).

LL IIMMPPOOPPOO RRUURRAALL TTRRAANNSSPPOORRTT SSTTRRAATTEEGGYY PPHHAASSEE 11:: SSTTAATTEE OOFF RRUURRAALL TTRRAANNSSPPOORRTT
December 2010 Update
35
Figure 27: Preferred Mode for Educational Trips
Figure 28: Mode Never Used for Educational Trips

LL IIMMPPOOPPOO RRUURRAALL TTRRAANNSSPPOORRTT SSTTRRAATTEEGGYY PPHHAASSEE 11:: SSTTAATTEE OOFF RRUURRAALL TTRRAANNSSPPOORRTT
December 2010 Update
36
Table 11 below provides a summary of why students in rural areas never use specific modes for educational trips.
Table 11: Reasons for Not Using Modes for Education al Trips in the Limpopo
MODE REASON Car School is nearby Lift Not safe and not easily available Private Bakkie Expensive and not safe for scholars Private Taxi Expensive Bicycle Slow Motorcycle Not available Walk Lack of public transport due to bad roads Donkey Cart Slow and not safe Horseback Not safe and not available Wheel Cart Slow Bus Not enough buses Minibus/ Taxi Expensive Public Bakkie Not safe Train Not Available Shova-Kalula Not Available Sigyagyawi Not Available
4.1.3.2 Money Spent on Education Trips Figure 29 shows the percentage of households income spent on educational trip.
Figure 29: Income Spent On Educational Trips
Figure 29 above indicates the amount of money spent on educational trips in the districts of
LL IIMMPPOOPPOO RRUURRAALL TTRRAANNSSPPOORRTT SSTTRRAATTEEGGYY PPHHAASSEE 11:: SSTTAATTEE OOFF RRUURRAALL TTRRAANNSSPPOORRTT
December 2010 Update
37
Capricorn, Vhembe and Waterberg only. 68% of the households in the district of Capricorn spend between R101 and R200 on educational trips per month followed by 59% households in the Vhembe District also spending between R101 and R200 per month. While in Waterberg District 38% of households spend between R101 and R200 on educational trips on a monthly basis. Similarly, 38% of households in the Waterberg District spend less than R50 on educational trips per month. Only 8% of households in the District of Vhembe spend between R501 and R1000 on educational trips per month. Members of rural households in both the Mopani and Sekhukhune Districts did not respond to this section of the survey.
4.1.4 Household Travelling Patterns This section outlines the travelling patterns of a household for the following trip purposes: (1) Work trip (by main income earner); (2) Typical weekday trip (by any member of the household other than the income earner); and (3) Typical weekend trip.
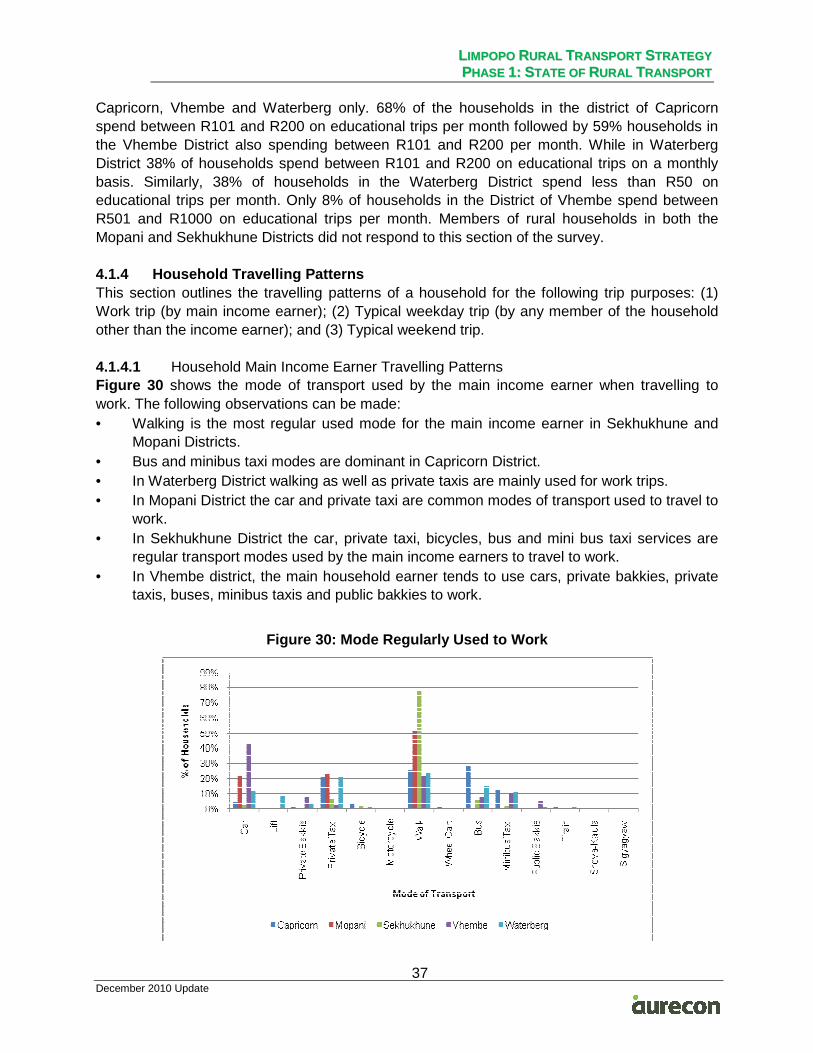
4.1.4.1 Household Main Income Earner Travelling Patterns Figure 30 shows the mode of transport used by the main income earner when travelling to work. The following observations can be made: • Walking is the most regular used mode for the main income earner in Sekhukhune and
Mopani Districts. • Bus and minibus taxi modes are dominant in Capricorn District. • In Waterberg District walking as well as private taxis are mainly used for work trips. • In Mopani District the car and private taxi are common modes of transport used to travel to
work. • In Sekhukhune District the car, private taxi, bicycles, bus and mini bus taxi services are
regular transport modes used by the main income earners to travel to work. • In Vhembe district, the main household earner tends to use cars, private bakkies, private
taxis, buses, minibus taxis and public bakkies to work.
Figure 30: Mode Regularly Used to Work

LL IIMMPPOOPPOO RRUURRAALL TTRRAANNSSPPOORRTT SSTTRRAATTEEGGYY PPHHAASSEE 11:: SSTTAATTEE OOFF RRUURRAALL TTRRAANNSSPPOORRTT
December 2010 Update
38
Figure 31 shows the mode of transport that is regularly used to travel to and from work aggregated at provincial level. The figure shows that walking is regularly used as a mode for work trips with approximately 46% of the main income earners regularly walking to work. 16% of the main income earners use private taxi to travel to work while 13% regularly drive to work. Approximately 20% of the main income earners regularly use public transport to work. This comprise of buses with 11%, minibus taxis 7%, train and public bakkie 1%. The least regularly used modes to travel to work are bicycles, both private and public bakkies, lifts and trains.
Figure 31: Mode Regularly Used to Work in the Limpo po Province
Car13% Lift
2%
Private Bakkie2%
Private Taxi16%
Bicycle2%
Motorcycle0%
Walk46%
Wheel Cart0%
Bus11%
Minibus Taxi7%
Public Bakkie1%
Train1%
Car Lift Private Bakkie Private Taxi Bicycle Motorcycle
Walk Wheel Cart Bus Minibus Taxi Public Bakkie Train
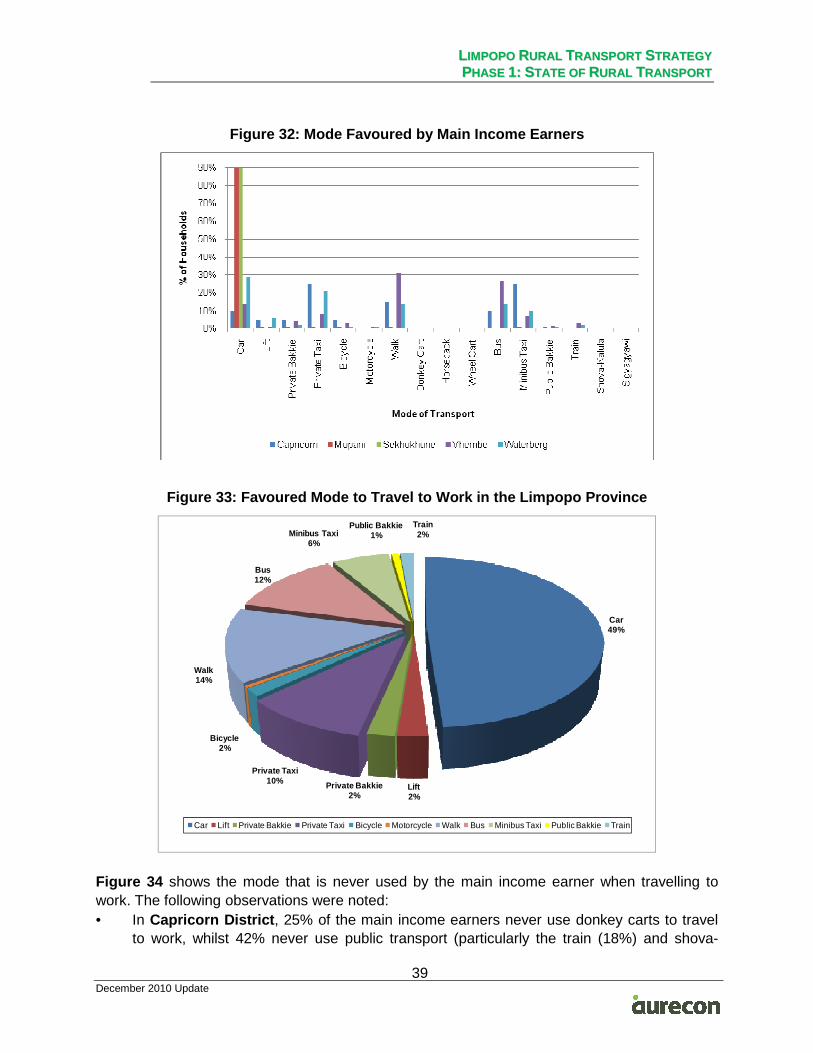
Figure 32 shows the mode mostly favoured by the main income earner when travelling to work. Figure 32 shows that the car is the most favoured mode for work trips in the Mopani, Sekhukhune and Waterberg Districts. Walking and the bus are the most favoured modes to work by income earners residing in Vhembe District, while in the Capricorn District minibus taxis and private taxis are the most favoured modes to work. In Waterberg district private taxis are the second favoured mode of transport to work. The least favoured modes to use for work trips in all the districts are trains, motorcycles, bicycles, lifts, and both private and public bakkies. Figure 33 shows the mode of transport that is preferred for work trips aggregated at provincial level. Figure 33 shows that the car is the most preferred mode for work trips with approximately 49% of the main income earners. 14% of the main income earners prefer to walk to work while 10% prefer to use private taxis. Approximately 21% of the income earners prefer to use public transport to work. This include buses with 12%, minibus taxis 6%, trains 2% and public bakkies 1%.
LL IIMMPPOOPPOO RRUURRAALL TTRRAANNSSPPOORRTT SSTTRRAATTEEGGYY PPHHAASSEE 11:: SSTTAATTEE OOFF RRUURRAALL TTRRAANNSSPPOORRTT
December 2010 Update
39
Figure 32: Mode Favoured by Main Income Earners
Figure 33: Favoured Mode to Travel to Work in the L impopo Province
Car49%
Lift2%
Private Bakkie2%
Private Taxi10%
Bicycle2%
Walk14%
Bus12%
Minibus Taxi6%
Public Bakkie1%
Train2%
Car Lift Private Bakkie Private Taxi Bicycle Motorcycle Walk Bus Minibus Taxi Public Bakkie Train
Figure 34 shows the mode that is never used by the main income earner when travelling to work. The following observations were noted: • In Capricorn District , 25% of the main income earners never use donkey carts to travel
to work, whilst 42% never use public transport (particularly the train (18%) and shova-

LL IIMMPPOOPPOO RRUURRAALL TTRRAANNSSPPOORRTT SSTTRRAATTEEGGYY PPHHAASSEE 11:: SSTTAATTEE OOFF RRUURRAALL TTRRAANNSSPPOORRTT
December 2010 Update
40
kalula (11%). • In Mopani District, 47% of the main income earners never walk to work whilst 23% never
use public transport i.e. bus 16% and minibus taxi 7%. 15% of the main income earners also never use private taxis to work.
• In Sekhukhune District , 35% of the main income earners do not make use of the bus or minibus services to travel to work, whilst 24% do not make use of private taxis. 22% of the main income earners never walk to work.
• In Vhembe District , about 45% of the main income earners do not make use of public transport (mostly the train 11% and bus 10%) for work trips, whilst 8% do not make use of motorcycles.
• In Waterberg District , 36% of the income earners never use public transport to travel to work. This includes bus, minibus, public bakkie, train, shova-kalula and sigyagyawi. 64 % of the income earners never make use of private transport to work, mainly the donkey cart, horseback and walking.
Figure 34: Mode never used for Work Trips
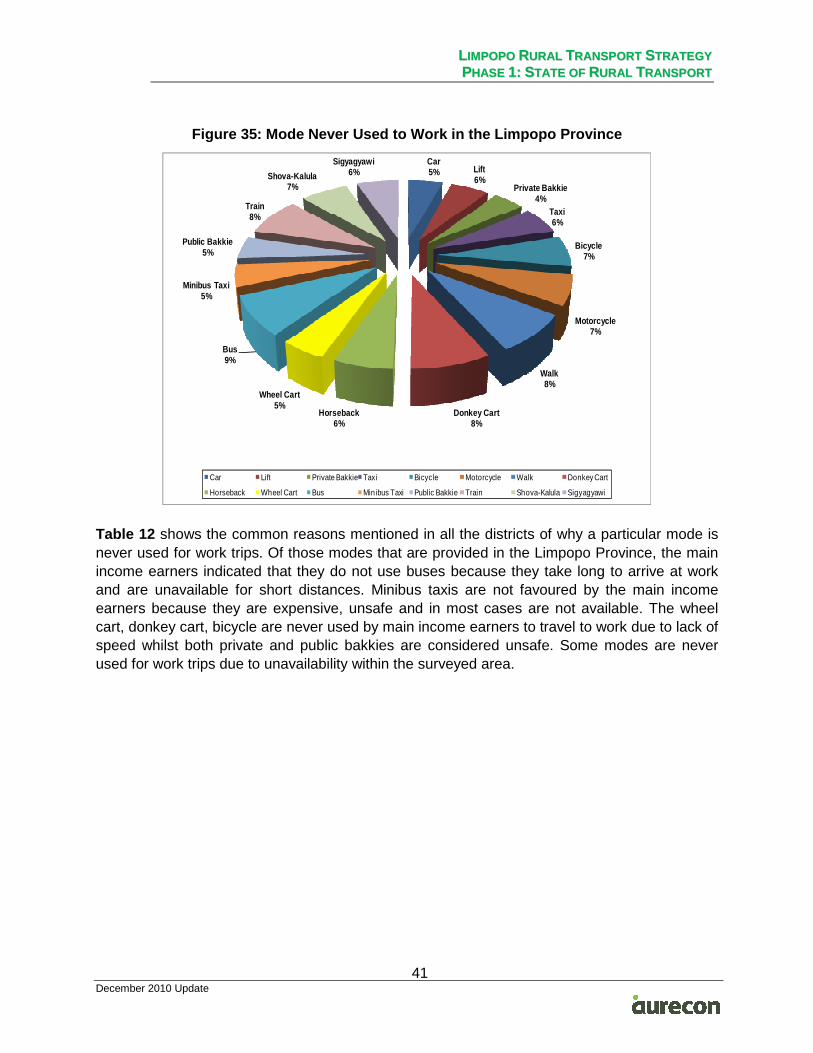
Figure 35 illustrates the mode of transport that is never used to travel to work aggregated at provincial level. The figure shows that 36% of the main income earners in the province never walk or make use of public transport to travel to work. This includes bus, minibus, public bakkie, train, shova-kalula and sigyagyawi. 8% of the income earners never walk or use donkey cart to work whilst 7% do not make use of bicycles and motorcycles for work trips. The least used transport modes include both private and public bakkies, minibus taxis and wheel carts.
LL IIMMPPOOPPOO RRUURRAALL TTRRAANNSSPPOORRTT SSTTRRAATTEEGGYY PPHHAASSEE 11:: SSTTAATTEE OOFF RRUURRAALL TTRRAANNSSPPOORRTT
December 2010 Update
41
Figure 35: Mode Never Used to Work in the Limpopo P rovince
Car5% Lift
6%Private Bakkie
4%Taxi6%
Bicycle7%
Motorcycle7%
Walk8%
Donkey Cart8%
Horseback6%
Wheel Cart5%
Bus9%
Minibus Taxi5%
Public Bakkie5%
Train8%
Shova-Kalula7%
Sigyagyawi6%
Car Lift Private Bakkie Taxi Bicycle Motorcycle Walk Donkey Cart
Horseback Wheel Cart Bus Minibus Taxi Public Bakkie Train Shova-Kalula Sigyagyawi
Table 12 shows the common reasons mentioned in all the districts of why a particular mode is never used for work trips. Of those modes that are provided in the Limpopo Province, the main income earners indicated that they do not use buses because they take long to arrive at work and are unavailable for short distances. Minibus taxis are not favoured by the main income earners because they are expensive, unsafe and in most cases are not available. The wheel cart, donkey cart, bicycle are never used by main income earners to travel to work due to lack of speed whilst both private and public bakkies are considered unsafe. Some modes are never used for work trips due to unavailability within the surveyed area.

LL IIMMPPOOPPOO RRUURRAALL TTRRAANNSSPPOORRTT SSTTRRAATTEEGGYY PPHHAASSEE 11:: SSTTAATTEE OOFF RRUURRAALL TTRRAANNSSPPOORRTT
December 2010 Update
42
Table 12: Reasons why Mode is never used for Work T rips in the Limpopo Province
MODE REASON
Car Not available
Lift Not safe , too slow and expensive
Private Bakkie Not safe
Private Taxi Expensive
Bicycle Too slow
Motorcycle Not safe and often unavailable
Walk Work place is too far
Donkey Cart They are not safe and too slow
Horseback Not safe and often unavailable
Wheel Cart Too slow and dusty
Bus Takes long to arrive to work and unavailable for short distances
Minibus Taxis They are expensive, unsafe, not enough
Public Bakkie Not safe
Train Not available
Shova-Kalula Not available
Sigyagyawi Not available The money spent by the main income earners for transport depends mainly on the distance travelled to work from home as well as the type of mode used. Figure 36 show the percentage of monthly income spent on transport by the main income earners to travel to work on a daily basis.
Figure 36: Income Spent by Income Earners on Transp ort to Travel to Work
3% 4% 4% 3%
17%22% 16% 16%
13%
17%
38%37% 37% 41%
26%
28%34% 35%
28%34%
3%8% 8%
15%4%6%
1% 1%2%
0%
10%
20%
30%
40%
50%
60%
70%
80%
90%
100%
Capricorn Mopani Sekhukhune Vhembe Waterberg
% o
f In
com
e E
aner
s
District
0-R50 R51-R100 R101-R200 R201-R500 R501-R1000 >R1000
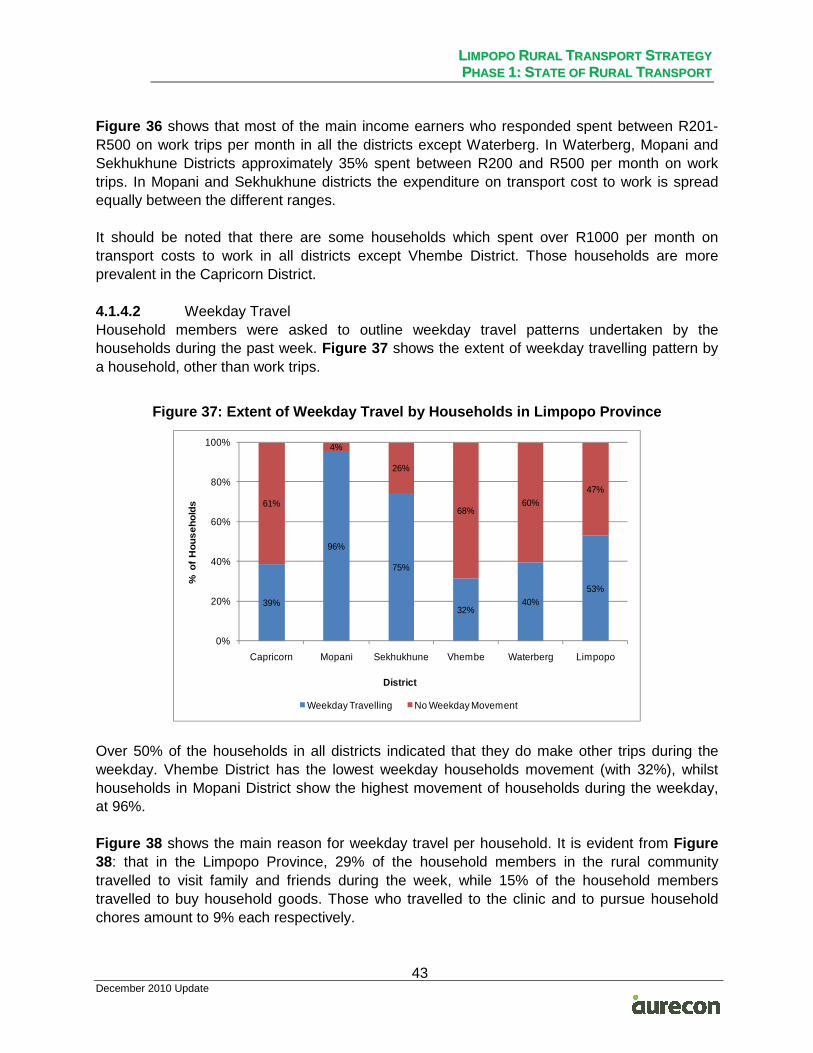
LL IIMMPPOOPPOO RRUURRAALL TTRRAANNSSPPOORRTT SSTTRRAATTEEGGYY PPHHAASSEE 11:: SSTTAATTEE OOFF RRUURRAALL TTRRAANNSSPPOORRTT
December 2010 Update
43
Figure 36 shows that most of the main income earners who responded spent between R201-R500 on work trips per month in all the districts except Waterberg. In Waterberg, Mopani and Sekhukhune Districts approximately 35% spent between R200 and R500 per month on work trips. In Mopani and Sekhukhune districts the expenditure on transport cost to work is spread equally between the different ranges.
It should be noted that there are some households which spent over R1000 per month on transport costs to work in all districts except Vhembe District. Those households are more prevalent in the Capricorn District.
4.1.4.2 Weekday Travel Household members were asked to outline weekday travel patterns undertaken by the households during the past week. Figure 37 shows the extent of weekday travelling pattern by a household, other than work trips.
Figure 37: Extent of Weekday Travel by Households i n Limpopo Province
39%
96%
75%
32%40%
53%
61%
4%
26%
68%60%
47%
0%
20%
40%
60%
80%
100%
Capricorn Mopani Sekhukhune Vhembe Waterberg Limpopo
% o
f H
ouse
hold
s
District
Weekday Travelling No Weekday Movement
Over 50% of the households in all districts indicated that they do make other trips during the weekday. Vhembe District has the lowest weekday households movement (with 32%), whilst households in Mopani District show the highest movement of households during the weekday, at 96%.
Figure 38 shows the main reason for weekday travel per household. It is evident from Figure 38: that in the Limpopo Province, 29% of the household members in the rural community travelled to visit family and friends during the week, while 15% of the household members travelled to buy household goods. Those who travelled to the clinic and to pursue household chores amount to 9% each respectively.

LL IIMMPPOOPPOO RRUURRAALL TTRRAANNSSPPOORRTT SSTTRRAATTEEGGYY PPHHAASSEE 11:: SSTTAATTEE OOFF RRUURRAALL TTRRAANNSSPPOORRTT
December 2010 Update
44
Figure 38: Weekday Trip Purpose in the Limpopo Prov ince
School7% Market
2%
Work6%
Shop to buy household goods
15%
Bank3%
Post Office3%
Clinic /Hospital/Doctor9%
Visiting Family and Friends
29%
Sports3%
Religious Services8%
Leisure Activities 5%
Household Chores 9%
School Market Work Shop to buy household goods
Bank Post Office Clinic /Hospital/Doctor Visiting Family and Friends
Sports Religious Services Leisure Activities Household Chores
Figure 39 shows the mode of transport used for trips.
Figure 39: Transport Mode Use for Weekday Travel

LL IIMMPPOOPPOO RRUURRAALL TTRRAANNSSPPOORRTT SSTTRRAATTEEGGYY PPHHAASSEE 11:: SSTTAATTEE OOFF RRUURRAALL TTRRAANNSSPPOORRTT
December 2010 Update
45
Figure 39 illustrates that the majority of the household members who travel during the week walk to their destinations. The majority of household members from Waterberg district use private taxis and lifts for travelling during the week. Buses are also extensively used for weekday travel particularly by Vhembe District and Capricorn District household members. 4.1.4.3 Weekend Travelling Patterns Figure 40 shows the extent of people making weekend trips in the rural areas.
Figure 40: Extent of Weekend Travel in Study Area
46%
28%
70%
26% 25%
41%
54%
72%
30%
74% 75%
59%
0%
20%
40%
60%
80%
100%
Capricorn Mopani Sekhukhune Vhembe Waterberg Limpopo
% o
f H
ous
eho
lds
District
Weekend Travelling No Weekend Movement
Over 40% of the households in the study area indicated that they do make trips during the weekend. Sekhukhune District has the highest weekend travel patterns (with 70%), whilst households in Waterberg and Vhembe Districts show the lowest movement of households during the weekend, at 25% and 26% respectively.
Figure 41 illustrates the reasons members of households make a trip during the weekend. Figure 41 show that 33% of the household members who responded, visited family and friends during the weekend. Approximately 23% travel to religious services, while 10% make trips to carry out household chores and 8% went shopping for household goods.

LL IIMMPPOOPPOO RRUURRAALL TTRRAANNSSPPOORRTT SSTTRRAATTEEGGYY PPHHAASSEE 11:: SSTTAATTEE OOFF RRUURRAALL TTRRAANNSSPPOORRTT
December 2010 Update
46
Figure 41: Weekend Trip Purpose in the Limpopo Prov ince
School3% Market
2%Work4%
Shopping8%
Bank2%
Post Office3%
Hospital/Clinic4%
Visiting Family and Friends
33%
Sports3%
Religious Services23%
Leisure Activities 5%
Household Chores 10%
Funeral1%
School Market WorkShopping Bank Post Of f iceHospital/Clinic Visiting Family and Friends SportsReligious Services Leisure Activities Household Chores Funeral
The mode used for weekend trips is shown in Figure 42 .
Figure 42: Transport Mode Used for Weekend Travel
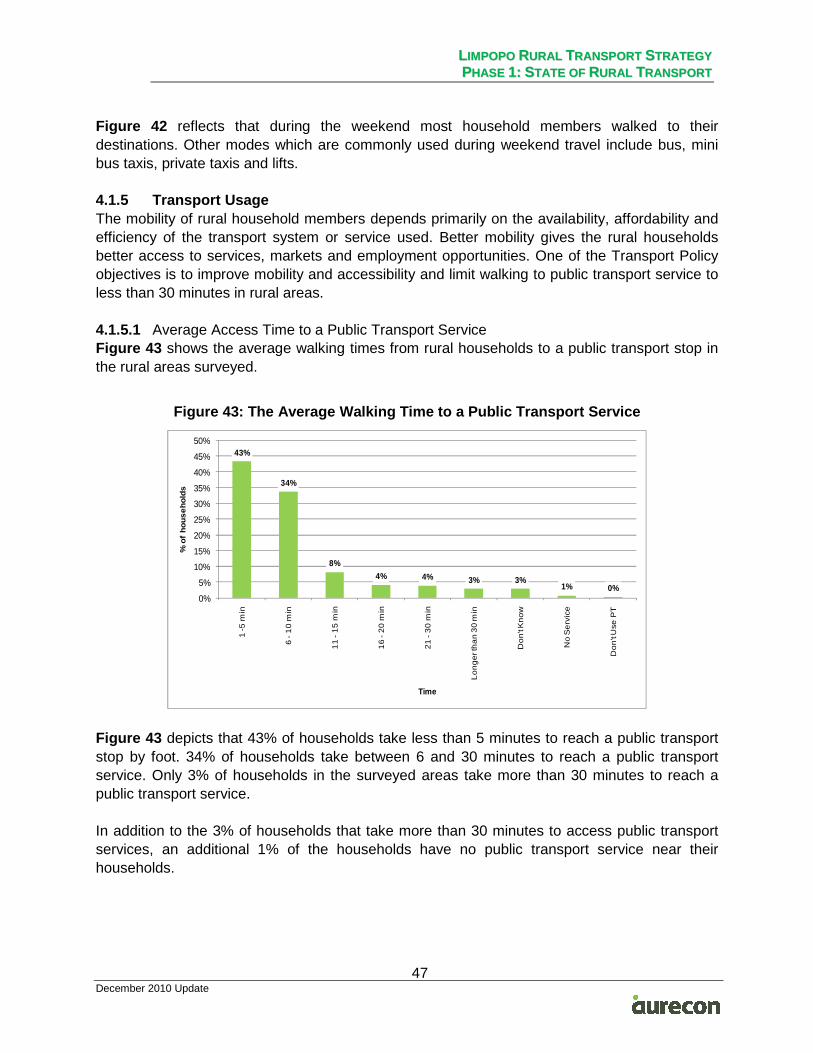
LL IIMMPPOOPPOO RRUURRAALL TTRRAANNSSPPOORRTT SSTTRRAATTEEGGYY PPHHAASSEE 11:: SSTTAATTEE OOFF RRUURRAALL TTRRAANNSSPPOORRTT
December 2010 Update
47
Figure 42 reflects that during the weekend most household members walked to their destinations. Other modes which are commonly used during weekend travel include bus, mini bus taxis, private taxis and lifts.
4.1.5 Transport Usage The mobility of rural household members depends primarily on the availability, affordability and efficiency of the transport system or service used. Better mobility gives the rural households better access to services, markets and employment opportunities. One of the Transport Policy objectives is to improve mobility and accessibility and limit walking to public transport service to less than 30 minutes in rural areas.
4.1.5.1 Average Access Time to a Public Transport Service Figure 43 shows the average walking times from rural households to a public transport stop in the rural areas surveyed.
Figure 43: The Average Walking Time to a Public Tra nsport Service
43%
34%
8%
4% 4% 3% 3%1% 0%
0%
5%
10%
15%
20%
25%
30%
35%
40%
45%
50%
1 -5
min
6 -
10
min
11
-1
5 m
in
16
-2
0 m
in
21
-3
0 m
in
Lo
ng
er t
ha
n 3
0 m
in
Do
n't
Kn
ow
No
Se
rvic
e
Do
n't
Use
PT
% o
f ho
use
hold
s
Time
Figure 43 depicts that 43% of households take less than 5 minutes to reach a public transport stop by foot. 34% of households take between 6 and 30 minutes to reach a public transport service. Only 3% of households in the surveyed areas take more than 30 minutes to reach a public transport service.
In addition to the 3% of households that take more than 30 minutes to access public transport services, an additional 1% of the households have no public transport service near their households.

LL IIMMPPOOPPOO RRUURRAALL TTRRAANNSSPPOORRTT SSTTRRAATTEEGGYY PPHHAASSEE 11:: SSTTAATTEE OOFF RRUURRAALL TTRRAANNSSPPOORRTT
December 2010 Update
48
4.1.5.1 Average Waiting Time for a Public Transport Service Table 13 reflects the time taken by rural household members to wait for public transport services.
Table 13: Average waiting time for Public Transport per District D
IST
RIC
T
1 -5
MIN
6 -
10 M
IN
11 -
15
MIN
16 -
20
MIN
21 -
30
MIN
LON
GE
R T
HA
N 3
0 M
IN
DO
NO
T K
NO
W
NO
SE
RV
ICE
DO
NO
T U
SE
PT
Capricorn 19% 30% 26% 9% 5% 5% 5% 1% 0%
Mopani 27% 23% 11% 9% 11% 6% 5% 5% 1%
Sekhukhune 30% 24% 21% 9% 7% 8% 0% 0% 0%
Vhembe 10% 10% 5% 6% 6% 14% 13% 26% 11%
Waterberg 58% 20% 9% 6% 5% 1% 0% 0% 0%
Limpopo 30% 22% 15% 8% 7% 6% 4% 5% 2%
The following observations are made from Table 13: • For Capricorn District , 89% of households take less than 30 minutes to access public
transport service. 5% of households take more than 30 minutes to access a public transport service.
• For Mopani District , 82% of households take less than 30 minutes to access public transport service. 6% of households take more than 30 minutes to access a public transport service.
• For Sekhukhune District , 91% of households take less than 30 minutes to access public transport service. 8% of households take more than 30 minutes to access a public transport service.
• For Vhembe District , 35% of the households take less than 30 minutes to access public transport service. 14% of households take more than 30 minutes to access a public transport service.
• For Waterberg District , 99% of households take less than 30 minutes to access public transport service. 1% of households take more than 30 minutes to access a public transport service.
• For the Limpopo Province , 82% of households take less than 30 minutes to access public transport service. 6% of households take more than 30 minutes to access a public transport service.

LL IIMMPPOOPPOO RRUURRAALL TTRRAANNSSPPOORRTT SSTTRRAATTEEGGYY PPHHAASSEE 11:: SSTTAATTEE OOFF RRUURRAALL TTRRAANNSSPPOORRTT
December 2010 Update
49
4.1.5.2 Public Transport Service Assessment by Day of the Week Figure 44 illustrates the day of the week where household members wait longer for public transport in the five districts.
Figure 44: Day of the Week where Passengers wait lo nger for Public Transport
0%
10%
20%
30%
40%
50%
60%
70%
80%
90%
Monday Tuesday Wednesday Thursday Friday Saturday Sunday Daily
% o
f H
ou
seh
old
s
Day of the Week
Capricorn Mopani Sekhukhune Vhembe Waterberg
Figure 44 shows that people in Vhembe District wait longer for public transport on Mondays. In Sekhukhune they wait longer on Wednesdays, whilst in Capricorn people wait longer for public transport on Fridays. In Mopani and Waterberg, they wait longer for public transport on Sundays. Public transport services in Mopani District seem to be readily available when compared with other districts, except on Sundays.
4.1.5.3 Public Transport Service Assessment by Day of the Month Waiting times for public transport services were assessed for days of the month (e.g. Friday month end, Saturday month end, beginning of the month and middle of the month). Figure 45 shows the percentage of households who wait longer for public transport on Friday month end in all five districts. From Figure 45 it is evident that some public transport users wait longer for public transport on month ends. The situation is worse in Capricorn District (59%) followed by Sekhukhune District (29%). In Vhembe and Waterberg Districts the proportion of household members who wait longer for Public Transport on Friday month end is relatively small at 6% and 4%, respectively. The majority of household members waited longer for public transport on Friday month end, while others mentioned the beginning of the month, middle of the month, Saturday month end and Sunday month end as difficult days to travel.

LL IIMMPPOOPPOO RRUURRAALL TTRRAANNSSPPOORRTT SSTTRRAATTEEGGYY PPHHAASSEE 11:: SSTTAATTEE OOFF RRUURRAALL TTRRAANNSSPPOORRTT
December 2010 Update
50
Figure 45: Percentage of Households waiting longer than usual for Public Transport at the end of the Month
59%
2%
29%
6%4%
0%
10%
20%
30%
40%
50%
60%
70%
Capricorn Mopani Sekhukhune Vhembe Waterberg
% H
ouseho
lds
District
Some household members indicated that they wait longer for public transport mainly on public holidays. Public Holidays which were specifically mentioned include Christmas and Easter holidays. 4.1.6 Transportation of Goods The Study Team further requested the households to outline the types of goods being transported. Table 14 shows the type of goods transported at district level. Table 14 shows that furniture is the most common commodity transported among districts, with the exception of Waterberg District. Transportation of firewood and vegetables is also prominent at 22% and 18%. The transportation of crops by households is represented by maize and sorghum with 6%.

LL IIMMPPOOPPOO RRUURRAALL TTRRAANNSSPPOORRTT SSTTRRAATTEEGGYY PPHHAASSEE 11:: SSTTAATTEE OOFF RRUURRAALL TTRRAANNSSPPOORRTT
December 2010 Update
51
Table 14: Types of Goods Transported per District
CO
MM
OD
ITY
CA
PR
ICO
RN
MO
PA
NI
SE
KH
UK
HU
NE
VH
EM
BE
WA
TE
RB
ER
G
TO
TA
L
%
TR
AN
SP
OR
TE
D
Bricks 3 9 15 10 5 42 6%
Furniture 12 86 120 12 5 235 33%
Vegetables 5 57 56 6 3 127 18%
Wood 13 31 15 30 69 158 22%
Cement 0 2 8 0 0 10 1%
Groceries 1 3 4 1 4 13 2%
Maize-meal 0 14 18 0 0 32 4%
Maize 1 3 32 0 0 36 5%
Water 1 0 0 0 0 1 0.1%
Fruits 0 2 1 0 0 3 0.4%
Steel 0 1 0 0 0 1 0.1%
Sand 0 1 8 4 27 40 6%
Building Material 0 0 6 0 0 6 1%
Sorghum 0 0 10 0 0 10 1%
Total 36 209 293 63 113 714
Figure 46 shows the mode of transport used to transport the abovementioned goods. Bakkies, donkey carts, walking and lifts are the most commonly used mode for transportation of goods. Households that transported goods during the previous week, were asked to mention challenges they faced in general when they transport their goods. They mentioned the following: • Lack of proper transport for transporting goods • Lack of money • Not sufficient road transport • Long waiting periods for goods to be delivered • Point of delivery far from homesteads • Long walking distances to get access to transport • Poor road condition which give rise to the following:
o Punctures; o Damaged goods along the way; o Untimely deliveries; o Slippery roads during rainy seasons; o Transporters avoiding route; and o Expensive transport due to the bad road condition.
Households further mentioned that improving the roads would greater facilitate the

LL IIMMPPOOPPOO RRUURRAALL TTRRAANNSSPPOORRTT SSTTRRAATTEEGGYY PPHHAASSEE 11:: SSTTAATTEE OOFF RRUURRAALL TTRRAANNSSPPOORRTT
December 2010 Update
52
transportation of goods.
Figure 46: Mode Used when Transporting Goods
Car4%
Lift7%
Private Bakkie47%
Walk9%
Donkey Cart13%
Horseback1%
Wheel Cart1%
Tractor3%
Bus1%
Minibus Taxi2%
Public Bakkie11%
Car Lift Private Bakkie Walk Donkey Cart Horseback
Wheel Cart Tractor Bus Minibus Taxi Public Bakkie
4.1.7 Travel Patterns to Remote Places Households were asked if there are any remote places at which they would like to travel to. Figure 47 illustrates the purpose of travel to remote places. Visiting family and friends is the main reason for travelling to far places, followed by going to the shops to buy household and other goods. When not travelling to specified trips, household members attend funerals, go to police stations to certify documents or attend social club meetings, etc.
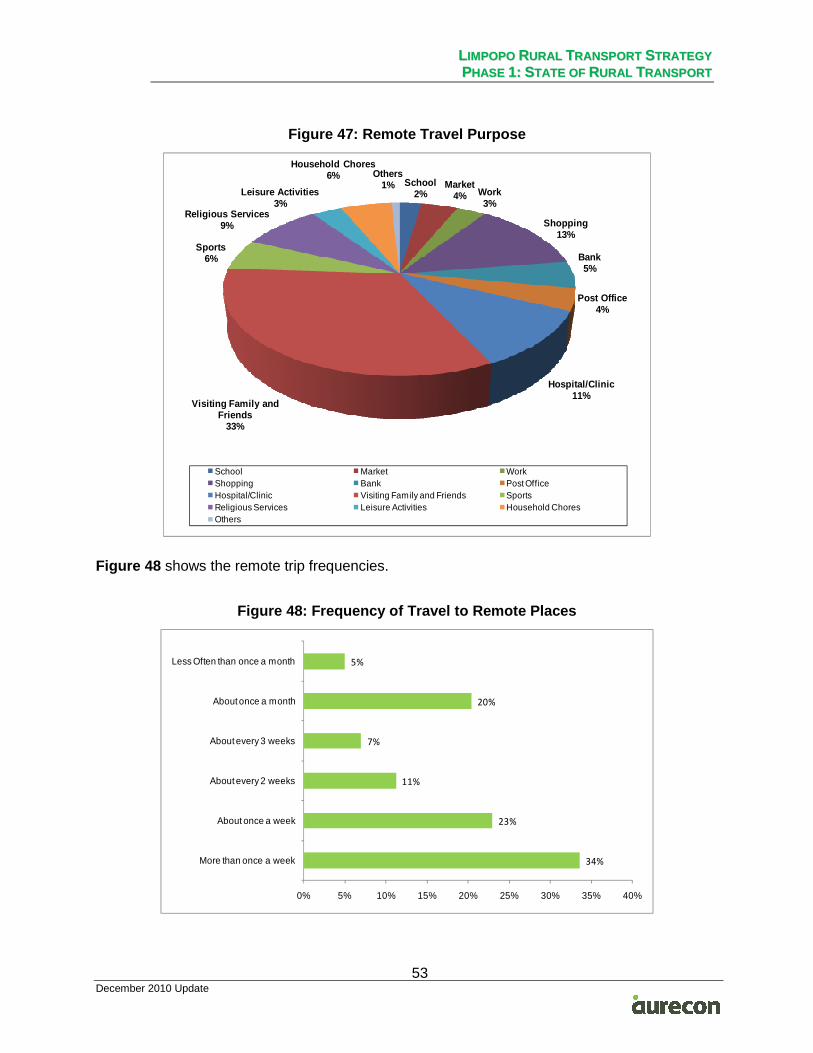
LL IIMMPPOOPPOO RRUURRAALL TTRRAANNSSPPOORRTT SSTTRRAATTEEGGYY PPHHAASSEE 11:: SSTTAATTEE OOFF RRUURRAALL TTRRAANNSSPPOORRTT
December 2010 Update
53
Figure 47: Remote Travel Purpose
School2%
Market4% Work
3%
Shopping13%
Bank5%
Post Office4%
Hospital/Clinic11%
Visiting Family and Friends
33%
Sports6%
Religious Services9%
Leisure Activities 3%
Household Chores 6% Others
1%
School Market WorkShopping Bank Post OfficeHospital/Clinic Visiting Family and Friends SportsReligious Services Leisure Activities Household Chores Others
Figure 48 shows the remote trip frequencies.
Figure 48: Frequency of Travel to Remote Places
34%
23%
11%
7%
20%
5%
0% 5% 10% 15% 20% 25% 30% 35% 40%
More than once a week
About once a week
About every 2 weeks
About every 3 weeks
About once a month
Less Often than once a month

LL IIMMPPOOPPOO RRUURRAALL TTRRAANNSSPPOORRTT SSTTRRAATTEEGGYY PPHHAASSEE 11:: SSTTAATTEE OOFF RRUURRAALL TTRRAANNSSPPOORRTT
December 2010 Update
54
Approximately 40% of the respondents want to make remote trips on a monthly basis. 11% of respondents want to travel to the desired destination every fortnight.
The respondents were also asked to indicate challenges they face when travelling to these remote areas. Reasons mentioned include shortage of money. Other challenges that were mentioned include: • Lack of transport; • Poor road conditions; • Long travelling distances; • High travelling costs; • Long waiting periods for public transport; • Crime and feeling unsafe; and • Lack of time for travelling;
4.1.8 Attitude towards Transport The section below analyses the level of satisfaction with regard to Public Transport Services, e.g. buses and taxis. The ratings were grouped from “Satisfied” to “Not Satisfied” for both modes.
4.1.8.1 Minibus Taxi Service
Table 15 and Figure 49 illustrate the level of satisfaction with the minibus taxi service. The following observations are made from Table 15 : • All households residing in the Sekhukhune District (i.e. 100%) surveyed areas are
dissatisfied with the taxi service rendered in their area. • 71% of households that responded in Waterberg District indicated that they are satisfied
with the minibus taxi services offered in their area, whilst 28% indicated that they are not satisfied.
• In Mopani District , 51% of the households that responded said they are satisfied with the minibus taxi service, whilst 49% indicated that they are not satisfied with the level of services offered to them.
• 25% of households in the Capricorn District indicated level of satisfaction, while 74% indicated that they are not satisfied.
• 17% of the households in Vhembe District indicated level of satisfaction towards the taxi service offered in their area, whereas 76% indicated that they are not satisfied with the level of service.
When comparing the level of satisfaction between districts (refer to Figure 49 ) it is evident that the highest level of satisfaction with the minibus taxi mode is indicated in Waterberg District, whilst residents of Sekhukhune District show the highest level of dissatisfaction.

LL IIMMPPOOPPOO RRUURRAALL TTRRAANNSSPPOORRTT SSTTRRAATTEEGGYY PPHHAASSEE 11:: SSTTAATTEE OOFF RRUURRAALL TTRRAANNSSPPOORRTT
December 2010 Update
55
Table 15: Level of Satisfaction towards Minibus Tax i Mode
CAPRICORN MOPANI SEKHUKHUNE VHEMBE WATERBERG TOTAL
Satisfied 40 121 0 24 191 376
Moderately Satisfied 36 5 0 0 17 58
Not very Satisfied 92 27 0 25 21 165
Not at all Satisfied 135 94 200 85 62 576
Do not know 6 1 0 11 5 23
Total 309 248 200 145 296 1198
Percentages
Satisfied 13% 49% 0 17% 65% 31%
Moderately Satisfied 12% 2% 0 0% 6% 5%
Not very Satisfied 30% 11% 0 17% 7% 14%
Not at all Satisfied 44% 38% 100% 59% 21% 48%
Do not know 2% 0% 0 8% 2% 2%
Total 100% 100% 100% 100% 100% 100%
Figure 49: The Level of Satisfaction with Public Ta xi Service
13%
49%
17%
65%
12%
2%
6%
30%
11%
17%
7%44%38%
100%
59%
21%
2%8%
2%
Capricorn Mopani Sekhukhune Vhembe Waterberg
District
Satisfied Moderately Satisfied Not very Satisfied Not at all Satisfied Do not know

LL IIMMPPOOPPOO RRUURRAALL TTRRAANNSSPPOORRTT SSTTRRAATTEEGGYY PPHHAASSEE 11:: SSTTAATTEE OOFF RRUURRAALL TTRRAANNSSPPOORRTT
December 2010 Update
56
4.1.8.2 Bus Service Table 16 and Figure 50 illustrate the level of satisfaction with the bus service in the rural areas of the Limpopo Province. The following observations are made from Table 16: • 100% of the households in surveyed area in Sekhukhune District are satisfied with the
bus service offered in their area. • Many households residing in Waterberg District are satisfied with the bus service (i.e.
76%) offered in the rural areas surveyed. Only 22% indicated that they were dissatisfied with the level of bus services.
• 68% of households in Vhembe District indicated that they are dissatisfied with the bus services offered in their area, whilst 28% indicated that they are satisfied.
• In Capricorn District , only 51% of the households are satisfied with the bus service, whilst 48% indicated that they are not satisfied with the level of services offered to them.
• Residents in Mopani District indicated 44% level of satisfaction, while 54% indicated that they are not satisfied.
Table 16: Level of Satisfaction with Bus Service
CAPRICORN MOPANI SEKHUKHUNE VHEMBE WATERBERG TOTAL
Satisfied 126 78 200 97 221 722
Moderately Satisfied 29 2 0 2 13 46
Not very Satisfied 61 6 0 116 14 197
Not at all Satisfied 81 92 0 125 51 349
Do not know 8 2 0 13 9 32
Total 305 180 200 353 308 1346
Percentages
Satisfied 41% 43% 100% 27% 72% 54%
Moderately Satisfied 10% 1% 0% 1% 4% 3%
Not very Satisfied 20% 3% 0% 33% 5% 15%
Not at all Satisfied 27% 51% 0% 35% 17% 26%
Do not know 3% 1% 0% 4% 3% 2%
Total 100% 100% 100% 100% 100% 100%
When comparing level of satisfaction between districts (refer to Figure 50 ) it is evident that the highest level of satisfaction with the bus service is indicated in Sekhukhune District, whilst residents of Vhembe District show the highest level of dissatisfaction.

LL IIMMPPOOPPOO RRUURRAALL TTRRAANNSSPPOORRTT SSTTRRAATTEEGGYY PPHHAASSEE 11:: SSTTAATTEE OOFF RRUURRAALL TTRRAANNSSPPOORRTT
December 2010 Update
57
Figure 50: The Level of Satisfaction with Bus Servi ce
41% 43%
100%
27%
72%
54%
10% 1%
1%
4%
3%20%
3% 33%
5%
15%
27%
51%35%
17%26%
3%1%
4% 3% 2%
Capricorn Mopani Sekhukhune Vhembe Waterberg Total
District
Satisf ied Moderately Satisf ied Not very Satisf ied Not at all Satisf ied Do not know
4.1.9 Transport Hindering Aspects This section identifies various challenges experienced by the rural household members with regard to the transport mode (motorised and non-motorised). The transport challenges faced when travelling with different modes of transport will be discussed in following sections.
4.1.9.1 Transportation Challenges faced by Minibus Taxi Users Figure 51 shows the challenges experienced by the minibus taxi users in rural areas surveyed.
The three complaints about the main prevailing issues identified include unsafe conditions, reckless driving and the high price. Unsafe conditions due to speeding and reckless driving are prevalent in the Capricorn, Mopani and the Vhembe District Municipalities. Complaints about expensive transport costs are common in all districts but more prevalent in Sekhukhune District.

LL IIMMPPOOPPOO RRUURRAALL TTRRAANNSSPPOORRTT SSTTRRAATTEEGGYY PPHHAASSEE 11:: SSTTAATTEE OOFF RRUURRAALL TTRRAANNSSPPOORRTT
December 2010 Update
58
Figure 51: Challenges encountered by Minibus Taxi U sers in Limpopo
0%
20%
40%
60%
80%
100%
Capricorn Mopani Sekhukhune Vhembe Waterberg
% o
f H
ouse
hold
s
District
Insecurity Reckless Driving High Price Others
4.1.9.2 Transportation Challenges faced by Bus Transport Users Figure 52 shows the challenges experienced by the bus users in rural areas surveyed. The three most prevalent issues raised by bus service users include long duration of trips, inconvenient bus stops and irregular bus services.
Majority of households in Sekhukhune, Mopani and Capricorn have issues with the limited and irregular trips offered by the bus service. Prevailing issues in the Waterberg District is the expensive transport costs. Complaints about the long duration of trips offered by the bus service coupled with inconvenient bus stops are prevalent in all districts.

LL IIMMPPOOPPOO RRUURRAALL TTRRAANNSSPPOORRTT SSTTRRAATTEEGGYY PPHHAASSEE 11:: SSTTAATTEE OOFF RRUURRAALL TTRRAANNSSPPOORRTT
December 2010 Update
59
Figure 52: Challenges encountered by Bus Service Us ers in Limpopo
0%
20%
40%
60%
80%
100%
Capricorn Mopani Sekhukhune Vhembe Waterberg
% o
f Hou
seho
lds
District
Limited / Irregular Trips Time Consuming / Long duration of Trips
Inconvenient Bus Stops High Price
Others
4.1.9.3 Transportation Challenges faced by Train Users Figure 53 illustrates the challenges faced by train users in the Limpopo Province.
Figure 53: Challenges encountered by Train Users in Limpopo
0%
20%
40%
60%
80%
100%
Capricorn Mopani Sekhukhune Vhembe Waterberg
% o
f H
ouse
hol
ds
District
Insecurity Pricing Structure
Figure 53 shows the challenges experienced by train users in surveyed areas. There are two main issues of concern to train users. They include the lack of security when using the mode as well as the high costs. The train users indicated that security must be strengthened in the trains
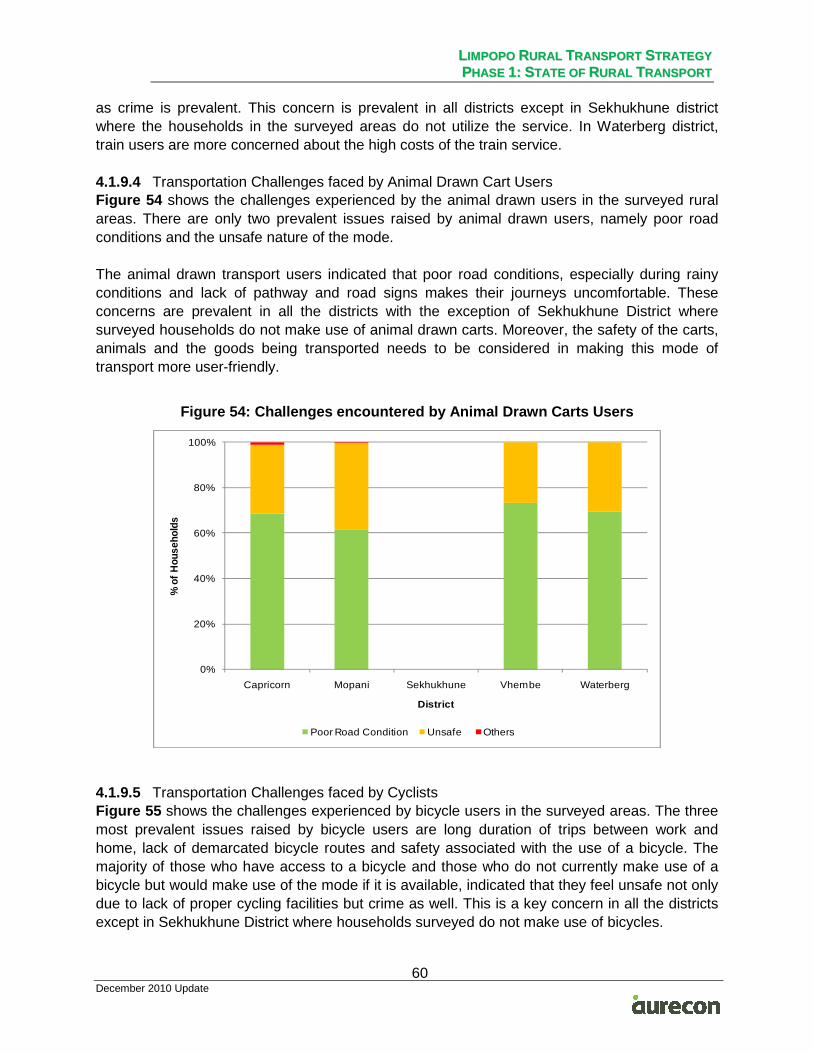
LL IIMMPPOOPPOO RRUURRAALL TTRRAANNSSPPOORRTT SSTTRRAATTEEGGYY PPHHAASSEE 11:: SSTTAATTEE OOFF RRUURRAALL TTRRAANNSSPPOORRTT
December 2010 Update
60
as crime is prevalent. This concern is prevalent in all districts except in Sekhukhune district where the households in the surveyed areas do not utilize the service. In Waterberg district, train users are more concerned about the high costs of the train service.
4.1.9.4 Transportation Challenges faced by Animal Drawn Cart Users Figure 54 shows the challenges experienced by the animal drawn users in the surveyed rural areas. There are only two prevalent issues raised by animal drawn users, namely poor road conditions and the unsafe nature of the mode.
The animal drawn transport users indicated that poor road conditions, especially during rainy conditions and lack of pathway and road signs makes their journeys uncomfortable. These concerns are prevalent in all the districts with the exception of Sekhukhune District where surveyed households do not make use of animal drawn carts. Moreover, the safety of the carts, animals and the goods being transported needs to be considered in making this mode of transport more user-friendly.
Figure 54: Challenges encountered by Animal Drawn C arts Users
0%
20%
40%
60%
80%
100%
Capricorn Mopani Sekhukhune Vhembe Waterberg
% o
f Hou
seho
lds
District
Poor Road Condition Unsafe Others
4.1.9.5 Transportation Challenges faced by Cyclists Figure 55 shows the challenges experienced by bicycle users in the surveyed areas. The three most prevalent issues raised by bicycle users are long duration of trips between work and home, lack of demarcated bicycle routes and safety associated with the use of a bicycle. The majority of those who have access to a bicycle and those who do not currently make use of a bicycle but would make use of the mode if it is available, indicated that they feel unsafe not only due to lack of proper cycling facilities but crime as well. This is a key concern in all the districts except in Sekhukhune District where households surveyed do not make use of bicycles.

LL IIMMPPOOPPOO RRUURRAALL TTRRAANNSSPPOORRTT SSTTRRAATTEEGGYY PPHHAASSEE 11:: SSTTAATTEE OOFF RRUURRAALL TTRRAANNSSPPOORRTT
December 2010 Update
61
Figure 55: Challenges encountered by Cycling
0%
20%
40%
60%
80%
100%
Capricorn Mopani Sekhukhune Vhembe Waterberg
% o
f H
ouse
hold
s
District
No Dermacated Routes Unsafe Long Distances between work and Lving Places Others
4.1.9.6 Transportation Challenges faced by Pedestrians Figure 56 shows the challenges experienced by pedestrians in the surveyed rural areas.
Figure 56: Challenges encountered by Pedestrians
0%
20%
40%
60%
80%
100%
Capricorn Mopani Sekhukhune Vhembe Waterberg
% o
f Hou
seho
lds
District
Unfriendly Roads Unsafe Long Distances between work and Lving Places Others
The three most prevalent issues raised by pedestrians in the surveyed areas include lack of infrastructure, unsafe roads and duration of trips. Lack of infrastructure is the major concern raised in all four districts particularly in Mopani, Waterberg and Capricorn Districts. This is

LL IIMMPPOOPPOO RRUURRAALL TTRRAANNSSPPOORRTT SSTTRRAATTEEGGYY PPHHAASSEE 11:: SSTTAATTEE OOFF RRUURRAALL TTRRAANNSSPPOORRTT
December 2010 Update
62
followed by unsafe roads and paths predominantly in Capricorn district. The distance travelled between the origin and destination is also a major concern in all the districts especially in Sekhukhune District.
4.1.10 Perceived Transport Needs Respondents were asked to indicate how those challenges raised in Section 4.1.9 could be addressed. Most respondents in the rural areas surveyed indicated that there is a need for better and more affordable public transport which includes trains, taxis and buses. In addition to this, respondents expressed the need for taxi ranks, bus stops and railway infrastructure to address the issue of the lack of transport infrastructure in the respective rural areas. Respondents also indicated the need for upgrading gravel to paved roads and regular maintenance thereof. Others mentioned the need for road signs and pathways for pedestrians.
4.2 Subsistence Farmer Survey Results The Study Team received Subsistence Farmer Survey forms from Bende Mutale Village under Mutale LM, Khomela Village under Makhado LM in Vhembe District and Xitlakati Village under Tzaneen LM in Mopani District. Other study locations did not have subsistence farmers. The three main areas of data collection which were considered are as follows: • Economic Activity • Poverty Alleviation • Accessibility/Mobility conditions The subsistence farmers in Mutale LM grow citrus fruits and tomatoes for commercial purposes, with 100% of the produce being sold at the nearest markets. In Makhado LM, subsistence farmers grow maize for commercial use and cabbages for both household and commercial purposes. On average, 10% of the cabbages are utilized for household and 90% is sold at the nearest market. Subsistence farmers in Tzaneen LM, grow citrus fruits, mangoes, butternuts, pepper dew, and baby marrow for commercial purposes with 100% of the produce being sold at markets.
In Bende Mutale Village the nearest market is situated approximately 12 km away from the village. It takes the farmers on average 6 hours to arrive at their destination, implying that on average they travel at a speed of 2km/hr.
The farmers use a tractor or animal drawn cart to transport their produce to the market. The frequency to the market in all three villages is more than once a week.
In an endeavour to alleviate poverty in the village, agricultural production courses are offered to the farmers. In Bende Mutale the interviewed subsistence farm employs 20 people on average whilst in Xitlakati Village, the surveyed farm employs about 392 employees (300 seasonal and 92 permanent). The subsistence farmers also indicated that challenges they face in the process of producing their products include:
• Lack of or poor cultivation equipment; and • Shortage of water for watering the crops.

LL IIMMPPOOPPOO RRUURRAALL TTRRAANNSSPPOORRTT SSTTRRAATTEEGGYY PPHHAASSEE 11:: SSTTAATTEE OOFF RRUURRAALL TTRRAANNSSPPOORRTT
December 2010 Update
63
Possible solutions offered by interviewed subsistence farmers include the construction of a new dam and increase the number of boreholes to deal with the shortage of water problems.
Even though training in agricultural production is provided in the village, there is a need for subsistence farmers to be empowered with more recent cultivation implements and irrigation sprinklers to enable them to produce more crops.
Mobility challenges experienced by subsistence farmers include the impact of the road condition on their economic activity. They indicated that an improved road to the market would enable the smooth transportation of their produce. This will also reduce the high transportation costs.
4.3 Bulk Transport Survey Results The Bulk Transport Survey was conducted in Vhembe and Mopani districts. One village per Local Municipality was surveyed. In Vhembe District, Bende Mutale Village under Mutale LM as well as Khomela Village under Makhado LM were surveyed. In Mopani District, Xitlakati Village under Tzaneen LM was surveyed. Other villages were not surveyed as they did not have bulk transporters during the period of the survey. Bulk transportation of goods in Bende Mutale and Khomela Villages was captured as follows: • The interviewed bulk transporters are Patrick Maisha and Makonano from Bende Mutale
and Khomela Villages. • The main commodities being transported by both transporters include maize, bread, rice,
food stuffs, oil, meat and toiletries for household and commercial purposes. • Two types of trips are usually conducted per bulk transporter. The trips undertaken by
Makonano originate from Thohoyandou to Bende Mutale and vice versa, with the total single trip of 165 km. Trips conducted by Patrick Maisha start off from Louis Trichardt to Khomela and vice versa, with the total single trip amounting to 100 km.
• A single trip to Bende Mutale takes about 5 hours, amounting to an average speed of 33 km/hr whilst a single trip to Khomela takes 4 hours, amounting to an average speed of 25 km/hr.
• It costs R400 to transport goods from Bende Mutale and R 5 600 from Khomela. • Both locations are visited at least 4 times a month. The type of vehicles used during these
trips includes bakkies and trucks. • The main transport hindering aspects mentioned by both transporters is the bad road
condition which give rise to the following: o A challenge in transporting fragile and perishable goods; o Long travel times to destination.
Possible solutions offered by both transporters include the construction of a tarred road which will improve travel speeds and thereby reduce travel time to transport goods. This will also help to minimize the breakage of fragile goods.
Bulk transportation of goods in Xitlakati Village is captured as follows: • The bulk transporter in Xitlakati Village is called H&M Transport.

LL IIMMPPOOPPOO RRUURRAALL TTRRAANNSSPPOORRTT SSTTRRAATTEEGGYY PPHHAASSEE 11:: SSTTAATTEE OOFF RRUURRAALL TTRRAANNSSPPOORRTT
December 2010 Update
64
• H&M Transport transports mainly fruits and vegetables including oranges, mangoes, butternut, pepper dew and baby marrow for commercial purposes.
• Two types of trips are usually conducted per bulk transporter. The trips undertaken by H&M Transport originate from Mabunda Farm to Tzaneen (alto pack) and vice versa with the total single trip amounting to 44 km. Commodities are then transported to different place namely, Letsitele, Nkowankowa, Pretoria and Kwazulu Natal.
• A single trip to Tzaneen takes about 2.5 hours on average, amounting to an average speed of 17 km/hr.
• The transportation costs differ per commodity as well as distance to destination. • All locations are visited at least 4 times a month. The type of vehicles used during these
trips includes bakkies and trucks. • The main transport hindering aspect mentioned by the transporter is the poor road
condition.
Possible solution offered by H&M Transport includes the construction of paved roads and possibly grading of the gravel road at least once a week.
4.4 Public Transport Operators Survey Results During data collection, the Study Team attempted to conduct public transport surveys for services readily available in the study area but without any success. The approach was adopted to engage the Taxi Council as well as the Bus Association to gather required data. The underlying analysis is only applicable to a meeting which was held with the Bus Association. The following observations are made: • Two bus operators currently provide bus transport to the rural areas surveyed in the study,
namely Mmabi Transport to Eldorado and Kopano Bus Service to Mafefe. • Transport challenges highlighted by the two bus operators include (1) operating on
unsubsidised routes and poor road conditions. • The two bus operators made the following recommendations with regard to possible
solutions to the identified problems: (1) subsidise all routes, with subsidy to be on kilometre basis; (2) approval of route permits from Mafefe to Ga-Mathabatha as well as Lebowakgomo.
Furthermore the Bus Association recommended that bus operation be introduced to resolve the challenges faced by the rural communities in the rural villages. The present subsidy system only benefits those who are employed. They indicated that the rural community pays high fares when travelling to seek employment, whilst visiting clinics and attending to government offices for personal affairs. In addition the illegal operations by LDV (bakkies) have to be monitored to avoid accidents contributed by unroadworthy vehicles.

LL IIMMPPOOPPOO RRUURRAALL TTRRAANNSSPPOORRTT SSTTRRAATTEEGGYY PPHHAASSEE 11:: SSTTAATTEE OOFF RRUURRAALL TTRRAANNSSPPOORRTT
December 2010 Update
65
5 SUMMARY OF FINDINGS
The following findings are presented: • The average household size is about 6 people per household. The dominant age groups
vary from 18 - 44 years of age, meaning that households comprise of very young people. There are generally more females than males.
• When assessing types of disabilities, blindness stood out the most, followed by deafness and physical disability. Children were the most disabled.
• In the study area, most of the dwelling houses comprise of brick houses, stone structures and huts. Access to sanitation is in the form of pit toilets. The most common mode of transport owned by households includes animal-drawn carts, horses/ donkeys, bicycles, light trucks and wheel-barrows.
• The average income per month per house is between R0 – R500. The number of unemployed households in the area is approximately 35%. The main income source is mainly from pensions, child grants and disability. Of those who are employed, the employment sectors that dominate are agriculture, mining and public services. A high proportion of income earned is spent on food, account payments and other expenditures including school fees, transport and electricity.
• With regards to current travelling patterns, most people walk, either to work or to educational centres. In some instances, buses are used for school trips. Other dominant purposes for travelling include visiting family and friends, going to shops to buy household goods, visiting clinic or doctors and to attend household chores. For weekend trips, visiting family and friends, attending religious services, attending household chores and buying household goods are dominant. Walking, private taxis, lifts buses and minibus taxis are often used as modes of travel on weekends. It was mentioned that Friday month end and public holidays, including Christmas and Easter Holiday, are the times when household members wait longer for public transport. Monday, Wednesday, Friday and Sunday are days of the week when public transport users wait for longer times.
• The transportation of goods is mainly for household purposes with only a small proportion used for commercial purposes. Commodities that are transported include fire-wood, maize, vegetables, building, bricks, sand, material and furniture.
• When asked about travelling to remote places, most household members responded they want to travel to far-away places, mainly to visit family and friends, to shop and also to visit clinics and hospitals. Hindering aspects for travelling to remote places were lack of money, lack of transport availability and high travelling costs.
• Members were also asked about transport hindrance with regard to the mode used when travelling. Almost all of the problems were related to poor road conditions and lack of facilities such as taxi ranks and bus stops, lack of adequate facilities, road worthy transport, road signs and lack of law enforcement.
• Transportation issues identified by bulk transporters and public transport operators include: (1) Poor road conditions; (2) Lack of transport for transporting goods; (3) No sufficient road transport; (4) Long waiting periods for goods to be delivered; and (5) Point of delivery is far from homesteads.

LL IIMMPPOOPPOO RRUURRAALL TTRRAANNSSPPOORRTT SSTTRRAATTEEGGYY PPHHAASSEE 11:: SSTTAATTEE OOFF RRUURRAALL TTRRAANNSSPPOORRTT
December 2010 Update
66
6 IMPLICATIONS OF FINDINGS ON RURAL TRANSPORT PLANN ING IN THE LIMPOPO PROVINCE
This report provided information which was collated and assessed to determine the status of rural transport development and planning in the province. The implication on rural transport planning presented by the study findings are presented below.
• Household Profile
The rural areas surveyed for the Limpopo Rural Strategy showed the following profile: o Dominance of women and children. o Low ownership of houses and motorised transport, with evident domination of brick
structures and high ownership of animal-drawn carts. o Physical disability is dominant, with children being mostly affected. o Main source of income include agriculture and mining – showing the dominance of
the Primary Sector in the Province. o Levels of income is lower than R500 for 44% of households interviewed, illustrating
the high levels of poverty. Majority of households also illustrated a high dependency on grants (i.e. pension, child and disability grants).
o There is high level of illiteracy among the elders in the rural areas (i.e. fathers and mothers). The majority of school going children attend primary schools.
Implications of Household Profile on rural transport planning in the province include: o Provision of transport services and infrastructure that is friendly to all citizens, but
more importantly friendlier to women and children. o Provision of low cost transport interventions that are cost effective and easily
maintainable. o Consideration of physically disabled friendly transport is required to ensure transport
is provided for all. o Provision of transport services and infrastructure that is friendlier to the illiterate.
• Transportation Needs in the Province
Transportation needs of the different groups within rural areas are interpreted below. The majority of the employed economically active population in rural areas walk to work. Over 60% of households with workers spent between R201 and R500 per month for work trips.
Other household members travel during weekdays to visit family and friends. The majority of household members walk and also use the bus for weekday travelling. Weekend travelling is mainly for visiting family and friends, religious purposes and attending household chores. The mode of transport used includes walking, bus, minibus taxis, cars and lifts. The majority of school going children walk from home to school. They have also indicated that they favour walking, buses and the use of minibus taxis to travel to school. Majority of households spent between R101 and R200 per month for school trips. More than 20% of households spent over R200 per month on educational trips.

LL IIMMPPOOPPOO RRUURRAALL TTRRAANNSSPPOORRTT SSTTRRAATTEEGGYY PPHHAASSEE 11:: SSTTAATTEE OOFF RRUURRAALL TTRRAANNSSPPOORRTT
December 2010 Update
67
The majority of villages where interviews were conducted have schools located within the village. There are exceptions where children travel to schools outside the village’s jurisdiction. Implications to transport planning in these rural areas include children travelling for long hours at exceptionally high costs (in comparison with the income received by these households). Implications of transportation needs assessment on transportation planning include: o In future, when a village is proclaimed, the option of providing educational facilities
in the village should be investigated. o For already existing villages options available include provision of a school within
the village or provision of cost effective transport to schools located outside the villages.
• Public Transport Usage
There is in general good access to public transport service within the rural areas surveyed in the province. Only 6% of the household surveyed take more than 30 minutes to reach public transport services. 5% of the households surveyed do not have access to public transport. Within each district, there are days that one will wait longer than usual for public transport service.
Implications of the assessment of public transport usage on rural transport planning in the province include: o The development of Key Rural Transport Performance Indicators for public transport
services within the province (i.e. acceptable travel time to work and education, acceptable travel time for general trips; acceptable walking time to public transport service, acceptable waiting time for public transport service and acceptable cost of transportation).
o Increased public transport service schedules to limit waiting time. o Closer positioning of public transport services to the communities.
• Public Transport Gaps
The majority of households have limited access to adequate and affordable transport infrastructure and services. 62% of households surveyed indicated that they are not satisfied with minibus taxi service, whilst 41% said they are not satisfied with bus service. Some of the transport issues raised by the households include reckless driving, high costs, long distance while travelling, poor roads and unsafe conditions associated with use of specific modes (i.e. bicycles, donkey carts and walking). The implication of the assessment of public transport gaps on rural transport planning include: o The improvement of transport systems that will have a multiplier effects of
increasing accessibility, reducing poverty and enhancing social and economic development.
o Make transport safer by improvement of public transport services (increase availability).