status of the opera experiment - institute of physics
TRANSCRIPT

Journal of Physics Conference Series
OPEN ACCESS
Status of the OPERA experimentTo cite this article E Medinaceli and the OPERA Collaboration 2013 J Phys Conf Ser 442 012021
View the article online for updates and enhancements
You may also likeEmulsion sheet doublets as interfacetrackers for the OPERA experimentA Anokhina S Aoki A Ariga et al
-
A new generation scanning system for thehigh-speed analysis of nuclear emulsionsA Alexandrov A Buonaura L Consiglioet al
-
The OPERA experiment in the CERN toGran Sasso neutrino beamR Acquafredda T Adam N Agafonova etal
-
This content was downloaded from IP address 12118447184 on 17022022 at 0243
Status of the OPERA experiment
E Medinaceli for the OPERA Collaboration
INFN and University of Padova
E-mail medinacelipdinfnit
Abstract The OPERA neutrino detector at the Gran Sasso underground laboratory (LNGS)has been designed to perform the first detection of neutrino oscillations in direct appearancemode through the study of the νμ rarr ντ channel Tau leptons produced in the charged currentinteractions are identified by their decay topologies using nuclear emulsions After a briefdescription of the experimental setup the first two tau candidates found in the runs 2008 to2010 are reported The OPERA experiment has measured the velocity of neutrinos sent fromthe CERN CNGS beam over a baseline of about 730 km The measurement is based on datataken from 2009 to 2011 An arrival time of CNGS muon neutrinos with respect to the onecomputed assuming the speed of light in vacuum of (65plusmn74(stat)+34
minus33(sys)) ns was measured
1 The CNGS beam and the OPERA detector
The CNGS beam at CERN [1] is a high energy beam (lt Eνμ gtsim 17GeV ) optimized for thestudy of the appearance of ντ starting from a pure beam of νμ At the CNGS energies the averageτ decay length is submillimetric therefore nuclear emulsions are used as high precision trackingdevices In terms of interactions the νμ contamination is 21 the νe and νe contaminationstogether are smaller than 1 while the prompt number of ντ is negligible
OPERArsquos detector basic unit is the so-called ldquobrickrdquo which is composed of 56 lead layers1mm thick interleaved with 57 nuclear emulsion layers (0μm accuracy) The submicrometerspatial resolution of the nuclear emulsion allows a precise 3D reconstruction of the neutrinointeraction point and of the decay vertex associated with short-lived particle produced likethe τ lepton The overall target is composed of about 150000 bricks for a total mass of 125kton Each brick is a stand-alone detector used to estimate several kinematical variables of eachneutrino interaction eg particle momentum through their multiple Coulomb scattering in thelead plates [2] and the energy of electromagnetic showers OPERA is a hybrid detector [3]made of a veto plane followed by two identical Super Modules (SM) Each one includes a targetsection made of arrays of bricks and a scintillator Target Tracker detector (TT) [4] to trigger theread-out and localize neutrino interactions within the target Each target section is followed bya muon spectrometer [6] which is a dipolar magnet instrumented with resistive plate chambers(RPCs) and drift tubes detectors to measure the muon charge and momentum See Fig 1
2 Event selection and analysis
All electronic detector triggers recorded on-time with the CNGS are classified as internal orexternal events by an online algorithm ie as interactions inside or outside the OPERA target(eg in material along the beam-line preceding the OPERA target) respectively Only internalevents are used for oscillation studies The algorithm further classify the events as chargedcurrent (CC) or neutral current (NC) interactions through the spectrometers muon tracksidentification or the amount of traversed material [6]
DICE2012 IOP PublishingJournal of Physics Conference Series 442 (2013) 012021 doi1010881742-65964421012021
Content from this work may be used under the terms of the Creative Commons Attribution 30 licence Any further distributionof this work must maintain attribution to the author(s) and the title of the work journal citation and DOI
Published under licence by IOP Publishing Ltd 1
Figure 1 The OPERA detector at the Gran Sasso laboratory The picture shows both super-modules (SM1 and SM2) and the target and muon spectrometers in each SM
The neutrino vertex position is reconstructed and the brick with the highest probabilityof containing it is extracted from the target After a possitive scan result of two ldquotriggerrdquoemulsions (a detachable set of two emulsion films called Changeable Sheets or CS doublet)where tracks compatible with TT data are found the brick is developed and dispatched to ascanning laboratory in Europe or in Japan Tracks found in the CS doublet are extrapolatedto the most downstream film of the brick then followed upstream using its prediction from thescanning until they reach their stopping point ie when the track is not found in the nextthree consecutive films The vertex confirmation is done by scanning a large volume of sim 2cm3
around the stopping pointA procedure called decay search is applied afterwards in order to search for (1) charged
or neutral decay topologies (2) secondary interactions or (3) gamma-ray conversions If asecondary vertex is found a full kinematical analysis is performed combining the measurementsin the nuclear emulsion with data from the electronic detectors The momentum of chargedparticles can be measured in emulsions up to 6 GeVc It can be measured up to 12 GeVc witha resolution better than 33 using position deviations For muons crossing the spectrometersthe momentum is measured with a resolution better than 22 up to 30 GeVc the muon chargeis also determined [6] The hint of a decay topology is the observation of an impact parametergreater than 10 μm defined as the minimum distance between the track and the reconstructedvertex excluding low momentum tracks
3 Oscillation results
By applying the procedure described in section [2] to 4190 events acquired between 2008-2011two events pass the selection criteria defined for the τ lepton decay in two hadronic channels[3 5]31 First tau candidate
The first ντ candidate event was observed in the 2008-2009 dataset details can be found in [7]The event shown in Fig 2 has seven prongs at the primary vertex four of them originate fromhadrons three have a probability lower than 01 of being caused by a muon and none of themare left by an electron The parent track (labeled 4 and displayed in red in Fig 2) exhibits a kinktopology and the daughter track (shown also in Fig 2) is identified as produced by a hadronthrough its interaction The daughter impact parameter (IP) with respect to the primary vertex
DICE2012 IOP PublishingJournal of Physics Conference Series 442 (2013) 012021 doi1010881742-65964421012021
2
6
71
4
53
2 8 daughter
CS
γ1γ2
2mm
10mm
1
23
4 parent
5
68daughter
γ1
100 μm
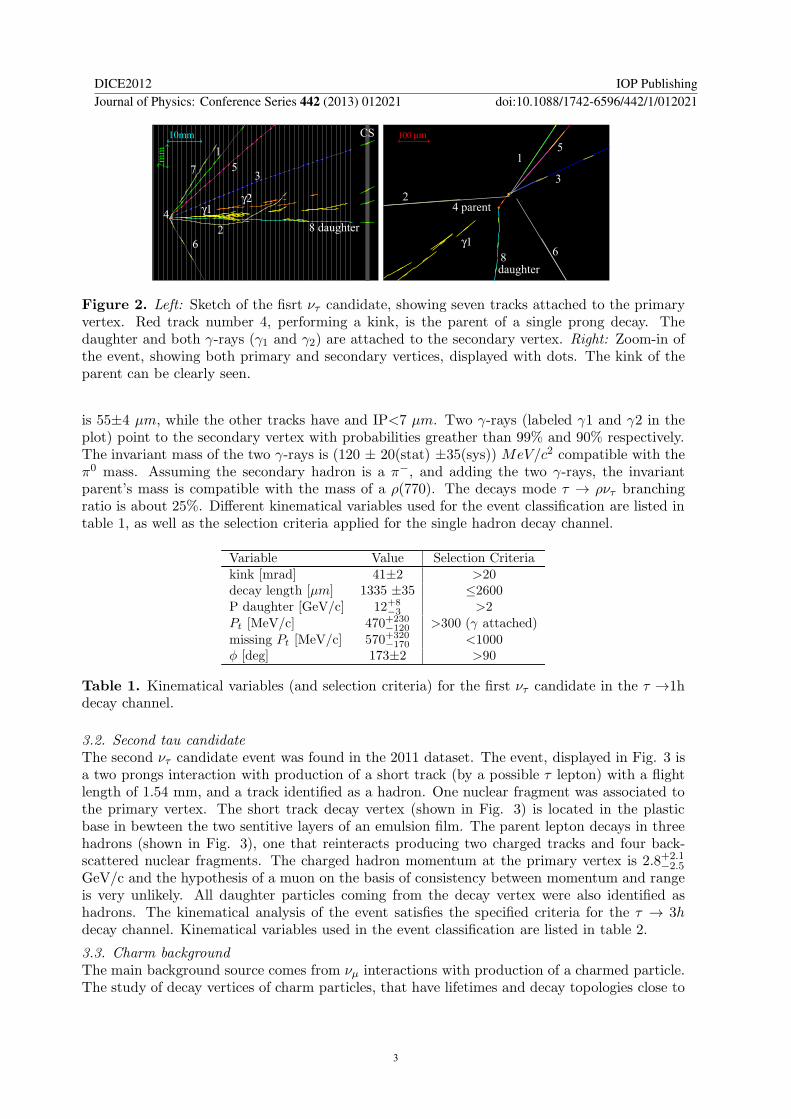
Figure 2 Left Sketch of the fisrt ντ candidate showing seven tracks attached to the primaryvertex Red track number 4 performing a kink is the parent of a single prong decay Thedaughter and both γ-rays (γ1 and γ2) are attached to the secondary vertex Right Zoom-in ofthe event showing both primary and secondary vertices displayed with dots The kink of theparent can be clearly seen
is 55plusmn4 μm while the other tracks have and IPlt7 μm Two γ-rays (labeled γ1 and γ2 in theplot) point to the secondary vertex with probabilities greather than 99 and 90 respectivelyThe invariant mass of the two γ-rays is (120 plusmn 20(stat) plusmn35(sys)) MeVc2 compatible with theπ0 mass Assuming the secondary hadron is a πminus and adding the two γ-rays the invariantparentrsquos mass is compatible with the mass of a ρ(770) The decays mode τ rarr ρντ branchingratio is about 25 Different kinematical variables used for the event classification are listed intable 1 as well as the selection criteria applied for the single hadron decay channel
Variable Value Selection Criteriakink [mrad] 41plusmn2 gt20decay length [μm] 1335 plusmn35 le2600P daughter [GeVc] 12+8
minus3 gt2Pt [MeVc] 470+230
minus120 gt300 (γ attached)missing Pt [MeVc] 570+320
minus170 lt1000φ [deg] 173plusmn2 gt90
Table 1 Kinematical variables (and selection criteria) for the first ντ candidate in the τ rarr1hdecay channel
32 Second tau candidate
The second ντ candidate event was found in the 2011 dataset The event displayed in Fig 3 isa two prongs interaction with production of a short track (by a possible τ lepton) with a flightlength of 154 mm and a track identified as a hadron One nuclear fragment was associated tothe primary vertex The short track decay vertex (shown in Fig 3) is located in the plasticbase in bewteen the two sentitive layers of an emulsion film The parent lepton decays in threehadrons (shown in Fig 3) one that reinteracts producing two charged tracks and four back-scattered nuclear fragments The charged hadron momentum at the primary vertex is 28+21
minus25
GeVc and the hypothesis of a muon on the basis of consistency between momentum and rangeis very unlikely All daughter particles coming from the decay vertex were also identified ashadrons The kinematical analysis of the event satisfies the specified criteria for the τ rarr 3hdecay channel Kinematical variables used in the event classification are listed in table 2
33 Charm background
The main background source comes from νμ interactions with production of a charmed particleThe study of decay vertices of charm particles that have lifetimes and decay topologies close to
DICE2012 IOP PublishingJournal of Physics Conference Series 442 (2013) 012021 doi1010881742-65964421012021
3
Figure 3 Event display of the second ντ candidate showing a two prong primary vertex Thered track is the decay vertex parent with 3 prongs attached
Variable Value Selectionkink [mrad] 874plusmn15 lt500P at 2ry vertex [GeVc] 84plusmn17 gt30Pt at 1
ry vertex [GeVc] 031plusmn011 lt10Min invariant mass [GeVc2] 096plusmn013 05ltmlt20Invariant mass [GeVc2] 08plusmn012 05ltmlt20φ(τ -hadron) [deg] 1678plusmn11 gt90
Table 2 Kinematical variables of the second ντ candidate satisfying specified criteria for theτ rarr3h decay channel
those of the τ lepton offer an opportunity to check τ efficiency The number of charm decaysfound so far in the data taken from 2008 to 2011 is 49 This number is in good agreement withthe Monte Carlo expectation of 51plusmn75 The statistical significance of the two ντ candidate eventobservations is still under evaluation along with the efficiencies for signal and background takinginto account different sample selections The preliminary number of expected ντ in the analyseddata sample is 21 with background of 02 events
4 Non oscillation results neutrino velocity
For this analysis the neutrino velocity is defined as the ratio of the measured distance fromCERN to OPERA (ie the baseline) to neutrinosrsquo time of flight ToFν traveling throughthe Earthrsquos crust High statistics data taken by OPERA between 2009 and 2011 is used forthe analysis The systematic uncertainties were reduced to the level of the statistical error bydedicated upgrates of the timing systems for time tagging and synchronisation of the CNGSbeam at CERN and of the OPERA detector41 Neutrino time of flight measurement
The neutrino starting time is defined by time tagging the extractions of the SPS beam Theproton time structure is accurately measured by a fast Beam Current Transformer (BCT)detector (400 MHz bandwidth) read out by a 1 GSs Wave Form Digitizer (WFD) with a 250MHz bandwidth The waveforms recorded for each extraction by the WFD are UTC (UniversalTime Coordinates) time-stamped with a Symmetricon GPS receiver and stored in the CNGSdatabase The ToFν is given by the difference between the arrival time in OPERA and thestart time at CERN At LNGS every millisecond a pulse (PPmS) is derived from the onesecond periodic pulse (1PPS) of a ESAT2000 GPS system and is transmitted from the surfacelaboratory to the OPERAMaster Clock in the underground laboratory through 83 km of opticalfibre The time base of the Master Clock is transmitted to OPERA detector sensors by which
DICE2012 IOP PublishingJournal of Physics Conference Series 442 (2013) 012021 doi1010881742-65964421012021
4
neutrino interaction time is defined The required ns accuracy for relative time tagging betweenCERN and the OPERA detector is achieved by adopting two identical systems installed inboth sites composed of a GPS receiver for time-transfer applications operating in common-view mode and a Cs atomic clock Both systems were calibrated in 2008 by the Swiss FederalMetrology Institute (METAS) and established a permanent time link at the level of 2 ns betweentCERN and tOPERA as reference points This time link was independently verified in 2011 bythe German Federal Metrology Institute (PTB) by taking data at CERN and LNGS with aportable time-transfer device The difference between the time base of the both GPS receiverswas measured as (23plusmn17) ns A detailed description of these procedures can be found in Ref[8]42 Neutrino baseline measurement
The neutrino baseline is defined as the distance between the point where the proton time-structure is measured (by the BCT at CERN) and the origin of the OPERA reference frameORF The travel path of protons from the BCT to the focal point of the CNGS target has beenmeasured with millimetric accuracy LBCTminustarget = (743391plusmn0002) m When these positionsare transformed into the global geodesy reference frame (ETRF2000) by relating them to theexternal GPS benchmarks at CERN they are known whitin 2 cm accuracy The coordinates ofthe ORF origin were measured in 2010 by establishing GPS benchmarks at the both sides of the10 km long Gran Sasso highway tunnel and by transporting their positions with a terrestrialtraverse down to OPERA A common analysis in the ETRF2000 for 3D coordinates of OPERAorigin and of the target focal point allowed their distance determination LtargetminusOPERA =(73053461plusmn020) m The 20 cm uncertainty is dominated by a long underground link betweenthe outdoor GPS and the OPERA detector benchmarks Then the baseline considered formeasuring ToFν is the sum of the distance between CNGS target focal point and the origin ofthe OPERA detector reference frame LtargetminusOPERA and the distance between BCT and thefocal point LBCTminustarget ie (7312780plusmn02) m43 Data analysis and results
Neutrinos ToFν from the standard CNGS beam can not be treated at the single interactionlevel due to the 105 μs pulse duration of the SPS extraction Any extracted proton mayproduce a neutrino detected by OPERA Therefore for each neutrino interaction measured inOPERA its corresponding proton extraction waveform is considered Those waveforms wereindividually normalized to unity and summed up in order to build a PDF w(t) of neutrinosrsquoemission time The neutrino interaction time is defined as the time of the earliest hit in theTT ToFν is obtained by comparing the distribution of protons crossing the BCT with neutrinoevents detected by OPERA
Assuming a propagation at the speed of light of protons over the baseline ToFc the deviationof ToFν with respect to ToFc (δt = ToFc minus ToFν) can be obtained by a maximum likelihoodanalysis of the time tags of OPERA events with respect to the PDF as a function of δt For theanalysis 15223 events (7235 NC and CC events contained inside the detector and 7988 externalCC events) were used corresponding to sim 1020 pot The arrival time of neutrinos with respectto the time evaluated considering the speed of light for the propagation is
δt = ToFc minus ToFν = 65plusmn 74(stat)+83minus80(sys) [ns] (1)
In order to exclude possible biases affecting the statistical analysis based on the neutrino emisionPDF the neutrino velocity was measured using a dedicated CNGS beam generated by an specialproton beam set-up from October 22 to November 6 2011 The modified SPS super-cycleconsisted of a single extraction including bunches sim 3 ns long (FWHM) separated by 524ns yielding a total of 11 times 1012 protons per cycle Given the short bunch length and therelatively long inter-bunch distance one could unambiguosly associate each neutrino event toits corresponding proton bunch The average time difference for 20 events (6 contained plus 14
DICE2012 IOP PublishingJournal of Physics Conference Series 442 (2013) 012021 doi1010881742-65964421012021
5
Figure 4 Distribution of the time difference δt between the light and the neutrino times offlight Neutrino time distribution First row selected events for the TT analysis using the firsthit (Method 1) and using muon hits only (Method 2) Second row events selected for theRPC analysis using muon hits (Method 3) and events analyzed using a dedicated timing board(Method 4)
external) measured with the TT is δt = minus19plusmn37(stat)+83minus80(sys) ns in agreement with previous
analysis At first order systematic uncertainties related to the bunched beam operation areequal or smaller than those affecting the result with the nominal CNGS beam Further detailscan be found in Ref [8]
CERN provided in 2012 a new narrow-bunch short-spacing beam between 10th and 24th ofMay In each 132 s CNGS cycle a single extraction delivers 16 proton bunches Each 28 ns longbunch contained sim 1011 protons giving an intensity a factor 6 higher than the 2011 bunchedbeam run During this two week period 18times 1017 pot were delivered In OPERA 104 on-lineevents were detected using TT (67 events) and RPC (62 events) An independent anlysis wasperformed for each detector type [9]
For the analysis using TT data two methods were used to compute neutrinosrsquo interactiontime ldquoMethod 1rdquo relies on the information of the earliest hit While ldquoMethod 2 rdquo exploits theinformation of all hits of the reconstructed 3D muon track only In the second method NC-likeevents are therefore not considered On the top row of Fig 4 are plotted the distributions ofδt for Method 1 (left) yielding δt = minus21 plusmn 11(stat) plusmn 44(sys) ns and for Method 2 (right)yielding δt = 12 plusmn 10(sta) plusmn 33(sys) ns The analysis using RPC data was performed usingthe standard OPERA DAQ ldquoMethod 3rdquo In this case only neutrino interactions producing aclear muon track in the RPCrsquos are used The corresponding δt distribution is shown in Fig4 (bottom left) the final result is δt = minus25 plusmn 18(stat) plusmn 53(sys) ldquoMethod 4rdquo uses RPCdata taken with a dedicated timing board TB which gives complementary information to eventsacquired using the standard OPERA DAQ Details about this timing system can be found inRef [9] The δt distribution for this method is shown in Fig 4 (bottom right) the final resultis δt = 06plusmn 04(stat)plusmn 36(sys) Methods 1 and 2 are statistically correlated since they use thesame DAQ system and sub-detector For the same reason they are also correlated with Method 3Method 4 is almost uncorrelated with the other methods because of the different timing systemused Residual correlation arises from the systematic error of the common part of the timingchain In order to obtain a single combined result Methods 2 and 4 were used since they have thesmallest statistical and systematical error and because they are almost completely uncorrelated
DICE2012 IOP PublishingJournal of Physics Conference Series 442 (2013) 012021 doi1010881742-65964421012021
6
thus providing maximum information Values obtained with Method 1 were used when Method2 could not be used because of the absence of a muon track Summing in quadrature systematicerrors separately for ν and ν contributions leads to δtν = (06 plusmn 04(stat) plusmn 30(syst)) ns andδtν = (17plusmn 14(stat) plusmn 31(syst)) ns
5 Conclusions
The OPERA experiment started collecting data in 2008 with the aim to make the first directobservation of neutrino oscillations in appearance mode In the νμ rarr ντ channel two events wereobserved in the data from 2008 to 2010 and part of 2011 The significance of this observation isstill under evaluation the preliminary expectancy is 21 ντ events with 02 background events
The OPERA experiment measured the neutrino velocity over the CNGS baseline (sim730Km) After correcting and updating its timing system [10 8] it was able to confirm the resultsobtained from standard CNGS data from 2009 to 2011 with data from two dedicated bunchedbeam runs preformed in 2011 Ref [8] and 2012 Ref [9] A limit on the speed of light deviationwas derived minus16 times 10minus6 lt (vν minus c)c lt 23 times 10minus6 showing no significant difference betweenneutrino and antineutrino velocities and speed of light
References[1] CNGS project httpproj-cngswebcernchproj-cngs[2] Agafanova N et al (OPERA Collab) 2012 New J Phys 14 013026[3] Guler M et al (OPERA Collaboration) 2000 CERN-SPSC-2000-028 LNGS P0252000[4] Adam T et al 2007 Nucl Instrum Meth A 577 523-539[5] Guler M et al (OPERA Collab) 2001 CERN-SPSC-2001-025 LNGS-EXP 302001 Add 101[6] Agafanova N et al (OPERA Collab) 2011 New J Phys 13 053051[7] Agafanova N et al (OPERA Collab) 2010 Phys Lett B 691 138[8] Adam T et al (OPERA Collab) 2012 JHEP 1210 093[9] Adam T et al (OPERA Collab) 2012 Preprint arXiv12121276 [hep-ex]
[10] Agafanova N et al (OPERA and LVD Collab) 2012 Eur Phys J Plus 127 71
DICE2012 IOP PublishingJournal of Physics Conference Series 442 (2013) 012021 doi1010881742-65964421012021
7

Status of the OPERA experiment
E Medinaceli for the OPERA Collaboration
INFN and University of Padova
E-mail medinacelipdinfnit
Abstract The OPERA neutrino detector at the Gran Sasso underground laboratory (LNGS)has been designed to perform the first detection of neutrino oscillations in direct appearancemode through the study of the νμ rarr ντ channel Tau leptons produced in the charged currentinteractions are identified by their decay topologies using nuclear emulsions After a briefdescription of the experimental setup the first two tau candidates found in the runs 2008 to2010 are reported The OPERA experiment has measured the velocity of neutrinos sent fromthe CERN CNGS beam over a baseline of about 730 km The measurement is based on datataken from 2009 to 2011 An arrival time of CNGS muon neutrinos with respect to the onecomputed assuming the speed of light in vacuum of (65plusmn74(stat)+34
minus33(sys)) ns was measured
1 The CNGS beam and the OPERA detector
The CNGS beam at CERN [1] is a high energy beam (lt Eνμ gtsim 17GeV ) optimized for thestudy of the appearance of ντ starting from a pure beam of νμ At the CNGS energies the averageτ decay length is submillimetric therefore nuclear emulsions are used as high precision trackingdevices In terms of interactions the νμ contamination is 21 the νe and νe contaminationstogether are smaller than 1 while the prompt number of ντ is negligible
OPERArsquos detector basic unit is the so-called ldquobrickrdquo which is composed of 56 lead layers1mm thick interleaved with 57 nuclear emulsion layers (0μm accuracy) The submicrometerspatial resolution of the nuclear emulsion allows a precise 3D reconstruction of the neutrinointeraction point and of the decay vertex associated with short-lived particle produced likethe τ lepton The overall target is composed of about 150000 bricks for a total mass of 125kton Each brick is a stand-alone detector used to estimate several kinematical variables of eachneutrino interaction eg particle momentum through their multiple Coulomb scattering in thelead plates [2] and the energy of electromagnetic showers OPERA is a hybrid detector [3]made of a veto plane followed by two identical Super Modules (SM) Each one includes a targetsection made of arrays of bricks and a scintillator Target Tracker detector (TT) [4] to trigger theread-out and localize neutrino interactions within the target Each target section is followed bya muon spectrometer [6] which is a dipolar magnet instrumented with resistive plate chambers(RPCs) and drift tubes detectors to measure the muon charge and momentum See Fig 1
2 Event selection and analysis
All electronic detector triggers recorded on-time with the CNGS are classified as internal orexternal events by an online algorithm ie as interactions inside or outside the OPERA target(eg in material along the beam-line preceding the OPERA target) respectively Only internalevents are used for oscillation studies The algorithm further classify the events as chargedcurrent (CC) or neutral current (NC) interactions through the spectrometers muon tracksidentification or the amount of traversed material [6]
DICE2012 IOP PublishingJournal of Physics Conference Series 442 (2013) 012021 doi1010881742-65964421012021
Content from this work may be used under the terms of the Creative Commons Attribution 30 licence Any further distributionof this work must maintain attribution to the author(s) and the title of the work journal citation and DOI
Published under licence by IOP Publishing Ltd 1
Figure 1 The OPERA detector at the Gran Sasso laboratory The picture shows both super-modules (SM1 and SM2) and the target and muon spectrometers in each SM
The neutrino vertex position is reconstructed and the brick with the highest probabilityof containing it is extracted from the target After a possitive scan result of two ldquotriggerrdquoemulsions (a detachable set of two emulsion films called Changeable Sheets or CS doublet)where tracks compatible with TT data are found the brick is developed and dispatched to ascanning laboratory in Europe or in Japan Tracks found in the CS doublet are extrapolatedto the most downstream film of the brick then followed upstream using its prediction from thescanning until they reach their stopping point ie when the track is not found in the nextthree consecutive films The vertex confirmation is done by scanning a large volume of sim 2cm3
around the stopping pointA procedure called decay search is applied afterwards in order to search for (1) charged
or neutral decay topologies (2) secondary interactions or (3) gamma-ray conversions If asecondary vertex is found a full kinematical analysis is performed combining the measurementsin the nuclear emulsion with data from the electronic detectors The momentum of chargedparticles can be measured in emulsions up to 6 GeVc It can be measured up to 12 GeVc witha resolution better than 33 using position deviations For muons crossing the spectrometersthe momentum is measured with a resolution better than 22 up to 30 GeVc the muon chargeis also determined [6] The hint of a decay topology is the observation of an impact parametergreater than 10 μm defined as the minimum distance between the track and the reconstructedvertex excluding low momentum tracks
3 Oscillation results
By applying the procedure described in section [2] to 4190 events acquired between 2008-2011two events pass the selection criteria defined for the τ lepton decay in two hadronic channels[3 5]31 First tau candidate
The first ντ candidate event was observed in the 2008-2009 dataset details can be found in [7]The event shown in Fig 2 has seven prongs at the primary vertex four of them originate fromhadrons three have a probability lower than 01 of being caused by a muon and none of themare left by an electron The parent track (labeled 4 and displayed in red in Fig 2) exhibits a kinktopology and the daughter track (shown also in Fig 2) is identified as produced by a hadronthrough its interaction The daughter impact parameter (IP) with respect to the primary vertex
DICE2012 IOP PublishingJournal of Physics Conference Series 442 (2013) 012021 doi1010881742-65964421012021
2
6
71
4
53
2 8 daughter
CS
γ1γ2
2mm
10mm
1
23
4 parent
5
68daughter
γ1
100 μm
Figure 2 Left Sketch of the fisrt ντ candidate showing seven tracks attached to the primaryvertex Red track number 4 performing a kink is the parent of a single prong decay Thedaughter and both γ-rays (γ1 and γ2) are attached to the secondary vertex Right Zoom-in ofthe event showing both primary and secondary vertices displayed with dots The kink of theparent can be clearly seen
is 55plusmn4 μm while the other tracks have and IPlt7 μm Two γ-rays (labeled γ1 and γ2 in theplot) point to the secondary vertex with probabilities greather than 99 and 90 respectivelyThe invariant mass of the two γ-rays is (120 plusmn 20(stat) plusmn35(sys)) MeVc2 compatible with theπ0 mass Assuming the secondary hadron is a πminus and adding the two γ-rays the invariantparentrsquos mass is compatible with the mass of a ρ(770) The decays mode τ rarr ρντ branchingratio is about 25 Different kinematical variables used for the event classification are listed intable 1 as well as the selection criteria applied for the single hadron decay channel
Variable Value Selection Criteriakink [mrad] 41plusmn2 gt20decay length [μm] 1335 plusmn35 le2600P daughter [GeVc] 12+8
minus3 gt2Pt [MeVc] 470+230
minus120 gt300 (γ attached)missing Pt [MeVc] 570+320
minus170 lt1000φ [deg] 173plusmn2 gt90
Table 1 Kinematical variables (and selection criteria) for the first ντ candidate in the τ rarr1hdecay channel
32 Second tau candidate
The second ντ candidate event was found in the 2011 dataset The event displayed in Fig 3 isa two prongs interaction with production of a short track (by a possible τ lepton) with a flightlength of 154 mm and a track identified as a hadron One nuclear fragment was associated tothe primary vertex The short track decay vertex (shown in Fig 3) is located in the plasticbase in bewteen the two sentitive layers of an emulsion film The parent lepton decays in threehadrons (shown in Fig 3) one that reinteracts producing two charged tracks and four back-scattered nuclear fragments The charged hadron momentum at the primary vertex is 28+21
minus25
GeVc and the hypothesis of a muon on the basis of consistency between momentum and rangeis very unlikely All daughter particles coming from the decay vertex were also identified ashadrons The kinematical analysis of the event satisfies the specified criteria for the τ rarr 3hdecay channel Kinematical variables used in the event classification are listed in table 2
33 Charm background
The main background source comes from νμ interactions with production of a charmed particleThe study of decay vertices of charm particles that have lifetimes and decay topologies close to
DICE2012 IOP PublishingJournal of Physics Conference Series 442 (2013) 012021 doi1010881742-65964421012021
3
Figure 3 Event display of the second ντ candidate showing a two prong primary vertex Thered track is the decay vertex parent with 3 prongs attached
Variable Value Selectionkink [mrad] 874plusmn15 lt500P at 2ry vertex [GeVc] 84plusmn17 gt30Pt at 1
ry vertex [GeVc] 031plusmn011 lt10Min invariant mass [GeVc2] 096plusmn013 05ltmlt20Invariant mass [GeVc2] 08plusmn012 05ltmlt20φ(τ -hadron) [deg] 1678plusmn11 gt90
Table 2 Kinematical variables of the second ντ candidate satisfying specified criteria for theτ rarr3h decay channel
those of the τ lepton offer an opportunity to check τ efficiency The number of charm decaysfound so far in the data taken from 2008 to 2011 is 49 This number is in good agreement withthe Monte Carlo expectation of 51plusmn75 The statistical significance of the two ντ candidate eventobservations is still under evaluation along with the efficiencies for signal and background takinginto account different sample selections The preliminary number of expected ντ in the analyseddata sample is 21 with background of 02 events
4 Non oscillation results neutrino velocity
For this analysis the neutrino velocity is defined as the ratio of the measured distance fromCERN to OPERA (ie the baseline) to neutrinosrsquo time of flight ToFν traveling throughthe Earthrsquos crust High statistics data taken by OPERA between 2009 and 2011 is used forthe analysis The systematic uncertainties were reduced to the level of the statistical error bydedicated upgrates of the timing systems for time tagging and synchronisation of the CNGSbeam at CERN and of the OPERA detector41 Neutrino time of flight measurement
The neutrino starting time is defined by time tagging the extractions of the SPS beam Theproton time structure is accurately measured by a fast Beam Current Transformer (BCT)detector (400 MHz bandwidth) read out by a 1 GSs Wave Form Digitizer (WFD) with a 250MHz bandwidth The waveforms recorded for each extraction by the WFD are UTC (UniversalTime Coordinates) time-stamped with a Symmetricon GPS receiver and stored in the CNGSdatabase The ToFν is given by the difference between the arrival time in OPERA and thestart time at CERN At LNGS every millisecond a pulse (PPmS) is derived from the onesecond periodic pulse (1PPS) of a ESAT2000 GPS system and is transmitted from the surfacelaboratory to the OPERAMaster Clock in the underground laboratory through 83 km of opticalfibre The time base of the Master Clock is transmitted to OPERA detector sensors by which
DICE2012 IOP PublishingJournal of Physics Conference Series 442 (2013) 012021 doi1010881742-65964421012021
4
neutrino interaction time is defined The required ns accuracy for relative time tagging betweenCERN and the OPERA detector is achieved by adopting two identical systems installed inboth sites composed of a GPS receiver for time-transfer applications operating in common-view mode and a Cs atomic clock Both systems were calibrated in 2008 by the Swiss FederalMetrology Institute (METAS) and established a permanent time link at the level of 2 ns betweentCERN and tOPERA as reference points This time link was independently verified in 2011 bythe German Federal Metrology Institute (PTB) by taking data at CERN and LNGS with aportable time-transfer device The difference between the time base of the both GPS receiverswas measured as (23plusmn17) ns A detailed description of these procedures can be found in Ref[8]42 Neutrino baseline measurement
The neutrino baseline is defined as the distance between the point where the proton time-structure is measured (by the BCT at CERN) and the origin of the OPERA reference frameORF The travel path of protons from the BCT to the focal point of the CNGS target has beenmeasured with millimetric accuracy LBCTminustarget = (743391plusmn0002) m When these positionsare transformed into the global geodesy reference frame (ETRF2000) by relating them to theexternal GPS benchmarks at CERN they are known whitin 2 cm accuracy The coordinates ofthe ORF origin were measured in 2010 by establishing GPS benchmarks at the both sides of the10 km long Gran Sasso highway tunnel and by transporting their positions with a terrestrialtraverse down to OPERA A common analysis in the ETRF2000 for 3D coordinates of OPERAorigin and of the target focal point allowed their distance determination LtargetminusOPERA =(73053461plusmn020) m The 20 cm uncertainty is dominated by a long underground link betweenthe outdoor GPS and the OPERA detector benchmarks Then the baseline considered formeasuring ToFν is the sum of the distance between CNGS target focal point and the origin ofthe OPERA detector reference frame LtargetminusOPERA and the distance between BCT and thefocal point LBCTminustarget ie (7312780plusmn02) m43 Data analysis and results
Neutrinos ToFν from the standard CNGS beam can not be treated at the single interactionlevel due to the 105 μs pulse duration of the SPS extraction Any extracted proton mayproduce a neutrino detected by OPERA Therefore for each neutrino interaction measured inOPERA its corresponding proton extraction waveform is considered Those waveforms wereindividually normalized to unity and summed up in order to build a PDF w(t) of neutrinosrsquoemission time The neutrino interaction time is defined as the time of the earliest hit in theTT ToFν is obtained by comparing the distribution of protons crossing the BCT with neutrinoevents detected by OPERA
Assuming a propagation at the speed of light of protons over the baseline ToFc the deviationof ToFν with respect to ToFc (δt = ToFc minus ToFν) can be obtained by a maximum likelihoodanalysis of the time tags of OPERA events with respect to the PDF as a function of δt For theanalysis 15223 events (7235 NC and CC events contained inside the detector and 7988 externalCC events) were used corresponding to sim 1020 pot The arrival time of neutrinos with respectto the time evaluated considering the speed of light for the propagation is
δt = ToFc minus ToFν = 65plusmn 74(stat)+83minus80(sys) [ns] (1)
In order to exclude possible biases affecting the statistical analysis based on the neutrino emisionPDF the neutrino velocity was measured using a dedicated CNGS beam generated by an specialproton beam set-up from October 22 to November 6 2011 The modified SPS super-cycleconsisted of a single extraction including bunches sim 3 ns long (FWHM) separated by 524ns yielding a total of 11 times 1012 protons per cycle Given the short bunch length and therelatively long inter-bunch distance one could unambiguosly associate each neutrino event toits corresponding proton bunch The average time difference for 20 events (6 contained plus 14
DICE2012 IOP PublishingJournal of Physics Conference Series 442 (2013) 012021 doi1010881742-65964421012021
5
Figure 4 Distribution of the time difference δt between the light and the neutrino times offlight Neutrino time distribution First row selected events for the TT analysis using the firsthit (Method 1) and using muon hits only (Method 2) Second row events selected for theRPC analysis using muon hits (Method 3) and events analyzed using a dedicated timing board(Method 4)
external) measured with the TT is δt = minus19plusmn37(stat)+83minus80(sys) ns in agreement with previous
analysis At first order systematic uncertainties related to the bunched beam operation areequal or smaller than those affecting the result with the nominal CNGS beam Further detailscan be found in Ref [8]
CERN provided in 2012 a new narrow-bunch short-spacing beam between 10th and 24th ofMay In each 132 s CNGS cycle a single extraction delivers 16 proton bunches Each 28 ns longbunch contained sim 1011 protons giving an intensity a factor 6 higher than the 2011 bunchedbeam run During this two week period 18times 1017 pot were delivered In OPERA 104 on-lineevents were detected using TT (67 events) and RPC (62 events) An independent anlysis wasperformed for each detector type [9]
For the analysis using TT data two methods were used to compute neutrinosrsquo interactiontime ldquoMethod 1rdquo relies on the information of the earliest hit While ldquoMethod 2 rdquo exploits theinformation of all hits of the reconstructed 3D muon track only In the second method NC-likeevents are therefore not considered On the top row of Fig 4 are plotted the distributions ofδt for Method 1 (left) yielding δt = minus21 plusmn 11(stat) plusmn 44(sys) ns and for Method 2 (right)yielding δt = 12 plusmn 10(sta) plusmn 33(sys) ns The analysis using RPC data was performed usingthe standard OPERA DAQ ldquoMethod 3rdquo In this case only neutrino interactions producing aclear muon track in the RPCrsquos are used The corresponding δt distribution is shown in Fig4 (bottom left) the final result is δt = minus25 plusmn 18(stat) plusmn 53(sys) ldquoMethod 4rdquo uses RPCdata taken with a dedicated timing board TB which gives complementary information to eventsacquired using the standard OPERA DAQ Details about this timing system can be found inRef [9] The δt distribution for this method is shown in Fig 4 (bottom right) the final resultis δt = 06plusmn 04(stat)plusmn 36(sys) Methods 1 and 2 are statistically correlated since they use thesame DAQ system and sub-detector For the same reason they are also correlated with Method 3Method 4 is almost uncorrelated with the other methods because of the different timing systemused Residual correlation arises from the systematic error of the common part of the timingchain In order to obtain a single combined result Methods 2 and 4 were used since they have thesmallest statistical and systematical error and because they are almost completely uncorrelated
DICE2012 IOP PublishingJournal of Physics Conference Series 442 (2013) 012021 doi1010881742-65964421012021
6
thus providing maximum information Values obtained with Method 1 were used when Method2 could not be used because of the absence of a muon track Summing in quadrature systematicerrors separately for ν and ν contributions leads to δtν = (06 plusmn 04(stat) plusmn 30(syst)) ns andδtν = (17plusmn 14(stat) plusmn 31(syst)) ns
5 Conclusions
The OPERA experiment started collecting data in 2008 with the aim to make the first directobservation of neutrino oscillations in appearance mode In the νμ rarr ντ channel two events wereobserved in the data from 2008 to 2010 and part of 2011 The significance of this observation isstill under evaluation the preliminary expectancy is 21 ντ events with 02 background events
The OPERA experiment measured the neutrino velocity over the CNGS baseline (sim730Km) After correcting and updating its timing system [10 8] it was able to confirm the resultsobtained from standard CNGS data from 2009 to 2011 with data from two dedicated bunchedbeam runs preformed in 2011 Ref [8] and 2012 Ref [9] A limit on the speed of light deviationwas derived minus16 times 10minus6 lt (vν minus c)c lt 23 times 10minus6 showing no significant difference betweenneutrino and antineutrino velocities and speed of light
References[1] CNGS project httpproj-cngswebcernchproj-cngs[2] Agafanova N et al (OPERA Collab) 2012 New J Phys 14 013026[3] Guler M et al (OPERA Collaboration) 2000 CERN-SPSC-2000-028 LNGS P0252000[4] Adam T et al 2007 Nucl Instrum Meth A 577 523-539[5] Guler M et al (OPERA Collab) 2001 CERN-SPSC-2001-025 LNGS-EXP 302001 Add 101[6] Agafanova N et al (OPERA Collab) 2011 New J Phys 13 053051[7] Agafanova N et al (OPERA Collab) 2010 Phys Lett B 691 138[8] Adam T et al (OPERA Collab) 2012 JHEP 1210 093[9] Adam T et al (OPERA Collab) 2012 Preprint arXiv12121276 [hep-ex]
[10] Agafanova N et al (OPERA and LVD Collab) 2012 Eur Phys J Plus 127 71
DICE2012 IOP PublishingJournal of Physics Conference Series 442 (2013) 012021 doi1010881742-65964421012021
7
6
71
4
53
2 8 daughter
CS
γ1γ2
2mm
10mm
1
23
4 parent
5
68daughter
γ1
100 μm
Figure 2 Left Sketch of the fisrt ντ candidate showing seven tracks attached to the primaryvertex Red track number 4 performing a kink is the parent of a single prong decay Thedaughter and both γ-rays (γ1 and γ2) are attached to the secondary vertex Right Zoom-in ofthe event showing both primary and secondary vertices displayed with dots The kink of theparent can be clearly seen
is 55plusmn4 μm while the other tracks have and IPlt7 μm Two γ-rays (labeled γ1 and γ2 in theplot) point to the secondary vertex with probabilities greather than 99 and 90 respectivelyThe invariant mass of the two γ-rays is (120 plusmn 20(stat) plusmn35(sys)) MeVc2 compatible with theπ0 mass Assuming the secondary hadron is a πminus and adding the two γ-rays the invariantparentrsquos mass is compatible with the mass of a ρ(770) The decays mode τ rarr ρντ branchingratio is about 25 Different kinematical variables used for the event classification are listed intable 1 as well as the selection criteria applied for the single hadron decay channel
Variable Value Selection Criteriakink [mrad] 41plusmn2 gt20decay length [μm] 1335 plusmn35 le2600P daughter [GeVc] 12+8
minus3 gt2Pt [MeVc] 470+230
minus120 gt300 (γ attached)missing Pt [MeVc] 570+320
minus170 lt1000φ [deg] 173plusmn2 gt90
Table 1 Kinematical variables (and selection criteria) for the first ντ candidate in the τ rarr1hdecay channel
32 Second tau candidate
The second ντ candidate event was found in the 2011 dataset The event displayed in Fig 3 isa two prongs interaction with production of a short track (by a possible τ lepton) with a flightlength of 154 mm and a track identified as a hadron One nuclear fragment was associated tothe primary vertex The short track decay vertex (shown in Fig 3) is located in the plasticbase in bewteen the two sentitive layers of an emulsion film The parent lepton decays in threehadrons (shown in Fig 3) one that reinteracts producing two charged tracks and four back-scattered nuclear fragments The charged hadron momentum at the primary vertex is 28+21
minus25
GeVc and the hypothesis of a muon on the basis of consistency between momentum and rangeis very unlikely All daughter particles coming from the decay vertex were also identified ashadrons The kinematical analysis of the event satisfies the specified criteria for the τ rarr 3hdecay channel Kinematical variables used in the event classification are listed in table 2
33 Charm background
The main background source comes from νμ interactions with production of a charmed particleThe study of decay vertices of charm particles that have lifetimes and decay topologies close to
DICE2012 IOP PublishingJournal of Physics Conference Series 442 (2013) 012021 doi1010881742-65964421012021
3
Figure 3 Event display of the second ντ candidate showing a two prong primary vertex Thered track is the decay vertex parent with 3 prongs attached
Variable Value Selectionkink [mrad] 874plusmn15 lt500P at 2ry vertex [GeVc] 84plusmn17 gt30Pt at 1
ry vertex [GeVc] 031plusmn011 lt10Min invariant mass [GeVc2] 096plusmn013 05ltmlt20Invariant mass [GeVc2] 08plusmn012 05ltmlt20φ(τ -hadron) [deg] 1678plusmn11 gt90
Table 2 Kinematical variables of the second ντ candidate satisfying specified criteria for theτ rarr3h decay channel
those of the τ lepton offer an opportunity to check τ efficiency The number of charm decaysfound so far in the data taken from 2008 to 2011 is 49 This number is in good agreement withthe Monte Carlo expectation of 51plusmn75 The statistical significance of the two ντ candidate eventobservations is still under evaluation along with the efficiencies for signal and background takinginto account different sample selections The preliminary number of expected ντ in the analyseddata sample is 21 with background of 02 events
4 Non oscillation results neutrino velocity
For this analysis the neutrino velocity is defined as the ratio of the measured distance fromCERN to OPERA (ie the baseline) to neutrinosrsquo time of flight ToFν traveling throughthe Earthrsquos crust High statistics data taken by OPERA between 2009 and 2011 is used forthe analysis The systematic uncertainties were reduced to the level of the statistical error bydedicated upgrates of the timing systems for time tagging and synchronisation of the CNGSbeam at CERN and of the OPERA detector41 Neutrino time of flight measurement
The neutrino starting time is defined by time tagging the extractions of the SPS beam Theproton time structure is accurately measured by a fast Beam Current Transformer (BCT)detector (400 MHz bandwidth) read out by a 1 GSs Wave Form Digitizer (WFD) with a 250MHz bandwidth The waveforms recorded for each extraction by the WFD are UTC (UniversalTime Coordinates) time-stamped with a Symmetricon GPS receiver and stored in the CNGSdatabase The ToFν is given by the difference between the arrival time in OPERA and thestart time at CERN At LNGS every millisecond a pulse (PPmS) is derived from the onesecond periodic pulse (1PPS) of a ESAT2000 GPS system and is transmitted from the surfacelaboratory to the OPERAMaster Clock in the underground laboratory through 83 km of opticalfibre The time base of the Master Clock is transmitted to OPERA detector sensors by which
DICE2012 IOP PublishingJournal of Physics Conference Series 442 (2013) 012021 doi1010881742-65964421012021
4
neutrino interaction time is defined The required ns accuracy for relative time tagging betweenCERN and the OPERA detector is achieved by adopting two identical systems installed inboth sites composed of a GPS receiver for time-transfer applications operating in common-view mode and a Cs atomic clock Both systems were calibrated in 2008 by the Swiss FederalMetrology Institute (METAS) and established a permanent time link at the level of 2 ns betweentCERN and tOPERA as reference points This time link was independently verified in 2011 bythe German Federal Metrology Institute (PTB) by taking data at CERN and LNGS with aportable time-transfer device The difference between the time base of the both GPS receiverswas measured as (23plusmn17) ns A detailed description of these procedures can be found in Ref[8]42 Neutrino baseline measurement
The neutrino baseline is defined as the distance between the point where the proton time-structure is measured (by the BCT at CERN) and the origin of the OPERA reference frameORF The travel path of protons from the BCT to the focal point of the CNGS target has beenmeasured with millimetric accuracy LBCTminustarget = (743391plusmn0002) m When these positionsare transformed into the global geodesy reference frame (ETRF2000) by relating them to theexternal GPS benchmarks at CERN they are known whitin 2 cm accuracy The coordinates ofthe ORF origin were measured in 2010 by establishing GPS benchmarks at the both sides of the10 km long Gran Sasso highway tunnel and by transporting their positions with a terrestrialtraverse down to OPERA A common analysis in the ETRF2000 for 3D coordinates of OPERAorigin and of the target focal point allowed their distance determination LtargetminusOPERA =(73053461plusmn020) m The 20 cm uncertainty is dominated by a long underground link betweenthe outdoor GPS and the OPERA detector benchmarks Then the baseline considered formeasuring ToFν is the sum of the distance between CNGS target focal point and the origin ofthe OPERA detector reference frame LtargetminusOPERA and the distance between BCT and thefocal point LBCTminustarget ie (7312780plusmn02) m43 Data analysis and results
Neutrinos ToFν from the standard CNGS beam can not be treated at the single interactionlevel due to the 105 μs pulse duration of the SPS extraction Any extracted proton mayproduce a neutrino detected by OPERA Therefore for each neutrino interaction measured inOPERA its corresponding proton extraction waveform is considered Those waveforms wereindividually normalized to unity and summed up in order to build a PDF w(t) of neutrinosrsquoemission time The neutrino interaction time is defined as the time of the earliest hit in theTT ToFν is obtained by comparing the distribution of protons crossing the BCT with neutrinoevents detected by OPERA
Assuming a propagation at the speed of light of protons over the baseline ToFc the deviationof ToFν with respect to ToFc (δt = ToFc minus ToFν) can be obtained by a maximum likelihoodanalysis of the time tags of OPERA events with respect to the PDF as a function of δt For theanalysis 15223 events (7235 NC and CC events contained inside the detector and 7988 externalCC events) were used corresponding to sim 1020 pot The arrival time of neutrinos with respectto the time evaluated considering the speed of light for the propagation is
δt = ToFc minus ToFν = 65plusmn 74(stat)+83minus80(sys) [ns] (1)
In order to exclude possible biases affecting the statistical analysis based on the neutrino emisionPDF the neutrino velocity was measured using a dedicated CNGS beam generated by an specialproton beam set-up from October 22 to November 6 2011 The modified SPS super-cycleconsisted of a single extraction including bunches sim 3 ns long (FWHM) separated by 524ns yielding a total of 11 times 1012 protons per cycle Given the short bunch length and therelatively long inter-bunch distance one could unambiguosly associate each neutrino event toits corresponding proton bunch The average time difference for 20 events (6 contained plus 14
DICE2012 IOP PublishingJournal of Physics Conference Series 442 (2013) 012021 doi1010881742-65964421012021
5
Figure 4 Distribution of the time difference δt between the light and the neutrino times offlight Neutrino time distribution First row selected events for the TT analysis using the firsthit (Method 1) and using muon hits only (Method 2) Second row events selected for theRPC analysis using muon hits (Method 3) and events analyzed using a dedicated timing board(Method 4)
external) measured with the TT is δt = minus19plusmn37(stat)+83minus80(sys) ns in agreement with previous
analysis At first order systematic uncertainties related to the bunched beam operation areequal or smaller than those affecting the result with the nominal CNGS beam Further detailscan be found in Ref [8]
CERN provided in 2012 a new narrow-bunch short-spacing beam between 10th and 24th ofMay In each 132 s CNGS cycle a single extraction delivers 16 proton bunches Each 28 ns longbunch contained sim 1011 protons giving an intensity a factor 6 higher than the 2011 bunchedbeam run During this two week period 18times 1017 pot were delivered In OPERA 104 on-lineevents were detected using TT (67 events) and RPC (62 events) An independent anlysis wasperformed for each detector type [9]
For the analysis using TT data two methods were used to compute neutrinosrsquo interactiontime ldquoMethod 1rdquo relies on the information of the earliest hit While ldquoMethod 2 rdquo exploits theinformation of all hits of the reconstructed 3D muon track only In the second method NC-likeevents are therefore not considered On the top row of Fig 4 are plotted the distributions ofδt for Method 1 (left) yielding δt = minus21 plusmn 11(stat) plusmn 44(sys) ns and for Method 2 (right)yielding δt = 12 plusmn 10(sta) plusmn 33(sys) ns The analysis using RPC data was performed usingthe standard OPERA DAQ ldquoMethod 3rdquo In this case only neutrino interactions producing aclear muon track in the RPCrsquos are used The corresponding δt distribution is shown in Fig4 (bottom left) the final result is δt = minus25 plusmn 18(stat) plusmn 53(sys) ldquoMethod 4rdquo uses RPCdata taken with a dedicated timing board TB which gives complementary information to eventsacquired using the standard OPERA DAQ Details about this timing system can be found inRef [9] The δt distribution for this method is shown in Fig 4 (bottom right) the final resultis δt = 06plusmn 04(stat)plusmn 36(sys) Methods 1 and 2 are statistically correlated since they use thesame DAQ system and sub-detector For the same reason they are also correlated with Method 3Method 4 is almost uncorrelated with the other methods because of the different timing systemused Residual correlation arises from the systematic error of the common part of the timingchain In order to obtain a single combined result Methods 2 and 4 were used since they have thesmallest statistical and systematical error and because they are almost completely uncorrelated
DICE2012 IOP PublishingJournal of Physics Conference Series 442 (2013) 012021 doi1010881742-65964421012021
6
thus providing maximum information Values obtained with Method 1 were used when Method2 could not be used because of the absence of a muon track Summing in quadrature systematicerrors separately for ν and ν contributions leads to δtν = (06 plusmn 04(stat) plusmn 30(syst)) ns andδtν = (17plusmn 14(stat) plusmn 31(syst)) ns
5 Conclusions
The OPERA experiment started collecting data in 2008 with the aim to make the first directobservation of neutrino oscillations in appearance mode In the νμ rarr ντ channel two events wereobserved in the data from 2008 to 2010 and part of 2011 The significance of this observation isstill under evaluation the preliminary expectancy is 21 ντ events with 02 background events
The OPERA experiment measured the neutrino velocity over the CNGS baseline (sim730Km) After correcting and updating its timing system [10 8] it was able to confirm the resultsobtained from standard CNGS data from 2009 to 2011 with data from two dedicated bunchedbeam runs preformed in 2011 Ref [8] and 2012 Ref [9] A limit on the speed of light deviationwas derived minus16 times 10minus6 lt (vν minus c)c lt 23 times 10minus6 showing no significant difference betweenneutrino and antineutrino velocities and speed of light
References[1] CNGS project httpproj-cngswebcernchproj-cngs[2] Agafanova N et al (OPERA Collab) 2012 New J Phys 14 013026[3] Guler M et al (OPERA Collaboration) 2000 CERN-SPSC-2000-028 LNGS P0252000[4] Adam T et al 2007 Nucl Instrum Meth A 577 523-539[5] Guler M et al (OPERA Collab) 2001 CERN-SPSC-2001-025 LNGS-EXP 302001 Add 101[6] Agafanova N et al (OPERA Collab) 2011 New J Phys 13 053051[7] Agafanova N et al (OPERA Collab) 2010 Phys Lett B 691 138[8] Adam T et al (OPERA Collab) 2012 JHEP 1210 093[9] Adam T et al (OPERA Collab) 2012 Preprint arXiv12121276 [hep-ex]
[10] Agafanova N et al (OPERA and LVD Collab) 2012 Eur Phys J Plus 127 71
DICE2012 IOP PublishingJournal of Physics Conference Series 442 (2013) 012021 doi1010881742-65964421012021
7
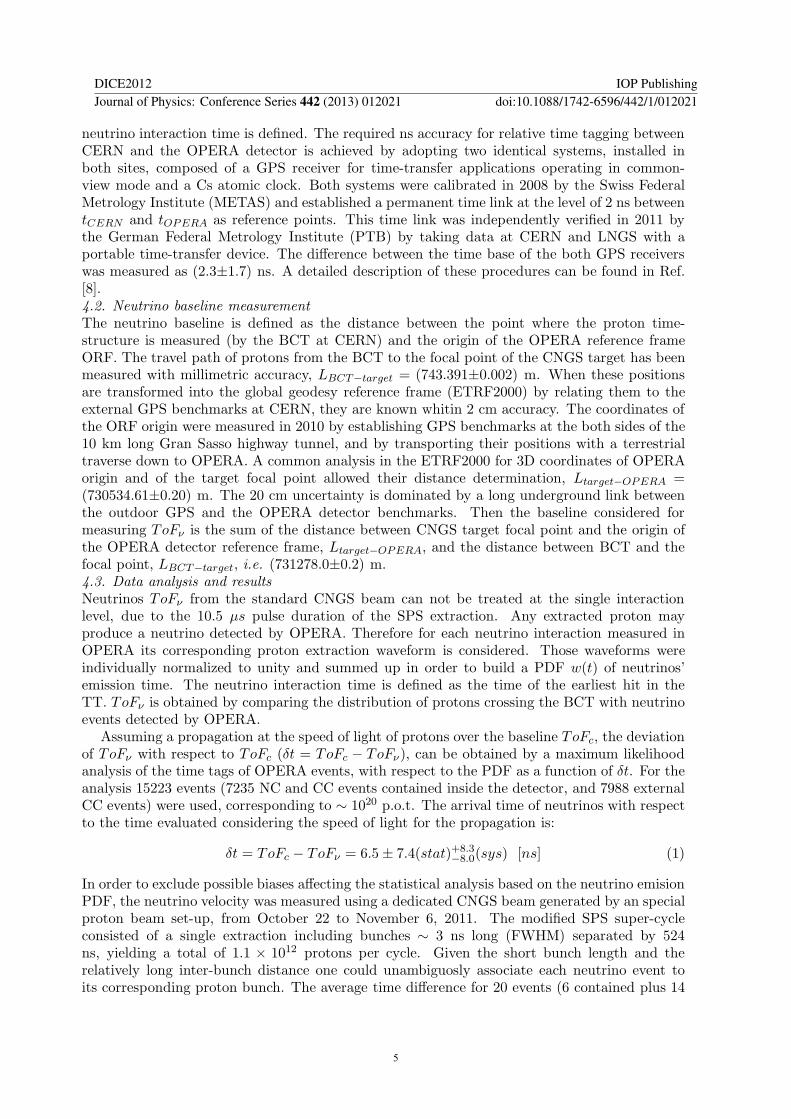