status of the western zone blacklip abalone haliotis rubra ......status of the western zone blacklip...
TRANSCRIPT

Status of the Western Zone Blacklip Abalone
(Haliotis rubra) Fishery in 2015
B. Stobart and S. Mayfield
SARDI Publication No. F2014/000361-2 SARDI Research Report Series No. 918
SARDI Aquatics Sciences
PO Box 120 Henley Beach SA 5022
September 2016
Report to PIRSA Fisheries and Aquaculture

Stobart, B. and Mayfield, S. (2016) Western Zone Blacklip Harvest Strategy Report
II
Status of the Western Zone Blacklip Abalone (Haliotis rubra) Fishery in 2015
Report to PIRSA Fisheries and Aquaculture
B. Stobart and S. Mayfield
SARDI Publication No. F2014/000361-2 SARDI Research Report Series No. 918
September 2016

Stobart, B. and Mayfield, S. (2016) Western Zone Blacklip Harvest Strategy Report
III
This publication may be cited as: Stobart. B and Mayfield, S. (2016). Status of the Western Zone Blacklip Abalone (Haliotis rubra) Fishery in 2015. Report to PIRSA Fisheries and Aquaculture. South Australian Research and Development Institute (Aquatic Sciences), Adelaide. SARDI Publication No. F2014/000361-2. SARDI Research Report Series No. 918. 23pp.
Cover photograph: Blacklip abalone (Haliotis rubra), B. Stobart
South Australian Research and Development Institute SARDI Aquatic Sciences 2 Hamra Avenue West Beach SA 5024 Telephone: (08) 8207 5400 Facsimile: (08) 8207 5406 http://www.pir.sa.gov.au/research DISCLAIMER The authors warrant that they have taken all reasonable care in producing this report. The report has been through the SARDI internal review process, and has been formally approved for release by the Research Chief, Aquatic Sciences. Although all reasonable efforts have been made to ensure quality, SARDI does not warrant that the information in this report is free from errors or omissions. SARDI does not accept any liability for the contents of this report or for any consequences arising from its use or any reliance placed upon it. The SARDI Report Series is an Administrative Report Series which has not been reviewed outside the department and is not considered peer-reviewed literature. Material presented in these Administrative Reports may later be published in formal peer-reviewed scientific literature. © 2016 SARDI This work is copyright. Apart from any use as permitted under the Copyright Act 1968 (Cth), no part may be reproduced by any process, electronic or otherwise, without the specific written permission of the copyright owner. Neither may information be stored electronically in any form whatsoever without such permission. Printed in Adelaide: September 2016
SARDI Publication No. F2014/000361-2 SARDI Research Report Series No. 918 Author(s): B. Stobart and S. Mayfield Reviewer(s): A. Linnane, C. Beckmann (SARDI) and B. M. Steer (PIRSA) Approved by: Q. Ye Science Leader – Inland Waters & Catchment Ecology
Signed: Date: 26 September 2016
Distribution: SAASC Library, SARDI Waite Executive Library, Parliamentary Library, State Library and National Library
Circulation: Public Domain

Stobart, B. and Mayfield, S. (2016) Western Zone Blacklip Harvest Strategy Report
IV
TABLE OF CONTENTS
ACKNOWLEDGEMENTS ......................................................................................................... VI
EXECUTIVE SUMMARY ........................................................................................................... 1
1. INTRODUCTION ................................................................................................................ 3
2. METHODS .......................................................................................................................... 4
3. RESULTS ........................................................................................................................... 6
3.1. Temporal patterns in catch, effort and CPUE ............................................................... 6
3.2. Spatial assessment units ............................................................................................. 6
3.3. Risk of overfishing in SAUs and zonal stock status ...................................................... 6
4. SUMMARY ........................................................................................................................22
REFERENCES .........................................................................................................................23

Stobart, B. and Mayfield, S. (2016) Western Zone Blacklip Harvest Strategy Report
V
LIST OF FIGURES
Figure 2.1. SAUs and map codes of the WZ South Australian Abalone Fishery. ................. 5
Figure 3.1. Catch, PropLge and TACC amendments of blacklip from the Western Zone from 1968 to 2015. .................................................................................................... 10
Figure 3.2. Bubble plot showing the spatial distribution of the blacklip catch among the SAUs in the WZ from 1979 to 2015. ............................................................................ 10
Figure 3.3. Drummond. Performance indicators catch, CPUE, PropLge, legal density, pre-recruit density, mortality and scores from the harvest strategy. ......................... 11
Figure 3.4. Sheringa. Performance indicators catch, CPUE, PropLge, legal density, pre-recruit density, mortality and scores from the harvest strategy. .................................... 12
Figure 3.5. Point Westall. Performance indicators catch, CPUE, PropLge, legal density, pre-recruit density, mortality and scores from the harvest strategy. ......................... 13
Figure 3.6. Avoid Bay. Performance indicators catch, CPUE, PropLge, legal density, pre-recruit density, mortality and scores from the harvest strategy. ......................... 14
Figure 3.7. Reef Head. Performance indicators catch, CPUE, PropLge, legal density, pre-recruit density, mortality and scores from the harvest strategy. ......................... 15
Figure 3.8. Searcy Bay. Performance indicators catch, CPUE, PropLge, legal density, pre-recruit density, mortality and scores from the harvest strategy. ......................... 16
Figure 3.9. Anxious Bay. Performance indicators catch, CPUE, PropLge, legal density, pre-recruit density, mortality and scores from the harvest strategy. ......................... 17
Figure 3.10. Ward Island. Performance indicators catch, CPUE, PropLge, legal density, pre-recruit density, mortality and scores from the harvest strategy. ......................... 18
Figure 3.11. Venus Bay, Point Avoid, Hotspot and Flinders Island SAUs. Performance indicators catch, CPUE, PropLge and scores from the harvest strategy. ........... 19
Figure 3.12. Catch and CPUE of blacklip from low importance SAUs Cape Bauer, Cape Catastrophe, Coffin Bay, D’Entrecasteaux Reef, Elliston Cliffs, Fishery Bay, Franklin Islands, Greenly Island, Memory Cove, NE Thistle, Neptune Islands and North Nuyts Archipelago from 1979 to 2015. ..................................................... 20
Figure 3.13. Catch and CPUE of blacklip from low importance SAUs Pearson Island, Sir Joseph Banks, South Nuyts Archipelago, SW Thistle, Taylor Island, The Gap, Unassigned WZ, Waterloo Bay and Wedge Island from 1979 to 2015. ................................. 21
LIST OF TABLES
Table 3.1. Outcome from application of the harvest strategy against the blacklip fishery in the Western Zone. Scoring of the “proportion of TACC” PI was against the legislated TACC .................................................................................................................. 8
Table 3.2. Outcome from application of the harvest strategy against the blacklip fishery in the Western Zone. Scoring of the “proportion of TACC” PI was against the voluntary catch limit. ........................................................................................................... 9

Stobart, B. and Mayfield, S. (2016) Western Zone Blacklip Harvest Strategy Report
VI
ACKNOWLEDGEMENTS
Funds for this research were provided by PIRSA Fisheries and Aquaculture, obtained through
licence fees. SARDI Aquatic Sciences provided substantial in-kind support. We thank the Western
Zone licence holders, fishers and shellers for providing length measurements of abalone in the
commercial catch, and for their contribution to our understanding of the information presented in
this report. We are grateful to Jay Dent, Toby Fox, Doug Graske, Bruce Miller-Smith, Dr Rowan
Chick, Brian Foureur, Damian Matthews, Andrew Hogg, and other SARDI past and present divers
for assistance with diving, and the collection and management of data. We thank Dr Jonathan
Carroll for statistical support and programming. This report was formally reviewed by Drs Adrian
Linnane and Crystal Beckmann (SARDI Aquatic Sciences), Prof. Gavin Begg, Research Chief
(SARDI Aquatic Sciences) and Dr Belinda McGrath-Steer (Fisheries and Aquaculture). It was
formally approved for release by Dr Qifeng Ye, Science Leader – Inland Waters & Catchment
Ecology, SARDI Aquatic Sciences.

Stobart, B. and Mayfield, S. (2016) Western Zone Blacklip Harvest Strategy Report
1
EXECUTIVE SUMMARY
This report provides assessment of the current stock status of Haliotis rubra (blacklip abalone;
hereafter termed blacklip) in the Western Zone (WZ) of the South Australian Abalone Fishery.
The assessment is required under the Management Plan for the South Australian Abalone
Fishery, which specifies the need for annual application of the harvest strategy to determine stock
status and review the total allowable commercial catch.
The harvest strategy is relatively new and several limitations have been identified, including stock
status classifications which are considered over-optimistic (Stobart et al. 2014; Stobart et al.
2015b). The stock status outcome from the harvest strategy was compared to the traditional,
weight-of-evidence analysis using the National Fishery Status Reporting Framework (NFSRF;
Flood et al. 2014) framework.
In 2015, there was a 21% voluntary reduction in catch by the commercial sector. The harvest
strategy classified the zonal stock status for WZ blacklip in 2015 as ‘over fished’ when applied
using the legislated total allowable commercial catch (TACC; 84.1 t) and ‘sustainably fished’
when the voluntary catch limit (66.4 t) was used. The classification using the harvest strategy for
the previous assessment in 2014 was ‘sustainably fished’.
Much of the data available for the fishery suggests blacklip stocks are at their weakest position
in over 25 years. These data include: (1) a 36% decrease in catch between 2010 and 2015;
(2) the zonal catch per unit effort (CPUE) decreasing 25% between 2003 and 2015, with values
in 2014 and 2015 the lowest since 1989; (3) CPUE in most high and medium SAUs in 2015 being
below the lower limit reference point, which is used in the harvest strategy to score this
Performance Indicator; (4) continuing decline in CPUE at Avoid Bay, and no evidence of
significant recovery at any of the remaining seven high importance spatial assessment units
(SAUs); (5) no evidence of stock recovery in several historically-important SAUs despite low
recent catches; and (6) a large proportion (60%) of high and medium-importance SAUs being
assigned higher (i.e. ‘red’ or ‘yellow’) risk-of-overfishing categories.
Collectively, this evidence demonstrates that this is a deteriorating stock. Fishing pressure is too
high and moving the stock in the direction of becoming recruitment overfished. Consequently,
the WZ blacklip fishery is classified as ‘transitional depleting’ under the NSFRF (Flood et al.
2014). This classification remained unchanged from the last assessment in 2014.

Stobart, B. and Mayfield, S. (2016) Western Zone Blacklip Harvest Strategy Report
2
Key WZ blacklip statistics from 2014, following the merger of regions A and B, are summarised
in Table 1.
Key statistics for the WZ blacklip fishery from 2014 including number of licences (No. licences), total allowable commercial catch (TACC), voluntary catch limit (VCL), total commercial catch (TCC), catch per unit effort (CPUE), harvest strategy (HS) stock status and national fishery status reporting framework (NFSRF) weight of evidence (WOE) stock status. tmw = tonnes meat weight, kg.hr-1 = kilograms per hour, na = not applicable.
Season No. licences
TACC (tmw)
VCL (tmw)
TCC (tmw)
CPUE (kg.hr-1)
HS Stock Status (TACC)
HS Stock Status (VCL)
NFSRF WOE Stock Status
2014 22 84.08 na 82.41 19.28 Sustainably fished na Transitional
depleting
2015 22 84.08 66.38 65.85 19.48 Over fished Sustainably
fished Transitional
depleting

Stobart, B. and Mayfield, S. (2016) Western Zone Blacklip Harvest Strategy Report
3
1. INTRODUCTION
This status report forms part of the South Australian Research and Development Institute’s
(SARDI – Aquatic Sciences) ongoing assessment program for this fishery. The Management Plan
for the South Australian Abalone Fishery (PIRSA 2012) requires annual application of the harvest
strategy to determine stock status and review the total allowable commercial catch (TACC). The
most recent zonal stock status and information on the fishery was provided in the stock
assessment of blacklip abalone (Haliotis rubra, hereafter referred to as blacklip) in the Western
Zone Abalone Fishery (WZAF) by Stobart et al. (2015a). Future reports for blacklip are scheduled
via a stock assessment in 2017 and a status report in 2018.
The harvest strategy for the South Australian Abalone Fishery (PIRSA 2012) is the current tool
for setting TACCs in this fishery. It is designed to monitor abalone stocks using biological
performance indicators (PIs; Stobart et al. 2015a) in spatial assessment units (SAUs) of high and
medium importance, assess the risk of overfishing in each SAU in relation to their importance and
use these to determine a stock status for the zone and adjust TACCs in response to changing
abalone populations. However, this relatively new harvest strategy has several limitations
including stock status classifications which are considered over-optimistic (e.g. Stobart et al.
2014) and the absence of an agreed limit reference point for determining whether the stocks are
recruitment overfished that would link the harvest strategy to the National Fishery Status
Reporting Framework (NFSRF; Flood et al. 2014). These issues are being addressed in the
harvest strategy review currently underway. The stock status classification from the harvest
strategy for the year ending 31 December 2015 was compared to the traditional, weight-of-
evidence approach using the NFSRF.
Application of the harvest strategy was complicated because the legislated TACC and the catch
limit agreed among the licence holders differ substantially. This is because the commercial sector
unanimously agreed to voluntarily under-catch the TACC by 21% in 2015 in response to low and
declining stock abundance that was poorly reflected by the harvest strategy. The reduction in
catch influences scoring of a key performance indicator (PI) – ‘proportion of TACC’ – if the
voluntary reduction is not accounted for. Consequently, in this status report, outcomes from
application of the harvest strategy using both the legislated TACC and the voluntary catch limit
are provided.

Stobart, B. and Mayfield, S. (2016) Western Zone Blacklip Harvest Strategy Report
4
2. METHODS
Methods used to apply the harvest strategy and undertake the weight-of-evidence assessment
are described in Stobart et al. (2012) and PIRSA (2012). Briefly, determination of the status of
blacklip in the WZAF involves: (1) determination of the importance of spatial assessment units
(single or multiple mapcodes intended to reflect abalone meta-populations; SAUs); (2) assigning
each SAU (Figure 2.1) to one of five risk-of-overfishing, color-coded, categories where the risk-
of-overfishing category for each SAU is derived from the scoring of six PIs in high importance
SAUs or three PIs in medium importance SAUs, using prescribed reference points calculated
from a 20-year reference period (1990-2009); and (3) the resulting risk-of-overfishing colour
coded category for each SAU is linked to a score (range -2 to +2) and multiplied by the
proportional contribution of that SAU to the combined catch, with the resulting values for all SAUs
summed to determine the zonal stock status. The zonal status score ranges between -2 and +2
and is allocated to one of five categories: 1) depleted (score ≤ -1.5); 2) overfished (-1.5 < score ≤
-0.5); 3) sustainably fished (-0.5 < score ≤ +0.5); 4) under fished (+ 0.5 ≤ score ≤ +1.5); and 5)
lightly fished (score ≥ +1.5).
There was a key difference between application of the harvest strategy in this report compared
with the previous assessment and status report. This is because two outcomes are provided
based on differing values from the scoring of the “proportion of TACC” PI. Thus, application of the
harvest strategy to determine the zonal stock status was carried out using both the legislated
TACC (84.1 t) and voluntary (66.4 t) catch limit. This reflects the commercial sector unanimously
agreeing to voluntarily under-catch the TACC by 21% in 2015.

Stobart, B. and Mayfield, S. (2016) Western Zone Blacklip Harvest Strategy Report
5
Figure 2.1. Spatial assessment units (SAUs) and map codes of the Western Zone South Australian Abalone Fishery.

Stobart, B. and Mayfield, S. (2016) Western Zone Blacklip Harvest Strategy Report
6
3. RESULTS
3.1. Temporal patterns in catch and CPUE
Western Zone
Total catches were relatively stable from 1981 to 2009 (Figure 3.1). From 2009 to 2015, there has
been a 36% reduction to the WZAF blacklip catch. This was due to the combined effects of
reductions to the Region A TACC in 2010 (92.0 t) and 2013 (87.4 t) and Region B in 2011 (9.2 t)
and 2012 (6.9 t), the removal of one licence from the WZ in 2014 and the 21% voluntary catch
reduction of the TACC in 2015 (84.1 t). With the exception of 2006, catch per unit effort (CPUE)
declined consistently between 2003 and 2014 (25%), to the lowest level since 1989. In 2015,
CPUE remained low and 15% below the mean CPUE from 1990-2009 (CPUE90-09; the 20-year
reference period from which the PIs are scored).
3.2. Spatial assessment units
The distribution of catch among SAUs remained similar between 2014 and 2015 (Figure 3.2), but
there were decreases in the percentage of catch from the Point Westall, Cape Bauer, South Nuyts
Archipelago and Franklin Islands SAUs. Catch increased in the Reef Head and North Nuyts
Archipelago SAUs. In 2015, SAU importance remained the same as 2014, with the exception of
Baird Bay that went from medium importance in 2014 to low importance in 2015. The recent
decline in zonal CPUE was evident in the Drummond, Sheringa, Avoid Bay, and Flinders Island
SAUs. Between 2014 and 2015, CPUE increased moderately in the high importance SAUs of
Point Westall, Reef Head, Searcy Bay, Anxious Bay and Ward Island and the medium importance
SAUs of Venus Bay and Point Avoid (Figures 3.3-3.11). However, with the exception of Point
Westall, the 2015 CPUE estimates for these SAUs remained lower than CPUE90-09. In addition,
with the exception of Point Westall and Anxious Bay, CPUE in all of these SAUs was also below
the lower limit reference point.
3.3. Risk of overfishing in SAUs and zonal stock status
In 2015, application of the harvest strategy to determine stock status for blacklip in the WZ was
based on 12 SAUs, providing a broad representation of fished stocks. There were eight high-
(Drummond, Sheringa, Point Westall, Avoid Bay, Reef Head, Searcy Bay, Anxious Bay and Ward
Island) and four medium-importance SAUs (Venus Bay, Point Avoid, Hotspot and Flinders Island;
Tables 3.1 - 3.2; Figures 3.2 – 3.11) for blacklip. Remaining SAUs were of low importance (Tables
3.1 - 3.2; Figures 3.11 – 3.13). The risk-of-overfishing category could be determined for 10 (83%)

Stobart, B. and Mayfield, S. (2016) Western Zone Blacklip Harvest Strategy Report
7
of the 12 high and medium importance SAUs (Tables 3.1 - 3.2). Limited data for estimating CPUE
in two medium-importance SAUs in 2015 (Hotspot and Flinders Island) resulted in the blacklip
stocks in these SAU being categorised as uncertain (Tables 3.1 - 3.2).
Use of the two alternate TACC values for scoring the “proportion of TACC” PI yielded several
differing results, namely: (1) “proportion of TACC” PI scores for five of the twelve SAUs were lower
when the legislated TACC was used (Table 3.1; largest differences were -2 for Anxious Bay and
Avoid Bay); (2) the risk-of-overfishing category for one SAU – Reef Head – differed (yellow using
the voluntary TACC, red using the legislated TACC); and (3) the catch-weighted, zonal stock
status score was -0.53 (over-fished) and -0.42 (sustainably fished) when using the legislated
(Table 3.1) and voluntary TACCs (Table 3.2), respectively.

Stobart, B. and Mayfield, S. (2016) Western Zone Blacklip Harvest Strategy Report
8
Table 3.1. Outcome from application of the harvest strategy described in the Management Plan for the South Australian Abalone Fishery against the blacklip fishery in the Western Zone. Scoring of the “proportion of TACC” PI was against the legislated TACC. Grey shading identifies the performance indicators and their respective scores. ND indicates no data.
Spatial assessment unit
% contribution to
mean total catch (WZ)
over the last 10 years
(06-15)
Importance
% contribution to
catch from high &
medium SAU in
2015
CPUEProportion
TACCPropLge
Pre-recruit
Density
Legal
DensityMortality Combined PI score Risk of overfishing
Catch-weighted
contribution to
zonal score
Drummond 10.0 High 31.37 -7 8 2 -2 1 2 4 1 0.31
Sheringa 6.3 High 13.92 -8 -1 -1 0 -1 0 -11 -2 -0.28
Point_Westall 4.3 High 8.22 0 -2 1 -4 0 3 -2 0 0.00
Avoid_Bay 4.1 High 6.29 -4 0 -1 -2 -2 0 -9 -2 -0.13
Reef_Head 3.7 High 11.13 -8 1 1 ND ND ND -6 -2 -0.22
Searcy_Bay 3.4 High 7.98 -6 0 1 ND ND ND -5 -1 -0.08
Anxious_Bay 3.1 High 8.04 0 0 -1 ND ND ND -1 0 0.00
Ward_Island 3.0 High 2.88 -8 -8 0 0 0 -2 -18 -2 -0.06
Venus_Bay 2.5 Medium 3.81 -7 -7 -1 -15 -2 -0.08
Point_Avoid 2.3 Medium 6.37 -7 6 3 2 0 0.00
Hotspot 2.0 Medium - ND -8 -1 Uncertain Not assigned -
Flinders_Island 1.3 Medium - ND -8 -1 Uncertain Not assigned -
Baird_Bay 1.1 Low - - - - - - - Not assessed
North_Nuyts_Archipelago 1.0 Low - - - - - - - Not assessed
Fishery_Bay 1.0 Low - - - - - - - Not assessed
Cape_Bauer 0.9 Low - - - - - - - Not assessed
The_Gap 0.7 Low - - - - - - - Not assessed
Elliston_Cliffs 0.6 Low - - - - - - - Not assessed
DEntrecasteaux_Reef 0.6 Low - - - - - - - Not assessed
Coffin_Bay 0.6 Low - - - - - - - Not assessed
Waterloo_Bay 0.5 Low - - - - - - - Not assessed
Cape_Catastrophe 0.5 Low - - - - - - - Not assessed
South_Nuyts_Archipelago 0.4 Low - - - - - - - Not assessed
Unassigned_WZ_RG_A 0.4 Low - - - - - - - Not assessed
Memory_Cove 0.2 Low - - - - - - - Not assessed
SW_Thistle 0.2 Low - - - - - - - Not assessed
Franklin_Islands 0.2 Low - - - - - - - Not assessed
Taylors_Island 0.1 Low - - - - - - - Not assessed
NE_Thistle 0.1 Low - - - - - - - Not assessed
Neptune_Islands 0.1 Low - - - - - - - Not assessed
Wedge_Island 0.0 Low - - - - - - - Not assessed
Pearson_Island 0.0 Low - - - - - - - Not assessed
Greenly_Island 0.0 Low - - - - - - - Not assessed
Unassigned_WZ_RG_B 0.0 Low - - - - - - - Not assessed
Sir_Joseph_Banks 0.0 Low - - - - - - - Not assessed
Sum 54.8 100.0
-0.53Zonal Stock Status

Stobart, B. and Mayfield, S. (2016) Western Zone Blacklip Harvest Strategy Report
9
Spatial assessment unit
% contribution to
mean total catch (WZ)
over the last 10 years
(06-15)
Importance
% contribution to
catch from high &
medium SAU in
2015
CPUEProportion
TACCPropLge
Pre-recruit
Density
Legal
DensityMortality Combined PI score Risk of overfishing
Catch-weighted
contribution to
zonal score
Drummond 10.0 High 31.37 -7 8 2 -2 1 2 4 1 0.31
Sheringa 6.3 High 13.92 -8 0 -1 0 -1 0 -10 -2 -0.28
Point_Westall 4.3 High 8.22 0 -1 1 -4 0 3 -1 0 0.00
Avoid_Bay 4.1 High 6.29 -4 2 -1 -2 -2 0 -7 -2 -0.13
Reef_Head 3.7 High 11.13 -8 2 1 ND ND ND -5 -1 -0.11
Searcy_Bay 3.4 High 7.98 -6 0 1 ND ND ND -5 -1 -0.08
Anxious_Bay 3.1 High 8.04 0 2 -1 ND ND ND 1 0 0.00
Ward_Island 3.0 High 2.88 -8 -8 0 0 0 -2 -18 -2 -0.06
Venus_Bay 2.5 Medium 3.81 -7 -7 -1 -15 -2 -0.08
Point_Avoid 2.3 Medium 6.37 -7 6 3 2 0 0.00
Hotspot 2.0 Medium - ND -8 -1 Uncertain Not assigned -
Flinders_Island 1.3 Medium - ND -8 -1 Uncertain Not assigned -
Baird_Bay 1.1 Low - - - - - - - Not assessed
North_Nuyts_Archipelago 1.0 Low - - - - - - - Not assessed
Fishery_Bay 1.0 Low - - - - - - - Not assessed
Cape_Bauer 0.9 Low - - - - - - - Not assessed
The_Gap 0.7 Low - - - - - - - Not assessed
Elliston_Cliffs 0.6 Low - - - - - - - Not assessed
DEntrecasteaux_Reef 0.6 Low - - - - - - - Not assessed
Coffin_Bay 0.6 Low - - - - - - - Not assessed
Waterloo_Bay 0.5 Low - - - - - - - Not assessed
Cape_Catastrophe 0.5 Low - - - - - - - Not assessed
South_Nuyts_Archipelago 0.4 Low - - - - - - - Not assessed
Unassigned_WZ_RG_A 0.4 Low - - - - - - - Not assessed
Memory_Cove 0.2 Low - - - - - - - Not assessed
SW_Thistle 0.2 Low - - - - - - - Not assessed
Franklin_Islands 0.2 Low - - - - - - - Not assessed
Taylors_Island 0.1 Low - - - - - - - Not assessed
NE_Thistle 0.1 Low - - - - - - - Not assessed
Neptune_Islands 0.1 Low - - - - - - - Not assessed
Wedge_Island 0.0 Low - - - - - - - Not assessed
Pearson_Island 0.0 Low - - - - - - - Not assessed
Greenly_Island 0.0 Low - - - - - - - Not assessed
Unassigned_WZ_RG_B 0.0 Low - - - - - - - Not assessed
Sir_Joseph_Banks 0.0 Low - - - - - - - Not assessed
Sum 54.8 100.0
-0.42Zonal Stock Status
Table 3.2. Outcome from application of the harvest strategy described in the Management Plan for the South Australian Abalone Fishery against the blacklip fishery in the Western Zone. Scoring of the “proportion of TACC” PI was against the voluntary catch limit (i.e. 21% below the TACC). Grey shading identifies the performance indicators and their respective scores. ND indicates no data.

Stobart, B. and Mayfield, S. (2016) Western Zone Blacklip Harvest Strategy Report
10
Figure 3.1. Catch (t, meat weight; black bars) of blacklip from the Western Zone from 1968 to 2015. Mean CPUE ± se (kg.hr-1) and PropLge are shown in red and blue lines, respectively. Red dashed line is CPUE90-09. Red arrows indicate implementation (1985) and amendment (1996, 2010 and 2013) of the TACC in Region A, blue arrows indicate implementation (1991) and amendment (1993, 1994, 2011 and 2012) of the TACC in Region B.
Figure 3.2. Bubble plot showing the spatial distribution of the blacklip catch (% of total catch) among the SAUs in the WZ from 1979 to 2015. Note abbreviations for Cape (Cp), island (Isl), reef (Rf) north east (NE), south west (SW), unassigned (Unass).

Stobart, B. and Mayfield, S. (2016) Western Zone Blacklip Harvest Strategy Report
11
Figure 3.3. Drummond (high importance). Performance indicators catch (Proportion of legislated TACC), CPUE (kg.hr-1), PropLge, legal density (n.m-2), pre-recruit density (n.m-2), mortality (Z) and scores from the harvest strategy in brackets. Red and blue lines are upper and lower limit and target reference points, respectively. Black bars describe the data and time over which the reference points were calculated, open bars describe the measures of the PI outside the reference period and yellow. bars the data and year subject to assessment for each PI, i.e. the score-year.

Stobart, B. and Mayfield, S. (2016) Western Zone Blacklip Harvest Strategy Report
12
Figure 3.4. Sheringa (high importance). Performance indicators catch (Proportion of legislated TACC), CPUE (kg.hr-1), PropLge, legal density (n.m-2), pre-recruit density (n.m-2), mortality (Z) and scores from the harvest strategy in brackets. Red and blue lines are upper and lower limit and target reference points, respectively. Black bars describe the data and time over which the reference points were calculated, open bars describe the measures of the PI outside the reference period and yellow bars the data and year subject to assessment for each PI, i.e. the score-year.

Stobart, B. and Mayfield, S. (2016) Western Zone Blacklip Harvest Strategy Report
13
Figure 3.5. Point Westall (high importance). Performance indicators catch (Proportion of legislated TACC), CPUE (kg.hr-1), PropLge, legal density (n.m-2), pre-recruit density (n.m-2), mortality (Z) and scores from the harvest strategy in brackets. Red and blue lines are upper and lower limit and target reference points, respectively. Black bars describe the data and time over which the reference points were calculated, open bars describe the measures of the PI outside the reference period and yellow bars the data and year subject to assessment for each PI, i.e. the score-year.

Stobart, B. and Mayfield, S. (2016) Western Zone Blacklip Harvest Strategy Report
14
Figure 3.6. Avoid Bay (high importance). Performance indicators catch (Proportion of legislated TACC), CPUE (kg.hr-1), PropLge, legal density (n.m-2), pre-recruit density (n.m-2), mortality (Z) and scores from the harvest strategy in brackets. Red and blue lines are upper and lower limit and target reference points, respectively. Black bars describe the data and time over which the reference points were calculated, open bars describe the measures of the PI outside the reference period and yellow bars the data and year subject to assessment for each PI, i.e. the score-year.
Stobart, B. and Mayfield, S. (2016) Western Zone Blacklip Harvest Strategy Report
15
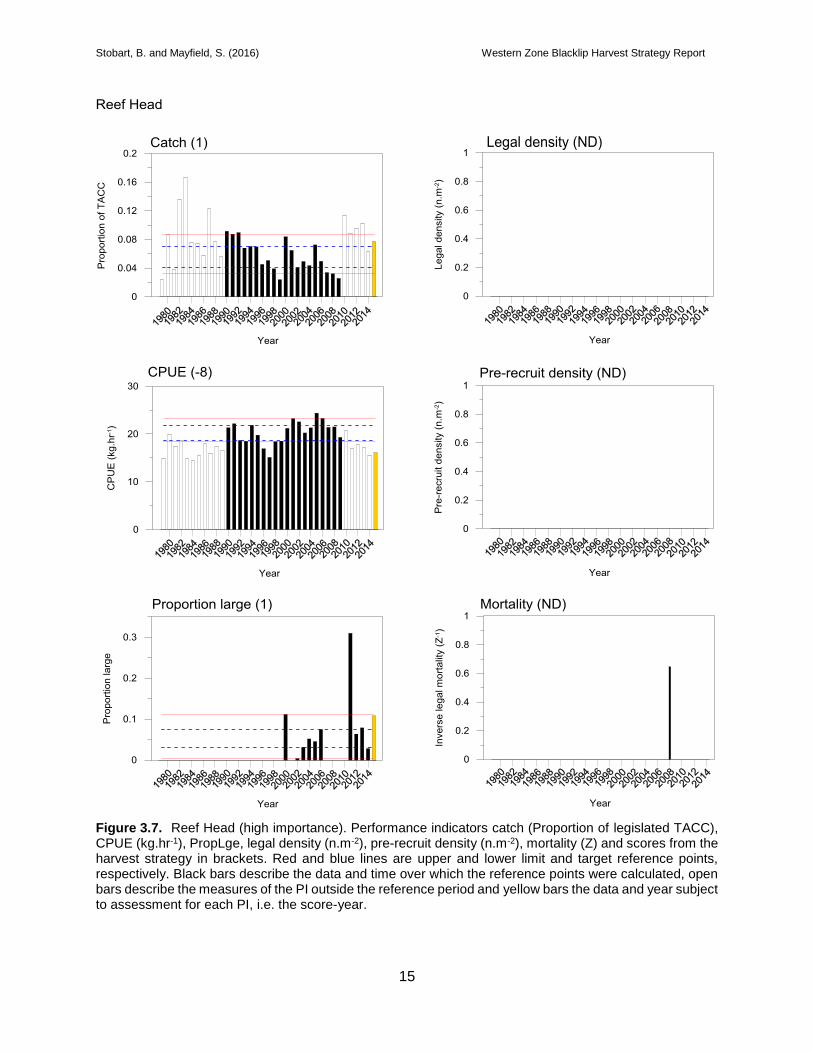
Figure 3.7. Reef Head (high importance). Performance indicators catch (Proportion of legislated TACC), CPUE (kg.hr-1), PropLge, legal density (n.m-2), pre-recruit density (n.m-2), mortality (Z) and scores from the harvest strategy in brackets. Red and blue lines are upper and lower limit and target reference points, respectively. Black bars describe the data and time over which the reference points were calculated, open bars describe the measures of the PI outside the reference period and yellow bars the data and year subject to assessment for each PI, i.e. the score-year.

Stobart, B. and Mayfield, S. (2016) Western Zone Blacklip Harvest Strategy Report
16
Figure 3.8. Searcy Bay (high importance). Performance indicators catch (Proportion of legislated TACC), CPUE (kg.hr-1), PropLge, legal density (n.m-2), pre-recruit density (n.m-2), mortality (Z) and scores from the harvest strategy in brackets. Red and blue lines are upper and lower limit and target reference points, respectively. Black bars describe the data and time over which the reference points were calculated, open bars describe the measures of the PI outside the reference period and yellow bars the data and year subject to assessment for each PI, i.e. the score-year.

Stobart, B. and Mayfield, S. (2016) Western Zone Blacklip Harvest Strategy Report
17
Figure 3.9. Anxious Bay (high importance). Performance indicators catch (Proportion of legislated TACC), CPUE (kg.hr-1), PropLge, legal density (n.m-2), pre-recruit density (n.m-2), mortality (Z) and scores from the harvest strategy in brackets. Red and blue lines are upper and lower limit and target reference points, respectively. Black bars describe the data and time over which the reference points were calculated, open bars describe the measures of the PI outside the reference period and yellow bars the data and year subject to assessment for each PI, i.e. the score-year.

Stobart, B. and Mayfield, S. (2016) Western Zone Blacklip Harvest Strategy Report
18
Figure 3.10. Ward Island (high importance). Performance indicators catch (Proportion of legislated TACC), CPUE (kg.hr-1), PropLge, legal density (n.m-2), pre-recruit density (n.m-2), mortality (Z) and scores from the harvest strategy in brackets. Red and blue lines are upper and lower limit and target reference points, respectively. Black bars describe the data and time over which the reference points were calculated, open bars describe the measures of the PI outside the reference period and yellow bars the data and year subject to assessment for each PI, i.e. the score-year.

Stobart, B. and Mayfield, S. (2016) Western Zone Blacklip Harvest Strategy Report
19
Figure 3.11. Venus Bay, Point Avoid, Hotspot and Flinders Island SAUs (medium importance). Performance indicators catch (Proportion of legislated TACC), CPUE (kg.hr-1), PropLge and scores from the harvest strategy in brackets. Red and blue lines are upper and lower limit and target reference points, respectively. Black bars describe the data and time over which the reference points were calculated, open bars describe the measures of the PI outside the reference period and orange bars the data and year subject to assessment for each PI, i.e. the score-year.
Figure 3.12. Venus Bay, Point Avoid, Hotspot and Flinders Island SAUs (medium importance). Performance indicators catch (Proportion of legislated TACC), CPUE (kg.hr-1), PropLge and scores from the harvest strategy in brackets. Red and blue lines are upper and lower limit and target reference points, respectively. Black bars describe the data and time over which the reference points were calculated, open bars describe the measures of the PI outside the reference period and orange bars the data and year subject to assessment for each PI, i.e. the score-year.

Stobart, B. and Mayfield, S. (2016) Western Zone Blacklip Harvest Strategy Report
20
Figure 3.13. Catch (t, meat weight; black bars) and CPUE ± se (kg.hr-1) of blacklip from low importance SAUs Cape Bauer, Cape Catastrophe, Coffin Bay, D’Entrecasteaux Reef, Elliston Cliffs, Fishery Bay, Franklin Islands, Greenly Island, Memory Cove, NE Thistle, Neptune Islands and North Nuyts Archipelago from 1979 to 2015. CPUE is shown in red. Red dashed lines show CPUE90-09 where applicable. Note catch scales vary among graphs.

Stobart, B. and Mayfield, S. (2016) Western Zone Blacklip Harvest Strategy Report
21
Figure 3.14. Catch (t, meat weight; black bars) and CPUE ± se (kg.hr-1) of blacklip from low importance SAUs Pearson Island, Sir Joseph Banks, South Nuyts Archipelago, SW Thistle, Taylor Island, The Gap, Unassigned WZ, Waterloo Bay and Wedge Island from 1979 to 2015. CPUE is shown in red. Red dashed lines show CPUE90-09 where applicable. Note catch scales vary among graphs.

Stobart, B. and Mayfield, S. (2016) Western Zone Blacklip Harvest Strategy Report
22
4. SUMMARY
The zonal stock status score from the harvest strategy based on the legislated TACC was -0.53,
classifying the fishery as ‘over fished’. This contrasts with that obtained using the voluntary TACC
(-0.42, ‘sustainably fished’). The difference was due to the PI ‘proportion of TACC’ generally
scoring lower when the agreed voluntary reduction in catch was not taken into account.
Much of the data available for the fishery suggest blacklip stocks are at their weakest position in
over 25 years. This is because: (1) there has been a 18% decrease in TACC and a 36% decrease
in catch (includes agreed voluntary reduction) between 2009 and 2015; (2) although zonal CPUE
was unchanged between 2014 and 2015, this metric has decreased 25% since 2003, and the
2014 and 2015 estimates were the lowest since 1989; (3) in 2015, available CPUE estimates
were below the lower limit reference points (LLRP), used in the harvest strategy to score this PI,
at all high and medium SAUs with the exception of Point Westall and Anxious Bay. In many cases,
CPUE was below the LLRP for several years (e.g. Drummond, Ward Island); (4) CPUE in 2015
could not be determined for Hotspot and Flinders Island – both medium-importance SAUs for
blacklip – due to very low catches and limited data; (5) between 2014 and 2015 CPUE continued
to decline in Avoid Bay, and there was no evidence of significant recovery at any of the remaining
seven high-importance SAUs; (6) 60% of the high and medium-importance SAUs were assigned
either a ‘red’ or ‘yellow’ risk-of-overfishing category when using either the legislated TACC or
voluntary catch limit; and (5) Ward Island, Flinders Island and Hotspot lack evidence of stock
recovery despite minimal recent catches. We note that the declines in CPUE across the WZ are
likely underestimating the reductions in harvestable biomass (Stobart et al. 2015a). There is no
evidence that catch can be redistributed to facilitate recovery in those SAUs where stock
abundance reductions have been the greatest.
Collectively, this evidence demonstrates that fishing pressure is too high and moving the stock in
the direction of becoming recruitment overfished. Consequently, the WZ Blacklip Abalone Fishery
is classified as ‘transitional depleting’ under the NFSRF. This was the same classification given
to these stocks in 2014, and reflects the recent widespread deterioration in stock abundance that
remains low in 2015.

Stobart, B. and Mayfield, S. (2016) Western Zone Blacklip Harvest Strategy Report
23
5. REFERENCES
Flood, M., Stobutzki, I., Andrews, J., Ashby, C., Begg, G., Fletcher, W., Gardner, C., Georgeson, L., Hartmant, K., Hone, P., Horvat, P., Maloney, L., McDonald, B., Moore, A., Roelofs, A., Sainsbury, K., Saunders, T., Smith, T., Stewardson, C., Stewart, J. and Wise, B. (2014). Status of key Australian fish stocks reports 2014. Canberra. Fisheries Research and Development Corporation.
PIRSA (2012). Management Plan for the South Australian commercial Abalone Fishery. Adelaide. Primary industries and Regions South Australia Fisheries and Aquaculture. http://www.pir.sa.gov.au/__data/assets/pdf_file/0004/12982/Abalone_Fishery_Management_Plan_-_September_2012_.pdf 85pp.
Stobart, B., Mayfield, S. and Dent, J. (2015a). Assessment of the Western Zone blacklip abalone (Haliotis rubra) fishery in 2014. Fishery stock assessment report to PIRSA Fisheries and Aquaculture. South Australian Research and Development Institute (Aquatic Sciences). Adelaide. SARDI publication F2015/000407-1. SARDI Research Report Series No. 864. 68pp. SARDI.
Stobart, B., Mayfield, S. and Dent, J. (2015b). Status of the Western Zone greenlip abalone (Haliotis laevigata) fishery in 2014. Report to PIRSA Fisheries and Aquaculture. South Australian Research and Development Institute (Aquatic Sciences). Adelaide. SARDI publication F2014/000361-2. SARDI Research Report Series No. 865. 14pp.
Stobart, B., Mayfield, S., Dent, J. and Matthews, D. J. (2014). Status of the Western Zone Blacklip Abalone (Haliotis rubra) Fishery in 2013. Report to PIRSA Fisheries and Aquaculuture. South Australian Research and Development Institute (Aquatic Sciences), Adelaide. SARDI Publication No F2014/000361-1. SARDI Research Report Series No. 791. 21pp.
Stobart, B., Mayfield, S., Dent, J., Matthews, D. J. and Chick, R. C. (2012). Western Zone Abalone (Haliotis rubra and H. laevigata) Fishery (Region A). Fishery Stock Assessment Report to PIRSA Fisheries and Aquaculture. South Australian Research and Development Institute (Aquatic Sciences). Adelaide. SARDI Publication No. F2007/000561-4. SARDI Research Report Series No. 660. 118pp.