steam and water combined analysis, …€¦ · steam and water combined analysis, integration, and...
TRANSCRIPT

i
UNIVERSITÉ DE MONTRÉAL
STEAM AND WATER COMBINED ANALYSIS, INTEGRATION,AND EFFICIENCY ENHANCEMENT IN KRAFT PULPING MILLS
MOHAMMAD JAVAD KESHTKAR
DÉPARTEMENT DE GÉNIE CHIMIQUE
ÉCOLE POLYTECHNIQUE DE MONTRÉAL
THÈSE PRÉSENTÉE EN VUE DE L’OBTENTION
DU DIPLÔME DE PHILOSOPHIAE DOCTOR
(GÉNIE CHIMIQUE)
OCTOBRE 2013
© Mohammad Javad Keshtkar, 2013.

ii
UNIVERSITÉ DE MONTRÉAL
ÉCOLE POLYTECHNIQUE DE MONTRÉAL
Cette thèse intitulée:
STEAM AND WATER COMBINED ANALYSIS, INTEGRATION,AND EFFICIENCY ENHANCEMENT IN KRAFT PULPING MILLS
présenté par : KESHTKAR Mohammad Javad
en vue de l’obtention du diplôme de : Philosophiae Doctor
a été dûment acceptée par le jury d’examen constitué de :
M. LEGROS Robert, Ph. D., président
M. PERRIER Michel, Ph. D., membre et directeur de recherche
M. PARIS Jean, Ph. D., membre et codirecteur de recherche
M. TAVARES Jason-Robert, Ph. D., membre
M. AHTILA Pekka Kullervo, D. Sc., membre

iii
DEDICATION
To my beloved parents, my brothers and sisters,
and my lovely wife, Samin
iv
ACKNOWLEDGEMENTS
I would like to express my acknowledgments to my co-supervisor, Professor Jean Paris for his
support and guidance during these years, for all the suggestions and advices that have derived in
the accomplishment of this thesis. You are an inspiration of hardwork and dedication. I would
like to convey my gratitude to my supervisor, Professor Michel Perrier, for his support and
advices. It had been a true privilege to learn from such competent and sincere supervisors.
I would like to thank Dr. Maryam Moshkelani, Dr. Enrique Mateos-Espejel, Dr. Luciana
Savulescu, and Walid Kamal for their support at the beginning of this project.
I like to extent my thanks to the entire technical and administrative staff of the Department of
Chemical Engineering in Ecole Polytechnique Montreal. I would like to acknowledge financial
support from the Natural Sciences and Engineering Research Council of Canada. The industrial
partners of this project and, more particularly, the mills that supplied the data are gratefully
acknowledged.
I would also like to send a heartfelt acknowledgment to my friends who made all these years vey
joyful with interesting, intellectual and creative ideas. Kazem, Masood, Moye, Hilda, Adriano,
Salomeh, Byan, Jawad, Mahsta, Shadi, Youssef, Shahrouz, Leila, Morad, Hamed, Shabnam,
Banafshe, Behrang, Tatiana,,...
I would like to thank all co-workers that have been part of our research group during these years,
to Mariya, Miyuru, Radia, Aurore, Islem, Pardis,...
I would like to thank my parents, my brothers and sisters for all the love, support, trust, and
guidance. They are the driving force behind all of my successes. To them I tribute a fervent
thanks.
Samin, we started our journey 3 years ago. These 3 years were the happiest time I’ve had so far.
However, there have been rough times, you have always supported me. I will never stop loving
you for the wonderful person you are.

v
RÉSUMÉ
Les principaux objectifs de cette thèse sont divisés en deux parties principales. Le premier
objectif est de développer de nouvelles techniques d'intégration des procédés (IP) pour améliorer
individuellement l'efficacité des systèmes d'eau et de vapeur, la performance des équipements, et
le réseau d’échangeurs de chaleur (HEX) d’un procédé existant. Ces techniques sont validées en
les appliquant au procédé Kraft. Le deuxième objectif est de développer une méthodologie
d’amélioration de l'efficacité énergétique et de la consommation d’eau (SWAEI : Steam Water
Analysis Enhancement Integration) d’un procédé en combinant les nouvelles techniques d'IP.
Les études de cas sont établis pour trois usines Kraft opérant au Canada (usines A, B, et C) avec
un large spectre de la répartition géographique, des produits et des matières premières. Des
modèles de simulation de chacune des trois usines ont été développés sur la plate-forme
CADSIM Plus et sont utilisés pour fournir des données pour l'analyse et intégrer les
modifications proposées.
Les usines de pâte et papier kraft constituent des importants utilisateurs d’eau et d'énergie
thermique dans le secteur industriel canadien. Il y existe une forte interaction entre les systèmes
de vapeur et d’eau. Pour diminuer les coûts de fabrication et accroître la rentabilité, il est
nécessaire de réduire la consommation d'énergie et d'eau ainsi que les coûts de traitement des
eaux usées.
Avant de passer à l’étape de développement de nouvelles techniques d'IP et de la méthodologie
SWAEI, une étape préalable est l'analyse comparative (benchmarking) pour donner un aperçu
sur la consommation de vapeur et la performance du système d’eau. La mise au point d’une
technique d’analyse comparative a permis de caractériser chaque étude de cas (i.e. les trois
usines kraft) en termes de consommation d'eau et d'énergie. Dans cette technique, la
consommation de vapeur et d'eau des usines sont étalonnées par rapport aux données de
référence. Les trois cas sont comparés en termes d'eau et d'allocations de vapeur pour différents
usages et aussi en termes des réseaux d’échangeur de chaleur de manière à souligner les
similarités et les différences. Les potentiels d'économies d'eau et de vapeur sont résumés dans
l'étape de synthèse. Les caractéristiques avantageuses d'une usine donnée sont utilisées pour

vi
proposer des mesures de diminution de la consommation de vapeur et de l'eau pour une autre
usine et vice versa.
La première technique d’intégration développée est l'analyse simultanée des réseaux
énergétiques et d'eau (SEWNA : Simultaneous Energy Water Network Analysis) qui se déroule
en cinq étapes pour économiser la vapeur et l'eau en même temps. Une nouvelle approche pour
identifier le volume de contrôle pour l'extraction des données est développée. Inévitablement, des
effluents doivent être soutirés pour éviter l'accumulation de produits chimiques et de particules
indésirables. Dans la ligne de traitement, le potentiel d'économie de vapeur est déterminé en
tenant compte des contraintes existantes pour l'utilisation de l'eau et de filtrats. De nouvelles
règles pour la réutilisation de filtrat sont présentées. La nouvelle d'analyse de l’utilisation de
l'énergie et de l’eau peut être réalisée sous forme de tableau ou graphique pour identifier les
mesures de réduction d'eau et de vapeur. La nouvelle représentation graphique des courbes de
pincement de l'énergie et de l’eau est constituée des concentrations des contaminants et des
courbes de température en fonction du débit pour tous les puits et les sources. L'eau économisée
est systématiquement enlevée de la source d'origine du réseau de production d'eau chaude et
tiède. Ceci élimine la consommation de vapeur pour la production d'eau chaude / eau tiède et
fournit également l'eau plus chaude au réseau HEX existant. Enfin, une analyse économique est
effectuée afin de calculer le coût de la tuyauterie pour les nouvelles connexions de réutilisation
de l'eau. La méthode SEWNA a été appliquée sur les trois usines de pâte kraft et a permis
d’estimer des économies importantes de vapeur et d’eau avec un retour sur investissement
relativement court. Le total des économies d’eau et de vapeur de l'ordre de 24 à 54 % et 11 à 29
% respectivement, ont été obtenus par de simples modifications de tuyauterie.
La seconde technique d’intégration des procédés développée est l'analyse de la performance des
équipements (EPA : Equipment Performance Analysis). Elle permet la caractérisation, l’analyse
et le diagnostic des équipements individuels ou des départements d’une usine du point de vue de
la consommation de vapeur et d'eau. L'indicateur de performance clé (KPI : Key Performance
Indicator) pour l'efficacité énergétique et / ou de la consommation d'eau de l'équipement ou d’un
service est calculé et comparé à des données de référence. Les causes et les solutions probables
sont établies pour les inefficacités. Cette technique a été appliquée à l'usine C. Sur la base des
projets correctifs envisagés, la production de vapeur dans les chaudières peut être augmentée de

vii
21% et également la consommation de vapeur et d'eau peuvent être réduites par 9% et 11 %
respectivement. Les résultats obtenus de cette technique pourraient être une incitation pour
évaluer en profondeur la performance des équipements sur site en entier.
La troisième nouvelle technique d’intégration des procédés est la rétro-installation de la
conception du réseau HEN (Retrofit - HEN) et se compose de quatre étapes successives. Les
contraintes physiques et d’opération du procédé, notamment sur les températures des opérations
unitaires les plus sensibles sont analysées. Une cible réaliste pour l'économie de vapeur est
établie en fonction des contraintes et la classification des utilisateurs de vapeur. Les courants
existants des échangeurs de chaleur sont évalués pour être utilisé plus efficacement dans le
nouveau réseau. Pour utiliser plus efficacement la chaleur perdue, les courants sont classés
comme hautement et faiblement corrosifs. Le HEN proposé est conçu en utilisant un nouvel
algorithme en fonction de cinq heuristiques et règles pratiques. La technique a été appliquée sur
le moulin C et une économie totale de vapeur de 38% a été obtenue.
La méthodologie globale SWAEI (Steam Water Analysis Enhancement Integration) consiste en
six étapes successives. Dans la première étape, le modèle de simulation du scénario de base est
développé. Dans la deuxième étape, un pré-étalonnage (pre-benchmarking) est effectué en
comparant la consommation de vapeur et d'eau avec des données de référence. Le coeur de la
méthodologie est l'identification des projets d'amélioration de l'énergie et de l'eau en appliquant
séquentiellement les techniques SEWNA, EPA et R- HEN. L'application séquentielle de ces
techniques conduit à des résultats beaucoup plus grands d'économie de vapeur que si elles
avaient été appliquées individuellement. Cette application séquentielle conduit à des projets
complémentaires pour maximiser les économies de vapeur. L'excès de vapeur estimé peut être
utilisé pour réduire ou éliminer la consommation de combustibles fossiles. Le reste de la vapeur
en excès pourrait être vendue dans la communauté, produire de l'électricité en utilisant la
cogénération ou une combinaison de cogénération et d'un système pompe à chaleur à absorption
(tri-génération). Ces solutions de rechange pour l'utilisation de la vapeur en excès sont
examinées du point de vue économique pour choisir la plus prometteuse pour la mise en œuvre.
Dans la cinquième étape, les projets identifiés sont priorisés et une stratégie de mise en œuvre en
deux phases est proposée. Dans la première phase, il est proposé de mettre en œuvre les projets
qui conduisent à la réduction des combustibles fossiles ou de leur élimination. Les autres projets

viii
proposés sont à mettre en œuvre dans la deuxième phase afin d’économiser plus de vapeur pour
la vente ou la production d'électricité. Enfin la sixième et dernière étape consiste en une post-
analyse comparative menée afin de visualiser les zones d'amélioration. La méthodologie a été
appliquée sur les trois usines et a donné 27, 33, et 66 % d'économies de vapeur et 38, 24, et 58 %
pour les économies d'eau des usines A, B, et C respectivement.

ix
ABSTRACT
The principle objectives of this thesis are divided into two main parts. The first key objective is
to develop new process integration (PI) techniques to individually improve the efficiency of
water and steam systems, the performance of equipment, and the heat exchanger (HEX) network
of the existing water-based process. These techniques are validated by applying them to the Kraft
process. The second objective is to develop a steam and water analysis enhancement and
integration (SWAEI) methodology to improve the energy and water efficiency of a water-based
process by combining the new PI techniques. The case studies are three Canadian Kraft mills
(mills A, B, and C) with a broad spectrum of geographic distribution, products, and raw
materials. A simulation of the three mills has been developed in the Cadsim Plus platform and is
used to provide data for analysis and incorporate proposed modifications.
The Kraft pulp and paper (P&P) mill is one of the major water and thermal energy users in the
Canadian industrial sectors. It is also one of the water-based processes where there is large
interaction between water and steam systems. To decrease manufacturing costs and increase
profitability, it is necessary to reduce energy, water, and wastewater treatment costs.
Before going through the development of new PI techniques and SWAEI methodology, a
prerequisite step is benchmarking to give actual insights about current steam and water
performance. A benchmarking technique characterizes the case studies (three Kraft mills) in
terms of water and energy consumption. In this technique, the steam and water consumption of
the mills are benchmarked against reference data. The cases are compared in terms of water and
steam allocations for different uses and also in terms of the heat exchanger and water networks
so as to indicate the similarities and differences. The potential for steam and water savings are
summarized in the synthesis step. The advantageous characteristics of one case are used to
propose the steam and water saving measures for another case and vise versa.
The first developed PI technique is simultaneous energy and water networks analysis (SEWNA)
that involves five steps to save steam and water at the same time. A new approach to identify the
control volume for data extraction is shown. Inevitable effluents from the source pool are
subtracted to prevent accumulation of chemicals and unwanted particles. In the process line, the
potential for steam saving is determined considering the existing process constraints for water

x
utilization and filtrate reutilization. The new rules for filtrate reutilization are presented. The new
water and energy analysis can be performed either in tabular or graphical form to identify the
water measures with respect to steam reduction. The new graphical Water and Energy Pinch
Curves consist of contaminant concentration and temperature curves versus flowrate for all sinks
and sources. The saved water is reduced systematically from the origin source of the hot and
warm water production network. This eliminates steam consumption for hot/warm water
production and also provides hotter and warmer water using the existing HEX network. Finally,
the economic analysis is conducted to calculate the piping cost for new water reutilization
connections. SEWNA has been applied on the three Kraft mills and resulted in significant water
and steam savings with a reasonably short payback period. The total water and steam savings in
the range of 24-54% and 11-29%, respectively, have been achieved by simple piping.
The second developed PI technique is equipment performance analysis (EPA). It characterizes,
analyzes, and diagnoses individual equipment or departments from the standpoint of steam and
water consumption. The key performance indicator (KPI) for energy and/or water efficiency of
equipment or a department is calculated and benchmarked against reference data. Probable
causes and solutions are determined for inefficiencies. This technique has been applied to mill C.
Based on probable remedial projects for improvement, the steam generation at the boilers can be
increased by 21% and also steam and water can be saved by 9% and 11%, respectively. The
results of this technique could be an incentive for in-depth and on-site performance analysis.
The third new PI technique is the retrofit HEX network design (R-HEN) for a water-based
process that consists of four successive steps. The physical and process constraints including
hard and soft temperature of sensitive unit operations are analyzed. A realistic targeting for
steam saving is conducted based on the constraints and the classification of steam users. The
existing process stream HEXs are assessed to be used effectively in the new network. To utilize
efficiently the heat of waste streams, they are categorized as high and low corrosive. The retrofit
HEN is designed using a new algorithm according to five heuristic and practical rules. The
technique has been applied on mill C. The total steam saving of 38% has been accomplished.
The steam and water analysis enhancement and integration (SWAEI) methodology consists of
six successive steps. In the first step, the simulation model of the base case is developed. In the

xi
second step, pre-benchmarking is carried out by comparing the steam and water consumption
with reference data. The core of methodology is the identification of the energy and water
improvement projects by sequentially applying SEWNA, EPA, and R-HEN. Sequential
application of these techniques results in significantly more steam saving than if they would have
been applied individually. This sequential application leads to complementary projects to
maximize steam saving. The excess steam is used to reduce or eliminate fossil fuel consumption.
The remainder of excess steam could be sold to the local district, generate electricity using
cogeneration or a combination of cogeneration and an absorption heat pump (trigeneration)
system. These alternatives for using the remainder of excess steam are examined from the
economical perspective to choose the most promising one for implementation. In step five, the
identified projects are prioritized and the implementation strategy is proposed in two phases. In
phase one, it is proposed to implement the projects that lead to fossil fuel reduction or
elimination. The other projects are proposed to be implemented in the second phase to save more
steam for selling or generating electricity. Finally, the post-benchmarking is conducted to
visualize areas of improvement. The methodology has been applied on three mills and yielded
27, 33, and 66% steam savings and 38, 24, and 58% water savings for mills A, B, and C,
respectively.

xii
CONDENSÉ EN FRANÇAIS
Les procédés à base d'eau, comme la production de sucre, de pâtes et papiers (P & P ), et de la
bière, sont des procédés dans lesquels l'eau est le principal moyen pour véhiculer la masse, le
momentum et l’énergie. Dans ces procédés, l'eau est utilisée à différentes fins, par exemple
comme milieu de réaction, comme solvant dans certains procédés d'extraction, comme un agent
de lavage et bien d’autres applications. L'énergie thermique (vapeur d'eau) et les systèmes d'eau
dans de tels procédés sont fortement liés entre eux et interagissent les uns avec les autres. Ces
procédés font face à plusieurs contraintes, telles que la compétitivité mondiale, la demande du
public pour des produits durables et des règlements environnementaux stricts. Une façon de
demeurer compétitif est de diminuer le coût de fabrication en réduisant le coût de la
consommation d'énergie et d'eau ainsi que le traitement des eaux usées. En outre, dans ces
procédés, puisque l'électricité est utilisée pour actionner les pompes, une augmentation de la
consommation d'eau et de la production d'effluents, entraînent une plus grande consommation
d'électricité. Par conséquent, les principales incitations pour les programmes de conservation de
l'énergie et de l'eau sont de réduire les coûts de fabrication, les émissions de CO2, et les eaux
usées rejetées à l'environnement.
Un très bon exemple de représentation de procédés impliquant de grandes quantités d’eau et de
vapeur est celui de la production de pâte et du papier (P & P). Ces procédés se caractérisent
comme l'un des grands consommateurs d'énergie et se classent en quatrième place des plus gros
consommateurs d'énergie entre les différents secteurs d'activité industrielle (Chen et al., 2012;
Persson and Berntsson, 2009). L'eau est également largement utilisée dans les procédés P & P
comme une utilité, comme de la vapeur ou un agent de transfert de masse, tel que le lavage, la
dilution de la pâte, le nettoyage, le refroidissement des pompes, et plusieurs autres (Bryant et al.,
1996). Ces hautes consommations d'eau et d'énergie augmentent le coût du produit final. La
hausse des coûts, la concurrence mondiale croissante, et la baisse de la demande de pâte (RISI,
2010) conduisent à la fermeture des usines non rentables dans les zones en région où les usines
sont souvent situées. Afin que l'industrie puisse soutenir son avantage concurrentiel sur le
marché, elle doit réduire ses coûts de fabrication et, en particulier, ses coûts énergétiques, qui
sont estimés à typiquement 30% (Mateos-Espejel et al., 2011c) du total des coûts de fabrication.

xiii
La bioraffinerie forestière consiste en la conversion de la biomasse vers un large spectre de
produits par diverses voies d'extraction et de transformation. Le concept d'intégration d’une
bioraffinerie dans une usine de pâte kraft existante offre l’opportunité à l'industrie papetière
d’augmenter sa rentabilité, d'améliorer le développement durable, et de rester compétitif en
produisant des produits à haute valeur ajoutée, tels que biocarburants, produits chimiques,
polymères et produits pharmaceutiques (Mabee et al., 2005; Thorp, 2005). Il est prévu que la
plupart des usines intègrent une bioraffinerie dans les limites des spécifications actuelles.
Cependant, cette intégration peut imposer des exigences supplémentaires sur le système des
utilités et une augmentation des coûts d'exploitation (par exemple, une capacité supplémentaire
pour le traitement des eaux usées) (CETC, 2003). Ainsi, les usines de pâte kraft devraient être
auto-suffisantes en termes d'énergie qui puisse être fournie à la bioraffinerie. Pour ces raisons,
l'industrie des P & P doit concentrer ses efforts sur l’amélioration de l'efficacité énergétique et,
par la suite, la réduction de la consommation d’énergie thermique et les émissions de gaz.
• Analyse comparative (Benchmarking)
L'étape préalable pour déterminer le potentiel d'économie d'énergie et d'eau est l'analyse
comparative (Mateos-Espejel et al., 2011d). Une étude comparative est une comparaison d'une
usine du point de vue de la consommation d'énergie et d'eau avec des usines concurrentes. Les
résultats de cette étude sont la force motrice de mise au point de stratégies d’économies d'énergie
et d’eau (CIPEC, 2008; Francis et al., 2006).
Une technique d'analyse comparative a été développée pour diagnostiquer l'inefficacité des
systèmes de vapeur et d'eau et identifier de façon préliminaire le potentiel d'amélioration de
l'efficacité énergétique et de l'eau. Cette technique consiste en trois étapes ; analyse comparative
avec la pratique actuelle, la comparaison de trois usines Kraft, et la synthèse. La consommation
de vapeur et d’eau des usines ont été comparées aux données de référence. Cette analyse a été
menée sur trois usines canadiennes Les trois usines ont ensuite été comparées en termes d'eau et
d'allocations de vapeur pour différents usages et aussi en termes des réseaux d’échangeur de
chaleur et d'eau pour donner une indication des similitudes et des différences. Les
caractéristiques avantageuses d'une usine donnée peuvent être utilisées pour proposer des
mesures d'économie de vapeur et d’eau pour une autre. Pour avoir des résultats plus précis, la
xiv
comparaison avec plus de cas est recommandée. Enfin, le potentiel d'économies d'eau et de
vapeur est résumé dans l'étape de synthèse.
Les résultats ont montré peu pour l’usine A, l' eau peut être réduite au lavage, à la machine à
pâte, et à la recaustification. Pour les deux lignes de l'usine B, l'eau peut être réduite à la machine
de la pâte et à la recaustification et pour la ligne 2, le lavage et la vapeur ont un potentiel
d'économie d'eau. Les principales sections dans laquelle l'eau peut être réduite pour l’usine C
sont le lavage et la mise en pâte mécanique. Pour toutes les usines, l'amélioration du réseau
d'échangeurs de chaleur pour l'eau et l'air peut entraîner une diminution ou l’élimination de la
consommation de vapeur pour produire de l'eau chaude et de l'air chaud pour les sections hors-
procédé. En outre, en plus de l’amélioration du système de récupération de la chaleur et d’eau à
température plus élevée à la ligne du procédé et du dégazeur, la consommation de vapeur peut
être réduite de manière significative.
• Analyse simultanée des réseaux énergétiques et d'eau (SEWNA : Simultaneous Energy and
Water Networks Analysis)
La technique de PI la plus commune qui a été utilisé pour l'amélioration de l'efficacité du réseau
d'eau est l'analyse de pincement massique de l'eau. Les analyses de pincement massique de l'eau
sont des techniques graphiques qui ont été construites de manière analogue à l'analyse de
pincement thermique (Dhole, 1998; Dhole et al., 1996; El-Halwagi et al., 2003; Wang and Smith,
1994). Avec la hausse du coût des combustibles fossiles et de l'énergie en général, la
conservation de l'eau et de l'énergie doit être réalisée simultanément afin d'assurer la durabilité et
réduire les coûts de production. Il y a eu plusieurs tentatives pour intégrer les analyses de
l'énergie et de l'eau (Feng et al., 2008; Leewongtanawit and Kim, 2009; Manan et al., 2009;
Savulescu et al., 2005b; Wan Alwi et al., 2011). Néanmoins, l’analyse de la configuration
existante pour la production d'eau chaude et chaude a été négligée, les contraintes physiques et
du procédé n'ayant pas été examinées attentivement. La plupart des procédés à base d'eau
nécessitent de l'eau non seulement en grande quantité et pureté, mais aussi avec une température
élevée (Cortés et al., 2011; Feng et al., 2009). En termes de température de l'approvisionnement
en eau pour différentes demandes, la température de l’eau et du filtrat acceptables, doit être
analysée avec soin et pas seulement en fonction des températures fixes d'alimentation comme

xv
une limitation pour la réutilisation du filtrat et l'utilisation de l'eau chaude ou tiède. La plupart
des techniques utilisées pour les cas génériques ont été en fait adaptées pour des problèmes de
petite taille. La qualité des données utilisées est l'un des défis majeurs pour l'analyse de l'eau. La
température acceptable et les concentrations de contaminants doivent être atteints par une
approche systématique. Chaque ensemble de données devrait tenir compte des caractéristiques de
chaque type de procédés, par exemple, la concentration de contaminant acceptable pour les puits
d'une usine de pâte kraft ne peut pas être utilisée pour une autre usine parce que chacune possède
ses propres caractéristiques. En ce sens, des directives systématiques pour extraire les données
pour l'analyse de l'eau devraient aussi être développées.
L’analyse simultanée des réseaux énergétiques et d'eau (SEWNA) a été développée dans ce
travail pour permettre la résolution des problèmes mentionnés ci-dessus. Un exemple générique a
été utilisé pour illustrer les cinq étapes de la technique. Dans la première étape, une nouvelle
approche est démontrée pour identifier le volume de contrôle pour l'extraction des données. Les
données requises comprennent les débits, les concentrations de contaminants et la température
de tous les puits de même que les sources et les niveaux de concentration des contaminants
acceptables pour chaque puits. Les critères pour soustraire systématiquement les effluents
inévitables des sources sont présentés. Dans la deuxième étape, le potentiel d'économie de
vapeur dans la ligne du procédé est déterminé et les contraintes de réutilisation et de
consommation d'eau sont évaluées. Dans la troisième étape, plusieurs principes et règles
heuristiques ont été établis pour la réutilisation de l'eau. La nouvelle analyse de l'énergie et de
l’eau a été développée et peut être effectuée sous forme de tableau ou graphique pour identifier
les mesures de l'eau en ce qui concerne la réduction de la vapeur. Les nouvelles courbes de
pincement Eau-Énergie graphique et courbes de pincement de l'énergie sont constituées des
concentrations de contaminants et des courbes de température en fonction du débit pour tous les
puits et les sources. Dans la quatrième étape, le réseau d'eau très chaude et chaude est analysé
afin de réduire la consommation d'eau enregistré à partir des sources d'origine. Les objectifs sont
d'éliminer la consommation de vapeur pour la production d'eau très chaude et chaude et
d'identifier les nouveaux niveaux de température de l'eau sur la base des courants existants des
échangeurs de chaleur du procédé. Enfin, une analyse économique est menée afin de calculer le
coût de la tuyauterie pour les nouvelles connexions de réutilisation de l'eau.

xvi
SEWNA a été appliquée dans trois usines canadiennes Kraft. Des économies substantielles
d’économie de vapeur et d’eau dans l'intervalle de 11-29 % et 24-54 % respectivement ont été
évaluées par de simples changements de conduites. L'utilisation de cette méthode montre donc
que les consommations d'eau et de vapeur peuvent être considérablement réduites. Les résultats
ont également confirmé que la réutilisation de l'eau peut être améliorée. La période de retour sur
investissement pour chacun des trois cas est court.
• Analyse de la performance des équipements (EPA : Equipment Performance Analysis)
Les techniques d'intégration des procédés sont fréquemment appliquées avec l'hypothèse que
tous les équipements et les services fonctionnent efficacement, mais ce n'est évidemment pas
toujours le cas. Par conséquent, la performance d'une pièce d'équipement ou d’un section en
termes d’eau et d’efficacité énergétique doit être soigneusement évaluée.
La technique d'analyse de performances des équipements (EPA) a été développée pour exécuter
efficacement cette tâche. La performance des équipements individuels et de sections d’usine a
été évaluée et analysée pour diagnostiquer les inefficacités thermiques et de l'eau dans les
différents procédés. Les causes et les solutions probables ont été identifiées pour caractériser et
possiblement éliminer les inefficacités.
La technique EPA a été appliquée à l'usine C et neuf projets d’amélioration probables ont été
proposés pour améliorer la performance des équipements et des services. La production de
vapeur dans les chaudières peut augmenter de 21% par rapport à la consommation de vapeur
actuelle de l'usine tandis que l'économie de vapeur globale peut être de 9 % de la consommation
actuelle de vapeur. L'économie totale d'eau et la réduction de la production d'effluents peuvent
aller jusqu’à 11% et 7 % de la consommation actuelle de l'eau et la production d'effluents,
respectivement. Les résultats de cette technique pourraient être un incitatif pour une analyse en
profondeur et de la performance des équipements sur tout le site.

xvii
• Rétro-installation de la conception du réseau HEX (R-HEN Retrofitting – Heat Exchanger
Network)
La technique la plus courante de d'intégration de procédés (PI) qui a été largement utilisée dans
différents secteurs pour améliorer l'efficacité énergétique est l'analyse de pincement thermique.
L'analyse par pincement est le principal outil pour la rétro-installation de la conception du réseau
d’échangeurs de chaleur (HEX). Néanmoins, elle ne permet pas d’étudier en profondeur les
interactions entre l'énergie et l'eau dans les procédés. De plus, il existe plusieurs contraintes dans
le procédé qui peuvent causer des difficultés pour améliorer les économies de vapeur. Ces
contraintes sont divisés en deux catégories : les contraintes physiques et les contraintes de
procédés. Ainsi, l'identification et l'analyse de ces contraintes constituent une tâche essentielle
avant d'entreprendre tout effort visant à moderniser la conception du réseau HEX (HEN) de
conception afin qu’il soit proche de l'optimum. L'analyse par pincement fournit les informations
cibles, comme l’exigence de chauffage minimum (Minimum Heating Requirement) et l'exigence
de refroidissement minimum (Minimum Cooling Requirement), et nécessite un effort significatif
pour l'extraction des données, l’analyse des données, et la construction des courbes composites.
En outre, la cible MHR pour les procédés à base d'eau n'est pas toujours réaliste et est parfois
loin de ce qui peut être réalisé dans la pratique. Par exemple, Mateos et al. (2011c) estime une
économie de vapeur de 29 % en utilisant des courbes de pincement pour une usine de pâte kraft,
mais l'économie de vapeur finale qui a été réalisée était de 13%, ce qui est moins de la moitié de
l'estimation. Cette différence est principalement due aux contraintes physiques et du procédé et
aussi par le fait que toutes les règles de pincement pour la rétro-installation de la conception du
HEN n’ont pas pu être respectées. En d’autres mots, les règles de pincement ne peuvent pas
répondre à toutes les caractéristiques spécifiques de conception d’un HEN. Puisque la rétro-
installation de la conception d’un HEN nécessite beaucoup d'efforts et de temps, le ciblage
approprié des économies d'énergie est important. En outre, les points de mélange non - isotherme
(Non Isothermal Mixing) devraient être considérés à la conception du HEN, cependant, dans
l'analyse par pincement ils ne sont pas pris en compte. Les règles de pincement de la conception
du HEN ne sont pas suffisantes et de nouvelles règles et des directives pratiques sont nécessaires.
Par conséquent, une nouvelle technique (R-HEN) a été développée pour surmonter ces
difficultés.

xviii
La technique de rétro-installation de la conception du réseau HEX (R- HEN) qui a été
développée se compose de quatre étapes successives. Dans les deux premières étapes, semblables
à l'étape 2 de SEWNA, les contraintes physiques et du procédé, notamment les contraintes de
température dures et molles des opérations unitaires les plus sensibles sont analysées. Une
nouvelle approche a été développée pour offrir un ciblage réaliste pour l'économie de vapeur en
fonction des contraintes et de la classification des utilisateurs de vapeur. Les courants existants
des HEX du procédé sont évalués. Les courants de rejets ont été classés selon le niveau de
corrosion haute et basse pour exploiter efficacement leur niveau d’échange thermique. Un nouvel
algorithme a été développé pour la rétro-installation de la conception du HEN basée sur
l'estimation-correction. Le HEN est conçu selon cinq heuristiques et règles pratiques.
La technique R- HEN a été appliquée sur l’usine C. Les résultats ont montré qu’une surface
additionnelle de 9850 m2 pour les HEX est requise pour réaliser une économie de 42,1 MW
(38%) de la vapeur. Cette technique a également été comparée avec l'analyse par pincement. Les
résultats ont montré un ciblage plus précis et une plus grande économie de vapeur par R- HEN
en comparaison de l'analyse par pincement.
• Conversion de l'énergie et valorisation (upgrading)
L’industrie des P & P est considérée comme ayant la plus grande capacité de cogénération
industrielle au Canada. Cependant, il y a encore un potentiel additionnel de production
d'électricité si la consommation totale de vapeur diminue (CIPEC, 2008; Mateos-Espejel et al.,
2010d). Les pompes à chaleur constituent d'autres outils d'intégration des procédés pour
récupérer davantage de chaleur et de vapeur par récupération de chaleur de bas niveau. Ces
dispositifs sont installés pour améliorer la chaleur à faible potentiel à basse température à des
températures élevées à haut potentiel et économiser davantage de vapeur (Bakhtiari et al., 2010a,
b; Costa et al., 2009; Costa et al., 2004). La tri-génération est une combinaison de la
cogénération et d'une pompe à chaleur. Il a été évalué que la tri-génération peut réduire la
demande de chaleur nette du procédé et fournir de l'électricité au réseau (Marinova et al., 2007).
Néanmoins, l'investissement nécessaire pour cette combinaison est élevé et doit être
soigneusement examiné pour déterminer s'il est rentable ou non.

xix
• Analyse de l’amélioration de la vapeur et d'eau et intégration (SWAEI : Simultaneous Water
Analysis Enhancement and Integration)
Mateos et al. (2010d, 2011c) ont développé l'analyse de l'interaction de systèmes qui se compose
de six étapes principales : la récupération de chaleur interne, la réutilisation de l'eau, l'élimination
de points de mélange non-isotherme, la récupération des condensats, l'énergie valorisée par une
pompe à chaleur, et la conversion d'énergie par turbine. Ils ont utilisé différents outils
d'intégration des procédés tels que l'analyse de pincement thermique pour la récupération de la
chaleur interne et la valorisation de l'énergie, et de l'analyse par pincement massique de l'eau
pour la réutilisation de l'eau L'analyse de pincement thermique a été effectuée après l'application
de chaque étape pour évaluer l'effet sur les courbes de pincement et la conception du réseau
HEX. Cette méthode exige beaucoup d'efforts pour développer le réseau HEX. Cependant, de
nombreuses mesures peuvent être facilement combinées. Par exemple, la réutilisation de l'eau, la
récupération des condensats, et une partie de l'élimination de points de mélange NIM, et la
récupération de chaleur interne ont été obtenues en appliquant la méthode SEWNA.
L’élimination des points de mélange NIM restants et la récupération de chaleur interne ont
également été réalisées par R - HEN. Mateos et al. (2011c) a également présenté une
méthodologie unifiée pour proposer des lignes directrices pour mettre en œuvre les projets
identifiés pour une usine Kraft Canada compte tenu de leurs contraintes techniques et
économiques.
La méthodologie d’analyse de l’amélioration de la vapeur et d'eau et intégration (SWAEI) a été
développée pour combiner différentes techniques d'intégration des procédés pour atteindre le
deuxième objectif principal de cette thèse. La méthodologie consiste en six étapes successives.
Dans la première étape, le modèle de simulation du cas de base est développé et utilisé en tant
que source de données pour les analyses. Dans la deuxième étape, une pré-analyse comparative
est menée afin de déterminer les zones d'inefficacité. Le coeur de la méthodologie est
l'identification des projets d'amélioration de la consommation d'énergie et d'eau en appliquant
séquentiellement SEWNA, l'EPA et R-HEN. L'application séquentielle de ces techniques a
conduit à des résultats nettement supérieurs d'économie de vapeur que si elles auraient été
appliquées individuellement. Cette application séquentielle permet de proposer sur des projets
complémentaires pour maximiser les économies de vapeur. Dans la quatrième étape, la vapeur en

xx
excès est utilisée pour réduire ou éliminer la consommation d'énergie fossile. Le reste de la
vapeur en excès pourrait être vendu ou utilisé pour produire de l'électricité par cogénération ou
par un système de tri-génération. Les aspects économiques de ces alternatives sont évalués et
l’aspect le plus prometteur est sélectionné pour la mise en œuvre. Dans la cinquième étape, les
projets identifiés sont priorisés et la stratégie de mise en œuvre est proposée en deux phases.
Dans la première phase, les projets menant d’abord à la réduction des combustibles fossiles ou à
leur élimination sont appliqués, et lors de la deuxième phase, les autres projets pouvant être mis
en œuvre pour économiser plus de vapeur. Enfin, la post-évaluation comparative est effectuée
pour identifier les zones qui ont été améliorées de façon significative en termes d’économies de
vapeur et d’eau.
La méthodologie SWAEI a été appliquée sur les trois usines canadiennes Kraft et a permis
d’estimer des réductions de 27-66 % de vapeur d'eau et de 24-58 % pour l’eau. La stratégie de
mise en œuvre prévoit la planification pour obtenir un procédé consommant beaucoup moins de
vapeur, d'eau, de combustibles fossiles, et avec un impact environnemental moins négatif par de
plus faibles émissions de CO2 et moins d'eaux usées, conduisant à des produits plus écologiques
et plus durables , et avec un bénéfice net finalement plus élevé. En appliquant la méthodologie
SWAEI sur ces usines, les prépare comme des récepteurs optimisés au niveau énergétique pour
l'intégration d’une bioraffinerie durable suite à une planification bien définie.
La méthode n'est pas spécifique à certains procédés à base d'eau. Cependant, chaque procédé
possède ses propres caractéristiques et la définition des différentes contraintes doit être effectuée
individuellement.

xxi
TABLE OF CONTENTSDEDICATION................................................................................................................................................. iii
ACKNOWLEDGEMENTS................................................................................................................................ iv
RÉSUMÉ......................................................................................................................................................... v
ABSTRACT..................................................................................................................................................... ix
CONDENSÉ EN FRANÇAIS............................................................................................................................ xii
LIST OF TABLES.........................................................................................................................................xxvii
LIST OF FIGURES.........................................................................................................................................xxx
NOMENCLATURE..................................................................................................................................... xxxvi
LIST OF APPENDICES ............................................................................................................................. xxxviii
1 CHAPTER 1: INTRODUCTION .................................................................................................................1
1.1 Justification of Project...................................................................................................................1
1.2 Context of the project...................................................................................................................4
1.3 General Objective .........................................................................................................................5
1.4 Structure and Organization........................................................................................................... 5
2 CHAPTER 2: WATER-BASED PROCESS AND KRAFT MILL ....................................................................... 8
2.1 Water-based Process ....................................................................................................................8
2.2 Kraft Pulp and Paper Mill ..............................................................................................................8
2.2.1 Digesting................................................................................................................................9
2.2.2 Washing...............................................................................................................................10
2.2.3 Bleaching and Chemical Preparation ..................................................................................10
2.2.4 Pulp/Paper Machine ...........................................................................................................11
2.2.5 Recovery loop .....................................................................................................................11
2.3 Current Status of Pulp &Paper....................................................................................................12
3 CHAPTER 3: LITERATURE REVIEW .......................................................................................................14
3.1 Simulation ...................................................................................................................................14
3.2 Benchmarking .............................................................................................................................14
3.3 Internal Heat Recovery ...............................................................................................................15
3.3.1 Pinch Analysis ....................................................................................................................15
3.3.2 Application of Pinch Analysis in P&P................................................................................17
3.3.3 Retrofit HEX network design and challenges .....................................................................19
3.3.4 Synthesis of Internal Heat Recovery...................................................................................21

xxii
3.4 Water Reutilization .....................................................................................................................22
3.4.1 Water Analysis ....................................................................................................................23
3.4.2 Water and energy analysis..................................................................................................27
3.4.3 Water and energy in non-isothermal mixing points ...........................................................31
3.4.4 Water and energy in condensate recovery.........................................................................32
3.4.5 Synthesis of water and energy analyses .............................................................................32
3.4.6 Water reutilization in Pulp & Paper ....................................................................................34
3.5 Equipment Performance Analysis ...............................................................................................36
3.6 Energy Upgrading........................................................................................................................38
3.7 Energy Conversion ......................................................................................................................40
3.8 Trigeneration...............................................................................................................................41
3.9 Selling Steam to the Local District ..............................................................................................42
3.10 Combination of Different Process Integration Techniques ........................................................43
3.11 Synthesis of the literature...........................................................................................................43
3.12 Specific Objectives ......................................................................................................................44
3.13 Overall Methodology Approach..................................................................................................45
3.14 Case Studies ................................................................................................................................46
4 CHAPTER 4: BENCHMARKING AS A MEANS TO IDENTIFY WATER AND STEAM SAVINGS ..................50
4.1 Benchmarking Technique ...........................................................................................................50
4.1.1 Step 1: Benchmarking with current practices.....................................................................51
4.1.2 Step 2: Comparison of case studies ....................................................................................51
4.1.3 Step 3: Synthesis .................................................................................................................52
4.2 Results.........................................................................................................................................52
4.2.1 Step 1: Benchmarking with current practices.....................................................................52
4.2.2 Step 2: Comparison of case studies ....................................................................................58
4.2.3 Step 3: Synthesis .................................................................................................................68
4.3 Conclusion...................................................................................................................................69
5 CHAPTER 5: SIMULTANEOUS ENERGY AND WATER NETWORKS ANALAYSIS .....................................70
5.1 Part I: Development of simultaneous energy and water networks analysis ..............................70
5.2 Case Study: Generic Example......................................................................................................72
5.3 Simultaneous Energy and Water Networks Analysis (SEWNA) ..................................................75
5.3.1 Principles.............................................................................................................................75
xxiii
5.3.2 Structure .............................................................................................................................78
5.4 Conclusion of Part I .....................................................................................................................94
5.5 Part II: Application of simultaneous energy and water networks analysis (SEWNA) for Kraftprocesses.................................................................................................................................................96
5.6 Results.........................................................................................................................................96
5.6.1 Step 1: Data extraction .......................................................................................................96
5.6.2 Step 2: Constraint analysis ................................................................................................101
5.6.3 Step 3: Water and energy analysis....................................................................................102
5.6.4 Step 4: Hot and warm water network analysis.................................................................104
5.6.5 Step 5: Economic analysis .................................................................................................109
5.7 Summary of the Application in Two Other Canadian Kraft Mills (A and B) ..............................111
5.7.1 Benchmarking of water and steam consumption.............................................................113
5.8 Conclusion.................................................................................................................................114
6 CHAPTER 6: EQUIPMENT PERFORMANCE ANALYSIS TECHNIQUE....................................................116
6.1 Nomenclature of This Chapter..................................................................................................116
6.2 Equipment Performance Analysis Technique ...........................................................................116
6.2.1 Step 1: Identification.........................................................................................................117
6.2.2 Step 2: Diagnosis ...............................................................................................................121
6.2.3 Step 3: Performance improvement ..................................................................................121
6.2.4 Step 4: Economic analysis .................................................................................................121
6.3 Results.......................................................................................................................................122
6.3.1 Digesting department .......................................................................................................122
6.3.2 Washing department ........................................................................................................124
6.3.3 Bleaching and chemical preparation departments...........................................................126
6.3.4 Paper machine department ..............................................................................................128
6.3.5 Evaporation department...................................................................................................129
6.3.6 Steam plant .......................................................................................................................129
6.3.7 Recausticizing department................................................................................................135
6.3.8 Synthesis of the Performance Improvement Projects ......................................................136
6.3.9 Economic Analysis.............................................................................................................138
6.4 Conclusion.................................................................................................................................140
7 CHAPTER 7: RETROFIT HEX NETWORK DESIGN TECHNIQUE ............................................................142

xxiv
7.1 Retrofit HEX Network Design (R-HEN) ..................................................................................142
7.1.1 Step 1: Identification of saving potential ..........................................................................143
7.1.2 Step 2: Assessment of waste heat and existing HEXs .......................................................149
7.1.3 Step 3: HEX network design.............................................................................................150
7.1.4 Step 4: Economic analysis .................................................................................................155
7.2 Result ........................................................................................................................................156
7.2.1 Step 1: Identification of saving potential ..........................................................................156
7.2.2 Step 2: Assessment of waste heat and existing HEXs .......................................................162
7.2.3 Step 3: HEX network design.............................................................................................165
7.2.4 Step 4: Economic analysis ................................................................................................175
7.3 Pinch Analysis............................................................................................................................177
7.3.1 Results of Application of Pinch Analysis .........................................................................177
7.4 Comparison of R-HEN with Pinch Analysis................................................................................182
7.5 Conclusion ................................................................................................................................185
8 CAHPTER 8: STEAM AND WATER ANALYSIS ENHANCEMENT AND INTEGRATION METHODOLOGY 187
8.1 Steam and Water Analysis Enhancement and Integration (SWAEI) Methodology ..................187
8.1.1 Step 1: Data Base and Process Simulation........................................................................188
8.1.2 Step 2: Benchmarking Current Performance ....................................................................189
8.1.3 Step 3: Identification of Energy and Water Projects........................................................190
8.1.4 Step 4: Energy Upgrading and Conversion........................................................................191
8.1.5 Step 5: Implementation Strategy......................................................................................192
8.1.6 Step 6: Post-benchmarking ...............................................................................................192
Results...................................................................................................................................................192
8.2 Mill A .........................................................................................................................................192
8.2.1 Step 2: Pre-benchmarking with current practice..............................................................192
8.2.2 Changes in Water Reutilization Network (Step 3-1: SEWNA)...........................................194
8.2.3 Synthesis of the performance improvement projects (Step 3-2: EPA).............................198
8.2.4 HEX network changes (Step 3-3: R-HEN) ..........................................................................198
8.2.5 Summary of improvements ..............................................................................................203
8.2.6 Step 4: Energy Upgrading and Conversion........................................................................204
8.2.7 Economic analysis of the two alternatives .......................................................................206
8.2.8 Step 5: Implementation strategy ......................................................................................207

xxv
8.2.9 Step 6: Post benchmarking ...............................................................................................208
8.3 Mill B .........................................................................................................................................209
8.3.1 Step 2: Pre-benchmarking with current practice..............................................................209
8.3.2 Changes in Water Reutilization Network (Step 3-1: SEWNA)...........................................210
8.3.3 Synthesis of the performance improvement projects (Step 3-2: EPA).............................218
8.3.4 HEX network changes (Step 3-3: R-HEN) ..........................................................................219
8.3.5 Summary of improvements ..............................................................................................227
8.3.6 Step 4: Energy Upgrading, Conversion, and Selling Steam ...............................................228
8.3.7 Economic analysis of four alternatives .............................................................................231
8.3.8 Step 5: Implementation strategy ......................................................................................232
8.3.9 Step 6: Post benchmarking ...............................................................................................233
8.4 Mill C .........................................................................................................................................233
8.4.1 Step 2: Pre-benchmarking with current practices ............................................................233
8.4.2 Changes in Water Reutilization Network (Step 3-1: SEWNA)...........................................235
8.4.3 Synthesis of the performance improvement projects (Step 3-2: EPA).............................240
8.4.4 HEX network changes (Step 3-3: R-HEN) ..........................................................................240
8.4.5 Summary of improvements ..............................................................................................245
8.4.6 Step 4: Energy Upgrading and Conversion........................................................................246
8.4.7 Step 5: Implementation strategy ......................................................................................249
8.4.8 Step 6: Post benchmarking ...............................................................................................250
8.4.9 Comparison of stand alone techniques and SWAEI methodology ...................................251
8.5 Comparison of the Results of Three Kraft Mills ........................................................................252
8.6 Sensitivity Analysis over Main Parameters of Selected Alternatives........................................254
8.6.1 Effects of summer condition.............................................................................................254
8.6.2 Effects of cost factors........................................................................................................255
8.7 Conclusion.................................................................................................................................257
GENERAL DISCUSSION...............................................................................................................................259
Benchmarking Technique .............................................................................................................259
Simultaneous Energy and Water Networks Analysis (SEWNA) ....................................................259
Equipment Performance Analysis (EPA) .......................................................................................260
Retrofit HEX Network Design (R-HEN) ..........................................................................................260

xxvi
Steam and Water Analysis Enhancement and Integration (SWAEI) Methodology ......................261
CONCLUSIONS AND RECOMMENDATIONS...............................................................................................262
Original Contribution ....................................................................................................................264
Recommendations for Future Research .......................................................................................265
REFERENCES..............................................................................................................................................267
APPENDICES ..............................................................................................................................................280

xxvii
LIST OF TABLESTable 3-1 - Main characteristics of the three mills .............................................................................................48Table 4-1 -Specific characteristics of HEX network of three mills ....................................................................64Table 4-2 – Specific characteristics of water network of three mills..................................................................66Table 4-3 – Specific characteristics of water reuse in bleaching of three mills ..................................................68Table 4-4 – Summary of potential for water saving in three mills .....................................................................69Table 4-5 – Summary of potential for steam saving in three mills .....................................................................69Table 5-1 – Main characteristics of generic example .........................................................................................75Table 5-2 – Extracted data for all sinks in ascending order of contaminant concentration ................................80Table 5-3 – Extracted data in ascending order of contaminant concentration for (a) overall sources, (b)inevitable effluents, and (c) final sources after excluding the inevitable effluents .............................................80Table 5-4 – Tabulated Water & Energy Pinch before identification of water projects for generic example (Fig.5-2)......................................................................................................................................................................85Table 5-5 - Tabulated Water & Energy Pinch after identification of water projects for generic example (Fig.5-2)......................................................................................................................................................................86Table 5-6 – (a) The final changes in flowrate of existing connections and (b) new connections .......................91Table 5-7 – Total water and steam savings and effluent reduction for generic example (Fig. 5-2)....................93Table 5-8 – Capital cost for the piping of three new connections of generic example (Fig. 5-2b).....................93Table 5-9 – List of all sinks in ascending order of contaminant concentration ................................................100Table 5-10 – List of all sources in ascending order of contaminant concentration...........................................101Table 5-11 – List of all inevitable effluents......................................................................................................101Table 5-12 – Acceptable temperature of filtrate and water to different types of washer..................................102Table 5-13 – Existing area and current and final heat load of process and steam HEXs..................................107Table 5-14 – Summary of steam saving at water network and steam injections in process line ...................... 108Table 5-15 – List of new connections and the capital cost for purchasing, insulation, and installation of newpipes..................................................................................................................................................................110Table 5-16 - The economic benefits of savings from different resources – Mill C ..........................................110Table 6-1 – Summary of the performance improvement projects ....................................................................137Table 6-2 – Summary of capital investment and operating costs of the performance improvement projects ..139Table 6-3 - Economic analysis of process improvement projects at Kraft mill after the reduction of natural gasconsumption...................................................................................................................................................... 140Table 7-1 - The overall heat transfer coefficient for different states ................................................................ 155Table 7-2 – Acceptable temperature of water to different washers of the mill.................................................158Table 7-3 – The potential for steam reduction and final steam consumption after the HEX network design forall steam users of the mill .................................................................................................................................161Table 7-4 – Targeting and final steam savings by means of R-HEN................................................................ 162Table 7-5 – Mixed Cp for exhaust air of dryer at different levels of humidity and temperature intervals(information extracted from work of (Söderman and Pettersson, 2003)) ......................................................... 163Table 7-6 – Mixed Cp of 0.110 kg water/ kg dried air humidity of dryer exhaust air of the mill at differenttemperature intervals.........................................................................................................................................163Table 7-7 - The extracted data for HEX network design ..................................................................................170Table 7-8 – New HEXs to be purchased and existing HEXs to be enlarged ....................................................176Table 7-9 – The economic analysis of steam saving and new area required ....................................................176Table 7-10 - The extracted data for Pinch Analysis.......................................................................................... 178Table 7-11 – Comparison between R-HEN and Pinch Analysis from the approach perspective .....................183

xxviii
Table 8-1 - The steam consumption of the current situation, after applying SEWNA, EPA and also thepotential for steam reduction using R-HEN and final steam consumption after HEX network design for allsteam users of the mill – Mill A........................................................................................................................ 199Table 8-2 - The aggregation of all types of steam users for the current situation after applying NSWEA andEPA plus the targeting and final steam saving by means of R-HEN – Mill A .................................................200Table 8-3 – Summary of improvements after applying SWAEI methodology – Mill A..................................203Table 8-4 - The economic benefit of savings from different resources – Mill A..............................................207Table 8-5 - Strategy to implement Alt. 1 – Mill A............................................................................................ 208Table 8-6 - Summary of the performance improvement projects – Mill B....................................................... 218Table 8-7 - The steam consumption of current situation, after applying SEWNA, EPA and also the potentialfor steam reduction using R-HEN and final steam consumption after HEX network design for all steam usersof the mill – Mill B, Line 1 ............................................................................................................................... 220Table 8-8 - The steam consumption of current situation, after applying SEWNA, EPA and also the potentialfor steam reduction using R-HEN and final steam consumption after HEX network design for all steam usersof the mill – Mill B, Line 2 ............................................................................................................................... 221Table 8-9 - The aggregation of all types of steam users for current situation, after applying NSWEA and EPAand the targeting and final steam saving by means of R-HEN – Mill B........................................................... 222Table 8-10 - Summary of improvements applying three process integration techniques in sequence for Lines 1and 2 and the whole mill – Mill B ....................................................................................................................228Table 8-11 - The economic benefit of savings from different resources – Mill B............................................232Table 8-12 - Strategy to implement Alt. 1 and 3 – Mill B ................................................................................233Table 8-13 – Summary of the performance improvement projects – Mill C....................................................240Table 8-14 – The steam consumption of current situation, after applying SEWNA, EPA and also the potentialfor steam reduction using R-HEN and final steam consumption after HEX network design for all steam usersof the mill – Mill C ...........................................................................................................................................241Table 8-15 – The aggregation of all types of steam users for the current situation, after applying NSWEA andEPA and the targeting and final of steam saving by means of R-HEN – Mill C..............................................242Table 8-16 – Summary of improvements applying three process integration techniques in sequence – Mill C..........................................................................................................................................................................246Table 8-17 –The economic benefit of savings from different resources – Mill C ............................................249Table 8-18 - Strategy to implement Alt. 1 ........................................................................................................250Table 8-19 - Scenarios for sensitivity analysis over cost factors ......................................................................255Table 0-1 - Existing Water HEX network – Mill C (for Fig. 5-16) ..................................................................280Table 0-2 - Final Water HEX network- After Applying SEWNA – Mill C (for Fig. 5-16) ............................. 281Table 0-3 - Existing HEX network – Mill C (for Fig. 7-14 and Fig. 7-15) ...................................................... 282Table 0-4 - Final HEX network- After Applying R-HEN – Mill C (for Fig. 7-14 and Fig. 7-15)....................283Table 0-5 - (a) The new HEXs that should be purchased and (b) the existing HEXs that should be enlarged –After applying R- HEN - Mill C (for Fig. 7-14 and Fig. 7-15)........................................................................284Table 0-6 - Existing HEX network – Mill C (for Fig. 7-17 and Fig. 7-18) ...................................................... 285Table 0-7 - Final HEX network- After applying Pinch Analysis – Mill C (for Fig. 7-17 and Fig. 7-18) .........286Table 0-8 - (a) The new HEXs that should be purchased and (b) the existing HEXs that should be enlarged –After applying Pinch Analysis - Mill C (for Fig. 7-17 and Fig. 7-18) ............................................................. 287Table 0-9 - The extracted data for HEX network design – Mill C (for Fig. 8-31 and Fig. 8-32) .....................289Table 0-10 - Existing HEX network – Mill C (for Fig. 8-31 and Fig. 8-32) ....................................................290Table 0-11 - Final HEX network – Mill C (for Fig. 8-31 and Fig. 8-32).......................................................... 291

xxix
Table 0-12 - (a) The new HEXs that should be purchased and (b) the existing HEXs that should be enlarged –Mill C (for Fig. 8-31 and Fig. 8-32)..................................................................................................................293Table 0-13 - List of all sinks in ascending order of contaminant concentration – Mill A (for Fig. 8-4) ..........294Table 0-14 - List of all sources in ascending order of contaminant concentration – Mill A (for Fig. 8-4).......294Table 0-15 - List of all inevitable effluents – Mill A (for Fig. 8-4) ..................................................................295Table 0-16 - List of new connections and the capital cost for purchasing, insulation, and installation of newpipes – Mill A (for Fig. 8-5, Fig. 8-6, and Fig. 8-7) ......................................................................................... 295Table 0-17 – Mixed Cp of 0.163 kg water/ kg dried air humidity of dryer #1 and 0.127 kg water/ kg dried airhumidity of dryer #2 exhaust air of the mill at different temperature intervals – Mill A (for Fig. 8-8 and Fig.8-9)....................................................................................................................................................................296Table 0-18 - The extracted data for HEX network design – Mill A (for Fig. 8-8 and Fig. 8-9) ....................... 296Table 0-19 - Existing HEX network – Mill A (for Fig. 8-8 and Fig. 8-9) ........................................................ 297Table 0-20 - Final HEX network – Mill A (for Fig. 8-8 and Fig. 8-9) ............................................................. 298Table 0-21 - (a) The new HEXs that should be purchased and (b) the existing HEXs that should be enlarged –Mill A (for Fig. 8-8 and Fig. 8-9) .....................................................................................................................300Table 0-22 - List of all sinks in ascending order of contaminant concentration – Mill B, Line 1 (for Fig. 8-13)..........................................................................................................................................................................301Table 0-23 - List of all sources in ascending order of contaminant concentration – Mill B, Line 1 (for Fig.8-13)..................................................................................................................................................................301Table 0-24 - List of all inevitable effluents – Mill B, Line 1 (for Fig. 8-13) ....................................................302Table 0-25 - List of new connections and the capital cost for purchasing, insulation, and installation of newpipes – Mill B, Line 1 (for Fig. 8-15, Fig. 8-16, and Fig. 8-17) ......................................................................303Table 0-26 - List of all sinks in ascending order of contaminant concentration – Mill B, Line 2 (for Fig. 8-14)..........................................................................................................................................................................304Table 0-27 - List of all sources in ascending order of contaminant concentration – Mill B, Line 2 (for Fig.8-14)..................................................................................................................................................................304Table 0-28 - List of all inevitable effluents – Mill B, Line 2 (for Fig. 8-14) ....................................................305Table 0-29 - List of new connections and the capital cost for purchasing, insulation, and installation of newpipes – Mill B, Line 2 (for Fig. 8-18, Fig. 8-19, and Fig. 8-20) ......................................................................305Table 0-30 – Mixed Cp of 0.333 kg water/ kg dried air humidity of dryer exhaust air of the Line 1 of mill B atdifferent temperature intervals (for Fig. 8-21, Fig. 8-22, and Fig. 8-23) .......................................................... 306Table 0-31 – Mixed Cp of 0.358 kg water/ kg dried air humidity of dryer exhaust air of the Line 2 of mill B atdifferent temperature intervals (for Fig. 8-21, Fig. 8-22, and Fig. 8-23) .......................................................... 306Table 0-32 - The extracted data for HEX network design – Whole Mill B (for Fig. 8-21, Fig. 8-22, and Fig.8-23)..................................................................................................................................................................306Table 0-33 - Existing HEX network – Whole Mill B (for Fig. 8-21, Fig. 8-22, and Fig. 8-23) ....................... 307Table 0-34 - Final HEX network – Whole Mill B (for Fig. 8-21, Fig. 8-22, and Fig. 8-23) ........................... 309Table 0-35 - (a) The new HEXs that should be purchased and (b) the existing HEXs that should be enlarged –Whole Mill B (for Fig. 8-21, Fig. 8-22, and Fig. 8-23) ....................................................................................311Table 0-36 - Thermal and mechanical efficiencies of turbines in three mills (for Fig. 8-10, Fig. 8-24, and Fig.8-33)..................................................................................................................................................................312

xxx
LIST OF FIGURESFig. 2-1– Simplified diagram of the Kraft process ...............................................................................................8Fig. 2-2 - Simple schematic of continuous digesting............................................................................................9Fig. 2-3 - Simple schematic of the washing department.....................................................................................10Fig. 2-4 - Simple schematic of the bleaching department...................................................................................10Fig. 2-5 - Simple schematic of the pulp/paper machine......................................................................................11Fig. 2-6 - Simple schematic of the recovery loop ...............................................................................................11Fig. 2-7 - Canadian P&P production (Bogdanski, 2011) ....................................................................................12Fig. 3-1 – Pinch Curves ......................................................................................................................................16Fig. 3-2 - Grand composite curve (GCC) and utility targeting ...........................................................................17Fig. 3-3 – Simple schematic of the water-based process and the interaction between water and steam (PB:power boiler).......................................................................................................................................................23Fig. 3-4 – Limiting composite curves (concentration vs. contaminant mass load of sinks) of Wang & Smith(1994)..................................................................................................................................................................25Fig. 3-5 – Concentration versus flowrate of all sinks and sources of Dhole (1998) ...........................................26Fig. 3-6 – Mass load versus flowrate of all sinks and sources of El-Halwagi et al. (2003) ................................26Fig. 3-7 - Direct/indirect heat recovery to design the heat exchanger network and non-isothermal mixing ofSavulescu et al. (2002)........................................................................................................................................28Fig. 3-8 - Superimposed mass and energy curves (SMEC) of Wan Alwi et al. (2011) ......................................30Fig. 3-9 - (a) vapor recompression heat pump (VRHP); (b) absorption heat pump (AHP) (Bakhtiari et al.,2010a) .................................................................................................................................................................39Fig. 3-10 - AHP representations in H2OeLiBr phase diagram (Bakhtiari et al., 2010a) ....................................39Fig. 3-11 - Appropriate positioning of an AHP (Bakhtiari et al., 2010a) ...........................................................40Fig. 3-12 - Schematic of the steam turbine and AHP - trigeneration unit (Marinova et al., 2007).....................42Fig. 3-13 - System interaction analysis (Mateos-Espejel et al., 2010d)..............................................................43Fig. 3-14 – Overall methodology........................................................................................................................45Fig. 3-15 - Simplified diagram of the three studied Kraft mills – the area between the dashed-dotted lines aresimilarities...........................................................................................................................................................47Fig. 4-1 -Steps of benchmarking methodology...................................................................................................50Fig. 4-2 -Steam consumption of main department and complete mill – Mill A (Dissolving Kraft pulp & batchdigester) ..............................................................................................................................................................53Fig. 4-3 - Steam consumption of main department and complete mill – Mill B (Kraft paper pulp & continuousdigester) ..............................................................................................................................................................54Fig. 4-4 - Steam consumption of main department and complete mill – Mill C (Kraft paper & continuousdigester) ..............................................................................................................................................................55Fig. 4-5 - (a) Water consumption and (b) effluent production of Mill A............................................................56Fig. 4-6 - (a) Water consumption and (b) effluent production of Mill B............................................................57Fig. 4-7 - (a) Water consumption and (b) effluent production of Mill C............................................................58Fig. 4-8 - Allocation of water consumption for different departments (WS: washing, BE: bleaching, PM:pulp/paper machine, ST: steam plant, RE: recausticizing, CH: chemical preparation, DG: digesting, EV:evaporation) ........................................................................................................................................................60Fig. 4-9 - Allocation of effluent production from different departments (WS: washing, BE: bleaching, PM:pulp/paper machine, ST: steam plant, RE: recausticizing, CH: chemical preparation, DG: digesting, EV:evaporation) ........................................................................................................................................................61Fig. 4-10 - Allocation of steam consumption to different usages. (Pr.: process, Evap.: evaporation, BL: blackliquor, Inj.: injection, Pre-hydr.: pre-hydrolysis) ................................................................................................63

xxxi
Fig. 5-1 - The evolutionary diagram process integration techniques to assess water and energy systems (——— line: derived by analogy with other techniques, —∙—∙—: combination of two techniques) .........................71Fig. 5-2 - Generic example under (a) current conditions and (b) after final modification; dashed red lines: newconnections; dotted-dashed green lines: removed connections (FT: filtrate tank, CH-X: chemicals X, CH-Y:chemicals Y, PL: process line, PL2: process line 2, ST: steam, Eff: effluent, WW: warm water) .....................74Fig. 5-3 – Simple schematic of the principle of simultaneous energy and water networks analysis (SEWNA) 76Fig. 5-4 - Simultaneous energy and water networks analysis (SEWNA) ...........................................................78Fig. 5-5 – Procedure for data extraction of units BC and DE of the generic example (Fig. 5-2) and constraintanalysis for water reutilization (WW: warm water, Eff: effluent, FT: filtrate tank) ...........................................80Fig. 5-6 – Simple schematic of rules to identify projects; (a) Rule 1, (b) Rule 2, (c) Rule 3, (d) Rule 4 ...........83Fig. 5-7 – Water & Energy Pinch Curves before identification of water projects for generic example (Fig. 5-2)............................................................................................................................................................................84Fig. 5-8 - Water & Energy Pinch Curves after identification of water projects for generic example (Fig. 5-2).86Fig. 5-9 – (a) Existing and (b) final hot and warm water network for generic example.....................................90Fig. 5-10 – Temperature of total water and filtrate to sinks under current conditions after applying step 3 and 4............................................................................................................................................................................92Fig. 5-11 - (a) current, (b) final water utilization and filtrate reutilization in digesting and washing departments– mill C; dotted red lines: new connections; dashed purple lines: the existing connections with change inflowrate (W: washer, FT: filtrate tank, Sep & Scr.: separators and screeners, Dig: digester, Deknot: deknotters,NCC-EV: non-clean condensate of evaporation, WW: warm water: FW: fresh water: HW: hot water, Eff.:effluent)...............................................................................................................................................................97Fig. 5-12 - (a) Current, (b) final water utilization and filtrate reutilization in bleaching and paper machinedepartments – mill C; dotted red lines: new connections; dashed purple lines: the existing connections withchange in flowrate (W: washer, R: reactor; M: steam mixer, FT: filtrate tank, Mec.-P: mechanical pulping,Cle.: cleaners, Scr.: screeners, PM: paper machine, Vac. P: vacuum pump, Fil: filter, WW: warm water: FW:fresh water: HW: hot water, CH-A: acidic chemicals, CH-B: base chemicals, ST: steam, Eff.: effluent) .........98Fig. 5-13 - (a) current, (b) final water utilization and filtrate reutilization in scrubber, recausticizing, chemicalpreparation, and steam plant department, - mill C; dotted red lines: new connections; dashed purple lines: theexisting connections with change in flowrate (Scrub: scrubber, BL-Con: black liquor concentrator, WeWT:weak wash tank, Dreg FT: dreg filter, LMF: lime mud filter, Clas: classifier, Scrub-Rec: scrubber ofrecauticizing, Ch. Prep.: chemical preparation, Mix-Ble: mixer-bleaching, Con. T: condensate tank, Con. T-Dig.: condensate tank of digesting, SC-Dig.: surface condenser of digesting, SC-EV.: surface condenser ofevaporation, WW: warm water: FW: fresh water: HW: hot water, CH-A: acidic chemicals, CH-B: basechemicals, ST: steam, Eff.: effluent)...................................................................................................................99Fig. 5-14 - Simple schematic of rules 5 and 6 to identify projects; Rule 5: Do not use the effluent fromrecausticizing at pulp line and Rule 6: Use the alkaline effluent of pulp line in recausticizing ....................... 103Fig. 5-15 – Water & Energy Pinch Curves; (a) before and (b) after identification of water projects...............104Fig. 5-16 – (a) Current and (b) final water production network .......................................................................106Fig. 5-17 – The change in temperature of total water and filtrate to sinks in current conditions and afterapplying SEWNA .............................................................................................................................................107Fig. 5-18 – Current and final, (a) steam consumption, (b) water consumption, and (c) effluent production –Mill C................................................................................................................................................................ 109Fig. 5-19 – The steam and water savings and effluent reduction of applying SEWNA on the other twoCanadian Kraft mills (mill A and B) and a comparison between the three mills (mill A, B, and C)................112Fig. 5-20 - The capital cost, net profit, and payback period after applying SEWNA on two other CanadianKraft mills (mill A and B) and a comparison between the three mills (mill A, B, and C)................................ 113

xxxii
Fig. 5-21 – Benchmarking of (a) water consumption and (b) steam consumption of three mills (mill A, B, andC) before and after applying SEWNA ..............................................................................................................114Fig. 6-1 - Methodology of equipments and department performance analysis.................................................117Fig. 6-2 - Simplified schematic of a washer .....................................................................................................118Fig. 6-3 - Schematic of digesting department ...................................................................................................122Fig. 6-4 - Thermal energy consumption (TEC) for digesting department ........................................................ 123Fig. 6-5 - Schematic of washing department (WW: warm water, FW: fresh water, HW: hot water)...............124Fig. 6-6 - Water consumption at washing department – current and modified after projects........................... 125Fig. 6-7 – (a) DF and (b) EDR of washers – current and modified after projects.............................................126Fig. 6-8 - Schematic of bleaching sequences....................................................................................................127Fig. 6-9 – (a) Thermal energy (TEC) and (b) water consumption of bleaching and chemical preparationdepartment ........................................................................................................................................................ 128Fig. 6-10 - Schematic of paper machine ...........................................................................................................128Fig. 6-11 - Schematic of six-effect evaporator .................................................................................................129Fig. 6-12 – Schematic of recovery boiler, concentrator cascade, and scrubber ................................................130Fig. 6-13 – (a) & (b) Flowrate of fuel, (c) temperature of air and stack gas, (d) steam production, and (e) fuelconsumption (KPI) of the boilers...................................................................................................................... 132Fig. 6-14 - Simple schematic of deaerator ........................................................................................................133Fig. 6-15 – (a) Water consumption (m3/h), (b) steam consumption (MW), and (c) steam consumption (%) ofdeaerator (d) flash of blowdown (BLF) ............................................................................................................134Fig. 6-16 - Thermal energy consumption (TEC) of recausticizing department ................................................135Fig. 6-17 - Simple schematic of green liquor preparation at recausticizing...................................................... 136Fig. 6-18 - Summary of all performance improvement projects, effect on (a) steam production, consumption,and excess steam and (b) water consumption and effluent production............................................................. 138Fig. 6-19 - Summary: shutting down the boilers, effect on (a) steam production and consumption, waterconsumption and (b) natural gas consumption .................................................................................................139Fig. 7-1 – Retrofit HEX network design (R-HEN) of the water-based process................................................143Fig. 7-2 – Step 1: Identification of saving potential ......................................................................................... 144Fig. 7-3 – Five different categories of steam users in water-based processes...................................................147Fig. 7-4 - Simple schematic of Step 1-Phase 2 and 3 ....................................................................................... 148Fig. 7-5 – Two categories of waste streams; high and low corrosives (ambient temperature in winter: Ta=-10oC, temperature of fresh water in winter: TFW=2oC, and minimum temperature approach: ∆Tmin=10oC)....150Fig. 7-6 – HEX network design algorithm........................................................................................................151Fig. 7-7 - Simple schematic of a water-based process in (a) current condition with process line, air users, waterand air networks, (b) Step 3-Phase 1 of first trial, (c) Step3 – Phase 2 & 3 of first trial, (d) Step 3-Phase 1 ofsecond trial, (c) Step3 – Phase 2 & 3 of second trial, (e) final changes............................................................ 153Fig. 7-8 – Example of interaction in the process energy system (WW: warm water, HW: hot water).............157Fig. 7-9 – (a) the effect of air inlet temperature to boiler, (b) targeting new air inlet temperature to boiler ....159Fig. 7-10 - (a) the effect of air inlet temperature to the dryer of the Kraft process, (b) targeting new air inlettemperature to dryer of Kraft process ...............................................................................................................160Fig. 7-11 – Mixed Cp of exhaust air of dryer versus temperature at different levels of humidity (informationextracted from work of (Söderman and Pettersson, 2003)) ..............................................................................163Fig. 7-12 – Example of HEN design.................................................................................................................167Fig. 7-13 – Targeting temperature of water and changes in temperature of effluent (FW: fresh water, WW:warm water, HW: hot water, PM: paper machine) ........................................................................................... 169
xxxiii
Fig. 7-14 – Current and final air pre-heating network after applying R-HEN (RB: recovery boiler, PB: powerboiler, PM: paper machine, eco.: economizer) .................................................................................................172Fig. 7-15 - Current and final water production network after applying R-HEN (WWT: warm water tank, HWT:hot water tank, chem.. Prep.: chemical preparation, RB: recovery boiler, PB: power boiler) .......................... 174Fig. 7-16 – Pinch Curves of the mill .................................................................................................................179Fig. 7-17 – Current and final air pre-heating network after applying Pinch Analysis (RB: recovery boiler, PB:power boiler, PM: paper machine, eco.: economizer) ...................................................................................... 180Fig. 7-18 - Current and final water production network after applying Pinch Analysis (WWT: warm watertank, HWT: hot water tank, chem.. Prep.: chemical preparation, RB: recovery boiler, PB: power boiler) ......181Fig. 7-19 – (a) Estimation and final steam requirement and steam saving by means of R-HEN and Pinchanalysis, (b) benchmarking of steam consumption after applying both R-HEN and Pinch analysis ................184Fig. 8-1 – Steam and water analysis enhancement and integration (SWAEI) methodology ............................ 188Fig. 8-2 - Steam consumption of main departments and complete mill – current and after applying projects -Mill A................................................................................................................................................................ 193Fig. 8-3 - Water consumption – current and after applying projects - Mill A ..................................................194Fig. 8-4 - Water & Energy Pinch Curves, (a) before water reutilization, (b) after water reutilization – Mill A..........................................................................................................................................................................195Fig. 8-5 - (a) current, (b) final water utilization and filtrate reutilization in washing and bleaching departments– Mill A; dotted red lines: new connections; dashed purple lines: the existing connections with change inflowrate (W: washer, FT: filtrate tank, Sep & Scr.: separators and screeners, Deknot: deknotters, R: reactor, M:steam mixer, PM: pulp machine, ST: steam, NCC-EV: non-clean condensate of evaporation, WW: warmwater: FW: fresh water: HW: hot water, Eff.: effluent)....................................................................................196Fig. 8-6 - (a) Current, (b) final water utilization and filtrate reutilization in bleaching and pulp machinedepartments – Mill A; dotted red lines: new connections; dashed purple lines: the existing connections withchange in flowrate (W: washer, R: reactor; M: steam mixer, FT: filtrate tank, Cle.: cleaners, Scr.: screeners,PM: pulp machine, Vac. P: vacuum pump, Fil: filter, WW: warm water: FW: fresh water: HW: hot water, CH-A: acidic chemicals, CH-B: base chemicals, ST: steam, Eff.: effluent) ........................................................... 197Fig. 8-7 - (a) current, (b) final water utilization and filtrate reutilization in scrubber, recausticizing, and steamplant department, - Mill A; dotted red lines: new connections; dashed purple lines: the existing connectionswith change in flowrate (Scrub-RB: scrubber of recovery boiler, LMS: lime mud storage, Scrub-Recaust.:Scrubber of recauticizing, Con. T: condensate tank, Fil: filter)........................................................................198Fig. 8-8 - (a) Current and (b) final air and black liquor (BL) pre-heating network after applying SWAEImethodology – Mill A (RB: recovery boiler, PB: power boiler, PM: pulp machine, eco.: economizer, MP:medium pressure, HP: high pressure, cascade con.: cascade concentrator, DS: dissolved solid, CFST: cleanflashed steam of dryer, con. Condenser)...........................................................................................................201Fig. 8-9 - (a) Current and (b) final water production network after applying SWAEI methodology – Mill A(WWT: warm water tank, HWT: hot water tank, RB: recovery boiler, PB: power boiler, Eff-Cle.: effluent ofcleaners)............................................................................................................................................................ 202Fig. 8-10 - (a)Current cogeneration, (b) Alt. 1, (c) Alt. 2 – Mill A (G: generator, C: condenser, A: absorber, E,evaporator, Gen.: turbine generator) .................................................................................................................205Fig. 8-11 - Steam consumption of main departments and complete mill – currently and after applying projects -Mill B................................................................................................................................................................ 209Fig. 8-12 - Water consumption – currently and after applying projects -Mill B ..............................................210Fig. 8-13 - Water & Energy Pinch Curves, (a) before water reutilization, (b) after water reutilization – Mill B,Line 1 ................................................................................................................................................................ 211

xxxiv
Fig. 8-14 - Water & Energy Pinch Curves, (a) before water reutilization, (b) after water reutilization – Mill B,Line 2 ................................................................................................................................................................ 212Fig. 8-15 - (a) current, (b) final water utilization and filtrate reutilization in digesting, washing, and bleachingdepartments – Mill B, Line 1(L1); dotted red lines: new connections; dashed purple lines: the existingconnections with change in flowrate (L2: line 2, W: washer, FT: filtrate tank, Sep & Scr.: separators andscreeners, Dig: digester, Deknot: deknotters, R: reactor, M: steam mixer, PM: pulp machine, NCHWT: non-clean hot water tank, CC-STP: clean condensate of steam plant, NCC-EV: non-clean condensate ofevaporation, WW: warm water: FW: fresh water: HW: hot water, Eff.: effluent) ...........................................213Fig. 8-16 - (a) Current, (b) final water utilization and filtrate reutilization in bleaching and pulp machinedepartments – Mill B, Line 1 (L1); dotted red lines: new connections; dashed purple lines: the existingconnections with change in flowrate (L2: line 2, W: washer, R: reactor; M: steam mixer, FT: filtrate tank, Cle.:cleaners, Scr.: screeners, PM: pulp machine, Vac. P: vacuum pump, Fil: filter, WW: warm water: FW: freshwater: HW: hot water, CH-A: acidic chemicals, CH-B: base chemicals, ST: steam, Eff.: effluent) ................214Fig. 8-17 - (a) current, (b) final water utilization and filtrate reutilization at recausticizing - Mill B, Line 1 (L1);dotted red lines: new connections; dashed purple lines: the existing connections with change in flowrate (L2:line 2, DVScrEx: dust vent scrubber exchanger, NCHWT-Recaust.: non-clean hot water tank of recausticizing,FT-WEop: filtrate tank of washer Eop, NCC-Evap.: non-clean condensate of evaporation, CC: cleancondensate, FW: fresh water: HW: hot water, Eff.: effluent) ...........................................................................215Fig. 8-18 - (a) current, (b) final water utilization and filtrate reutilization in digesting, washing, and bleachingdepartments – Mill B, Line 2 (L2); dotted red lines: new connections; dashed purple lines: the existingconnections with change in flowrate (L1: line 1, R: reactor, W: washer, FT: filtrate tank, Sep & Scr.: separatorsand screeners, Dig: digester, Deknot: deknotters, NCHWT: non-clean hot water tankWW: warm water: FW:fresh water: HW: hot water, Eff.: effluent).......................................................................................................216Fig. 8-19 - (a) Current, (b) final water utilization and filtrate reutilization in bleaching and pulp machinedepartments – Mill B, line 2 (L2); dotted red lines: new connections; dashed purple lines: the existingconnections with change in flowrate (L1: line 1, W: washer, R: reactor; M: steam mixer, FT: filtrate tank, Cle.:cleaners, Scr.: screeners, PM: paper machine, Vac. P: vacuum pump, Fil: filter, WW: warm water: FW: freshwater: HW: hot water, CH-A: acidic chemicals, CH-B: base chemicals, ST: steam, Eff.: effluent) ................217Fig. 8-20 - (a) current, (b) final water utilization and filtrate reutilization at recausticizing - Mill B, Line 2 (L2);dotted red lines: new connections; dashed purple lines: the existing connections with change in flowrate (L1:line 1, DVScrEx: dust vent scrubber exchanger, Vac. P – Recaust.: vacuum pump of recausticizing, Fil.: filter,NCHWT-Recaust.: non-clean hot water tank of recausticizing, FT-WEop: filtrate tank of washer Eop, FW:fresh water: HW: hot water, Eff.: effluent).......................................................................................................218Fig. 8-21 - (a) Current and (b) final air pre-heating network after applying SWAEI methodology – Mill B, Line1(L1) &2 (L2); (RB: recovery boiler, PB: power boiler, PM: paper machine, eco.: economizer, CT:condensing turbine, con.: condenser)................................................................................................................223Fig. 8-22 - (a) Current and (b) final water production network after applying SWAEI methodology – Mill B,Line 1 (L1); (L2: line 2, WWT: warm water tank, HWT: hot water tank, eco.: economizer, FT-W#4: filtratetank of washer #4, PM: pulp machine, GL: green liquor, SC: surface condenser, Evap.: evaporation, Recaust.:recausticizing)...................................................................................................................................................225Fig. 8-23 - (a) Current and (b) final water production network after applying SWAEI methodology – Mill B,Line 2 (L2); (L1: line 1, WWT: warm water tank, HWT: hot water tank, chem. SC: surface condenser, RB:recovery boiler, PB: power boiler, Evap.: evaporation, PM: pulp machine, FT: filtrate tank, Recaust.:recausticizing, HW: hot water) ......................................................................................................................... 226Fig. 8-24 - (a)Current cogeneration, (b) Alt. 1, (c) Alt. 2, (d) Alt. 3, (e) Alt. 4 – Mill B (G: generator, C:condenser, A: absorber, E, evaporator, Gen.: turbine generator)......................................................................230

xxxv
Fig. 8-25 – Steam consumption of main departments and complete mill – current and after applying projects..........................................................................................................................................................................234Fig. 8-26 - Water consumption – current and after applying projects .............................................................. 235Fig. 8-27 – Water & Energy Pinch Curves, (a) before water reutilization, (b) after water reutilization – Mill C..........................................................................................................................................................................236Fig. 8-28 – (a) current, (b) final water utilization and filtrate reutilization in digesting and washing departments– mill C; dotted red lines: new connections; dashed purple lines: the existing connections with change inflowrate (W: washer, FT: filtrate tank, Sep & Scr.: separators and screeners, Dig: digester, Deknot: deknotters,NCC-EV: non-clean condensate of evaporation, WW: warm water: FW: fresh water: HW: hot water, Eff.:effluent)............................................................................................................................................................. 237Fig. 8-29 - (a) Current, (b) final water utilization and filtrate reutilization in bleaching and paper machinedepartments – mill C; dotted red lines: new connections; dashed purple lines: the existing connections withchange in flowrate (W: washer, R: reactor; M: steam mixer, FT: filtrate tank, Mec.-P: mechanical pulping,Cle.: cleaners, Scr.: screeners, PM: paper machine, Vac. P: vacuum pump, Fil: filter, WW: warm water: FW:fresh water: HW: hot water, CH-A: acidic chemicals, CH-B: base chemicals, ST: steam, Eff.: effluent) .......238Fig. 8-30 - (a) current, (b) final water utilization and filtrate reutilization in scrubber, recausticizing, chemicalpreparation, and steam plant department, - mill C; dotted red lines: new connections; dashed purple lines: theexisting connections with change in flowrate (Scrub: scrubber, BL-Con: black liquor concentrator, WeWT:weak wash tank, Dreg FT: dreg filter, LMF: lime mud filter, Clas: classifier, Scrub-Rec: scrubber ofrecauticizing, Ch. Prep.: chemical preparation, Mix-Ble: mixer-bleaching, Con. T: condensate tank, Con. T-Dig.: condensate tank of digesting, SC-Dig.: surface condenser of digesting, SC-EV.: surface condenser ofevaporation, WW: warm water: FW: fresh water: HW: hot water, CH-A: acidic chemicals, CH-B: basechemicals, ST: steam, Eff.: effluent).................................................................................................................239Fig. 8-31 - (a) Current and (b) final air pre-heating network after applying SWAEI methodology – mill C (RB:recovery boiler, PB: power boiler, PM: paper machine, eco.: economizer) .....................................................243Fig. 8-32 - (a) Current and (b) final water production network after applying SWAEI methodology – mill C(WWT: warm water tank, HWT: hot water tank, chem. Prep.: chemical preparation, RB: recovery boiler, PB:power boiler).....................................................................................................................................................244Fig. 8-33 - (a)Alt. 1 – Cogeneration and selling electricity to the grid, (b) Alt. 2 – trigeneration and sellingelectricity to the grid – mill C (G: generator, C: condenser, A: absorber, E, evaporator, Gen.: turbine generator)..........................................................................................................................................................................247Fig. 8-34 – Comparison between the results of applying three techniques stand alone and in sequence in theframework of SWAEI methodology – Mill C ..................................................................................................251Fig. 8-35 – Benchmarking of (a) water consumption and (b) steam consumption of three mills (mills A, B, andC) before and after applying SWAEI methodology.......................................................................................... 253Fig. 8-36 – Comparison of the capital cost, net profit, and payback period after applying SWAEI methodologyon three Canadian Kraft mills (mills A, B, and C) ........................................................................................... 254Fig. 8-37 - Effect of summer condition on the final results of selected alternatives.........................................255Fig. 8-38 - Effect of capital cost (CC), bunker oil price (BOP), electricity price (EP), steam price (STP), naturalgas price (NGP), and combination of them over payback period for selected alternatives for implementationand whole year (6 months summer & 6 months winter) and comparison with only winter condition (red dot)..........................................................................................................................................................................257

xxxvi
NOMENCLATURE
a Annual A Cross-sectional area of pipeA Absorber of AHP A Area of HEX
Adt Air dried ton AHP Absorption heat pumpA&WSS Potential Air and water steam saving BL Black liquorBL-Con. Black liquor concentrator BPT Back-pressure turbine
C Condenser of AHP CB Base cost for a carbon steel floating heat HEXCBF Compact baffle filter CEWO Combined energy and water optimization
CH-A Acidic chemical CH-B Base chemicalChem. Prep. Or
Ch. Prep.Chemical preparation CHP Combined heat and power
CH-X Chemical X CH-Y Chemical YCi Contaminant concentration of stream i Clas. Classifier
Cle. Cleaner Con.T Condensate tankCon. T-Dig. Condensate tank of digesting COP Coefficient of performance
CP Cost of piping CP Purchasing cost of turbineCP Heat capacity CSC Current steam consumption
CTContaminant concentration of sink orsource
CT Condensing turbine
CWC Current water consumption d DayDeknot. Deknotter DF Dilution factor
Dig. Digester Dreg. FT Dreg filterE Evaporator of AHP Eco. Economizer
EDR Equivalent displacement ratio Eff. EffluentEPA Equipment performance analysis Evap. Evaporation
FBM Base module coefficient FDHEX type cost factor when switching from afloating head to a fixed head
FHexHS-SI Feasible HEX heat sink – steam injection FMMaterial cost factor for stainless steel 316HEX
FPDesign pressure factor to handle pressureup to 4000 kPa
FT Filtrate tank
FW Fresh water G Generator of AHPGCC Grand composite curve Gen. Generator turbineG-G Gas-gas G-L Gas-liquid
G-ST Gas-steam HEN HEX networkHEX Heat exchanger HLMPP Heat load model for P&P
HP High pressure HW Hot water
HWT Hot water tank I&DSSPotential for steam saving at steam injectionpoints and deaerator
KPI Key performance indicator L Length of pipeL-L Liquid-liquid LMF Lime mud filter
LMTD Logarithmic mean temperature difference LP Low pressureL-ST Liquid-steam MCR Minimum cooling requirement
Mec. - P Mechanical pulping M-Eop Eop steam mixerMHR Minimum heating requirement Mi Flowrate of stream i
MIHR Maximum internal heat recovery MILP Mixed integer linear programmingMINLP Mixed integer non-linear programming Mix-Ble. Mixer bleaching
MP Medium pressure MP Purchase cost of HEXMT Installed cost of turbine NAD Network allocation diagram
NCGSC Non-condensable gas surface condenserNFHexHS-
SINon-feasible HEX heat sink – steam injection
NG Natural gas NIM Non-isothermal mixingNRHS-
NFHexHS-SINon-reducible heat source – non-feasibleHEX heat sink – steam injection
NRHS-SH Non-replaceable heat source – steam heater
PB Power boiler PI Process integrationPL Process line PM Pulp/paper machine
P&P Pulp and paper R Reactor
RB Recovery boiler R-HENRetrofit HEX network design for water-basedprocess

xxxvii
RHS-NFHexHS-SI
Non-reducible heat source – feasible HEXheat sink – steam injection
RHS-SH Replaceable heat source – steam heater
RMWC Reference mills’ water consumption RVD Rotary vacuum drumSC Surface condenser SC-Dig. Surface condenser of digesting
SC-EV. Or SC-Evap.
Surface condenser of evaporation Scr. Screener
Scrub.-Rec. Scrubber of recausticizing Sep. Separator
SEWNASimultaneous energy and water networksanalysis
SH Steam heater
SI Steam injection SMEC Superimposed mass and energy curvesSR Steam requirement SS Steam saving
SSS Scope of steam saving ST SteamSWS Scope of water saving Ta Ambient temperatureTFW Fresh water temperature Ti Temperature of stream i
TMaxSS Theoretical maximum steam saving TMinSR Theoretical minimum steam requirementTSC Total steam consumption TT Temperature of sink or source
U Overall heat transfer coefficient V̇ Volumetric flowrateVac. P. Vacuum pump VRHP Vapor recompression heat pump
W Washer WCA Water cascade analysisWeWT Weak wash tank WW Warm waterWWT Warm water tank ∆Tmin Minimum allowable approach temperature
υ Velocity of fluid

xxxviii
LIST OF APPENDICES
• Appendix 1 – Detail of HEX network of Chapter 5 (SEWNA) for mill C ................................... 280
• Appendix 2 – Detail of HEX network of Chapter 7 (R-HEN) for mill C ..................................... 282
o HEX network of R-HEN........................................................................................................... 282
o HEX network of Pinch Analysis............................................................................................... 285
• Appendix 3 – Detail of Water Analysis of Chapter 8 (SWAEI) for mill C .................................. 288
• Appendix 4 – Detail of HEX network of Chapter 8 (SWAEI) for mill C..................................... 289
• Appendix 5 – Detail of Water Analysis of Chapter 8 (SWAEI) for mill A.................................. 294
• Appendix 6 – Detail of HEX network of Chapter 8 (SWAEI) for mill A .................................... 296
• Appendix 7 – Detail of Water Analysis of Chapter 8 (SWAEI) for mill B-Line 1 ...................... 301
• Appendix 8– Detail of Water Analysis of Chapter 8 (SWAEI) for mill B-Line 2 ....................... 304
• Appendix 9 – Detail of HEX network of Chapter 8 (SWAEI) for mill B..................................... 306
• Appendix 10–Specification of Turbine in Three Mills of Chapter 8 ............................................ 312

1
1 CHAPTER 1: INTRODUCTION
1.1 Justification of Project
Water based processes, such as sugar, pulp and paper (P&P), and beer, are the processes in
which water is the main medium for heat, mass, and momentum transfers. In these processes,
water is utilized for different purposes, such as a reaction medium, a solvent in extraction
processes, a washing agent, etc. The thermal energy (steam) and water systems in such processes
are strongly interrelated and interact with each other. These processes along with other chemical
processes envisage several issues, such as global competitiveness, public demand for sustainable
products, and strict environmental regulations. One way to remain competitive is to decrease the
manufacturing cost by reducing the cost of energy and water consumption and also water and
wastewater treatments. In addition, in these processes, electricity is employed to pump the water
and therefore the greater the water consumption and effluent production, the greater the
electricity consumption. Thus, the main incentives for energy and water conservation programs
are to reduce the manufacturing costs, CO2 emissions, and wastewater going to the environment.
A very good representative example of a water-based process is pulp and paper (P&P). Pulp &
paper is characterized as one of the large energy consumers and ranked as the fourth biggest
energy user among the different industries (Chen et al., 2012; Persson and Berntsson, 2009).
Water also is widely used in the P&P as a utility, such as steam or mass transfer agent, such as
washing, pulp dilution, steam production, cleaning, pump cooling, etc. (Bryant et al., 1996).
These high water and energy consumptions raise the final product cost. Rising costs, increasing
worldwide competition, and decreasing pulp demand (RISI, 2010) are leading to closures of
unprofitable mills in rural areas and towns where the mills are often located. In order for the
industry to sustain its competitive advantage in the market, it must reduce its manufacturing
costs and, in particular, its energy costs, which are estimated at 30% (Mateos-Espejel et al.,
2011c) of total manufacturing costs.
Forest biorefinery is the conversion of forestry and agricultural biomass into a large spectrum of
products by various extraction and transformation pathways. The concept of integrating
biorefinery into an existing Kraft mill gives the opportunity to the P&P industry to increase their
profitability, improve the environmental sustainability, and remain competitive by producing

2
high-value products, such as biofuels, chemicals, polymers, and pharmaceuticals (Mabee et al.,
2005; Thorp, 2005). It is expected that most mill systems can handle biorefinery within current
specification limits. However, this integration can place additional demands on the utility system
and increase operating costs (e.g. additional capacity for wastewater treatment) (CETC, 2003).
Thus, Kraft mills should be self-sufficient in terms of energy that can supply energy for the
biorefinery. For these reasons, the P&P industry must focus its efforts to improve energy
efficiency and, subsequently, reduce thermal energy consumption and gas emissions.
The prerequisite step to determine the potential for energy and water savings is benchmarking
(Mateos-Espejel et al., 2011d). A benchmarking study is a comparison of a mill from the stand
point of energy and water consumption with its competitors. The results of this study are the
driving force for further attempts towards water and energy savings (CIPEC, 2008; Francis et al.,
2006).
The most common process integration (PI) technique that has been widely employed in different
industries to enhance energy efficiency is the Thermal Pinch Analysis. Pinch Analysis is the
main tool for the retrofit heat exchanger (HEX) network design. Nevertheless, it does not deeply
consider the interrelation between energy and water in water-based processes. Moreover, there
are several constraints within the process that cause difficulty to enhance steam saving. These
constraints are divided into two categories: physical and process. Thus, identification and
analysis of these constraints are an essential task before conducting any effort to retrofit the HEX
network (HEN) design so as to design a near optimal HEN. Pinch Analysis provides the targeting
information, such as the minimum heating requirement (MHR) and minimum cooling
requirement (MCR), however it requires significant effort for data extraction, analysis of the
data, and constructing the composite curves. In addition, this targeting (MHR) for water-based
processes is not always realistic and is sometimes far from what can be achieved in practice. For
example, Mateos et al. (2011c) estimated 29% of steam saving using Pinch curves for a Kraft
mill but the final steam saving that was accomplished was 13%, which is less than a half of the
estimation. This difference is mainly because of the physical and process constraints and also the
fact that all of the pinch rules to retrofit the HEN design could not be respected. In the other
words, the Pinch rules cannot tackle all specific characteristics of a water-based process to
design the HEN. Since the retrofit HEN design requires lots of effort and time; targeting energy
3
savings is significantly important. In addition, non-isothermal mixing (NIM) points should be
considered at the HEN design; however, in Pinch Analysis they have not been taken into
account. The pinch rules to design HEN are not sufficient and new practical rules and guidelines
are required. Therefore, a new technique should be developed to overcome these aspects.
The most common PI technique that has been used for water efficiency improvement is Water
Pinch analysis. Water Pinch analyses are graphical techniques that have been analogously
constructed with Thermal Pinch Analysis (Dhole, 1998; Dhole et al., 1996; El-Halwagi et al.,
2003; Wang and Smith, 1994). With the rising cost of fossil fuel and energy in general, water
and energy conservation should be performed simultaneously to ensure sustainability and lower
the cost of production. There were several attempts to incorporate energy and water analyses
(Feng et al., 2008; Leewongtanawit and Kim, 2009; Manan et al., 2009; Savulescu et al., 2005b;
Wan Alwi et al., 2011). Nevertheless, the existing configuration for warm and hot water
production has been overlooked; the physical and process constraints have not been carefully
examined. Most water-based processes require water not only in quantity and purity but also in
temperature (Cortés et al., 2011; Feng et al., 2009). In terms of temperature of water supply to
different demands, the acceptable temperature of water and filtrate should be analyzed carefully
and not just considering the fixed-supply temperatures as a limitation for filtrate reutilization and
hot or warm water usage. Most of the techniques applied for generic cases and in fact they were
suited for small problems. The quality of the employed data is one of the major challenges for
water analysis. The acceptable temperature and contaminant concentrations should be
accomplished by a systematic approach. Each set of data should consider the characteristics of
each type of process, for instance, the acceptable contaminant concentration for the sinks of one
Kraft mill cannot be used for another mill because each mill has its own features. In this sense,
systematic guidelines for extracting the data for water analysis should also be developed.
Therefore, a new technique is required to address all these issues.
The process integration techniques are commonly applied with the assumption that all equipment
and departments are working efficiently, but this is not always the case. Therefore, the
performance of an individual piece of equipment or department in terms of their water and
energy efficiency should be carefully evaluated.
4
P&P is also considered as the largest industrial cogeneration capacity in Canada, however, there
is still potential for more power generation if the total steam consumption decreases (CIPEC,
2008; Mateos-Espejel et al., 2010d). Other process integration tools to further save heat and
steam by recovering the low grade heat are heat pumps. These devices are installed to upgrade
the low potential heat at low temperature to high potential heat at high temperature and save
steam (Bakhtiari et al., 2010a, b; Costa et al., 2009; Costa et al., 2004). Trigeneration is a
combination between cogeneration and a heat pump. It has been reported that trigeneration can
reduce the net heat demand of the process and supply electricity to the grid (Marinova et al.,
2007). Nevertheless, the investment required for this combination is high and should be
examined carefully to decide whether it is profitable or not.
In addition to energy and water savings, the implementation of steam and water projects have
several advantages with an environmental impact reduction through lower emissions of
greenhouse gases (GHG) and smaller effluent production, lower maintenance costs due to more
reliable equipment, and higher profit for the mill.
Applying PI techniques on a Kraft mill, prepares it as an energy optimized receptor for
sustainable biorefinery integration through a well defined roadmap.
1.2 Context of the project
This research is part of the BiokrEn project. The global objective of the BioKrEn project is to
evaluate the feasibility of biorefinery proposals for Canadian Kraft P&P mills and to develop
optimized process designs that best integrate biorefining into existing mills. Three biorefining
technologies are studied by other group members:
Lignin recovery from black liquor
Gasification of wood residues
Hemicelluloses extraction from wood chips prior to pulping and their conversion into
high-value products as bioethanol and furfural

5
In this project an in-depth energy analysis for three existing Canadian Kraft P&P mills is
performed with the focus on developing technically feasible solutions to reduce the energy
requirements of the mills, and creating excess steam for biorefinery integration.
1.3 General Objective
The main objectives of this thesis are:
To develop new process integration techniques to individually enhance the efficiency of
water and steam systems.
To develop a steam and water analysis enhancement and integration (SWAEI)
methodology to improve energy and water efficiency of a water-based process by
combining the process integration techniques.
1.4 Structure and Organization
In Chapter 2, the water-based process is defined and Kraft pulp and paper is introduced.
In Chapter 3, the literature review concerning different PI techniques for the enhancement of
water and energy efficiency is presented. These PI techniques consist of internal heat recovery,
water reutilization, energy upgrading and conversion. Their application in the P&P process is
shown. The main challenges regarding the most popular PI techniques are discussed. Finally, the
literature is synthesized and the specific objectives are defined. The overall methodology is also
described. The case studies which are three Canadian Kraft mills as good representatives of
water-based process are introduced and characterized.
In Chapter 4, a new developed technique for benchmarking is presented. The cases are first
benchmarked against reference data from the standpoint of steam and water consumption. Then,
the three cases are compared from the standpoint of water and steam allocations for different
uses. The areas with high water and steam consumption are determined and the causes are stated.
Their water reutilization and heat exchanger networks are compared to identify the similarities
and differences so as to exploit the advantages of one case as possible solutions for another case
and vice versa.
6
In Chapter 5, the simultaneous energy and water networks analysis (SEWNA) for a water-based
process is developed and presented. The concept and the structure of SEWNA are described. The
technique consists of five steps: data extraction, constraint analysis, water and energy analysis,
warm and hot water network analysis, and economic analysis. A generic example is used to
illustrate the different steps of the technique. In the second part, this technique is applied on three
Canadian Kraft mills. The advantages of this technique over previous studies are shown.
In Chapter 6, equipment performance analysis (EPA) is developed and presented. EPA
encompasses four steps: identification, diagnosis, performance improvement, and economic
analysis. The key performance indicator (KPI) regarding the steam and water consumption of
equipment and departments are identified. The reference data for the KPIs are determined. The
KPI of the case study is calculated and compared with reference data to diagnose the
inefficiency. Some probable causes and remedial solutions based on the previous studies are
identified. The result of this study is a starting point for an in-depth on-site analysis of the poor
performance equipment.
In Chapter 7, the retrofit HEX network (R-HEN) design for water-based processes is developed
and presented. The concept and structure of R-HEN is elaborated. The result of applying R-HEN
on a Kraft mill is shown and compared with the result of applying Pinch Analysis to reveal the
advantages of R-HEN.
In Chapter 8, the steam and water analysis enhancement and integration (SWAEI) methodology
is developed and presented. It combines different PI techniques to obtain the highest steam
saving by defining complementary projects. It consists of process simulation, pre-benchmarking,
identification of water and steam projects, energy upgrading and conversion, implementation
strategy, and post-benchmarking. In the identification of water and steam projects, three
aforementioned techniques (SEWNA, EPA, and R-HEN) are applied sequentially. Different
alternatives for using the saved steam are examined. A strategy to implement the most promising
alternative is proposed. The methodology is applied on three Kraft mills and the detailed results
are presented. The results of applying SWAEI and a stand-alone technique (SEWNA, EPA, and
R-HEN) are compared to demonstrate the advantages of combining different PI techniques. In
7
addition, the results of the three mills are compared. The sensitivity analysis in the major
parameters is conducted.
In the general discussion, the highlights of each chapter are presented.
In the conclusions and recommendation, the main contributions and the possibility for future
work are discussed.
In the appendix the extracted data for water and energy analyses of chapters 5, 7, 8 are tabulated.
Details of HEX networks of these chapters are also presented.

8
2 CHAPTER 2: WATER-BASED PROCESS AND KRAFT MILL
2.1 Water-based Process
Water-based processes, such as pulp and paper (P&P), sugar, and beer, are the processes where
the main medium for three different transport phenomena (mass, heat, and momentum) is water.
For example, in a Kraft P&P mill, water is used to dilute the pulp, carry the solid pulp
(momentum transfer), and to wash and clean the pulp (mass transfer). It is also utilized to
produce the steam and this steam is employed to retain and attain the temperature of the pulp
(heat transfer). So the energy and water systems in such processes are strongly interrelated and
interact with each other.
2.2 Kraft Pulp and Paper Mill
There are two major types of P&P mills: mechanical and chemical. The Kraft process is a form
of chemical pulping and the most dominant P&P process in Canada. It is also a very good
representative example of the water-based process.
A simple schematic of the Kraft process is shown in Fig. 2-1.
Fig. 2-1– Simplified diagram of the Kraft process
Black liquorWhite liquor
Steamto process
Water
Smelt
Woodchips
Pulp/Paper
Chemicals
Digesting Washing Bleaching Pulp/PaperMachine
Chemicalpreparation
EvaporationRecausticizing
Recoveryboiler
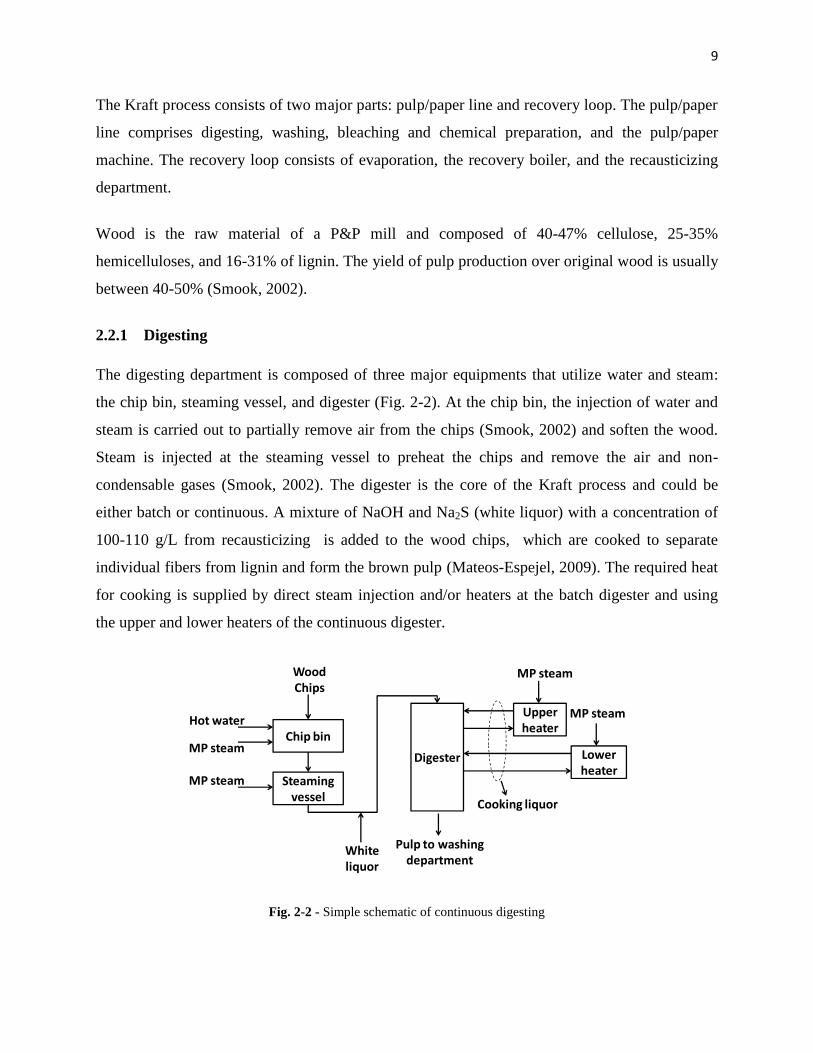
9
The Kraft process consists of two major parts: pulp/paper line and recovery loop. The pulp/paper
line comprises digesting, washing, bleaching and chemical preparation, and the pulp/paper
machine. The recovery loop consists of evaporation, the recovery boiler, and the recausticizing
department.
Wood is the raw material of a P&P mill and composed of 40-47% cellulose, 25-35%
hemicelluloses, and 16-31% of lignin. The yield of pulp production over original wood is usually
between 40-50% (Smook, 2002).
2.2.1 Digesting
The digesting department is composed of three major equipments that utilize water and steam:
the chip bin, steaming vessel, and digester (Fig. 2-2). At the chip bin, the injection of water and
steam is carried out to partially remove air from the chips (Smook, 2002) and soften the wood.
Steam is injected at the steaming vessel to preheat the chips and remove the air and non-
condensable gases (Smook, 2002). The digester is the core of the Kraft process and could be
either batch or continuous. A mixture of NaOH and Na2S (white liquor) with a concentration of
100-110 g/L from recausticizing is added to the wood chips, which are cooked to separate
individual fibers from lignin and form the brown pulp (Mateos-Espejel, 2009). The required heat
for cooking is supplied by direct steam injection and/or heaters at the batch digester and using
the upper and lower heaters of the continuous digester.
Fig. 2-2 - Simple schematic of continuous digesting
Steamingvessel
Upperheater
Lowerheater
Chip binDigester
WoodChips
Hot water
MP steam
MP steam
Whiteliquor
MP steam
MP steam
Pulp to washingdepartment
Cooking liquor

10
2.2.2 Washing
The produced brown pulp is directed towards the washing section (Fig. 2-3) where a series of
countercurrent washers are employed to separate the fibers from the black liquor (BL). BL is a
mixture of used chemicals in the digester and most of the lignin and hemicelluloses. Knots are
very thick, uncooked chips that exist in the pulp from the digester. They are separated from the
pulp in the deknotter before the washers. Oversized particles are also removed in the separator
and screener before further washing and sending the pulp to bleaching (Smook, 2002).
Fig. 2-3 - Simple schematic of the washing department
2.2.3 Bleaching and Chemical Preparation
The objectives of bleaching are to remove lignin and brighten the fibers (Smook, 2002).
Typically, the bleaching department in Canadian Kraft mills consists of five stages: D0, Eop, D1,
E2, and D2 (Turner et al., 2001). The chemicals, such as ClO2 and H2SO4, are added at stages
D0, D1, and D2 while at stage Eop, O2, H2O2, and NaOH are added. Only NaOH is used as a
bleaching agent in stage E2. Each stage is composed of one bleaching reactor and one washer
(Fig. 2-4). The steam is employed to attain a certain temperature for the bleaching reactors. Some
of the needed chemicals (NaOH and ClO2) for bleaching are provided by chemical preparation
(Fig. 2-4). The generated effluents at this department are acidic effluent from the filtrate tank of
the D0 washer and alkaline effluent from the filtrate tank of Eop washer.
Fig. 2-4 - Simple schematic of the bleaching department
Deknotters Washers ScreenersPulp from digesting
Water
Washers
Water
Pulp To Bleaching
Weak Black liquorto Evaporation
RejectsRejects
D0 reactorPulp fromwashing
ClO2, H2SO4
D0 washer
Water O2, H2O2, NaOH
Eop reactor Eop washer
Water
D1 reactor
ClO2, H2SO4
D1 washer
Water
Acidic effluent Alkaline effluent
NaOH
E2 reactor E2 washer
Water
D2 reactor
ClO2, H2SO4
D2 washer
WaterPulp to
pulp/papermachine
Steam Steam Steam
Steam

11
2.2.4 Pulp/Paper Machine
The bleached pulp is sent to the pulp/paper machine department to finally produce dried
pulp/paper. At this department, pulps undergo cleaning and screening to remove oversized
particles (Fig. 2-5). The huge quantity of filtrate that leaves the pulp/paper machine contains a
small amount of fiber and is called white water. The white water is typically recycled to the
paper machine, and bleaching stages.
Fig. 2-5 - Simple schematic of the pulp/paper machine
2.2.5 Recovery loop
At the recovery loop (Fig. 2-6), the low concentration black liquor, weak black liquor, is
concentrated in multi-effect evaporators. The concentrated black liquor is burned in the recovery
boiler to produce steam and melted chemicals called smelt. The last step of the recovery loop is
the conversion of smelt into white liquor in recausticizing. White liquor is regenerated by soda-
lime reactions as follows (Mateos-Espejel, 2009):
Causticizing: CaO + H2O Ca(OH)2 + Na2CO3 CaCO3 + 2NaOH
Lime burning: CaCO3 + heat CaO + CO2
Fig. 2-6 - Simple schematic of the recovery loop
Bleached kraft pulpfrom bleaching Cleaners Screeners Machine Dryer Dried
Pulp/Paper
LP steamLP steam
Rejects Rejects
Weak blackliquor (BL)
Evaporationtrains
Recoveryboiler Recausticizing
Fossil fuel Lime Kiln
Strong BL Smelt White liquorto Digesting
Steam
CaO CaCO3
Steam
Non-clean steam
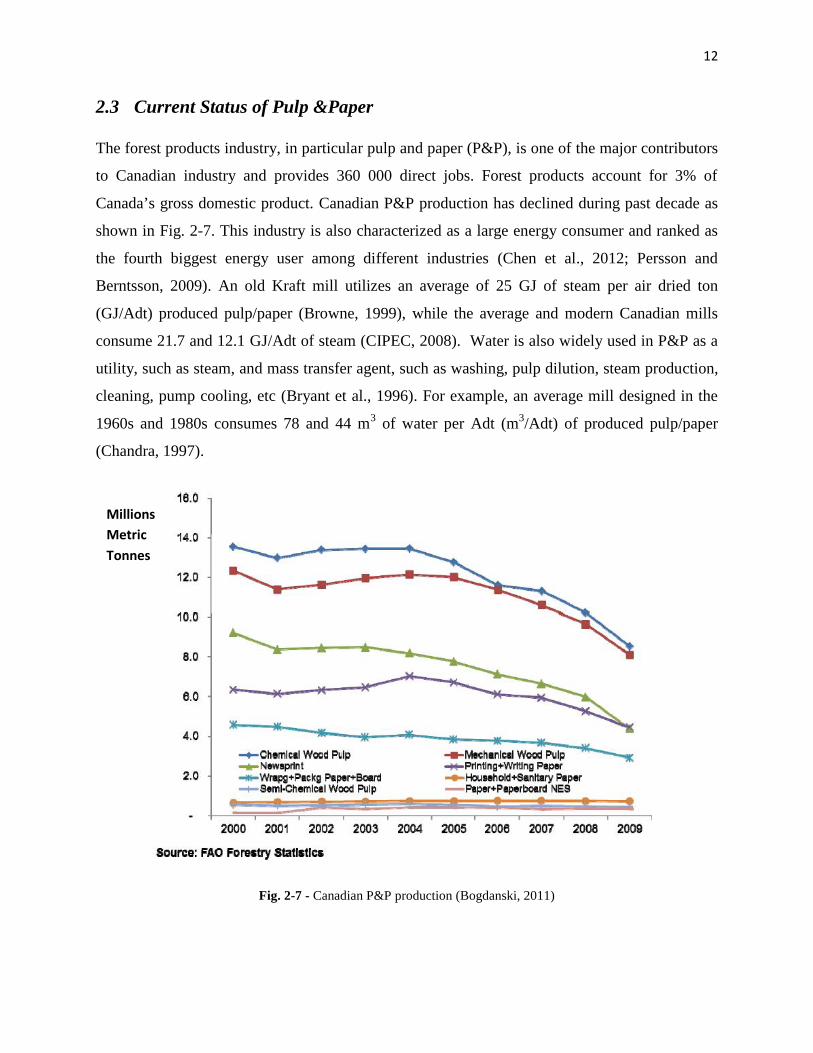
12
2.3 Current Status of Pulp &Paper
The forest products industry, in particular pulp and paper (P&P), is one of the major contributors
to Canadian industry and provides 360 000 direct jobs. Forest products account for 3% of
Canada’s gross domestic product. Canadian P&P production has declined during past decade as
shown in Fig. 2-7. This industry is also characterized as a large energy consumer and ranked as
the fourth biggest energy user among different industries (Chen et al., 2012; Persson and
Berntsson, 2009). An old Kraft mill utilizes an average of 25 GJ of steam per air dried ton
(GJ/Adt) produced pulp/paper (Browne, 1999), while the average and modern Canadian mills
consume 21.7 and 12.1 GJ/Adt of steam (CIPEC, 2008). Water is also widely used in P&P as a
utility, such as steam, and mass transfer agent, such as washing, pulp dilution, steam production,
cleaning, pump cooling, etc (Bryant et al., 1996). For example, an average mill designed in the
1960s and 1980s consumes 78 and 44 m3 of water per Adt (m3/Adt) of produced pulp/paper
(Chandra, 1997).
Fig. 2-7 - Canadian P&P production (Bogdanski, 2011)
MillionsMetricTonnes
13
The utilized thermal energy is steam (Chen et al., 2012; Persson and Berntsson, 2009). In total,
energy accounts for up to 30% of total manufacturing costs of pulp/paper in Canada (Mateos-
Espejel et al., 2010d). It is mainly supplied by burning the black liquor in the recovery boiler or
bark at the power boiler. However, more than 40% of this steam is generated in fossil fuel power
boilers (CIPEC, 2008; Mateos-Espejel et al., 2010d). With volatile fossil fuel prices, the final
cost of pulp/paper is rising. In addition, fossil fuel consumption causes high CO2 emission into
the atmosphere and strict environmental regulations force mills to reduce their levels of
emission. These are the main incentives to conduct an energy conservation program in a P&P
mill.

14
3 CHAPTER 3: LITERATURE REVIEW
On the basis of the general objectives of this thesis, the literature review is divided into 10
sections: simulation, benchmarking, internal heat recovery, water reutilization, equipment
performance analysis, energy upgrading, energy conversion, trigeneration, selling steam to the
local district, and combining different process integration techniques. The literature is then
synthesized and the specific objectives are presented. The overall methodology to achieve these
objectives is shown. The case studies which are three Canadian Kraft mills are introduced and
characterized.
3.1 Simulation
The first step of any retrofit analysis for energy and water savings is to construct a simulation
that accurately represents the existing configuration of the process (Mateos-Espejel et al., 2010c;
Paris, 2000). A methodology for the development of the Kraft mill simulation has been presented
by Mateos et al. (2010c; 2011d). The information to build the process simulation has been
obtained from mill personnel, PIDs, DCS, process data, and previous studies. The objective of
the simulation is to provide data for energy and water studies and to evaluate the proposed
changes and the implementation of biorefining technologies.
3.2 Benchmarking
A prerequisite step to determine the potential for energy and water savings is benchmarking
(Mateos-Espejel et al., 2011d). A benchmarking study is a comparison of a mill with its
competitors, or with a model mill with new technology. The results of this study constitute a
driving force for further attempts toward water and energy savings, environmental impact
reduction by decreasing effluent production and greenhouse gas emissions, and finally operating
cost reduction (CIPEC, 2008; Francis et al., 2006). Mateos et al. (2011b) established a systematic
approach to perform benchmarking. They defined new key performance indicators based on
exergy analysis to show the areas of inefficiencies. They also used Water and Thermal Pinch
Analysis to target saving. They applied the method on an operating Kraft mill and found that the
steam and water consumption of the mill is beyond average Canadian mills. In the preliminary
results, they also showed that the pressure release valve (PRV) should be replaced by

15
cogeneration and the Thermal and Water Pinch Analyses should be performed to improve the
process efficiency. There is also an energy benchmarking study that has been done by the Pulp
and Paper Research Institute of Canada (Paprican or FPInnovations). They showed the energy
usage for each department, best practices of energy consumption for each department, and the
main causes of energy waste. Their survey is recommended as a good source for Canadian P&P
mills to adopt the best practices (CIPEC, 2008).
3.3 Internal Heat Recovery
International Energy Agency in 1995 defined Process Integration (PI) as the “Systematic and
general methods for designing integrated production systems, ranging from individual processes
to total sites, with a special emphasis on the efficient use of energy and reducing environmental
effects” (Dimian, 2003). There is a broad range of PI techniques available to engineers to
enhance the energy efficiency of a process. In the following sections, the principles of Pinch
Analysis as the main tool for heat recovery and heat exchanger design are explained. The
applications of Pinch Analysis in P&P are presented to reveal the main challenges of applying
this tool. The main challenges regarding the retrofit heat exchanger (HEX) network design using
Pinch Analysis for a water-based process are then described. Finally, the potentials for
improvements are synthesized.
3.3.1 Pinch Analysis
The Pinch Analysis that was developed by Linnhoff et al. at the beginning of the 80’s is the most
common PI technique for analyzing the thermal performance of processes (Linnhoff et al., 1994).
The basis of Pinch Analysis displays in a temperature vs. enthalpy diagram of all possible heat
transfers within the process (Fig. 3-1) and is known as composite curves. It consists of hot and
cold composite curves. The hot composite curve represents all available heat in the process from
hot streams that need to be cooled. The cold composite curve shows all the process heat demands
of cold streams that need to be heated. These curves define the minimum heating requirement
(MHR), minimum cooling requirement (MCR), maximum internal heat recovery, and the Pinch
point. The closest approach between two curves occurs at the Pinch point and is called the
minimum allowable approach temperature (ΔTmin). This value is the minimum acceptable

16
temperature deference between the input and output of hot and cold streams in a HEX (Kemp,
2007; Kumana, 2002).
Fig. 3-1 – Pinch Curves
In order to achieve the targets, such as minimum heating requirement (MHR) and minimum
cooling requirement (MCR) (Fig. 3-1), the heat exchanger network (HEN) design must satisfy
three conditions:
o Don’t use hot utilities below the pinch temperature.
o Don’t use cold utilities above the pinch temperature.
o Don’t transfer heat from hot streams above the pinch to cold streams below the pinch
(Kemp, 2007; Kumana, 2002).
Grand composite curve (GCC) is another way to illustrate the Pinch Analysis and represent the
net heat flows in the process. The main function of the GCC is to identify the availability of the
heat contained in hot effluents, to choose the level of utility for the process (Fig. 3-2), and
consequently the opportunities for cogeneration (Brown et al., 2005; Dhole and Linnhoff, 1993;
Maréchal and Kalitventzeff, 1996, 1997, 1998a, b; Périn-Levasseur et al., 2008) .
T
H
Source
Sink
∆Tmin
Pinchpoint
Maximum Internal HeatRecovery
MHR
MCR

17
Fig. 3-2 - Grand composite curve (GCC) and utility targeting
3.3.2 Application of Pinch Analysis in P&P
Pinch Analysis has been employed to resolve specific problems of P&P, such as improvement in
the efficiency of effluent treatment by reducing effluent temperatures (Noel and Boisvert, 1998)
or the installation of new equipment (Berglin and Berntsson, 1998; Rouzinou et al., 2003). The
heat exchanger network design has also been performed for an operating Kraft process (Lutz,
2008; Mateos-Espejel, 2009; Mateos-Espejel et al., 2010d), mechanical mill (Isaksson et al.,
2012) and for a model mill (Axelsson et al., 2006). According to the American Process (2010),
by applying Pinch Analysis in a chemical pulp, chemical pulp with integrated paper/paperboard,
and combined chemical and mechanical pulp, energy savings of 15-17% can be achieve.
In P&P, there are several energy consumer areas that have received particular attention for heat
integration (like evaporation, cooking, drying, steam generation, water production, etc). In the
case of evaporation and cooking, most of the studies focused on employing the grand composite
curve (GCC) for better heat integration and reduction of steam consumption in this area
(Axelsson et al., 2008; Higa et al., 2009; Périn-Levasseur et al., 2008; Pharande et al., 2011;
Xiao and Smith, 2001). Algehed (2002) and Bengtsson (2004) also presented the concept of
excess heat to be utilized in the evaporation system.
Dryers are one of the major energy users in the P&P process. Improvement in drying heat
integration has mainly been carried out by means of Pinch Analysis (Kemp, 2005),
T
H
GCC
Utility
High pressure steam
Medium pressure steam

18
thermodynamic modelling (Sivill and Ahtila, 2009; Sivill et al., 2005; Söderman and Pettersson,
2003), and a mathematical approach (Pettersson and Söderman, 2007). Kemp (2005) suggested
that the Pinch Analysis can be performed to recover the heat of dryer exhaust air. However, it is
constrained by thermodynamic and economic factors. Apart from steam leakage and heat loss at
the dryer, almost all of the latent heat of steam is transferred to exhaust air. According to Sivill &
Ahtila (2009), all the literature assumed constant heat capacities for the exhaust air of the dryer
while it is not applicable to exhaust air under condensing conditions. The specific heat flow rates
and heat transfer coefficients of this stream are strongly nonlinear (Pettersson and Söderman,
2007). Soderman & Pettersson (2003) studied these effects by means of thermodynamic
modelling. They used temperature intervals to define both the heat transfer flows and the heat
transfer coefficients. Heat recovery from the exhaust air of the dryer has a significant impact on
the whole economy of pulp and papermaking and has been investigated by several researchers
and the industry (Afshar et al., 2012; Kong et al., 2011; Metso, 2011; Pettersson and Söderman,
2007; Sivill and Ahtila, 2009; Sivill et al., 2005; Söderman and Pettersson, 2003). Pettersson &
Soderman (2007) also performed another study combining evolutionary and non-linear
programming for heat recovery within this area. The typical humidity of exhaust air is between
100-200 gH2O/kg of dry air at temperatures of 80-90oC (Pettersson and Söderman, 2007; Sivill
et al., 2005; Söderman and Pettersson, 2003). A portion of its heat content (50-60%) is mainly
used to heat up water to 50-60oC, white water to 55oC and hood supply air to 55-60oC (Metso,
2011; Sivill and Ahtila, 2009; Sivill et al., 2005).
The steam plant is another important area for heat integration. Stack gas of the recovery boiler
and hog fuel power boiler contains water vapor, carbon dioxide, carbon monoxide, sulfur n-
oxide, and chlorine. The main constraint for heat recovery of stack gas is the formation of
sulfuric acid resulting from the condensation of SO2. This acid causes rapid corrosion inside heat
exchangers (HEX) and should be avoided. The other option is to install very expensive HEXs,
which is definitely uneconomical. This stack gas involves a vast quantity of energy (20% fuel
energy) at high quality (180-300oC) and is typically used to pre-heat the air inlet to boilers. It is
recommended that the outlet temperature of stack gas from the HEX (if directed to HEX) should
be at least 20oC above the SO2 dew point to avoid sulfuric acid formation. Based on this, the
temperature dew point was reported between 87-107oC for different stack gases, so the
19
temperature outlet of the stack gas from HEX can be between 107-127oC (Mostajeran Goortani
et al., 2011). Zhelev & Semkov (2004) studied different design contact economizers for the heat
recovery of stack gas.
Several researchers also used GCC to analyze the production and utilization of steam and the
actual requirements of the process in order to increase the power generation capacity using
turbines at the steam plant (Brown et al., 2005; Périn-Levasseur et al., 2008).
3.3.3 Retrofit HEX network design and challenges
Pinch Analysis is typically employed for the retrofit HEX network design. Nevertheless, it does
not completely consider the interrelation between energy and water in water-based processes.
Moreover, there are several constraints within such a system that create difficulty to enhance
energy (steam) savings. These constraints are divided into two categories: physical and process.
Physical constraints encompass the distance between the streams, material, and type of existing
heat exchangers, auxiliary equipment, space requirements, maintenance cost and fouling
(Carlsson et al., 1993). Nordman & Berntsson (2009a) proposed a method to evaluate the
opportunity for heat integration for the retrofit design considering physical constraints and called
it Advanced Composite Curves. It is a method based on Pinch Analysis. They defined four
different curves above the pinch point and four below it. These curves aim to graphically identify
options for retrofit HEN with respect to technical factors. This method evaluates the placement
of heaters and coolers in the existing HEX network. They found that if the existing heaters and
coolers are positioned closer to the pinch point, there is higher potential for cost-effective
retrofit. This method has been applied to identify the heat integration opportunities for the
retrofit design in P&P (Nordman and Berntsson, 2009b; Ruohonen and Ahtila, 2010; Ruohonen
et al., 2010).
There are also process constraints, such as “hard” and “soft” constraints, on temperature levels.
In the hard temperature constraints, for instance temperature of reactor or temperature discharge
of corrosive fluids (as stack gas of recovery boiler), the temperature can only change in a narrow
range of variability. On the other hand, in the case of soft temperature constraints, for instance
temperature of non-corrosive fluids (such as stack gas of the natural gas power boiler), the
temperature can be relaxed easily in a wide range (CETC, 2003). Thus, identification and

20
analysis of these constraints are an essential task before conducting any effort to retrofit the heat
exchanger network (HEN) design so as to design a near optimal HEN.
Pinch Analysis provides the targeting information, such as MHR and MCR, however it requires
significant effort for data extraction, analysis of the data, and constructing the composite curves.
In addition, this targeting (MHR) for water-based processes is not always realistic and is often
far from what can be achieved in practice. For example, Mateos et al. (2011c) estimated 29%
steam saving using Pinch curves for a Kraft mill, but a final steam saving of only 13% was
achieved, which is less than half of the initial estimation. This is mainly due to the physical and
process constraints and also the fact that all of the pinch rules for the retrofit HEN design cannot
be respected. In the other words, the Pinch rules cannot tackle all specific characteristics of the
water-based process to design the HEN. Ruohonene et al. (2009) presented a technique to
determine targeting of energy saving and called it the heat load model for P&P (HLMPP), which
requires less data input. In pinch analysis, the temperatures of start and target and the heat load
of all streams are required whereas HLMPP requires much less data, like the daily production
rate and dry content of the finished product. In this method, a comparison between energy
targeting of HLMPP and current utility consumptions suggests the potential for heat exchanger
network improvement. Nevertheless, this method mainly is applicable for mechanical pulping
(Isaksson et al., 2012; Jönsson et al., 2010; Ruohonen et al., 2009). Savulescu et al. (2012) also
presented a method as an alternative to Composite Curves of Thermal Pinch Analysis and called
it mapping thermal energy integration for retrofit assessment. Since the retrofit HEN design
requires lots of time and effort, targeting and identifying the scope of energy saving are
extremely important.
In non-water based processes, such as a refinery, water is used in the HEN to cool down the
streams, and then is directed to the cooling tower to reject the heat and be reused. In this sense,
the cooling requirement is meaningful. In contrast, in water-based processes, water is employed
in the HEN to cool down the streams and then, in almost all cases, this water is utilized as warm
or hot water in the process. Thus, it could be said that in such processes there is not an actual
cooling requirement. The MCR from Pinch curves is not useful for these processes.

21
Energy is transferred to the process directly (steam injection points) and indirectly (heat
exchangers). An important aspect of interaction of water and energy in water-based processes is
heat exchanging via a non-isothermal mixing (NIM) point and direct heat transfer (Mateos-
Espejel, 2009). For example, the total steam injection in the Kraft process accounts for
approximately 30% of steam consumption (Keshtkar et al., 2013). Savulescu and Alva-Argaez
(2008) have studied the non-isothermal mixing (NIM) points of the Kraft mill. They found that
the contribution of NIM elimination can be up to 5% of the total energy improvements. Mateos
et al. (2010d) eliminated the major NIM at a Kraft mill and saved 5%. Brown et al. (2005) also
proposed some NIM elimination projects to improve the use of utilities in order to generate more
electricity in combined heat and power (CHP). Generally, NIM is often assumed as inevitable
steam consumption and not considered in energy analysis (Savulescu and Alva-Argaez, 2008). In
addition, Pinch Analysis often overlooked the evaluation and targeting of steam saving at NIM
points. Therefore, it cannot give good solutions to reduce the steam as such points.
3.3.4 Synthesis of Internal Heat Recovery
The main potential for improvement of the retrofit HEX network design in the water-based
process can be synthesized as follows:
o It is important to preliminarily assess the existing HEN and the physical constraints in-
depth to improve heat recovery via a new network design.
o Hard and soft constraints regarding the temperature sensitive units should be analyzed so
as to determine the potential for steam saving and design a near optimal HEN.
o A targeting is required ahead of redesigning the existing HEN to provide a realistic
estimation of the final benefit. This should be possible with the least number of data and
effort.
o The NIM that has already been evaluated individually should be included in a systematic
HEN design.
o Pinch rules for the retrofit HEN design are not sufficient to achieve the identified target
due to physical and process constraints. New rules and guidelines are required for this
reason.
o A systematic approach and algorithm is also required to perform the retrofit HEN design.
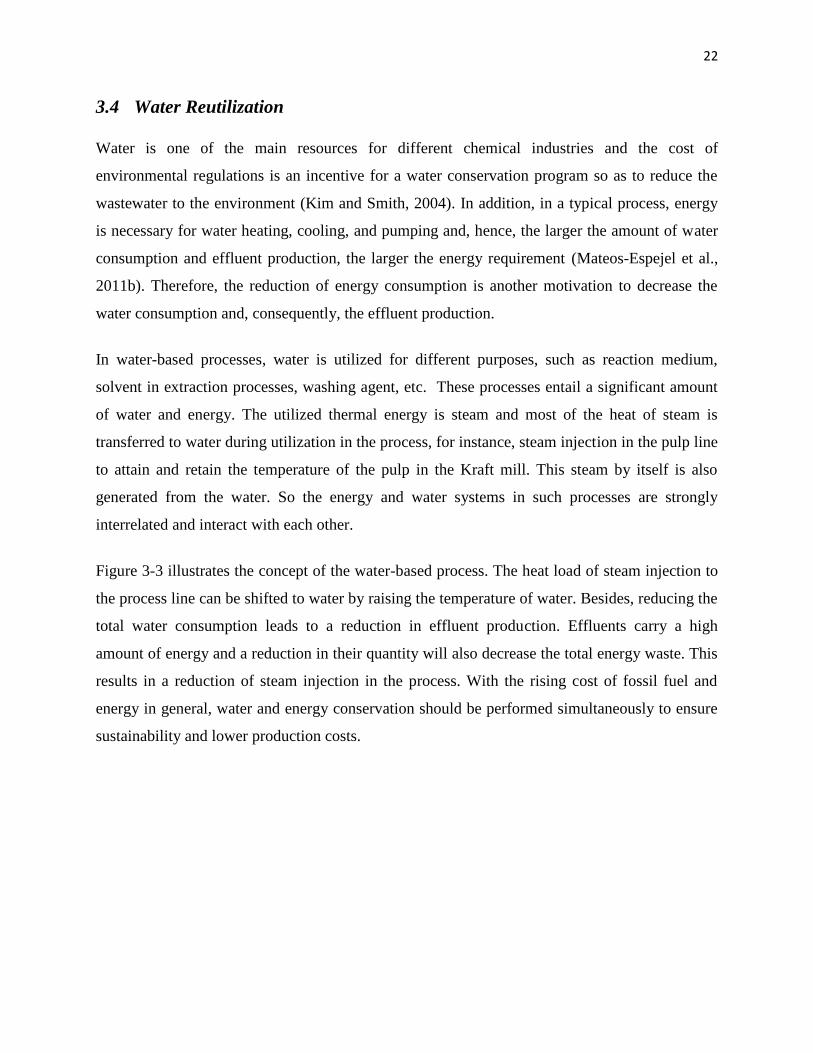
22
3.4 Water Reutilization
Water is one of the main resources for different chemical industries and the cost of
environmental regulations is an incentive for a water conservation program so as to reduce the
wastewater to the environment (Kim and Smith, 2004). In addition, in a typical process, energy
is necessary for water heating, cooling, and pumping and, hence, the larger the amount of water
consumption and effluent production, the larger the energy requirement (Mateos-Espejel et al.,
2011b). Therefore, the reduction of energy consumption is another motivation to decrease the
water consumption and, consequently, the effluent production.
In water-based processes, water is utilized for different purposes, such as reaction medium,
solvent in extraction processes, washing agent, etc. These processes entail a significant amount
of water and energy. The utilized thermal energy is steam and most of the heat of steam is
transferred to water during utilization in the process, for instance, steam injection in the pulp line
to attain and retain the temperature of the pulp in the Kraft mill. This steam by itself is also
generated from the water. So the energy and water systems in such processes are strongly
interrelated and interact with each other.
Figure 3-3 illustrates the concept of the water-based process. The heat load of steam injection to
the process line can be shifted to water by raising the temperature of water. Besides, reducing the
total water consumption leads to a reduction in effluent production. Effluents carry a high
amount of energy and a reduction in their quantity will also decrease the total energy waste. This
results in a reduction of steam injection in the process. With the rising cost of fossil fuel and
energy in general, water and energy conservation should be performed simultaneously to ensure
sustainability and lower production costs.
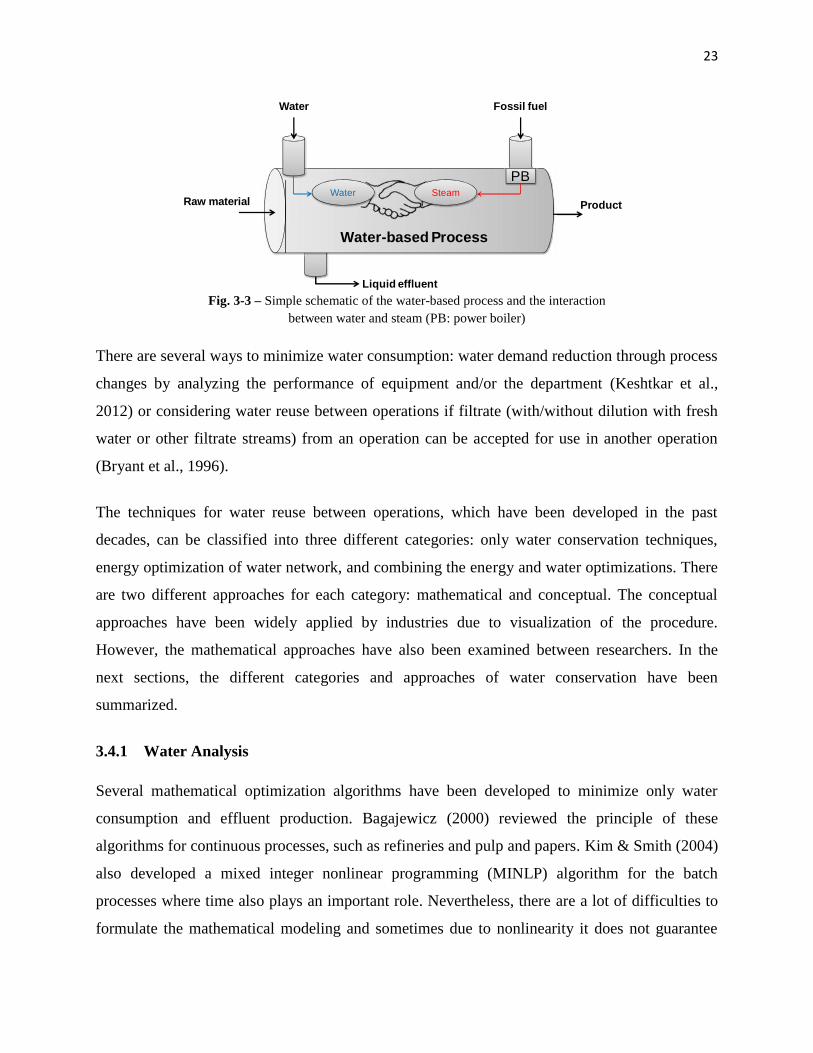
23
Fig. 3-3 – Simple schematic of the water-based process and the interactionbetween water and steam (PB: power boiler)
There are several ways to minimize water consumption: water demand reduction through process
changes by analyzing the performance of equipment and/or the department (Keshtkar et al.,
2012) or considering water reuse between operations if filtrate (with/without dilution with fresh
water or other filtrate streams) from an operation can be accepted for use in another operation
(Bryant et al., 1996).
The techniques for water reuse between operations, which have been developed in the past
decades, can be classified into three different categories: only water conservation techniques,
energy optimization of water network, and combining the energy and water optimizations. There
are two different approaches for each category: mathematical and conceptual. The conceptual
approaches have been widely applied by industries due to visualization of the procedure.
However, the mathematical approaches have also been examined between researchers. In the
next sections, the different categories and approaches of water conservation have been
summarized.
3.4.1 Water Analysis
Several mathematical optimization algorithms have been developed to minimize only water
consumption and effluent production. Bagajewicz (2000) reviewed the principle of these
algorithms for continuous processes, such as refineries and pulp and papers. Kim & Smith (2004)
also developed a mixed integer nonlinear programming (MINLP) algorithm for the batch
processes where time also plays an important role. Nevertheless, there are a lot of difficulties to
formulate the mathematical modeling and sometimes due to nonlinearity it does not guarantee
Water-based Process
Water Fossil fuel
PB
Raw materialSteamWater
Liquid effluent
Product

24
optimality. In addition, it does not provide enough insights on how the water reuse network is
constructed (Dhole, 1998; Wan Alwi and Manan, 2008).
There are broad spectrums of conceptual techniques. To develop the mass transfer equations, an
analogy between mass and heat phenomena has been carried out (Shafiei et al., 2003). Similar to
Pinch Analysis, El-Halwagi and Manousiouthakis (1989) developed the Pinch diagram, which
consists of rich and poor streams so as to determine the minimum quantities of mass separating
agents. El-Halwagi (1997) and El-Halwagi & Spriggs (1998) also presented the principles of
mass integration and mass exchange where the driving force and quantity exchanged are
differences in concentration (vs. temperature in Thermal Pinch) and mass (vs. enthalpy in
Thermal Pinch), respectively. They established the concept of mass exchangers as equipment
with direct-contact mass-transfer to selectively remove certain components (pollutants) from a
rich phase using a lean phase. The lean phases typically consist of solvents, adsorbents, ion
exchange resins or stripping agents, etc. There are different types of mass exchangers including
absorption, adsorption, ion exchange, leaching, stripping, and extraction (El-Halwagi, 1997).
There are three dominating graphical techniques that are known as Water Pinch and can be
distinguished from the literature. Wang & Smith (1994) developed the limiting composite curves
(Fig. 3-4) for the overall plant. These curves have been analogously constructed with Thermal
Pinch Curves and represent contaminant concentration versus contaminant mass load for all
sinks. The fresh water line is drawn against the limiting curve to set the targeting for minimum
fresh water and demand for process. Dhole (1998) pointed out the main drawbacks of this
technique, which makes it impractical in many situations. The x-axis represents mass
contaminant; however, it does not give any direct information about water flowrate. Likewise,
the curves do not offer guidelines regarding mixing and reuse of water. Cleaning and separating
operations, such as washing, extraction, etc., can be analyzed by limiting composite curves while
several operations, such as reactors, boilers, etc., cannot be modeled by means of this technique.
In addition, if there is any gain or loss of water in the process, it cannot be described (Hallale,
2002). Dhole et al. (1998; 1996) created another technique to assist the development of a system
closure. In this technique, all of the water sinks (demands) and sources (supplies) are represented
in a graphical or tabular form, in terms of contaminant concentration versus flowrate of the water
sinks and sources (Fig. 3-5). There is a possibility to directly identify the potential for

25
reutilization and/or regeneration. The water pinch locates the point where two curves touch. It is
used to identify and target fresh water consumption and effluent production. Nevertheless, it can
be altered by mixing source streams or diluting the source streams with fresh water. Therefore,
the targeting values are also changing during these mixing procedures and, hence, are not
reliable. This technique can be easily applied to water-based processes, such as the Kraft pulping
process where the main streams content of the desired product are enriched by reducing the level
of contamination through a succession of operations, such as dilution, displacement or thickening
(Shafiei et al., 2003). El-Halwagi et al. (2003) presented another graphical technique to minimize
the use of fresh resources and determine an accurate target for fresh water consumption and
effluent production. The graph is visualized as a load of contaminant in a mass unit versus the
flowrate for all sinks and sources of the overall process (Fig. 3-6). Similar to Thermal Pinch
Analysis, they established some rules: fresh water is employed in the sinks below the pinch point
and unused sources are discharged above the pinch point.
Fig. 3-4 – Limiting composite curves (concentration vs. contaminant mass load of sinks) ofWang & Smith (1994)
Conc
entr
atio
n
Contaminant mass load
Limiting composite curve
Water supply line
Pinch
Minmum overallflowrate
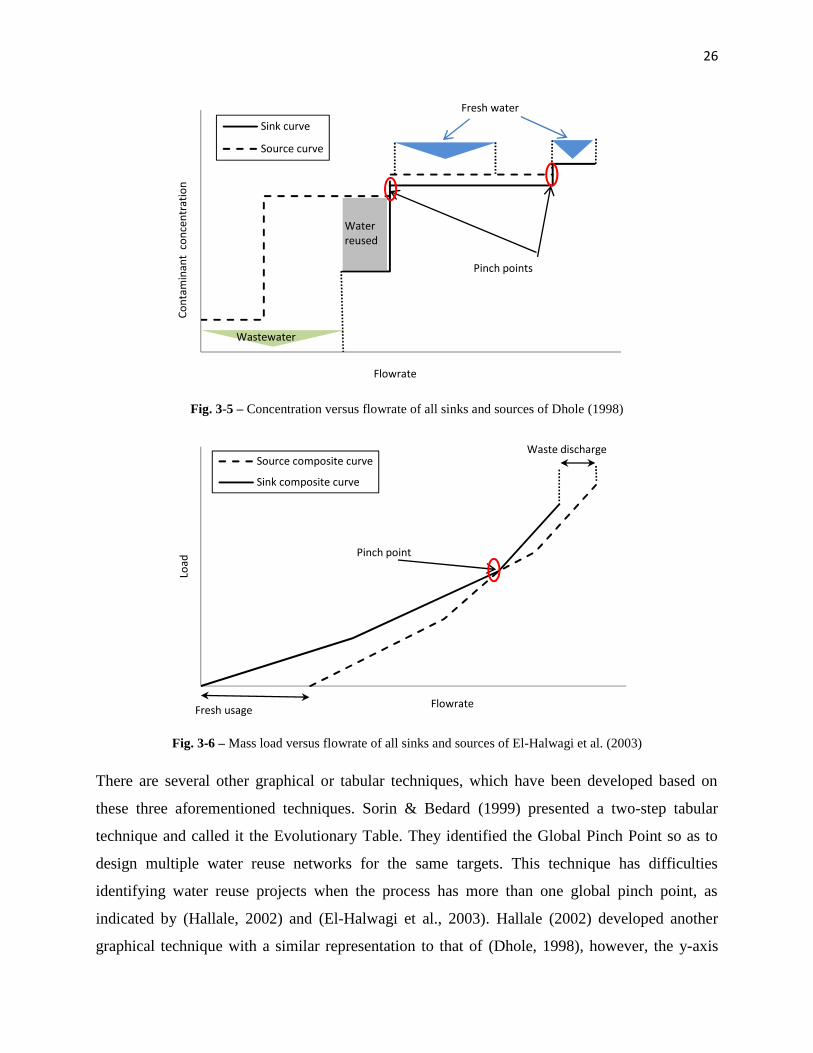
26
Fig. 3-5 – Concentration versus flowrate of all sinks and sources of Dhole (1998)
Fig. 3-6 – Mass load versus flowrate of all sinks and sources of El-Halwagi et al. (2003)
There are several other graphical or tabular techniques, which have been developed based on
these three aforementioned techniques. Sorin & Bedard (1999) presented a two-step tabular
technique and called it the Evolutionary Table. They identified the Global Pinch Point so as to
design multiple water reuse networks for the same targets. This technique has difficulties
identifying water reuse projects when the process has more than one global pinch point, as
indicated by (Hallale, 2002) and (El-Halwagi et al., 2003). Hallale (2002) developed another
graphical technique with a similar representation to that of (Dhole, 1998), however, the y-axis
Cont
amin
ant
conc
entr
atio
n
Flowrate
Sink curve
Source curve
Pinch points
Fresh water
Wastewater
Waterreused
Load
Flowrate
Source composite curve
Sink composite curve
Waste discharge
Fresh usage
Pinch point

27
displayed purity of water rather than contaminant concentration. He constructed a water surplus
diagram by analogy with the Grand Composite Curve of Thermal Pinch Analysis. Nevertheless,
it requires substantial computation to develop the graphs. Manan et al. (2004) developed another
technique based on the (Hallale, 2002)’s technique and called it water cascade analysis (WCA).
Wan Alwi & Manan (2008) presented the network allocation diagram (NAD), which was a
generic approach based on the technique of El-Halwagi et al. (2003).
3.4.2 Water and energy analysis
Several studies have been dedicated to develop the water-energy oriented techniques so as to
combine water and energy optimization. Two different approaches can be distinguished from the
literature: those that just focused on the development of an efficient water production network
and its HEX network and those that comprised both water network closure aspects and the water
production network with its HEX network.
3.4.2.1 Heat integration of water production network
The first type of study is associated with energy integration within the water networks and
addresses the ways for the production of hot and warm water process requirements. Savulescu et
al. (2002) proposed a technique based on the thermodynamic approach and Pinch Analysis to
design the water network. They introduced the concept of direct/indirect heat recovery to design
the heat exchanger network and non-isothermal mixing. They developed source-demand energy
composite curves by analogy to the (Dhole, 1998) technique for water reutilization networks.
These curves represented temperature (vs. contaminant concentration in Dhole’s technique)
versus flowrate for all clean water sources and demands (Fig. 3-7). These curves were used as a
tool for stream mixing. Savulescu et al. (2005a) also presented a technique to decrease the
number of heat exchangers for water production based on the stream mixing. Nordman &
Berntsson (2006) studied the hot and warm water tanks of the Kraft process. They added the
warm/hot water tank curve to hot and cold Pinch composite curves so as to maximize excess heat
for the process.
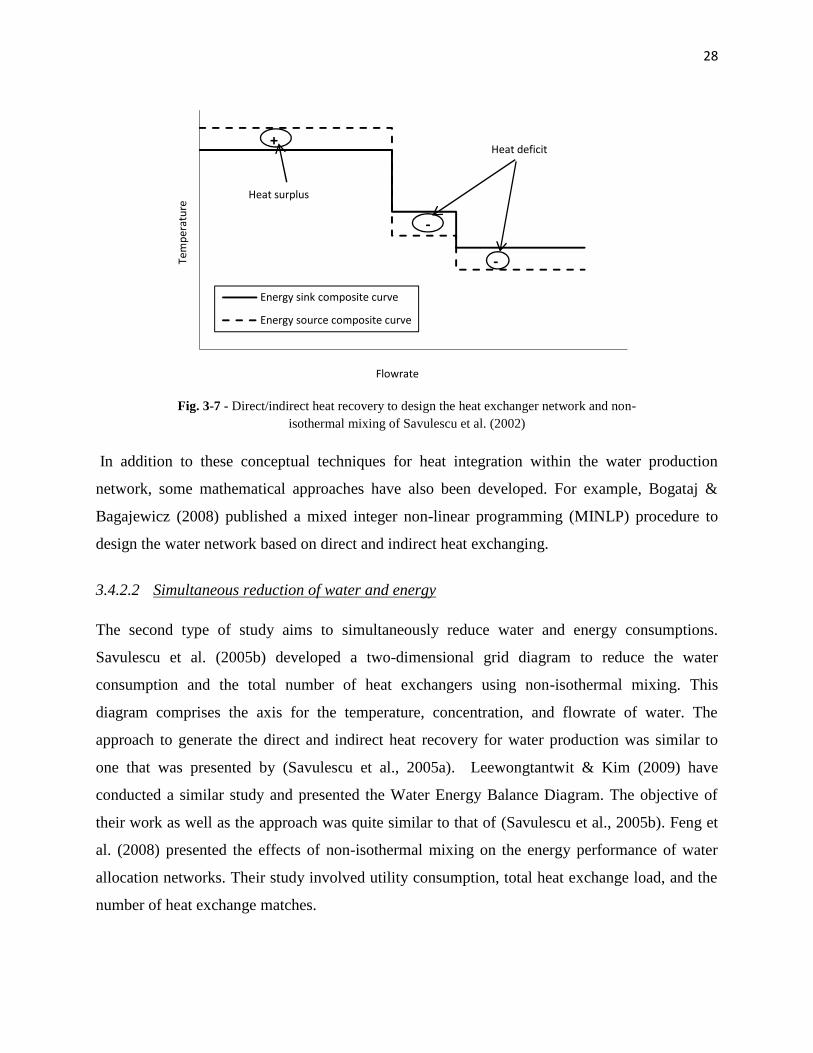
28
Fig. 3-7 - Direct/indirect heat recovery to design the heat exchanger network and non-isothermal mixing of Savulescu et al. (2002)
In addition to these conceptual techniques for heat integration within the water production
network, some mathematical approaches have also been developed. For example, Bogataj &
Bagajewicz (2008) published a mixed integer non-linear programming (MINLP) procedure to
design the water network based on direct and indirect heat exchanging.
3.4.2.2 Simultaneous reduction of water and energy
The second type of study aims to simultaneously reduce water and energy consumptions.
Savulescu et al. (2005b) developed a two-dimensional grid diagram to reduce the water
consumption and the total number of heat exchangers using non-isothermal mixing. This
diagram comprises the axis for the temperature, concentration, and flowrate of water. The
approach to generate the direct and indirect heat recovery for water production was similar to
one that was presented by (Savulescu et al., 2005a). Leewongtantwit & Kim (2009) have
conducted a similar study and presented the Water Energy Balance Diagram. The objective of
their work as well as the approach was quite similar to that of (Savulescu et al., 2005b). Feng et
al. (2008) presented the effects of non-isothermal mixing on the energy performance of water
allocation networks. Their study involved utility consumption, total heat exchange load, and the
number of heat exchange matches.
Tem
pera
ture
Flowrate
Energy sink composite curve
Energy source composite curve
+
-
-
Heat deficit
Heat surplus

29
Manan et al. (2009) presented a sequential technique to minimize water and energy by
combining numerical and graphical approaches. First of all, the water cascade analysis (WCA) of
(Manan et al., 2004; Wan Alwi and Manan, 2008) and Water Pinch in cumulative mass
contaminant versus the flowrate of all sinks and sources of (El-Halwagi et al., 2003) have been
employed to determine the water reutilization opportunities. Then similar to the source-demand
energy composite curves of (Savulescu et al., 2002), they developed a diagram and called it the
“heat surplus diagram”. They constructed it for both above and below the pinch concentration
point of the Water Pinch diagram. This diagram is a representation of temperature versus
flowrate of all sinks and sources in the process and is used to extract stream data for the heat
exchanger design of the water network by means of Thermal Pinch Analysis.
Wan Alwi et al. (2011) presented a graphical approach (Fig. 3-8) called superimposed mass and
energy curves (SMEC). It includes a combination of the cumulative mass load contaminant
versus the cumulative flowrate of (El-Halwagi et al., 2003) and temperature versus flowrate of
(Savulescu et al., 2002) and (Manan et al., 2009) for all the sinks and sources of the process. The
pinch point has been identified by means of cumulative mass load versus flowrate curves. In
addition, these curves were employed to determine the water reutilization opportunities. Similar
to the study of (Manan et al., 2009), the temperature versus flowrate curves are mainly used to
extract stream data for the heat exchanger design of the water network using Thermal Pinch
Analysis. Cortes et al. (2011) presented another sequential technique; water reutilization
potentials were identified and then temperature versus enthalpy curves for all sinks and sources
were developed so as to determine the heat recovery potential for a sugar mill.

30
Fig. 3-8 - Superimposed mass and energy curves (SMEC) of Wan Alwi et al. (2011)
Similar conceptual techniques also have been developed by coupling the three different Water
Pinch analyses (Dhole, 1998; El-Halwagi et al., 2003; Wang and Smith, 1994), Thermal Pinch
Analysis (Linnhoff et al., 1994), and other heuristic approaches and applied specifically in P&P
processes. Savulescu et al. (2005c) used the Pinch Analyses to decrease water and energy
consumption of a Kraft P&P mill with a payback period of less than one year. Wising et al.
(2005) studied a P&P mill to reduce the hot water consumption and, consequently, diminish
steam consumption for hot water production. As a result, the excess heat availability increased
and was used for the evaporation system.
Mateos et al. (2010a, b) have performed an interaction study between the water and energy
system of a P&P mill. They applied the Water and Thermal Pinch Analyses in sequence and
showed that the implementation of water reutilization projects had some synergistic effects on
total energy and steam consumption. In addition, it could change the Thermal Pinch Composite
Curves and reduce the minimum heating requirement (MHR); however the maximum cooling
requirement (MCR) increased.
Alva-Argaez et al. (2007) developed a technique, which is called combined energy and water
optimization (CEWO), to identify water and energy efficiency improvements based on the fresh
water reduction path with the highest energy savings response. CEWO evaluates first the energy-
based water and energy targets of the base case and identified inefficiencies (Alva-Argaez et al.,
Cum
ulat
ive
mas
s loa
d
Cumulative flowrate
Source Water Sink waterSource Temperature Sink temperature
Tem
pera
ture
++
+
-
-
-
Heat surplusHeat deficit
31
2008). Secondly, this technique employs the contaminant concentration versus flowrate of
(Dhole, 1998) to identify areas of opportunity for improving the water efficiency through
reuse/recycle (Alva-Argaez and Savulescu, 2009). Hot and warm water tanks have been analyzed
to reduce the saved water from the paths with the highest steam savings (Alva-Argaez et al.,
2007).
Some studies have also been carried out using mathematical optimization to minimize the water
and energy consumption. Bagajewicz et al. (2002) developed a two-step model: a linear
programming (LP) model was first solved to synthesize the water closure and then a mixed
integer linear programming (MILP) model was established for the construction of a heat
exchanger network as well as stream mixing. Leewongtanawit and Kim (2008) presented an
optimization algorithm considering multi-contaminants based on the technique proposed by
(Savulescu et al., 2005a, b). Dong et al. (2008) also developed multi-contaminant water-
allocation and a heat exchange network using mixed integer non-linear programming (MINLP)
to minimize the total annual cost. Feng et al. (2009) investigated a sequential mathematical
modeling to synthesize water allocation and heat exchanger networks. Boix et al. (2012) also
solved an MILP model consisting of two steps to reduce the number of interconnections, water
consumption and heat exchangers. Chew et al. (2013) presented an MINLP model to reduce
water consumption at brownstock washing of a P&P mill. The energy implication of this
reduction has also been assessed.
3.4.3 Water and energy in non-isothermal mixing points
As mentioned earlier, several studies have investigated the effect of non-isothermal mixing
(NIM) points (Mateos-Espejel, 2009; Mateos-Espejel et al., 2011c; Savulescu and Alva-Argaez,
2008). Generally, these NIM points occur in process line that contains significant amount of
water and/or in water production network. The negative effects of these direct steam injections
can be eliminated or reduced to save steam. Therefore, they should be included in water and
energy analysis technique.
32
3.4.4 Water and energy in condensate recovery
Steam and condensate are good examples of the direct link between water and energy systems.
Mateos et al. (2010d, 2011c) have conducted a study about condensate recovery in a Kraft mill.
They found that the reutilization of the condensate could save up to 32 % of the current water
consumption at a steam plant and less than 1% of energy consumption. Sometimes, there is not
enough attention given to the condensate return. Thus, there is a need for good management of
the condensate return; the more condensate that returns to the boiler, the less makeup water is
required (Savulescu and Kim, 2008).
3.4.5 Synthesis of water and energy analyses
Similar to energy, the cost of fresh water resources, the quality and availability of it should be
considered in the total site analysis for ensuring sustainability and cost-effective operation
(Savulescu and Kim, 2008). Besides, the existing configuration and utility infrastructure as
existing constraints have to be taken into account at the preliminary level to ensure that all design
changes have positive contributions to the process savings and a reasonable trade-off with
investment costs. However, these parameters, to identify the water closure measures, have not
been considered in most of the studies. Many studies tried to reduce the energy without showing
the existing configuration for the hot and warm production network. Neglecting the existing
infrastructures may lead to a different hot and warm water production network than the current
one and impose unnecessary costs for the heat exchanger network. Ideally, the hot and warm
water should be produced at an even higher temperature than they are under the current
conditions. This can be done with the existing water network and its heat exchanger network by
only adjusting the flowrate to and temperature for the heat exchangers and water tanks after a
reduction of the water requirement. In addition, to design the water network, all the waste
streams, including the stack gas of boilers, etc., should be considered to produce the hot and
warm water, and not only the liquid effluents.
Many authors considered the cleanest to cleanest approach for filtrate reutilization and also
restricted the water reutilization at above or below the Water Pinch Point (El-Halwagi et al.,
2003; Wan Alwi et al., 2011; Wan Alwi and Manan, 2008). The cleanest filtrate may exist at the
beginning of the process and it cannot be reutilized at the next stage of the process. For example,
33
in the process with several washers, the filtrate from washer #1 might be cleaner than washer #3
in terms of contaminant concentration but due to respecting countercurrent flow it cannot be used
in washer #2. Besides, in a real process the acceptable contaminant concentration along the
process may change, thus the water pinch point should not be a barrier for filtrate reutilization
and countercurrent flow should be respected.
Most of these studies did not provide systematic guidelines for water mixing. The guidelines for
each process should be specific to that process, for example, the ones that can be applicable for
P&P might not be applicable for the food industry due to the sensitive product of the latter. On
the contrary, the targeting aspect received a lot of attention from many researchers (El-Halwagi
et al., 2003; Hallale, 2002). Although having a good estimation before doing the whole analysis
could give some insight, it is not, however, as important as a systematic and practical guideline
for water reutilization and mixing.
Most water-based processes entail water not only in quantity and purity but also by temperature
(Cortés et al., 2011; Feng et al., 2009). In terms of the temperature of the water supply for
different demands, the acceptable temperature of water and filtrate should be analyzed carefully
and not just considering the fixed-supply temperatures as a limitation for filtrate reutilization and
hot or warm water usage. However, the main objective to incorporate the temperature curves in
water analysis (Manan et al., 2009; Wan Alwi et al., 2011) was to supply water and filtrate at a
fixed temperature. Therefore, this resulted in purchasing other heat exchangers or pre-heating the
filtrate before reutilization, both of which are not efficient.
In most of these studies for reducing the water consumption in the process, the global process
energy implications of water closure have not been analyzed. The implementation of water
saving measures may have serious effects on the thermal balance of the process. For example,
the steam consumption may be reduced, the cooling demand may be increased, and the effluent
temperature may rise (Mateos-Espejel, 2009; Mateos-Espejel et al., 2010a, b). The default of
these approaches is that they do not consider water as a heat source, and this important element
of the thermal problem is often ignored.
34
Many studies are also complex, time consuming, and involve unnecessary computations, such as
following different paths to reduce the water production in CEWO (Alva-Argaez and Savulescu,
2009), applying Water and Thermal Pinch Analyses in sequence that require constructing the
Thermal Pinch Curves twice (Mateos-Espejel et al., 2010a, b; Mateos-Espejel et al., 2011c), or
constructing water purity versus flowrate and a water surplus diagram (Hallale, 2002). Most of
the techniques applied to generic cases (Savulescu et al., 2005a, b) and, in fact, they are suited
for small problems. However, the existing configuration, constraints for reutilization of filtrates
and other constraints regarding the operating conditions as well as the existing water production
network have not been considered. Mostly, the water network has been synthesized without
considering the interactions with the rest of the process.
The quality of data used is one of the major challenges for water analysis. The acceptable
temperature and contaminant concentrations should be accomplished by a systematic approach.
Each set of data should consider the characteristics of each type of process, for instance, the
acceptable contaminant concentration for the sinks of one Kraft mill cannot be used for another
mill because each mill has its own features. In this sense, systematic guidelines for extracting
the data for water analysis of a water-based process should be developed.
3.4.6 Water reutilization in Pulp & Paper
Generally, closing the water system in a P&P mill has several advantages, such as reducing the
total fresh water and steam consumption, discharging less wastewater to the environment,
lowering the total amount of chemical consumption, and less fiber losses.
3.4.6.1 Application of water-energy oriented process integration to Kraft P&P
The process areas with the greatest potential for fresh water reduction in a Kraft mill have been
identified in the bleach plant and the pulp/paper machines (Bryant et al., 1996). Several water
reutilization opportunities for P&P processes and in particular in the Kraft process have been
presented in the Simons Ltd monograph (Turner et al., 2001). Non-clean condensate from the
surface condenser of the evaporation system could be replaced by all or part of the clean water
that is utilized at the brown stock washing system. Another option for water reduction in washing
systems was to use the countercurrent flow to exploit the filtrate effectively, reduce clean water

35
consumption, and increase the quantity of black liquor towards the recovery boiler (Chew et al.,
2013; Turner et al., 2001).
Ideally, at the bleaching section, there should not be any water usage except for the last stage
washer nor any overflow from the filtrate tank except at the first and second stages (acidic and
alkaline effluent). Since most steam injection in the pulp is carried out in bleaching, the
reduction in water consumption leads also to a reduction in steam consumption. Thus, this is the
main motivation to reduce water consumption at the bleaching section. Simons Ltd monograph
proposed three major water recycling approaches at the bleaching section, direct countercurrent,
jump-stage countercurrent, and split-flow jump-stage countercurrent. In direct countercurrent
water was used in the final washer and filtrate from each stage was recycled to the preceding one
(D2 filtrate to E2 washer). In Jump-stage countercurrent, the filtrate of each stage was recycled
except the preceding stage, which was skipped (jumped) (D2 filtrate to D1 washer). Split-flow
jump-stage countercurrent was the combination between these two previous approaches (D2
filtrate to E2 and D1 washers) (Turner et al., 2001). Shukla et al. (2012) also proposed a similar
approach to split-flow jump-stage countercurrent. They used water cascade analysis to reduce
water consumption and improve water efficiency at the bleaching section. They analyzed
different parameters and found that adsorbable organic halides (AOX) are the critical limiting
constraint for the reutilization of filtrates at bleaching sequences. However, water saving could
be achieved by the reutilization of filtrate of each stage in the preceding stage or even in the
stage before the preceding one (Shukla et al., 2012). It is important to stress that sometimes this
strategy for water reutilization requires neutralizing or using an antichlor, such as SO2, before the
reutilization of bleaching filtrate. Other common water conservation projects in this department
were the use of filtrate at wire cleaning and pump standpipe dilution, and the reuse of machine
white water. In addition, the use of D0 filtrate on the pre-bleach washer has been receiving more
attention recently (Mateos-Espejel et al., 2010b; Turner et al., 2001).
Several opportunities for water reduction at the pulp/paper machine have been identified by
effective reutilization of white water. Another way to reduce water at this section was to reutilize
the vacuum seal water. The opportunities for water reduction at the recovery loop can be
summarized as the reuse of non-clean condensate from evaporation, the reuse of alkaline liquor,
and vacuum pump seal water (Mateos-Espejel et al., 2010b; Mateos-Espejel et al., 2011a;
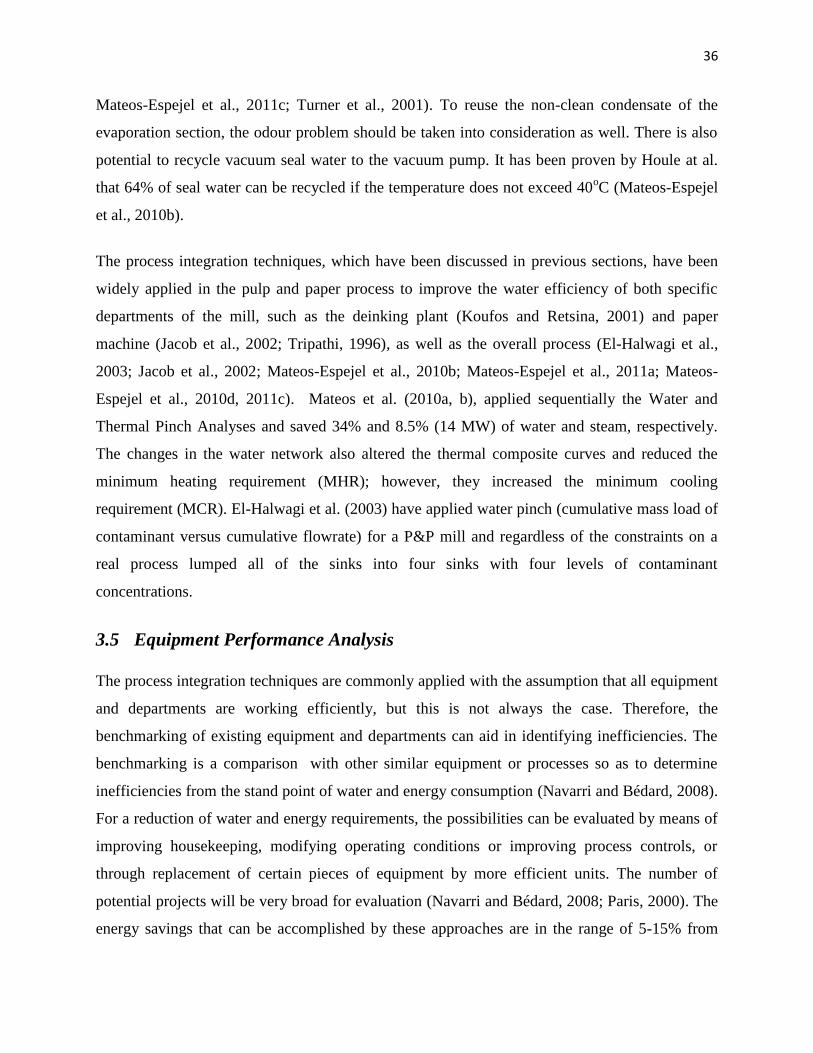
36
Mateos-Espejel et al., 2011c; Turner et al., 2001). To reuse the non-clean condensate of the
evaporation section, the odour problem should be taken into consideration as well. There is also
potential to recycle vacuum seal water to the vacuum pump. It has been proven by Houle at al.
that 64% of seal water can be recycled if the temperature does not exceed 40oC (Mateos-Espejel
et al., 2010b).
The process integration techniques, which have been discussed in previous sections, have been
widely applied in the pulp and paper process to improve the water efficiency of both specific
departments of the mill, such as the deinking plant (Koufos and Retsina, 2001) and paper
machine (Jacob et al., 2002; Tripathi, 1996), as well as the overall process (El-Halwagi et al.,
2003; Jacob et al., 2002; Mateos-Espejel et al., 2010b; Mateos-Espejel et al., 2011a; Mateos-
Espejel et al., 2010d, 2011c). Mateos et al. (2010a, b), applied sequentially the Water and
Thermal Pinch Analyses and saved 34% and 8.5% (14 MW) of water and steam, respectively.
The changes in the water network also altered the thermal composite curves and reduced the
minimum heating requirement (MHR); however, they increased the minimum cooling
requirement (MCR). El-Halwagi et al. (2003) have applied water pinch (cumulative mass load of
contaminant versus cumulative flowrate) for a P&P mill and regardless of the constraints on a
real process lumped all of the sinks into four sinks with four levels of contaminant
concentrations.
3.5 Equipment Performance Analysis
The process integration techniques are commonly applied with the assumption that all equipment
and departments are working efficiently, but this is not always the case. Therefore, the
benchmarking of existing equipment and departments can aid in identifying inefficiencies. The
benchmarking is a comparison with other similar equipment or processes so as to determine
inefficiencies from the stand point of water and energy consumption (Navarri and Bédard, 2008).
For a reduction of water and energy requirements, the possibilities can be evaluated by means of
improving housekeeping, modifying operating conditions or improving process controls, or
through replacement of certain pieces of equipment by more efficient units. The number of
potential projects will be very broad for evaluation (Navarri and Bédard, 2008; Paris, 2000). The
energy savings that can be accomplished by these approaches are in the range of 5-15% from
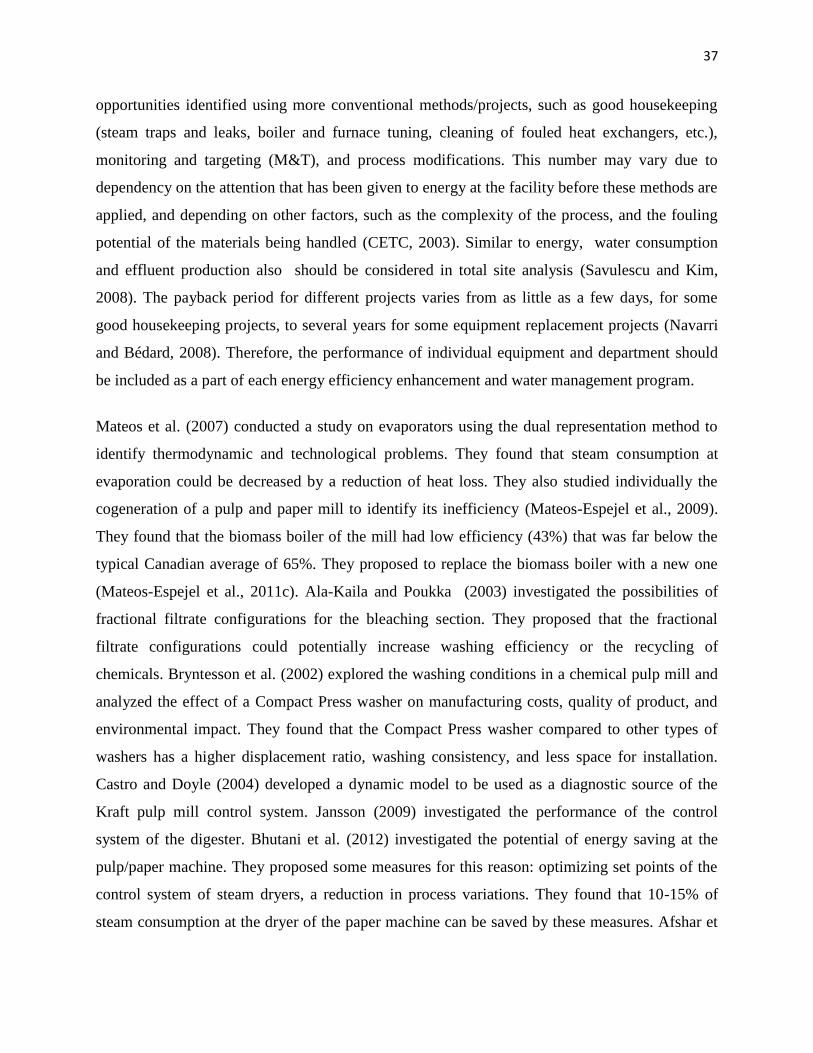
37
opportunities identified using more conventional methods/projects, such as good housekeeping
(steam traps and leaks, boiler and furnace tuning, cleaning of fouled heat exchangers, etc.),
monitoring and targeting (M&T), and process modifications. This number may vary due to
dependency on the attention that has been given to energy at the facility before these methods are
applied, and depending on other factors, such as the complexity of the process, and the fouling
potential of the materials being handled (CETC, 2003). Similar to energy, water consumption
and effluent production also should be considered in total site analysis (Savulescu and Kim,
2008). The payback period for different projects varies from as little as a few days, for some
good housekeeping projects, to several years for some equipment replacement projects (Navarri
and Bédard, 2008). Therefore, the performance of individual equipment and department should
be included as a part of each energy efficiency enhancement and water management program.
Mateos et al. (2007) conducted a study on evaporators using the dual representation method to
identify thermodynamic and technological problems. They found that steam consumption at
evaporation could be decreased by a reduction of heat loss. They also studied individually the
cogeneration of a pulp and paper mill to identify its inefficiency (Mateos-Espejel et al., 2009).
They found that the biomass boiler of the mill had low efficiency (43%) that was far below the
typical Canadian average of 65%. They proposed to replace the biomass boiler with a new one
(Mateos-Espejel et al., 2011c). Ala-Kaila and Poukka (2003) investigated the possibilities of
fractional filtrate configurations for the bleaching section. They proposed that the fractional
filtrate configurations could potentially increase washing efficiency or the recycling of
chemicals. Bryntesson et al. (2002) explored the washing conditions in a chemical pulp mill and
analyzed the effect of a Compact Press washer on manufacturing costs, quality of product, and
environmental impact. They found that the Compact Press washer compared to other types of
washers has a higher displacement ratio, washing consistency, and less space for installation.
Castro and Doyle (2004) developed a dynamic model to be used as a diagnostic source of the
Kraft pulp mill control system. Jansson (2009) investigated the performance of the control
system of the digester. Bhutani et al. (2012) investigated the potential of energy saving at the
pulp/paper machine. They proposed some measures for this reason: optimizing set points of the
control system of steam dryers, a reduction in process variations. They found that 10-15% of
steam consumption at the dryer of the paper machine can be saved by these measures. Afshar et

38
al. (2012) also proposed further water removal prior to drying by analyzing the effects of vacuum
in the forming sections of paper machine. They found that 20% of steam can be saved by
reducing 5% of moisture in the sheet to dryer and also 1.34% of dryer steam consumption can be
diminished by eliminating over drying of the sheet. In the case of the steam plant, it has been
suggested to flash the boiler blowdown water in a flash tank to recover its clean low pressure
(LP) steam, and then this LP steam could be used in deaerators or make-up water heaters
(NCDENR, 2004).
3.6 Energy Upgrading
Energy saving can be obtained by internal heat recovery. However, there are large amounts of
low quality heat available in process. This heat typically cannot be recovered by means of HEX
networks. The PI tools to recover this heat are heat pumps. They are installed to upgrade the low
potential heat at low temperature to high potential heat at high temperature (Bakhtiari et al.,
2010a, b; Costa et al., 2009; Costa et al., 2004). There are two types of heat pumps: vapor
recompression and absorption (Fig. 3-9). The vapor recompression heat pump (VRHP) consists
of a closed loop with a carrying fluid (refrigerant). This fluid recovers the low potential heat
(QE) from an evaporator (E) and transfers it to a condenser (C) at a quantity of QC. The heat
pump driving force is the compressor, which is a pressure raising device (PRD) and is driven by
an electrical motor or turbine (Bakhtiari et al., 2010a, b; Costa et al., 2009; Costa et al., 2004).
On the other hand, absorption heat pumps (AHP) are emerging as a potential alternative to this
mechanical device. The AHPs can upgrade low potential heat (QE) from the evaporator (E) by
employing the effect of pressure (Fig. 3-10) on an absorption–desorption cycle to reach the
temperature lift from the heat source to the heat sink (Bakhtiari et al., 2010a; Costa et al., 2009;
Costa et al., 2004). In contrast to VRHP, they are thermally driven by heat (QG) to the generator
(G) and can be operated with low electricity consumption (Mateos-Espejel, 2009). A two-
component solution is circulated in this scheme to transfer the heat. In the low temperature
processes, such as the Kraft process, the common solutions are H2O/LiBr or H2O/NH3. The heat
(QA+QC) that is released to the condenser (C) and absorber (A) and used in heat sink(s) has the
same pressure and temperature (Fig. 3-10) (Bakhtiari et al., 2010a, b; Costa et al., 2009; Costa et
al., 2004). In addition, a combination of streams can be considered as the heat sinks or heat
sources (Bakhtiari et al., 2010b).
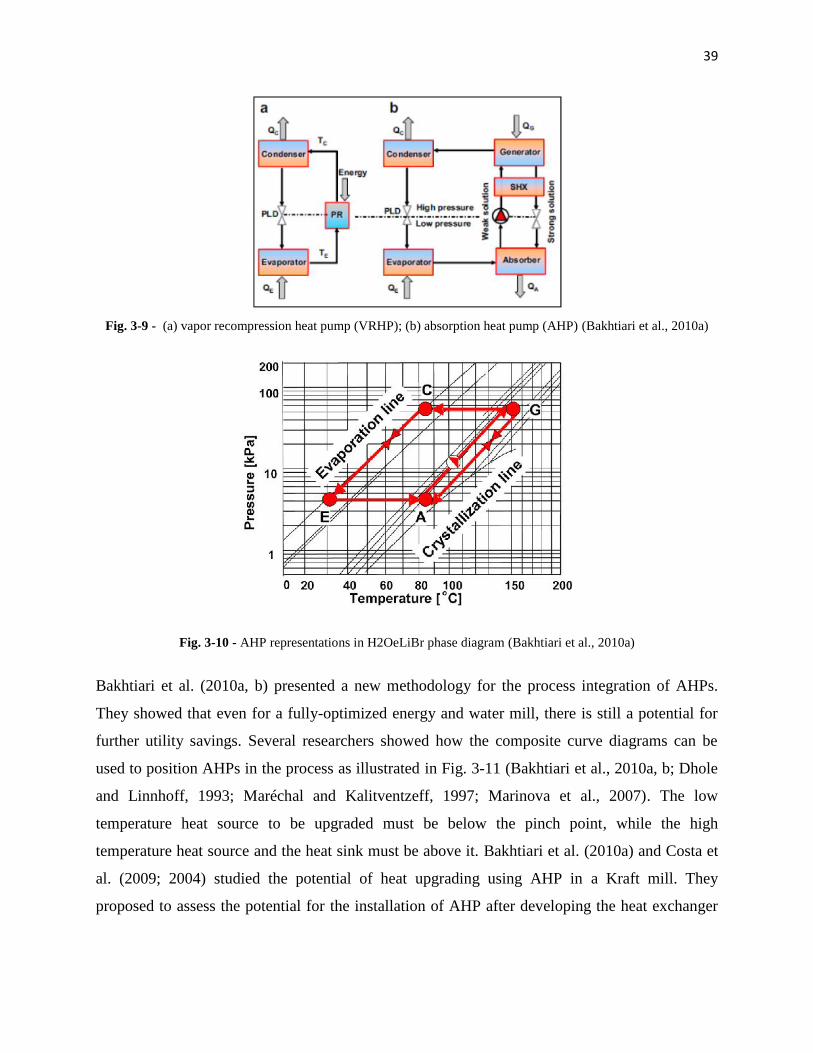
39
Fig. 3-9 - (a) vapor recompression heat pump (VRHP); (b) absorption heat pump (AHP) (Bakhtiari et al., 2010a)
Fig. 3-10 - AHP representations in H2OeLiBr phase diagram (Bakhtiari et al., 2010a)
Bakhtiari et al. (2010a, b) presented a new methodology for the process integration of AHPs.
They showed that even for a fully-optimized energy and water mill, there is still a potential for
further utility savings. Several researchers showed how the composite curve diagrams can be
used to position AHPs in the process as illustrated in Fig. 3-11 (Bakhtiari et al., 2010a, b; Dhole
and Linnhoff, 1993; Maréchal and Kalitventzeff, 1997; Marinova et al., 2007). The low
temperature heat source to be upgraded must be below the pinch point, while the high
temperature heat source and the heat sink must be above it. Bakhtiari et al. (2010a) and Costa et
al. (2009; 2004) studied the potential of heat upgrading using AHP in a Kraft mill. They
proposed to assess the potential for the installation of AHP after developing the heat exchanger
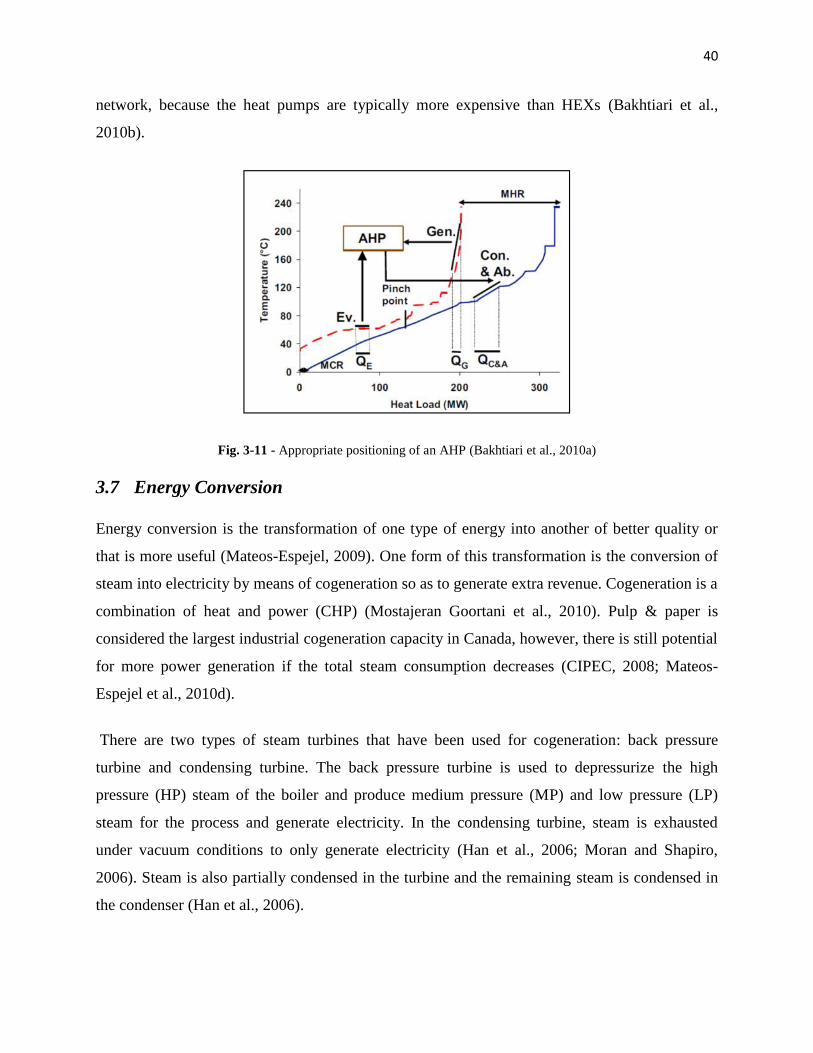
40
network, because the heat pumps are typically more expensive than HEXs (Bakhtiari et al.,
2010b).
Fig. 3-11 - Appropriate positioning of an AHP (Bakhtiari et al., 2010a)
3.7 Energy Conversion
Energy conversion is the transformation of one type of energy into another of better quality or
that is more useful (Mateos-Espejel, 2009). One form of this transformation is the conversion of
steam into electricity by means of cogeneration so as to generate extra revenue. Cogeneration is a
combination of heat and power (CHP) (Mostajeran Goortani et al., 2010). Pulp & paper is
considered the largest industrial cogeneration capacity in Canada, however, there is still potential
for more power generation if the total steam consumption decreases (CIPEC, 2008; Mateos-
Espejel et al., 2010d).
There are two types of steam turbines that have been used for cogeneration: back pressure
turbine and condensing turbine. The back pressure turbine is used to depressurize the high
pressure (HP) steam of the boiler and produce medium pressure (MP) and low pressure (LP)
steam for the process and generate electricity. In the condensing turbine, steam is exhausted
under vacuum conditions to only generate electricity (Han et al., 2006; Moran and Shapiro,
2006). Steam is also partially condensed in the turbine and the remaining steam is condensed in
the condenser (Han et al., 2006).

41
The back pressure turbine is installed when a boiler produces more than 1.36 t/h of steam and the
difference between the pressure of the boiler steam outlet and the distribution network is more
than 690 kPa (US.DOE, 2012).
There are several studies that have been dedicated to the proper installation of cogeneration.
Sarimveis et al. (2003) developed a mixed integer linear programming (MILP) algorithm to
minimize the cost of cogeneration in P&P mills. Bhattacharyya & Hien (2005) assessed the
economic feasibility of cogeneration in P&P mills and considered the case of selling electricity
to the grid. Marshman et al. (2010) presented an optimization algorithm for this reason in P&P
mills and considered selling power and various scenarios for purchasing the fuel for the boilers.
Cakembergh-Mas et al. (2010) also proposed an MILP optimization model to quantify the
economic benefit of cogeneration in a Kraft mill. The results showed that cogeneration,
including a single back-pressure turbine, has the shortest payback period (PBP) whereas the
installation of two turbines can result in more power generation, higher profit, and a longer PBP.
Mostajeran Goortani et al. (2010) evaluated the technical feasibility of cogeneration
implementation in a Kraft mill. They found the same PBP as Cakembergh-Mas et al. (2010),
between 0.8-0.9 years. Tahouni et al. (2012) considered the possibility of a gas turbine and a
back pressure turbine to generate power and analyzed this CHP configuration using Aspen Plus
software.
3.8 Trigeneration
Trigeneration is a combination of cogeneration and a heat pump (Fig. 3-12). The heat pump can
be either VRHP or AHP. In trigeneration with AHP, the driving force of AHP is MP steam from
a MP back pressure turbine (Hernández-Santoyo and Sánchez-Cifuentes, 2003; Marinova et al.,
2007). This coupling has several advantages, such as being environmentally friendly because of
high steam savings by AHP and lower electricity consumption compared to VRHP, generating
more electricity using turbine, and supplying enough steam for the process (Marinova et al.,
2007; Meunier, 2002). Cortes & Rivera (2010) performed an exergoeconomic study to optimize
this configuration and lower the operating costs. Marinova et al. (2007) presented guidelines for
the implementation of a trigeneration unit in a Kraft mill. They reported that trigeneration can
reduce the net heat demand of the process and supply electricity to the grid. Nevertheless, the

42
investment required for this combination is high and should be examined carefully to decide
whether it is profitable or not.
Fig. 3-12 - Schematic of the steam turbine and AHP - trigeneration unit (Marinova et al., 2007)
3.9 Selling Steam to the Local District
There are several options for using the excess steam, such as electricity generation using turbines
and/or selling steam to the local district. Jonsson et al. (2008) conducted a study on the subject of
selling steam to the local district from a Kraft mill. They showed that this option highly depends
on the price of energy in the market and the total heat load. For example, if the total heat load to
a district is small, this scenario is always beneficial while if it is medium or large, the market
price of energy will indicate the optimal sale of heat. In addition, they showed that this scenario
is always advantageous in CO2 emission reduction. Axelsson & Berntsson (2005) also evaluated
this potential and showed that selling the surplus heat to the local district is promising from an
economy point of view, even with low energy prices. Kapil et al. (2012) also described the most
important parameters for success in local district heating from wasted energy of a process.
Marinova et al. (2008) conducted a feasibility study in district heating in a small town adjacent
to a Kraft pulp mill in Canada. They showed the possibility of this option even for the harshest
weather period of the year. Economic analysis also showed that district heating for half of the
town can be economically attractive.

43
3.10 Combination of Different Process Integration Techniques
Mateos et al. (2010d, 2011c) developed a system interaction analysis (Fig. 3-13) that consists of
six major steps: internal heat recovery, water reutilization, elimination of non-isothermal mixing
(NIM), condensate recovery, energy upgrading by heat pumping, and energy conversion by
turbine. They used different process integration tools, such as Thermal Pinch Analysis for
internal heat recovery and energy upgrading and Water Pinch Analysis for water reutilization.
Thermal Pinch analysis has been performed after applying each step to evaluate the effect on
Pinch Curves and redesign the HEX network. This method requires plenty of effort to develop
the HEX network; however, many steps can be easily combined. Mateos et al. (2011c) also
presented the Unified methodology to propose guidelines for implementing the identified
projects for a Canadian Kraft mill considering their technical and economic constraints.
Fig. 3-13 - System interaction analysis (Mateos-Espejel et al., 2010d)
3.11 Synthesis of the literature
The main incentives for energy and water savings are reduction in manufacturing costs and
negative environmental impacts, increasing power generation capacity and creating extra
revenue for the process. The main potential for improvement can be summarized as follows:
Providing a means to characterize and benchmark existing processes so as to determine
the areas of water and steam inefficiencies.

44
Providing a systematic technique to simultaneously analyze the water production and
utilization, filtrate reutilization, and related steam networks so as to reduce steam and
water consumption. It should also consider the constraints of the system and non-
isothermal mixing inefficiency. The technique should provide a practical approach and
rules for filtrate reutilization.
Providing a systematic technique to diagnose the inefficiencies within existing equipment
and departments of the process.
Providing a systematic technique to redesign the existing HEX network (HEN) of a
water-based process considering the constraints, existing HEN, and non-isothermal
mixing (NIM). This technique should provide practical ways to straightforwardly design
HEN.
Providing a methodology to combine different PI techniques so as to achieve the
maximum possible steam and water savings, biggest reduction of effluent production and
CO2 emissions, and highest net profit with the shortest payback period.
3.12 Specific Objectives
Based on the synthesis of literature, the specific objectives of this thesis are the following:
To develop a benchmarking technique to identify preliminary potential water and steam
savings and apply the technique on Kraft mills.
To develop a technique to simultaneously analyze water and steam networks so as to
reduce steam and water consumption by redesigning the existing water production and
utilization and also filtrate reutilization networks and apply the technique on Kraft mills.
To develop a technique to analyze and diagnose the existing equipment and departments
to enhance their energy and water efficiency and apply the technique on Kraft mills.
To develop a technique to redesign the existing HEX network of a water-based process to
significantly improve the heat recovery system and apply the technique on Kraft mills.
To develop a methodology to combine different process integration techniques to
maximize the steam and water savings and also to propose a strategy for implementing
the identified projects and apply the methodology on Kraft mills.
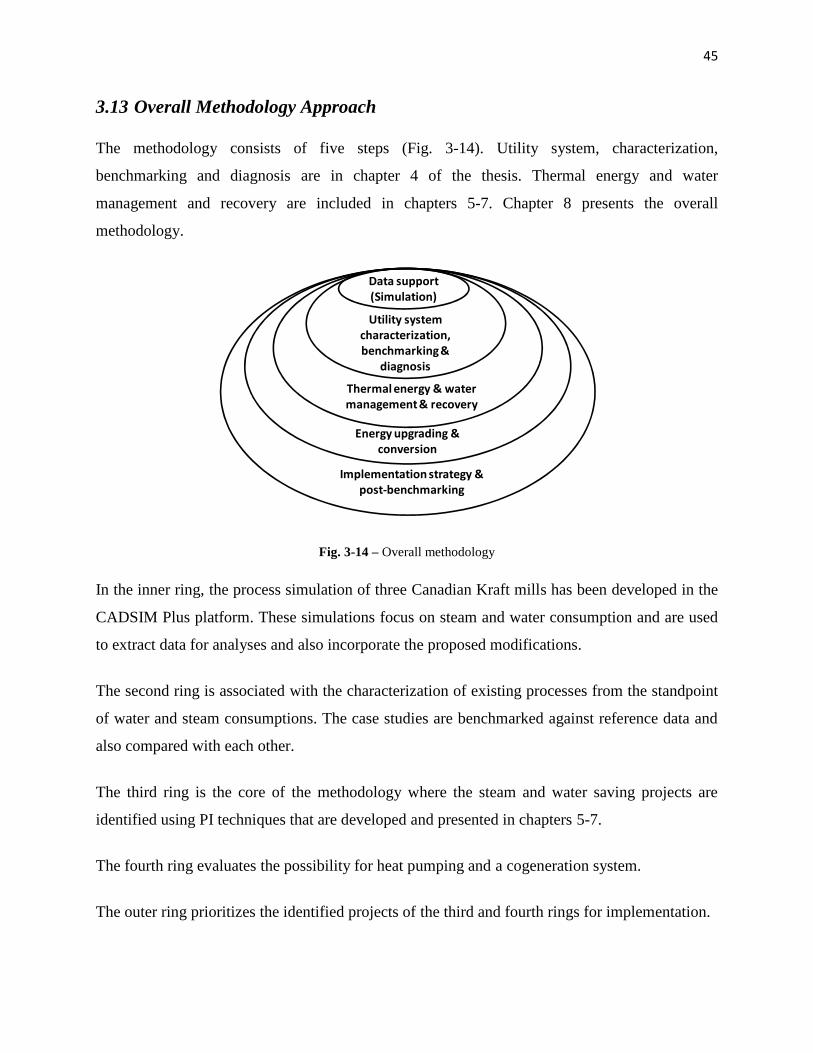
45
3.13 Overall Methodology Approach
The methodology consists of five steps (Fig. 3-14). Utility system, characterization,
benchmarking and diagnosis are in chapter 4 of the thesis. Thermal energy and water
management and recovery are included in chapters 5-7. Chapter 8 presents the overall
methodology.
Fig. 3-14 – Overall methodology
In the inner ring, the process simulation of three Canadian Kraft mills has been developed in the
CADSIM Plus platform. These simulations focus on steam and water consumption and are used
to extract data for analyses and also incorporate the proposed modifications.
The second ring is associated with the characterization of existing processes from the standpoint
of water and steam consumptions. The case studies are benchmarked against reference data and
also compared with each other.
The third ring is the core of the methodology where the steam and water saving projects are
identified using PI techniques that are developed and presented in chapters 5-7.
The fourth ring evaluates the possibility for heat pumping and a cogeneration system.
The outer ring prioritizes the identified projects of the third and fourth rings for implementation.
Data support(Simulation)
Utility systemcharacterization,benchmarking &
diagnosis
Thermal energy & watermanagement & recovery
Energy upgrading &conversion
Implementation strategy &post-benchmarking

46
In this work, the main software used are the following:
CADSIM Plus, which is a Canadian software specializing in the P&P process.
Aspen Plus to simulate the generic example of SEWNA and also cogeneration and
trigeneration
Aspen Energy Analyzer to design the HEX network.
Excel to extract data from simulation, perform water and energy analysis, the sizing of
pipes and HEXs, and economic calculations.
3.14 Case Studies
The study is based on three Canadian Kraft mills during winter conditions as these are the
harshest conditions during the year with peak steam consumption.
Schematics of the three studied mills are shown in Fig. 3-15. The mills are geographically
distributed in Canada, representing a wide spectrum of configurations, products, and raw
materials, and are hereby identified as Mill A, B, and C. Mill A is a dissolving Kraft mill that
consumes hardwood and produces, at its maximum capacity, 750 air dried tons per day (Adt/d)
of dissolving pulp. The dissolving pulp is pure cellulose and sold as a precursor to produce other
materials, such as rayon. Mill B comprises two separate lines. Line 1 and 2 manufacture
respectively 805 and 960 Adt/d of Kraft paper pulp from softwood. The two lines are
interconnected through digesting and the pulp machine. Mill C is a mixed Kraft and mechanical
paper mill with softwood as the raw material. This mill manufactures an average of 700 Adt/d of
paper from 40% Kraft paper pulp and 60% mechanical pulp. The mechanical pulping of mill C is
primarily an electricity consumer and was not taken into account for thermal energy analysis.
The main characteristics of these mills are presented in Table 3-1.

47
Fig. 3-15 - Simplified diagram of the three studied Kraft mills – the area between the dashed-dotted lines are similarities

48
Table 3-1 - Main characteristics of the three mills
Type of productTotal
Production(Adt/d)
Steamproduction
(MW)
Steamconsumption
(MW)
Electricitygeneration
(MW)
Electricityconsumption
(MW)
Waterconsumption
(m3/h)
Effluentproduction
(m3/h)
Mill ADissolving Kraft pulp –A series of Batchdigesters
750 275† 250† 19.7 19.4 2480 2450
Mill B –Line 1
Kraft paper pulp –Continuous digester 805 173‡ 183‡ 22.6 - 1540 1530
Mill B –Line 2
Kraft paper pulp –Continuous digester 960 335† 265† 26.3 - 1410 1260
Mill B–Whole mill
Kraft paper pulp –Continuous digester 1765 508† 448† 48.9 51.6 2950 2790
Mill C Kraft paper –Continuous digester 700 116 112 - 4.2 1760 1720
†the difference between steam generation and consumption is due to heat loss in the cogeneration system‡a portion of steam from line 1 of mill B is sent to line 2
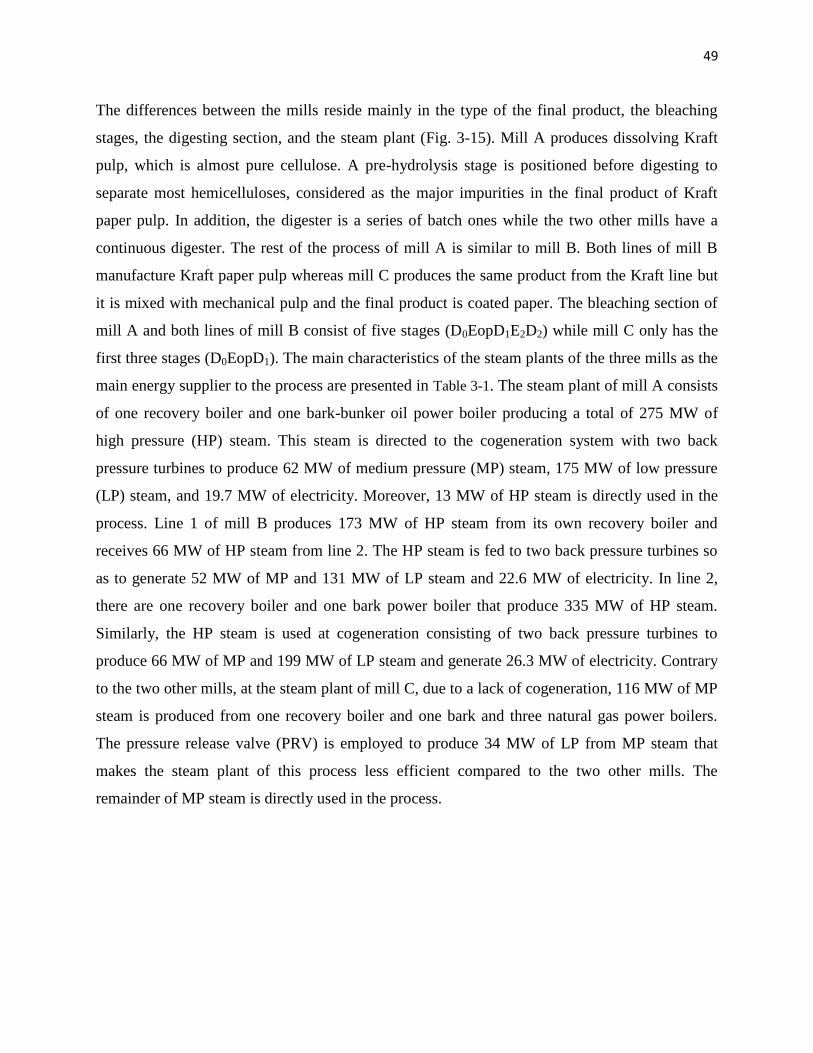
49
The differences between the mills reside mainly in the type of the final product, the bleaching
stages, the digesting section, and the steam plant (Fig. 3-15). Mill A produces dissolving Kraft
pulp, which is almost pure cellulose. A pre-hydrolysis stage is positioned before digesting to
separate most hemicelluloses, considered as the major impurities in the final product of Kraft
paper pulp. In addition, the digester is a series of batch ones while the two other mills have a
continuous digester. The rest of the process of mill A is similar to mill B. Both lines of mill B
manufacture Kraft paper pulp whereas mill C produces the same product from the Kraft line but
it is mixed with mechanical pulp and the final product is coated paper. The bleaching section of
mill A and both lines of mill B consist of five stages (D0EopD1E2D2) while mill C only has the
first three stages (D0EopD1). The main characteristics of the steam plants of the three mills as the
main energy supplier to the process are presented in Table 3-1. The steam plant of mill A consists
of one recovery boiler and one bark-bunker oil power boiler producing a total of 275 MW of
high pressure (HP) steam. This steam is directed to the cogeneration system with two back
pressure turbines to produce 62 MW of medium pressure (MP) steam, 175 MW of low pressure
(LP) steam, and 19.7 MW of electricity. Moreover, 13 MW of HP steam is directly used in the
process. Line 1 of mill B produces 173 MW of HP steam from its own recovery boiler and
receives 66 MW of HP steam from line 2. The HP steam is fed to two back pressure turbines so
as to generate 52 MW of MP and 131 MW of LP steam and 22.6 MW of electricity. In line 2,
there are one recovery boiler and one bark power boiler that produce 335 MW of HP steam.
Similarly, the HP steam is used at cogeneration consisting of two back pressure turbines to
produce 66 MW of MP and 199 MW of LP steam and generate 26.3 MW of electricity. Contrary
to the two other mills, at the steam plant of mill C, due to a lack of cogeneration, 116 MW of MP
steam is produced from one recovery boiler and one bark and three natural gas power boilers.
The pressure release valve (PRV) is employed to produce 34 MW of LP from MP steam that
makes the steam plant of this process less efficient compared to the two other mills. The
remainder of MP steam is directly used in the process.

50
4 CHAPTER 4: BENCHMARKING AS A MEANS TOIDENTIFY WATER AND STEAM SAVINGS
The main objectives of this chapter are divided into two parts. The first part is to benchmark the
mills with current practices to diagnose areas of inefficiencies. The second part is to compare the
case studies with each other to illustrate their similarities and differences. Furthermore, the
advantages and disadvantages of each mill are investigated. The advantages of one mill can be
proposed as a potential for water and energy savings measures in other mills.
In the next sections, the technique to perform benchmarking is presented and the results of
applying this technique to the cases are shown.
4.1 Benchmarking Technique
The technique to perform benchmarking is illustrated in Fig. 4-1 and includes three successive
steps to primarily diagnose the area of inefficiency and identify the preliminary potential for
steam and water savings of each case study. Each step is explained in the following sections and
the results obtained from the application to the three mills are also presented.
Fig. 4-1 -Steps of benchmarking methodology
Step 3: Synthesis
Summary of all potential steam and water savings
Step 2: Comparison of case studies
Allocation of steam and water consumption for different uses Analysis of HEX and water networks Similarities and differences in steam and water consumption Identification of potential for steam and water savings
Step 1: Benchmarking with current practices
Comparison of case study with current practice in terms ofwater and steam consumption
Identification of potential for steam and water savings

51
4.1.1 Step 1: Benchmarking with current practices
Benchmarking is carried out by comparing the mill with current practices from three
perspectives:
Steam consumption
Water consumption
Effluent production
The steam consumption of the principal steam users and the complete mill is benchmarked
against the reference data from the Paprican survey (CIPEC, 2008). The water consumption and
effluent production of the mills are benchmarked against the latest available reference data. The
reference data for water consumption of different departments has been extracted from the
published data for average mills of 1960s and 1980s designs (Johnston et al., 1996; Turner et al.,
2001). The reference data for effluent production of different departments has been published for
average mills of 1960s, 1980s, and 1990s designs (Chandra, 1997).
4.1.2 Step 2: Comparison of case studies
The specific characteristics of the mills can be divided into four different categories:
Allocation of water consumption and effluent production
Allocation of steam consumption to different usages
HEX network
Water network
The allocation of water consumption and effluent production of different departments of the
mills are compared with each other and also to the reference data. This study indicates deviation
from typical patterns of water consumption and effluent production in each department. It also
suggests the similarities and differences among the mills whereas some of the differences could
be advantageous and used as potential for improvement in other mills.
The allocation of steam consumption to different usages can give a clear picture on the area of
high steam consumption. Similar to water consumption, it demonstrates the similarities and

52
differences and explains the causes of the differences and suggests some potential for
improvements.
Analysis of the heat exchanger (HEX) network of the mills reveals the main features of the mills
in their heat recovery system. Presenting the similarities and differences could suggest an area
for improvement in heat recovery system.
Finally, the similarities and differences among the mills in their water networks are used to
identify the preliminary potential of water savings that would also affect the steam consumption
and effluent production.
4.1.3 Step 3: Synthesis
At the synthesis step, the main results of the two previous steps are analyzed to determine the
potential for improvement, both for steam and water savings while decreasing effluent
production.
4.2 Results
4.2.1 Step 1: Benchmarking with current practices
The benchmarking of steam and water consumptions as well as effluent production is shown in
Fig. 4-2 to 4-7.
4.2.1.1 Steam consumption
Figure 4-2 illustrates the results of benchmarking for mill A. This mill is benchmarked against
the data for Kraft paper pulp with a batch digester due to a lack of data for benchmarking against
Kraft dissolving pulp with a batch digester. It is possible to divide the mill into two parts for
benchmarking: the pre-hydrolysis and the Kraft paper pulp with batch digester. The steam
consumption of batch digesting is less than the 75th percentile of Canadian mills and, hence, is
considered as energy efficient. This value for bleaching and chemical preparation and the pulp
machine is below the median Canadian one although there is still potential to reduce these values
by means of process integration tools. The steam consumption of evaporation is higher than the
75th percentile of Canadian mills because of the nature of the dissolving Kraft process. In this
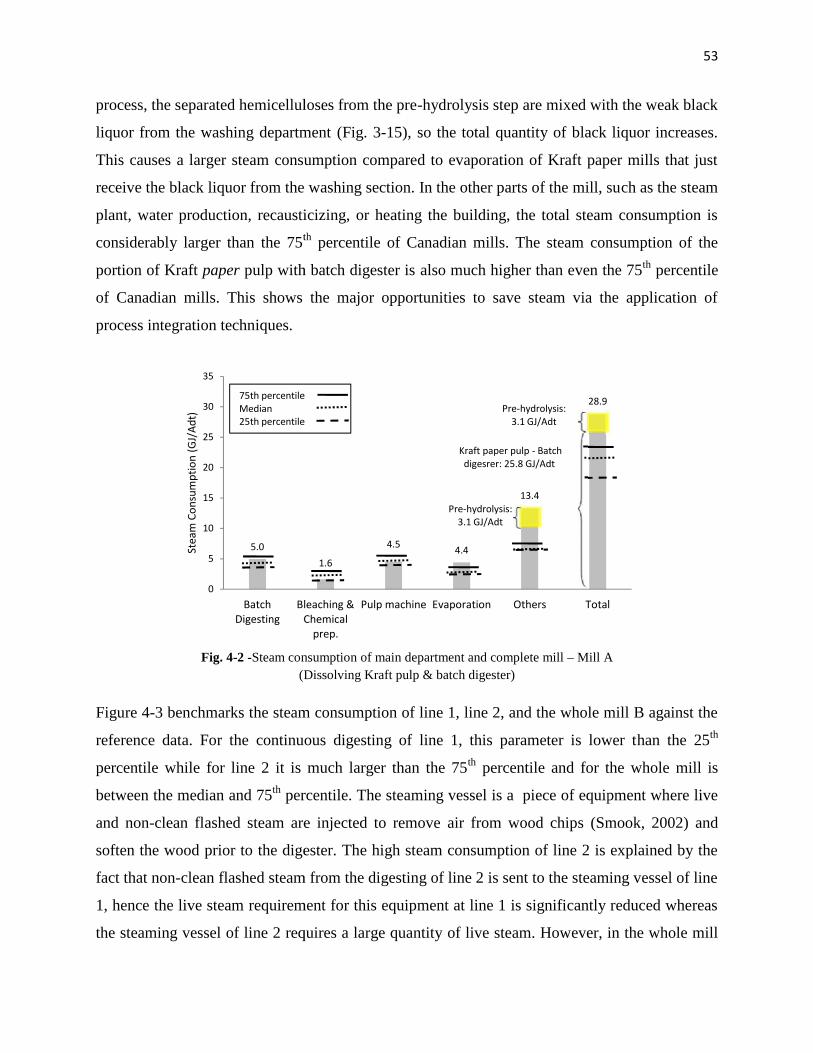
53
process, the separated hemicelluloses from the pre-hydrolysis step are mixed with the weak black
liquor from the washing department (Fig. 3-15), so the total quantity of black liquor increases.
This causes a larger steam consumption compared to evaporation of Kraft paper mills that just
receive the black liquor from the washing section. In the other parts of the mill, such as the steam
plant, water production, recausticizing, or heating the building, the total steam consumption is
considerably larger than the 75th percentile of Canadian mills. The steam consumption of the
portion of Kraft paper pulp with batch digester is also much higher than even the 75th percentile
of Canadian mills. This shows the major opportunities to save steam via the application of
process integration techniques.
Fig. 4-2 -Steam consumption of main department and complete mill – Mill A(Dissolving Kraft pulp & batch digester)
Figure 4-3 benchmarks the steam consumption of line 1, line 2, and the whole mill B against the
reference data. For the continuous digesting of line 1, this parameter is lower than the 25th
percentile while for line 2 it is much larger than the 75th percentile and for the whole mill is
between the median and 75th percentile. The steaming vessel is a piece of equipment where live
and non-clean flashed steam are injected to remove air from wood chips (Smook, 2002) and
soften the wood prior to the digester. The high steam consumption of line 2 is explained by the
fact that non-clean flashed steam from the digesting of line 2 is sent to the steaming vessel of line
1, hence the live steam requirement for this equipment at line 1 is significantly reduced whereas
the steaming vessel of line 2 requires a large quantity of live steam. However, in the whole mill
5.0
0
5
10
15
20
25
30
35
BatchDigesting
Bleaching &Chemical
prep.
Stea
m C
onsu
mpt
ion
(GJ/
Adt)
75th percentileMedian25th percentile
53
process, the separated hemicelluloses from the pre-hydrolysis step are mixed with the weak black
liquor from the washing department (Fig. 3-15), so the total quantity of black liquor increases.
This causes a larger steam consumption compared to evaporation of Kraft paper mills that just
receive the black liquor from the washing section. In the other parts of the mill, such as the steam
plant, water production, recausticizing, or heating the building, the total steam consumption is
considerably larger than the 75th percentile of Canadian mills. The steam consumption of the
portion of Kraft paper pulp with batch digester is also much higher than even the 75th percentile
of Canadian mills. This shows the major opportunities to save steam via the application of
process integration techniques.
Fig. 4-2 -Steam consumption of main department and complete mill – Mill A(Dissolving Kraft pulp & batch digester)
Figure 4-3 benchmarks the steam consumption of line 1, line 2, and the whole mill B against the
reference data. For the continuous digesting of line 1, this parameter is lower than the 25th
percentile while for line 2 it is much larger than the 75th percentile and for the whole mill is
between the median and 75th percentile. The steaming vessel is a piece of equipment where live
and non-clean flashed steam are injected to remove air from wood chips (Smook, 2002) and
soften the wood prior to the digester. The high steam consumption of line 2 is explained by the
fact that non-clean flashed steam from the digesting of line 2 is sent to the steaming vessel of line
1, hence the live steam requirement for this equipment at line 1 is significantly reduced whereas
the steaming vessel of line 2 requires a large quantity of live steam. However, in the whole mill
1.6
4.5 4.4
13.4
28.9
Bleaching &Chemical
prep.
Pulp machine Evaporation Others Total
75th percentileMedian25th percentile
Kraft paper pulp - Batchdigesrer: 25.8 GJ/Adt
Pre-hydrolysis:3.1 GJ/Adt
Pre-hydrolysis:3.1 GJ/Adt
53
process, the separated hemicelluloses from the pre-hydrolysis step are mixed with the weak black
liquor from the washing department (Fig. 3-15), so the total quantity of black liquor increases.
This causes a larger steam consumption compared to evaporation of Kraft paper mills that just
receive the black liquor from the washing section. In the other parts of the mill, such as the steam
plant, water production, recausticizing, or heating the building, the total steam consumption is
considerably larger than the 75th percentile of Canadian mills. The steam consumption of the
portion of Kraft paper pulp with batch digester is also much higher than even the 75th percentile
of Canadian mills. This shows the major opportunities to save steam via the application of
process integration techniques.
Fig. 4-2 -Steam consumption of main department and complete mill – Mill A(Dissolving Kraft pulp & batch digester)
Figure 4-3 benchmarks the steam consumption of line 1, line 2, and the whole mill B against the
reference data. For the continuous digesting of line 1, this parameter is lower than the 25th
percentile while for line 2 it is much larger than the 75th percentile and for the whole mill is
between the median and 75th percentile. The steaming vessel is a piece of equipment where live
and non-clean flashed steam are injected to remove air from wood chips (Smook, 2002) and
soften the wood prior to the digester. The high steam consumption of line 2 is explained by the
fact that non-clean flashed steam from the digesting of line 2 is sent to the steaming vessel of line
1, hence the live steam requirement for this equipment at line 1 is significantly reduced whereas
the steaming vessel of line 2 requires a large quantity of live steam. However, in the whole mill
28.9
Total

54
for this department, there is a trade-off between high steam consumption at line 2 and low steam
consumption at line 1. The bleaching department consumes a small quantity of steam although
there is still potential for reduction by means of process integration. The high steam consumption
of the pulp machine for both lines is largely due to the utilization of low temperature water (40-
65oC) at the pulp machine and the high temperature of the exhaust air at the dryer outlet (132oC).
This gives a considerable opportunity to save steam in this department. The evaporation section
of line 2 consumes a substantial amount of steam compared to typical Canadian mills because of
employing a black liquor (BL) concentrator to concentrate strong BL from 47% to 68% of
dissolved solid using live steam. However, in line 1 and for the two other mills, a cascade
concentrator has been installed to recover the heat of the recovery boiler (RB) stack gas. The
total steam consumption of the whole mill is close to the 75th percentile and similar to mill A,
there is still potential to save steam.
Fig. 4-3 - Steam consumption of main department and complete mill – Mill B (Kraftpaper pulp & continuous digester)
Figure 4-4 presents the benchmarking results of steam consumption for mill C. Contrary to the
two other mills; the steam consumption of the digesting department is much higher than the 75th
percentile. Consequently, the identification of saving potential requires in-depth analysis of the
equipment of this department. This value for bleaching and chemical preparation and
evaporation is reasonable. The steam consumption at the paper machine (PM) is larger than the
75th percentile because water at low temperature is supplied to the PM and causes the low
1.9 2.5
6.7
2.9
5.6
19.6
4.2 1.85.2 5.6 5.6
22.5
3.22.1
5.94.4
5.6
21.2
0
5
10
15
20
25
ContinuousDigesting
Bleaching &Chemical
prep.
Pulp machine Evaporation Others Total
Stea
m c
onsu
mpt
ion
(GJ/
Adt)
Line 1Line 2Whole mill
75th percentileMedian25th percentile
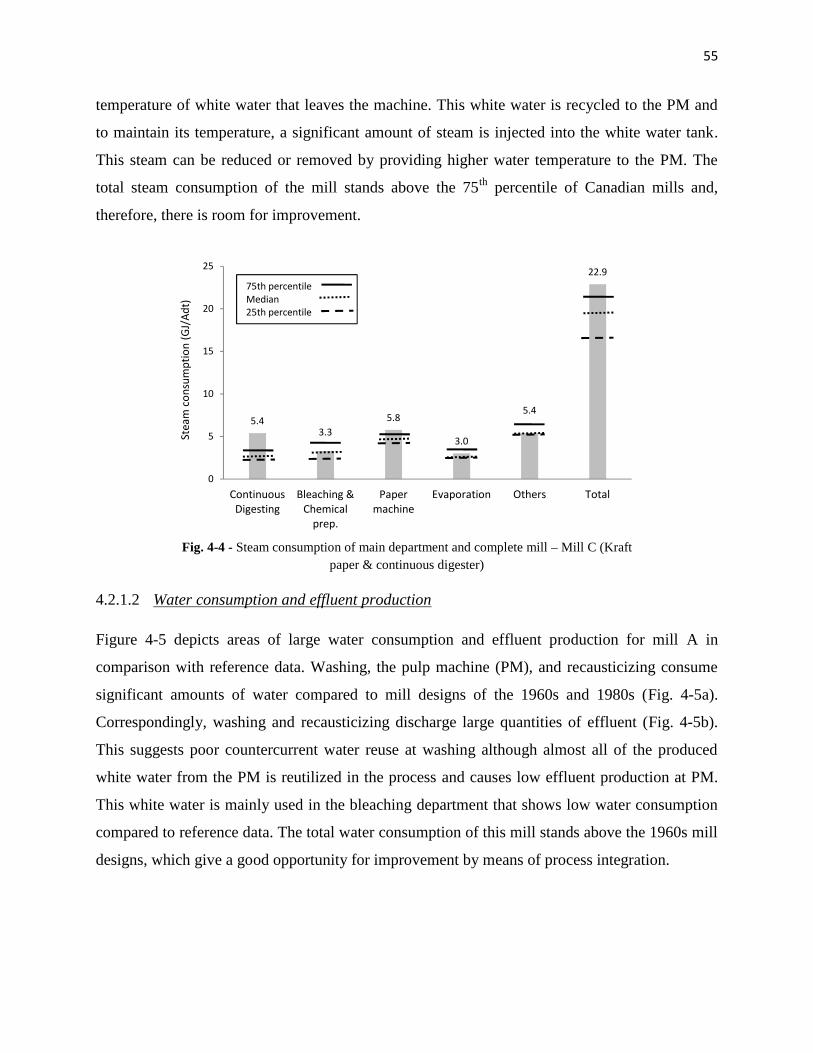
55
temperature of white water that leaves the machine. This white water is recycled to the PM and
to maintain its temperature, a significant amount of steam is injected into the white water tank.
This steam can be reduced or removed by providing higher water temperature to the PM. The
total steam consumption of the mill stands above the 75th percentile of Canadian mills and,
therefore, there is room for improvement.
Fig. 4-4 - Steam consumption of main department and complete mill – Mill C (Kraftpaper & continuous digester)
4.2.1.2 Water consumption and effluent production
Figure 4-5 depicts areas of large water consumption and effluent production for mill A in
comparison with reference data. Washing, the pulp machine (PM), and recausticizing consume
significant amounts of water compared to mill designs of the 1960s and 1980s (Fig. 4-5a).
Correspondingly, washing and recausticizing discharge large quantities of effluent (Fig. 4-5b).
This suggests poor countercurrent water reuse at washing although almost all of the produced
white water from the PM is reutilized in the process and causes low effluent production at PM.
This white water is mainly used in the bleaching department that shows low water consumption
compared to reference data. The total water consumption of this mill stands above the 1960s mill
designs, which give a good opportunity for improvement by means of process integration.
5.43.3
5.8
3.0
5.4
22.9
0
5
10
15
20
25
ContinuousDigesting
Bleaching &Chemical
prep.
Papermachine
Evaporation Others Total
Stea
m c
onsu
mpt
ion
(GJ/
Adt)
75th percentileMedian25th percentile

56
Fig. 4-5 - (a) Water consumption and (b) effluent production of Mill A
Figure 4-6 indicates that both lines of mill B integrate well from the standpoints of water
consumption and effluent production. The only areas that may require further integration for
reducing their water consumption are the washing department of line 1, the pulp machine of both
lines, and recausticizng. These two lines are also integrated in some parts, for example, a portion
of produced white water at the pulp machine of line 2 is sent to the pulp machine of line 1 and
that is the reason for non-corresponding total water consumption and effluent production in line
2. In this mill, there is not much expectation to decrease water consumption and effluent
production.
0.5
2424
12
3
14
0.3
80
0
20
40
60
80
100W
ater
Con
sum
ptio
n (m
3 /Ad
t)Mills design 1960sMills design 1980s
a
2
37
26
1 2 0.110
79
0
20
40
60
80
100
Efflu
ent P
rodu
ctio
n (m
3 /Ad
t)
Mills design 1960sMills design 1980sMills design 1990s
b

57
Fig. 4-6 - (a) Water consumption and (b) effluent production of Mill B
Figure 4-7 displays that the water consumption and, consequently, the effluent production of the
washing and paper machine (PM) are considerably high for mill C. The main reasons, at the
washing department, are poor counter-current water reuse and also the utilization of hot water to
maintain the temperature of the washer filtrate tank at a required value. The white water is not
reutilized efficiently in other departments, causing a large effluent production at the PM.
Therefore, applying process integration could significantly reduce the water consumption and
effluent production in this mill. It should be noted that total water consumption and effluent
2
24
9 2 3 6
46
711
7 5 2 3
35
5
17
8 1 4 4 2
40
0
20
40
60
80
100
Washing Bleaching Pulp machine Evaporators Steam Plant Recausticizing Chemical Prep. Total
Wat
er c
onsu
mpt
ion
(m3 /
Adt)
Line 1Line 2Whole mill
aMills design 1960sMills design 1980s
2
34
4 30.3
2
46
0.2 2
18
5 3 0.32 0.4
31
0.1 2
25
5 3 0.32 0.2
38
0
20
40
60
80
100
Effl
uent
Pro
d. (m
3 /Adt
) Line 1Line 2Whole mill
Mills design 1960sMills design 1980sMills design 1990s
b

58
production are 1760 and 1720 m3/h (Table 3-1), but in Fig. 4-7, they are different. The reason is
that the basis for the calculation of water consumption in m3/Adt in digesting, washing,
bleaching, steam plant, and chemical preparation is total Kraft production (280 Adt/d) while the
basis for the paper machine is the total mixture of Kraft and mechanical production (700 Adt/d)
and for mechanical is the total mechanical pulping production (420 Adt/d).
Fig. 4-7 - (a) Water consumption and (b) effluent production of Mill C
4.2.2 Step 2: Comparison of case studies
4.2.2.1 Allocation of water consumption and effluent production
The allocation of water consumption and effluent production of different departments is shown
in Fig. 4-8 and 4-9. These figures indicate that the share of water consumption and effluent
production of bleaching accounts for around 70% of total water consumption and effluent
production for mills designed between the 1960s and 1990s. This proportion has not been
changing over time; however, its quantity has been continuously reduced. The proportion of
water consumption in steam plants has decreased from the 1960s to 1980s due to more attention
for returning clean condensate to the steam plant. On the other hand, at the pulp/paper machine,
the proportion of water consumption has increased. However, the water consumption at the
pulp/paper machine has not changed due to the essential use of clean water at the end of the pulp
line. Correspondingly, by decreasing the total water consumption at different departments,
0.4
51
24
115 4 2
97
23
120
0
20
40
60
80
100
120
140
Wat
er C
onsu
mpt
ion
(m3 /
Adt)
Mills design 1960sMills design 1980s
a
2
43
29 26
5 1 0.5
106
0
20
40
60
80
100
120
140
Efflu
ent P
rodu
ctio
n (m
3 /Ad
t)
Mills design 1960sMills design 1980sMills design 1990s
b

59
similar to water consumption, the share of effluent production at the pulp/paper machine has
considerably risen.
Analyzing the proportion of water consumption and effluent production at mill A in comparison
with reference mills of the 60s, 80s, and 90s and also mills B and C indicate that this mill
consumes large amounts of water and generates significant volumes of effluent in its washing
and recausticizing departments (Fig. 4-8 & 4-9). Therefore, these two departments could be the
main areas for water savings. These results are consistent with the results of water
benchmarking. In addition, a low proportion of effluent production at the pulp machine (PM)
could be an indication of a high level of white water reutilization at the washing, bleaching, and
PM departments.
Similar observations about mill B (Fig. 4-8 & 4-9) suggest that although the total water
consumption of the mill is close to that of the 1980s mill designs, the recausticizing and pulp
machine of both lines and the steam plant and washing department of line 2 do not follow the
pattern of those mill designs. Thus, the largest potential for water saving resides in these parts of
the mill. The proportion of effluent production of the evaporation department on both lines
compared to mill designs of the 60s, 80s, and 90s and mills A and C also implies that the non-
clean condensates from the evaporation sections are not reutilized efficiently. This water can be
used at the recausticizing and washing departments to save water and reduce the share of effluent
production of evaporation as recommended by several studies (Mateos-Espejel et al., 2010b;
Turner et al., 2001).
Mill C uses a large volume of water on the Kraft side and generates a large quantity of effluent
compared to both mills A and B. The pie chart of Fig. 4-8 for mill C shows that the proportion
of water consumption at washing is substantial compared to other mills. However, the bleaching
consumes less water in comparison to other cases. The pie chart of Fig. 4-9 for mill C shows a
large proportion of effluent production at washing and the paper machine compared to other
cases. These results are identical to the ones obtained in the benchmarking sections and so the
main possible areas for water savings could be at the washing department and the reduction of
effluent could be at the paper machine by improving the reuse of its effluent (white water) at the
bleaching and washing.
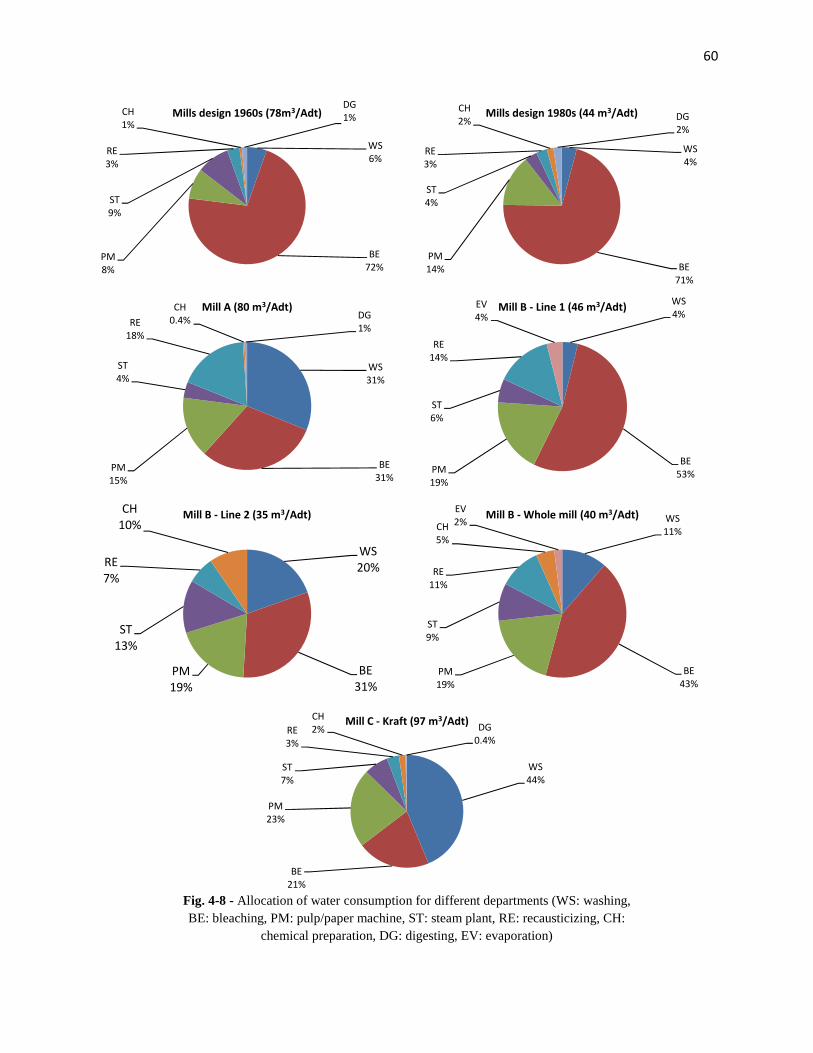
60
Fig. 4-8 - Allocation of water consumption for different departments (WS: washing,BE: bleaching, PM: pulp/paper machine, ST: steam plant, RE: recausticizing, CH:
chemical preparation, DG: digesting, EV: evaporation)
WS6%
BE72%
PM8%
ST9%
RE3%
CH1%
DG1%Mills design 1960s (78m3/Adt)
WS4%
BE71%
PM14%
ST4%
RE3%
CH2% DG
2%Mills design 1980s (44 m3/Adt)
WS31%
BE31%
PM15%
ST4%
RE18%
CH0.4% DG
1%
Mill A (80 m3/Adt) WS4%
BE53%PM
19%
ST6%
RE14%
EV4%
Mill B - Line 1 (46 m3/Adt)
WS20%
BE31%
PM19%
ST13%
RE7%
CH10%
Mill B - Line 2 (35 m3/Adt) WS11%
BE43%
PM19%
ST9%
RE11%
CH5%
EV2%
Mill B - Whole mill (40 m3/Adt)
WS44%
BE21%
PM23%
ST7%
RE3%
CH2% DG
0.4%
Mill C - Kraft (97 m3/Adt)

61
Fig. 4-9 - Allocation of effluent production from different departments (WS: washing,BE: bleaching, PM: pulp/paper machine, ST: steam plant, RE: recausticizing, CH:
chemical preparation, DG: digesting, EV: evaporation)
WS4%
BE76%
PM7%
EV1%
ST7%
RE3%
DG1%
CH1%
Mills design 1960s (96 m3/Adt)WS4%
BE66%
PM13%
EV1%
ST8%
RE3%
DG3%
CH2%
Mills design 1980s (47 m3/Adt)
WS2%
BE67%
PM18%
EV1%
ST4%
RE3% DG
4%CH1%
Mills design 1990s (32 m3/Adt)
WS47%
BE33%
PM2%
EV3%
ST0.2%
RE12% DG
3%
Mill A (79 m3/Adt)
WS5%
BE74%
PM10%
EV7%
ST1%
RE3%
Mill B - Line 1 (46 m3/Adt)
WS6%
BE57%
PM17%
EV10%
ST1%
RE7% DG
1%
CH1%
Mill B - Line 2 (31 m3/Adt)
WS6%
BE67%
PM13%
EV8%
ST1%
RE5% DG
0.3%CH
0.6%
Mill B - Whole mill (38 m3/Adt)
WS29%
BE20%
PM45%
EV3%
ST2% RE
0.3%
DG1%
Mill C (106 m3/Adt)

62
4.2.2.2 Allocation of steam consumption for different usages
The allocation of steam consumption for different usages in the three mills is exposed in Fig.
4-10. The pie charts show that the main steam users are digesting, evaporation and black liquor
(BL) heating, and drying, which consume between 35 to 56% of the total steam. Due to
equipment constraints, steam cannot be reduced using process integration techniques, however,
the performance of each of these pieces of equipment requires further individual investigation to
identify the possible inefficiencies and propose measures to correct them. The graphs also
display that the steam consumption for water heating and process and non-process air heating
accounts for 13-22% of current consumption. This could be reduced or even eliminated
completely by more efficient heat recovery via applying process integration. The deaerator and
injection points in the pulp line consume 14% at the dissolving Kraft pulp mill (mill A) and
between 30-36% at Kraft paper pulp mills (mill B and C). The main reason for the high steam
consumption at the deaerator of mill C and both lines of mill B is the utilization of fresh water
(2oC) and warm water (31oC), respectively, as makeup water at their deaerator. The main reason
for high steam injection in the pulp line of mill C is inefficient water reutilization and also the
utilization of low temperature water at the pulp line. For the case of mill B, with low water
consumption, the expectation is to have low steam injection in the pulp line, but the share in both
lines is large. The main reason is that similar to mill C, water at low temperature is used at line 2
and sometimes fresh water (2oC) is used in the bleaching section where the major steam
injections are carried out. Therefore, it can be expected that by applying process integration,
several potentials for steam savings at both the deaerator and steam injection points of the pulp
line could be identified.

63
Fig. 4-10 - Allocation of steam consumption to different usages. (Pr.: process, Evap.: evaporation, BL: black liquor,Inj.: injection, Pre-hydr.: pre-hydrolysis)
4.2.2.3 HEX network
The specific characteristics of the mills regarding the existing heat exchanger network are
summarized in Table 4-1. The analysis reveals the similarities and differences for the heat
recovery system of the three mills. It could also help to channel the efforts into taking advantage
of the positive characteristics and avoiding the negative ones. For example, the higher the
Digesting17%
Evap. & BLheating
19%
Drying12%
Others5%
Inj. in pulpline8%
Deaerator6%
Waterheating
4%
Pr. airheating
11%
Non-pr. airheating
7%
Pre-hydr.11%
Mill A (28.9 GJ/Adt) Digesting10%
Evap. & BLheating
14%
Drying21%
Others1%
Inj. in pulpline25%
Deaerator11%
Waterheating
16%
Pr. airheating
2%
Mill B - Line 1 (19.6 GJ/Adt)
Digesting18%
Evap. & BLheating
23%
Drying15%
Others1%
Inj. in pulpline15%
Deaerator15%
Waterheating
6%
Pr. airheating
2%
Non-pr. airheating
5%
Mill B - Line 2 (22.5 GJ/Adt)
Digesting15%
Evap. & BLheating
20%
Drying17%Others
1%
Inj. in pulpline19%
Deaerator13%
Waterheating
10%
Pr. airheating
2%Non-pr. air
heating3%
Mill B - Whole mill (21.2 GJ/Adt)
Digesting15%
Evap. & BLheating
8%
Drying21%
Others2%
Inj. in pulpline15%
Deaerator15%
Waterheating
6%
Pr. airheating
14%
Non-pr.4%
Mill C (23.4 GJ/Adt)

64
temperature of the smelt tank, the larger the potential for the installation of a green liquor cooler
and heat recovery. In the case of mill C, the temperature of the smelt tank is 75oC, so the steam
heater is required to reheat the green liquor and there is no potential for heat recovery. There are
also several heat recovery schemes to heat up water and air using effluent of the pulp line, stack
gas of boilers, and exhaust air of dryers. The stack gas of the recovery boiler is also used to
concentrate further the black liquor after the evaporation system. In addition, it should be noted
that the higher the temperature of air to boilers and dryers, the higher the boilers’ efficiency, and
the lower the steam consumption in the dryer. These advantageous approaches for heat recovery
and also air supply to the main equipment could be helpful to reduce steam consumption and
improve the energy efficiency of the process.
Table 4-1 -Specific characteristics of HEX network of three mills
HEX networkcharacteristics Impact A B1 B2 C
Installed HEX to recoverthe heat of bleachingeffluent
Lower steamconsumption for hot orwarm water production
√
Using green liquor cooler(High temp. at smelt tank~100oC) at recausticizing
No need for steamheater to reheat thegreen liquor
√ √ √
Using wet scrubber toclean and recover the heatof RB stack gas
Lower steamconsumption for hot orwarm water production
√ √
Using RB stack gas atblack liquor cascadeconcentrator
Lower steamconsumption toconcentrate the BL
√ √ √
Air economizer at powerboiler (PB) to produce hightemperature air
Lower steamconsumption for airpreheating
√ √
Water economizer at dryerLower steamconsumption for hot orwarm water production
√ √ √
Air economizer at dryerLower steamconsumption for airpreheating
√ √ √
Preheat the air at dryer forrecovery boiler (RB)
Lower steamconsumption for airpreheating (nodistance barrier)
√
Air to boilers at hightemperature (>160oC) Larger boiler efficiency √ √
Air to dryer at hightemperature (>80oC &<100oC)
Lower steamconsumption at dryer √ √ √

65
4.2.2.4 Water network
The specific characteristics of the mills’ water networks and the similarities and differences are
presented in Table 4-2. This table can help to begin identifying potential areas for saving water
that would also affect the steam consumption. For example, high temperature water is utilized at
the pulp line of mill A and line 1 of mill B resulting in lower steam consumption at the bleaching
sections of these two mills compared to mill C (Fig. 4-2 to 4-4). However, line 2 of mill B
consumes a smaller amount of steam (1.8 GJ/Adt) compared to line 1 (2.5 GJ/Adt) (Fig. 4-3).
This can be explained by the higher level of filtrate reutilization of line 2 compared to line 1
(Fig. 4-6). The total water consumption of bleaching at line 1 (24 m3/Adt) is larger than line 2
(11 m3/Adt) (Fig. 4-6).

66
Table 4-2 – Specific characteristics of water network of three mills
Water networkCharacteristics Impacts A B1 B2 C
High temperature water at pulpline & machine (HW85oC &92oC & 80oC)
Lower steam injection atpulp line & white watertank
√ √
Sending back the condensate ofdigester heaters to condensatetank
Lower steamconsumption atdeaerator
√ √ √
Reutilization of filtrate fromknotters or alkaline effluent atchip bin
Lower clean waterconsumption & lowerwhite liquor consumption
NA† √ √
Utilization of non-cleancondensate of evaporation atwashing
Lower clean waterconsumption & Lowersteam consumption forhot water production &lower steam injection atthe pulp line
√ √ √ √
Reutilization of all white water atprocess √ √ √
Reutilization of the reject ofmachine in the process √ √
Utilization of warm or hot waterat smelt tank of recausticizing(High temp. at smelt tank~100oC)
No need for steamheater to reheat greenliquor
√ √ √
Reutilization of alkaline effluentat recausticizing
Lower clean waterconsumption & LowerNaOH make-up & Lowersteam consumption forhot water production
√
Reutilization of scrubberdischarge of recausticizing
Lower clean waterconsumption atrecausticizing
√
Utilization of non-cleancondensate of evaporation atrecausticizing
Lower clean waterconsumption & Lowersteam consumption forhot water production
√ √
Average acidic effluent in threemills; 29% of filtrate that leavesD0 washer
Lower the acidic andalkaline effluents, lowerthe heat loss througheffluent, lower the cleanwater consumption, andlower the chemicalsrequirement
√ √ √ √
Average alkaline effluent inthree mills;18% of filtrate thatleaves the Eop washer
√ √ √ √
Complete discharge of all non-clean condensate from surfacecondenser of digesting &evaporation
Cleaner pulp & reducedodor problem √ √ √ √
Complete discharge of allrejects from knotters, screeners,& cleaners of washing More uniform pulp &
Less accumulation ofsolid particles
√ √ √ √
Complete discharge of allrejects from screeners &cleaners of pulp/ paper machine
√ √ √ √
† Not applicable: there is no chip bin at the mill A

67
The water network and the approach for filtrate reutilization in the bleaching stages are crucial
and require particular attention due to the utilization of a large quantity of different chemicals
with different natures (acid and base). In bleaching, the mixing of dissimilar streams should be
avoided in order to not neutralize the preceding streams and damage the pulp with filtrate from a
subsequent stage (Turner et al., 2001). However, the reutilization of subsequent filtrate (ex., E2)
at the preceding washer (ex., D1 washer) is a common practice (Turner et al., 2001) and is also
employed in the three mills (Table 4-3). This could decrease the clean water consumption,
exploit efficiently the filtrate, retain the temperature of pulp at bleaching at a high level and,
consequently, decrease the total steam injection in the bleaching stages and also lower the
chemicals requirement at the bleaching stages. Table 4-3 presents the approach for water
reutilization for washers of bleaching stages and can be used to determine the potential and
possibility for filtrate reutilization in this department.

68
Table 4-3 – Specific characteristics of water reuse in bleaching of three mills
Characteristics Impacts A B1 B2 C
D0 filtrate to D0 washer Lower clean waterconsumption √ √ √ √
D1 filtrate to D0 washer Lower clean waterconsumption & Smaller steaminjection at Eop steam mixer
√ √ √
D2 filtrate to D0 washer √ √ NA†
Eop filtrate to D0 washerLower clean waterconsumption & Smaller steaminjection at Eop steam mixer &Less chemicals required atEop
√
E2 filtrate to D0 washer √ NA†
Eop filtrate to Eopwasher Lower clean water
consumption & Smaller steaminjection at D1 steam mixer
√ √
E2 filtrate to Eopwasher √ √ NA†
D1 filtrate to Eop washerLower clean waterconsumption & Smaller steaminjection at D1 steam mixer &Less chemicals required at D1
√ √ √
D2 filtrate to Eop washer √ NA†
D1 filtrate to D1 washer Lower clean waterconsumption & Smaller steaminjection at E2 steam mixer
√ √
D2 filtrate to D1 washer √ √ NA†
E2 filtrate to D1 washer
Lower clean waterconsumption & Smaller steaminjection at E2 steam mixer &Less chemicals required at E2
√ √ NA†
E2 filtrate to E2 washerLower clean waterconsumption & Smaller steaminjection at D2 steam mixer
√ √ NA†
D2 filtrate to E2 washer
Lower clean waterconsumption & Smaller steaminjection at D2 steam mixer &Less chemicals required at D2
√ √ NA†
D2 filtrate to D2 washer Lower clean waterconsumption √ NA†
† Not applicable: there are no E2 and D2 stages at the mill C
4.2.3 Step 3: Synthesis
Based on the results of previous steps, the potential for water and steam savings are synthesized
in Table 4-4 and 4-5. At mill A, the water can be reduced at washing, the pulp machine, and
recausticizing. For both lines of mill B, the water can be reduced at the pulp machine and
recausticizing and for line 2, washing and steam plants have the potential for saving water. The
main areas in mill C in which water can be reduced are washing and mechanical pulping. For all
mills, improvement of the heat exchanger network for water and air can decrease or eliminate
steam consumption to produce hot and warm water and hot and warm air for process and non-
process uses. In addition, by further improvement in the heat recovery system and supplying

69
higher temperature water to the process line and deaerator, the steam consumption can be
reduced significantly.
Table 4-4 – Summary of potential for water saving in three mills
Mill A Mill B –Line 1
Mill B –Line 2 Mill C
Washing √ √ √PM √ √ √ √Recausticizing √ √ √Steam plant √
Table 4-5 – Summary of potential for steam saving in three mills
Potential How to improveNon-process air heating HEX network
improvementProcess air heatingWater heatingSteam injection points Utilization of water at
higher temperatureDeaerator
4.3 Conclusion
A benchmarking technique has been developed to diagnose inefficiencies in steam and water
systems and begin to identify the potential for energy and water efficiency improvements. It has
been conducted on three Canadian Kraft mills. Two different approaches were introduced:
benchmarking with current practices and a comparison of cases. The benchmarking against
current practices shows the areas of inefficiency for water and steam consumptions and could
also suggest improvements. The results of the comparison of the cases from the standpoint of
water and steam allocation for different usages indicate inefficiencies in steam or water uses for
different areas of the plants. The HEX and water networks of the cases have also been compared
to determine similarities and differences and advantageous characteristics of each case in heat
recovery and water reutilization systems. The advantageous characteristics of a given case can be
used to propose the steam and water saving measures for another. To have more precise results, a
comparison of more cases is recommended.

70
5 CHAPTER 5: SIMULTANEOUS ENERGY AND WATER NETWORKSANALAYSIS
The objective of this chapter is to develop a technique to address all challenges which have been
listed in section 3.4.5 of literature review. This technique simultaneously analyzes the water and
energy system in both the process line and the water production network and determines the
projects for water and steam savings. It gives the guidelines to extract the data. It identifies the
constraints regarding the water reutilization and consumption in the process line. The
fundamentals of the technique are presented in Part I of this chapter. In Part II, the technique is
applied in three Canadian Kraft mills and the results are presented.
Figure 5-1 synthesizes the evolution of the main PI techniques to conceptually analyze water and
energy systems, individually and simultaneously. It also shows the position of this new technique
in contrast to other techniques.
5.1 Part I: Development of simultaneous energy and water networks analysis
In Part I of this chapter, first of all, the generic example is presented to show the different steps
of the technique. Then, the principle of simultaneous energy and water networks analysis
(SEWNA) is expressed and, finally, the structure is displayed.

71
Fig. 5-1 - The evolutionary diagram process integration techniques to assess water and energy systems (——— line:derived by analogy with other techniques, —∙—∙—: combination of two techniques)
Water ConservationTechniques
MathematicalConceptual(Water Pinch Analyses)
Analogy with ThermalPinch Analysis
Limiting CompositeCurves – ContaminantConcentration vs.Contaminant Mass Loadof Sinks by Wang &Smith (1994)
Graphical or TabularContaminantConcentration vs. Flowrateof Water for Sinks andSources by Dhole (1998)
Load of Contaminant vs.Flowrate of Sinks andSources by El-Halwagi etal. (2003)
Water & Energy-Oriented Techniques
Analogy with (Dhole, 1998) - Direct/Indirect HeatRecovery using Source-Demand Energy
Composite Curves by Savulescu et la. (2002)
Combination of (El-Halwagi et al., 2003),(Savulescu et al., 2002), and Thermal PinchAnalysis (Linnhoff and Witherell, 1986) by
Manan et al. (2009)
Thermal PinchAnalysis by
Linnhoff
Two-Dimensional Grid Diagram by Savulescu etal. (2005b)
Super Imposed Mass & Energy Curves -Combination of (El-Halwagi et al., 2003),
(Savulescu et al., 2002), and Thermal PinchAnalysis (Linnhoff and Witherell, 1986) by Wan
Alwi et al. (2011)
Sequential Water Pinch of (Dhole, 1998) andThermal Pinch (Linnhoff and Witherell, 1986)
Analyses by Mateos et al. (2010a)
Combined Energy and Water Optimization(CEWO)- Combination of Water Pinch of (Dhole,1998) and Reduction of Water from Origin fromMost Efficient Path by Alva-Argaez et al. (2008)
Simultaneous Energy & Water Networks Analysis– Combination of (Dhole, 1998) and Temperature
vs. Flowrate Curves and Analysis of WaterProduction Networks (This Work)
Energy ConservationTechniques

72
5.2 Case Study: Generic Example
To explain the different steps of the technique, a generic example is used and shown in Fig. 5-2.
This example has been simulated in the Aspen Plus V7.1 platform. It is a process consisting of 8
unit operations; A to H. The input of the main process line (PL) is a suspension containing a
significant amount of water that undergoes different operations. Chemicals X (CH-X) are used in
units B and F and chemical Y (CH-Y) in unit D. These chemicals have negative effects on each
other and mixing their strong solution should be prevented. There are some other assumptions
that are applied for this generic example. They are explained in the following process
description.
Unit A is a separator; water is added to the suspension and then is divided into two
portions; the suspension and the filtrate. The filtrate is rejected to a filtrate tank (FT-A)
and partially recycled before or at the same unit and the remainder is overflow from the
filtrate tank and goes to effluent (Eff-A). The temperature of the water and filtrate to this
unit should not exceed 85oC.
Unit B is a reactor where the chemical CH-X is added and some reactions are carried out.
The acceptable temperature of operation is less than 80oC. The filtrate of unit E cannot be
employed after this unit because it contains a significant amount of chemical Y and
negatively affects the suspension after unit B, which contains a considerable quantity of
chemical X.
Unit C is another separator. The steam is utilized at this unit to retain the temperature of
the suspension above 50.3oC. Similar to unit A, the suspension is separated from the
filtrate. The filtrate goes to the filtrate tank (FT-C) and is partially reutilized before and
on unit C. A part of the filtrate from unit C must be sent to effluent to prevent the build-
up of chemical X in the process line. This accounts for 29% of the filtrate that leaves unit
C. However, the remainder of the filtrate, which accounts for 66% of generated filtrate
from unit C is currently discharged to effluent (Eff-C). The temperature of the water and
filtrate to this unit should not exceed 85oC.
The suspension is heated up using steam to attain the temperature of 95oC at unit D.
Then, it goes to unit D where it is mixed with chemical CH-Y and undergoes some
reactions. The acceptable temperature of operation is less than 95oC. The filtrate of unit G
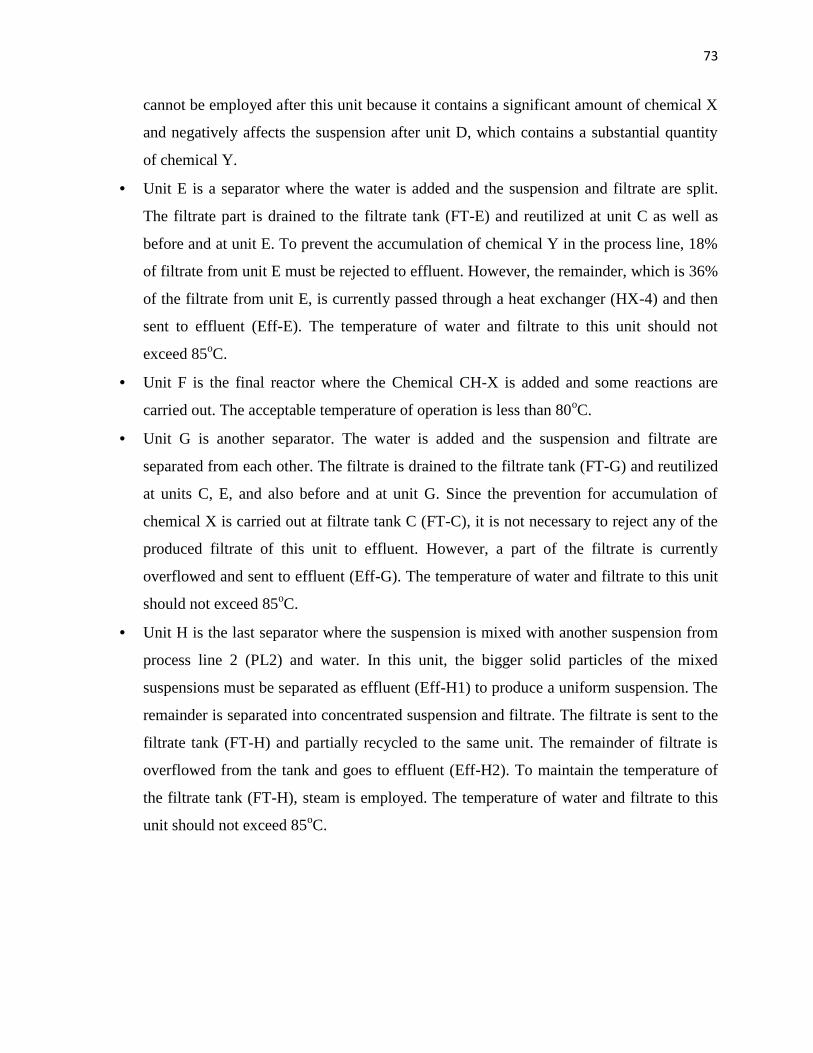
73
cannot be employed after this unit because it contains a significant amount of chemical X
and negatively affects the suspension after unit D, which contains a substantial quantity
of chemical Y.
Unit E is a separator where the water is added and the suspension and filtrate are split.
The filtrate part is drained to the filtrate tank (FT-E) and reutilized at unit C as well as
before and at unit E. To prevent the accumulation of chemical Y in the process line, 18%
of filtrate from unit E must be rejected to effluent. However, the remainder, which is 36%
of the filtrate from unit E, is currently passed through a heat exchanger (HX-4) and then
sent to effluent (Eff-E). The temperature of water and filtrate to this unit should not
exceed 85oC.
Unit F is the final reactor where the Chemical CH-X is added and some reactions are
carried out. The acceptable temperature of operation is less than 80oC.
Unit G is another separator. The water is added and the suspension and filtrate are
separated from each other. The filtrate is drained to the filtrate tank (FT-G) and reutilized
at units C, E, and also before and at unit G. Since the prevention for accumulation of
chemical X is carried out at filtrate tank C (FT-C), it is not necessary to reject any of the
produced filtrate of this unit to effluent. However, a part of the filtrate is currently
overflowed and sent to effluent (Eff-G). The temperature of water and filtrate to this unit
should not exceed 85oC.
Unit H is the last separator where the suspension is mixed with another suspension from
process line 2 (PL2) and water. In this unit, the bigger solid particles of the mixed
suspensions must be separated as effluent (Eff-H1) to produce a uniform suspension. The
remainder is separated into concentrated suspension and filtrate. The filtrate is sent to the
filtrate tank (FT-H) and partially recycled to the same unit. The remainder of filtrate is
overflowed from the tank and goes to effluent (Eff-H2). To maintain the temperature of
the filtrate tank (FT-H), steam is employed. The temperature of water and filtrate to this
unit should not exceed 85oC.
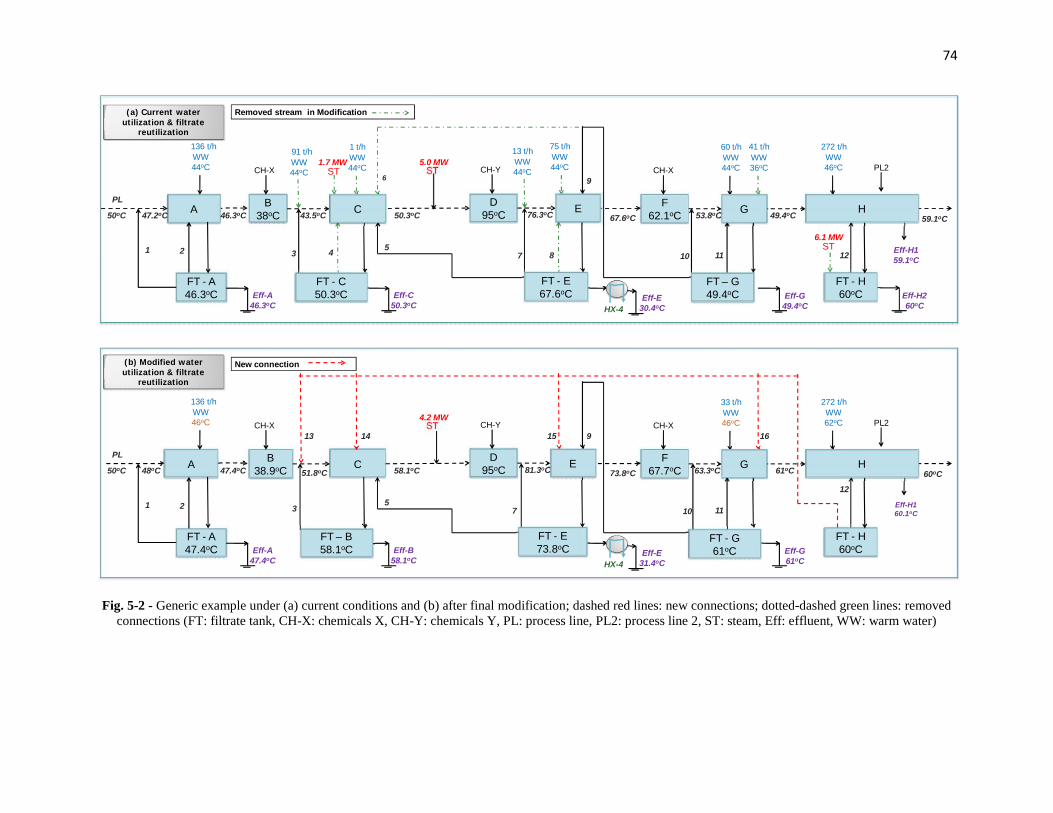
74
Fig. 5-2 - Generic example under (a) current conditions and (b) after final modification; dashed red lines: new connections; dotted-dashed green lines: removedconnections (FT: filtrate tank, CH-X: chemicals X, CH-Y: chemicals Y, PL: process line, PL2: process line 2, ST: steam, Eff: effluent, WW: warm water)
ST
B38oC 50.3oC
5.0 MWWW44oC
Eff-C50.3oC
A
FT - A46.3oC
46.3oC
CH-X
136 t/h
WW44oC
91 t/h
43.5oC
WW44oCST
1.7 MW
1 t/h
D95oC 67.6oC
CH-YWW44oC
13 t/h
76.3oC
WW44oC
75 t/h
Eff-A46.3oC
Eff-E30.4oC
FT - C50.3oC
FT - E67.6oC
F62.1oC 49.4oC53.8oC
WW44oC
60 t/h
Eff-G49.4oC
CH-XWW36oC
41 t/h
59.1oC
WW46oC
272 t/h
Eff-H260oC
FT - H60oC
ST6.1 MW
Eff-H159.1oC
47.2oC50oC
PLG HE
HX-4
PL2
1 2 3 4 5
6
7
9
10 11 128
(a) Current waterutilization & filtrate
reutilization
Removed stream in Modification
C
FT – G49.4oC
ST
CB38.9oC 58.1oC
4.2 MWWW46oC
Eff-B58.1oC
A
FT - A47.4oC
47.4oC
CH-X
136 t/h
51.8oC
D95oC 73.8oC
CH-Y
81.3oC
Eff-A47.4oC
Eff-E31.4oC
FT - E73.8oC
F67.7oC 61oC63.3oC
WW46oC
33 t/h
Eff-G61oC
CH-X
60oC
WW62oC
272 t/h
FT - H60oC
Eff-H160.1oC
48oC50oC
PLG HE
HX-4
PL2
1 2 57
9
10 11
12
14 15 1613
3
FT – B58.1oC
(b) Modified waterutilization & filtrate
reutilization
New connection
FT - G61oC
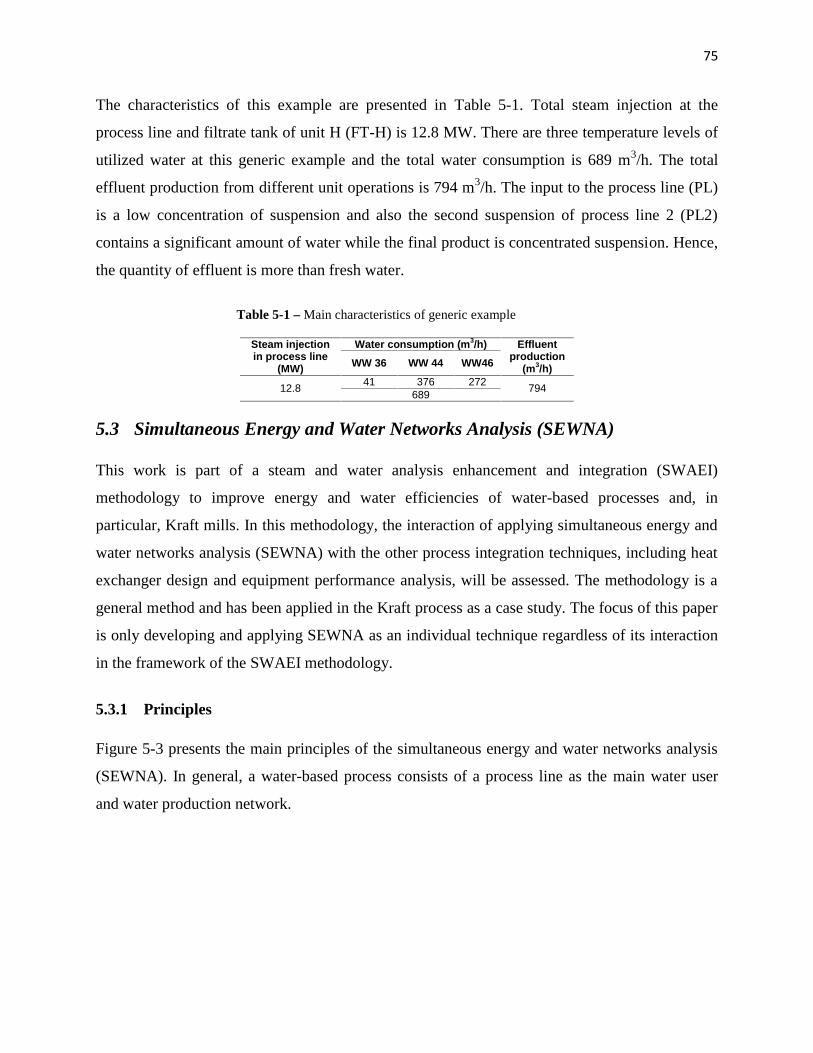
75
The characteristics of this example are presented in Table 5-1. Total steam injection at the
process line and filtrate tank of unit H (FT-H) is 12.8 MW. There are three temperature levels of
utilized water at this generic example and the total water consumption is 689 m3/h. The total
effluent production from different unit operations is 794 m3/h. The input to the process line (PL)
is a low concentration of suspension and also the second suspension of process line 2 (PL2)
contains a significant amount of water while the final product is concentrated suspension. Hence,
the quantity of effluent is more than fresh water.
Table 5-1 – Main characteristics of generic example
Steam injectionin process line
(MW)
Water consumption (m3/h) Effluentproduction
(m3/h)WW 36 WW 44 WW46
12.8 41 376 272 794689
5.3 Simultaneous Energy and Water Networks Analysis (SEWNA)
This work is part of a steam and water analysis enhancement and integration (SWAEI)
methodology to improve energy and water efficiencies of water-based processes and, in
particular, Kraft mills. In this methodology, the interaction of applying simultaneous energy and
water networks analysis (SEWNA) with the other process integration techniques, including heat
exchanger design and equipment performance analysis, will be assessed. The methodology is a
general method and has been applied in the Kraft process as a case study. The focus of this paper
is only developing and applying SEWNA as an individual technique regardless of its interaction
in the framework of the SWAEI methodology.
5.3.1 Principles
Figure 5-3 presents the main principles of the simultaneous energy and water networks analysis
(SEWNA). In general, a water-based process consists of a process line as the main water user
and water production network.

76
Fig. 5-3 – Simple schematic of the principle of simultaneous energy and water networks analysis (SEWNA)
A portion of generated steam from the boilers is utilized to produce hot and/or warm water using
steam heaters or steam injection at the water network. A part is also used to be injected to attain
and retain the temperature of the process line. Thus, it could be said that there are two types of
steam consumption: steam consumption linked to water production and steam consumption
linked to water consumption. The latter one shows that if water at low temperature is utilized in
the process, more steam is needed to attain and retain the temperature of the process line.
In the configuration of Fig. 5-3, the heat and mass balances can be written as follows:
+ + = + [1]
+ + + = + [2]
Waterconsumption:
M2 < M1M4 < M3
Hot & Warm watertemperature:
T2 > T1T4 > T3
Effluent production:M6 < M5Q6 < Q5
Rawmaterial(MR t/h &QR MW)
Steam(Q1 MW)
Product(MP t/h &QP MW)
Hot / warmWater Tank
SteamHEX (Q0
MW)
Process streamHEX
(Q MW)
FW(M1 t/h)
FW(M3 t/h)
HW (T1)/WW (T3)
Steam(Q2 MW)
Hot / warmWater Tank
Process streamHEX
(Q MW)
FW(M2 t/h)
FW(M4 t/h)
HW (T2)/WW (T4)
Liquid effluent(M5 t/h & Q5 MW)
Process
Liquid effluent(M6 t/h & Q6 MW)
Process
Q0 removed
Q2 < Q1
Q2 < Q1
Current Modified
Rawmaterial(MR t/h &QR MW)
Product(MP t/h &QP MW)
Steamconsumption
77
where the M1 and M3 are the mass of water inputs and MR is the mass of raw material, while M5
and MP denote mass of effluent output and product, respectively. Q and Q0 are recovered heat
from process streams and the heat of steam to produce warm and hot water using HEX network,
respectively. Q1 is the heat of injected steam to the process line. QR denotes the heat content of
the raw material. Q5 and QP represent the heat content of the effluent and product, respectively.
The objectives of SEWNA are to simultaneously
Decrease water consumption; M1M2 and M3M4
Reduce the steam consumption linked to both water consumption (Q1 Q2) and water
production (Q0 removed) (Fig. 5-3).
In the case of steam consumption linked to water production, the goal is to eliminate the steam
heater and steam injection for hot and warm water production (Q0 removed).
For the steam consumption linked to water consumption, the story differs from the case of water
production.
By reducing the total water consumption (M1 M2 and M3 M4), correspondingly,
the total effluent production declines (M5M6).
The total rejected heat by effluent is also reduced significantly (Q5 Q6) and the
demand for steam injection to the process line is diminished (Q1 Q2).
By reducing the water consumption (M1 M2), the existing HEXs of the water
production network should be revamped due to less water demand for the process.
o Since M1 ( M2) is reduced, there is a potential to reach the first objective,
which was the removal of steam heaters and steam injections for hot and/or warm
water production.
o Secondly, using the water network and exploiting the same available heat (Q) in
the process stream HEXs, hot and warm water at higher temperature can be
produced (T1 T2).
Utilization of warmer and hotter temperature water will also shift the heat load from
steam to water and results in a reduction of steam injection at the process line (Q1
Q2).

78
5.3.2 Structure
The structure of simultaneous energy and water networks analysis (SEWNA) is illustrated in Fig.
5-4. The technique consists of five successive steps; data extraction, constraint analysis, water
and energy analysis, hot and warm water network analysis and, finally, economic analysis. Each
step is elaborated in the following sections.
Fig. 5-4 - Simultaneous energy and water networks analysis (SEWNA)
5.3.2.1 Step 1: Data extraction
Data extraction is a crucial step in this analysis, because the final results highly depend on the
quality of the employed data. To extract the data, the first task is to determine the control volume
(Fig. 5-5). Control volume is started in the process line (PL) from the outlet of a unit operation
that generates the filtrate (e.g., separator unit A) until the outlet of the next unit operation(s) that
again generates the filtrate (e.g., separator unit C). It means that the control volume should
include the unit(s) with at least one filtrate stream. For example, unit B by itself cannot be the
Step 1: Data Extraction
Flowrate (t/h or m3/h), contaminant concentration (ppm), T (oC) Identification of inevitable effluents
Step 2: Constraint Analysis
Identification of steam saving potential in process line Evaluation of acceptable temperature of reactors (e.g., bleaching
reactors in Kraft process) Assessment of acceptable temperature of water to temperature
sensitive equipment (e.g., washers in Kraft process)
Step 3: Water & Energy Analysis
Water & Energy Pinch Curves Identification of water projects with respect to steam reduction and
practical rules
Step 4: Hot & Warm Water Network Analysis
Elimination of steam consumption in water network Identification of new temperature based on “Process Stream HEXs”
Step 5: Economic Analysis
Piping cost calculation
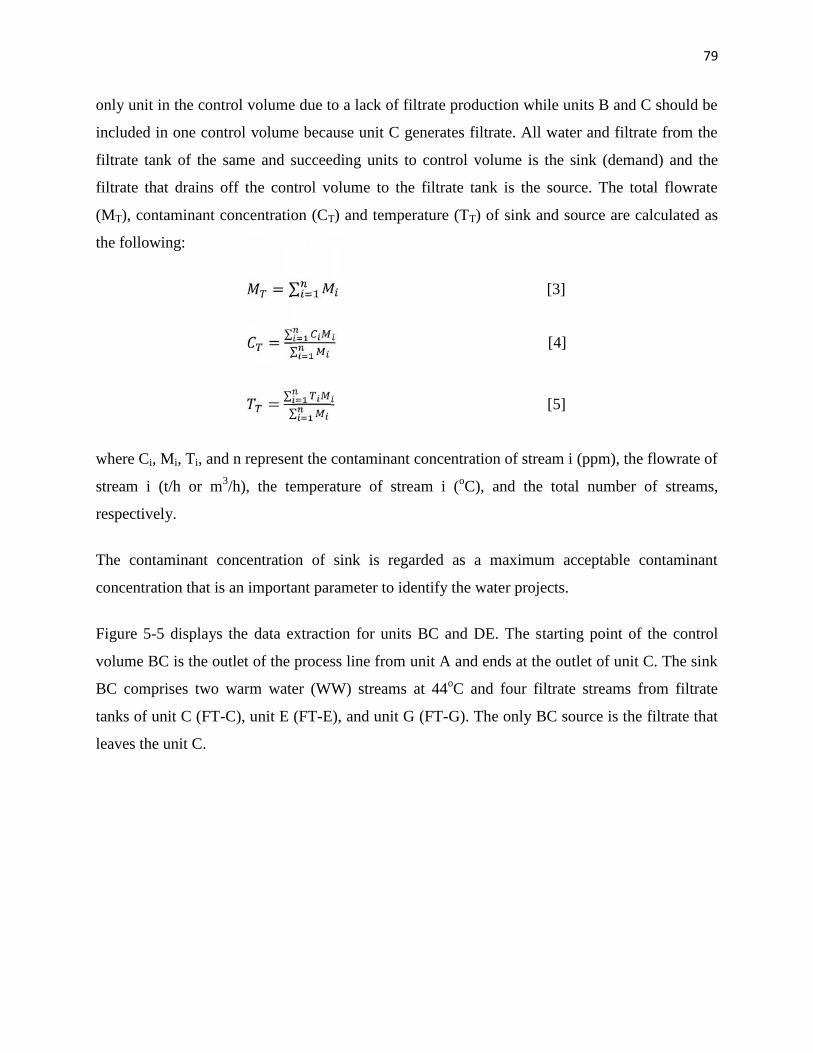
79
only unit in the control volume due to a lack of filtrate production while units B and C should be
included in one control volume because unit C generates filtrate. All water and filtrate from the
filtrate tank of the same and succeeding units to control volume is the sink (demand) and the
filtrate that drains off the control volume to the filtrate tank is the source. The total flowrate
(MT), contaminant concentration (CT) and temperature (TT) of sink and source are calculated as
the following:
= ∑ [3]
= ∑∑ [4]
= ∑∑ [5]
where Ci, Mi, Ti, and n represent the contaminant concentration of stream i (ppm), the flowrate of
stream i (t/h or m3/h), the temperature of stream i (oC), and the total number of streams,
respectively.
The contaminant concentration of sink is regarded as a maximum acceptable contaminant
concentration that is an important parameter to identify the water projects.
Figure 5-5 displays the data extraction for units BC and DE. The starting point of the control
volume BC is the outlet of the process line from unit A and ends at the outlet of unit C. The sink
BC comprises two warm water (WW) streams at 44oC and four filtrate streams from filtrate
tanks of unit C (FT-C), unit E (FT-E), and unit G (FT-G). The only BC source is the filtrate that
leaves the unit C.

80
Fig. 5-5 – Procedure for data extraction of units BC and DE of the generic example (Fig. 5-2) and constraintanalysis for water reutilization (WW: warm water, Eff: effluent, FT: filtrate tank)
Data for the sink and source of each unit are extracted and presented in ascending order of
contaminant concentration in Table 5-2 and 5-3.
Table 5-2 – Extracted data for all sinks inascending order of contaminant concentration
Sink Flowrate(t/h)
Contaminantcon. (ppm)
T (oC)
DE 312 2939 59.2BC 266 2423 48.8FG 286 2378 46.4H 4729 323 59.2A 428 17 45.6
Table 5-3 – Extracted data in ascending order of contaminant concentration for (a) overall sources, (b) inevitableeffluents, and (c) final sources after excluding the inevitable effluents
a (overall sources) b (inevitable effluents) c (Final sources)OverallSource
Flowrate(t/h)
Contaminantcon. (ppm)
T(oC)
Inevitableeffluent
Flowrate(t/h)
FinalSource
Flowrate(t/h)
Contaminantcon. (ppm)
T(oC)
DE 328 4194 67.6 DE 59 DE 269 4194 67.6FG 299 3670 49.4 FG 299 3670 49.4BC 290 3649 50.3 BC 84 BC 206 3649 50.3H 4743 343 59.1 H 4743 343 59.1A 429 25 46.3 A 429 25 46.3
Eff-H1 24
The inevitable effluent streams should also be identified and subtracted from the source pool so
as to prevent chemical and big solid particle accumulation and scaling in the process line.
According to the process description, the inevitable effluent streams are 29% of filtrate from unit
C (containing a high concentration of chemical X), 18% of filtrate from unit E (containing a high
ST
CB38oC 50.3oC
5.0 MW
Eff-C50.3oC
46.3oC
CH-AWW44oC
91 t/h
43.5o
C
WW44oCST
1.7 MW
1 t/h
FT-C50.3oC
3649 ppm
PL
70 t/h 30 t/h
95oC
290 t/hFrom FT-E
14 t/h67.6oC
4194 ppm
From FT-G60 t/h49.4oC
3670 ppm
T of B:<80 oC
ControlVolume
T of water to C<85 oC
Flowrate(t/h)
Contaminantconcentration (ppm)
T(oC)
BC sink 266 2423 48.8BC source 290 3649 50.3
(a) BC
95oCD
95oC 67.6oC
CH-BWW44oC
13 t/h
76.3oC
WW44oC
75 t/h
Eff-E30.4oC
FT-E67.6oC
4194 ppm
PLE
HX-4
From FT-G29 t/h49.4oC
3670 ppm
154 t/h 40 t/h 328 t/h
T of D:<95 oC
Flowrate(t/h)
Contaminantconcentration (ppm)
T(oC)
DE sink 312 2939 59.2DE source 328 4194 67.6
ControlVolume
T of water to E<85 oC
(b) DE

81
concentration of chemical Y) and all suspension reject containing big solid particles from unit H
(Eff-H1). The values of inevitable effluents are presented in Table 5-3b. Table 5-3c is the final
source for water and energy analysis and is the subtraction of Table 5-3b (inevitable effluents)
from Table 5-3a (overall sources).
5.3.2.2 Step 2: Constraint analysis
Analysis of the constraints is a prerequisite task to define the projects for efficient water reuse.
Each process has its own restrictions for water reutilization that should be identified in the early
stages of the design. The first task in constraint analysis is to determine the potential for steam
savings in the process line. In the Fig. 5-5, the principal difference between the control volume
BC and DE is that in and after BC, the steam is injected in the process line while in and after
DE, there is no steam demand. If the water and recycled filtrate to sink BC are supplied at a
higher temperature than it is currently (48.8oC), the steam demand at unit C and after unit C will
decrease significantly. In the case of the generic example, there are three points where steam is
injected into the process line and by improving water reutilization and also providing clean water
at a higher temperature to the process line, there is potential for steam reduction or elimination at
these points. They are positioned at unit C, before unit D, and the filtrate tank of unit H (FT-H).
It is important to notice that when the projects for filtrate reutilization and water utilization are
identified the temperature of the process line to the reactor should not go beyond the acceptable
temperature of the units (herein reactor units B, D, and F). The temperature of water and filtrate
to temperature sensitive equipments (herein separator units A, C, E, G, and H) also should not be
more than the acceptable temperature of water/filtrate to this type of unit. For example, in Fig.
5-5, the acceptable temperature of unit B is less than 80oC and the acceptable temperature of
water/filtrate to unit C is less than 85oC. The acceptable temperature of reactor units B, D, and F
are respectively 80, 95, and 80oC while the maximum allowable temperature of water and filtrate
to separator units (A, C, E, G, and H) is 85oC as mentioned in the process description.
5.3.2.3 Step 3: Water and energy analysis
5.3.2.3.1 Rules for water reutilization
One principle rule and two heuristic rules are established to determine the water reuse projects:

82
Rule 1 - Countercurrent flow rule: do not reuse the filtrate of the preceding unit in the
following units. Nevertheless, the filtrate of the preceding unit is clean enough for
reutilization (Fig. 5-6a).
Rule 2 - Existing connections and flowrates consideration: retain the existing connections
with the highest flowrate (Fig. 5-6b). For example, in Fig. 5-5, the largest flowrate of
filtrate to control volume BC is 100t/h from the filtrate tank of unit C (FT-C) and
similarly for DE it is 195 t/h of filtrate from the filtrate tank of unit E (FT-E). In the
project proposition, these connections should be kept in order to avoid substantial
changes.
Rule 3 - Higher temperature before steam injection (Fig. 5-6c):
a. Reuse the higher temperature filtrate before steam injection points. Do not just
follow the clean to clean rule of El-Halwagi et al. (2003).
b. Utilize the higher temperature water before steam injection points.
The other heuristic rules also can be defined based on the nature of the process. For example,
another heuristic rule for the generic example (Fig. 5-2) can be defined as follows:
Rule 4 - Avoid dissimilar mixing: in the generic example it is assumed that chemical X
has a negative impact on chemical Y and vice versa. Therefore, do not reutilize the
filtrate from unit E in the process line after reactor unit B because this filtrate from unit E
contains a significant amount of chemical Y, which negatively affects the suspension at
the outlet of unit B, which contains a large amount of chemical X. However, the filtrate
from unit E can be used at separator unit C because the suspension after unit C is directed
to unit D, which requires chemical Y. A similar argument can be used for the reutilization
of filtrate from unit G after unit D and at unit E (Fig. 5-6d).
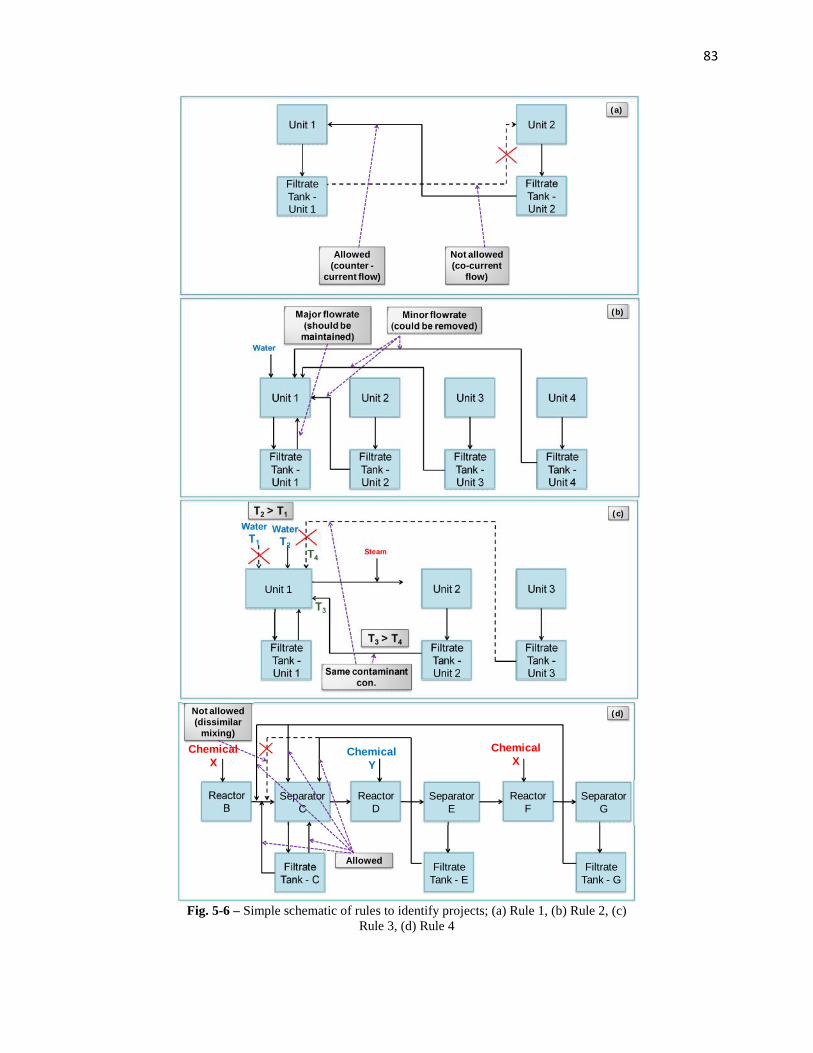
83
Fig. 5-6 – Simple schematic of rules to identify projects; (a) Rule 1, (b) Rule 2, (c)Rule 3, (d) Rule 4
Unit 1 Unit 2
FiltrateTank -Unit 2
Not allowed(co-current
flow)
Allowed(counter -
current flow)
FiltrateTank -Unit 1
(a)
Unit 1 Unit 2
FiltrateTank -Unit 1
FiltrateTank -Unit 2
Unit 3 Unit 4
FiltrateTank -Unit 3
FiltrateTank -Unit 4
Water
Major flowrate(should be
maintained)
Minor flowrate(could be removed)
(b)
Unit 2
FiltrateTank -Unit 1
FiltrateTank -Unit 2
Unit 3
FiltrateTank -Unit 3
WaterT2
Steam
WaterT1
T3
T4
Same contaminantcon.
T2 > T1
T3 > T4
(c)
Unit 1
ReactorB
FiltrateTank - C
ChemicalX
Not allowed(dissimilar
mixing)
Allowed
SeparatorC
ReactorD
FiltrateTank - E
ChemicalY
SeparatorE
ReactorF
FiltrateTank - G
ChemicalX
SeparatorG
(d)
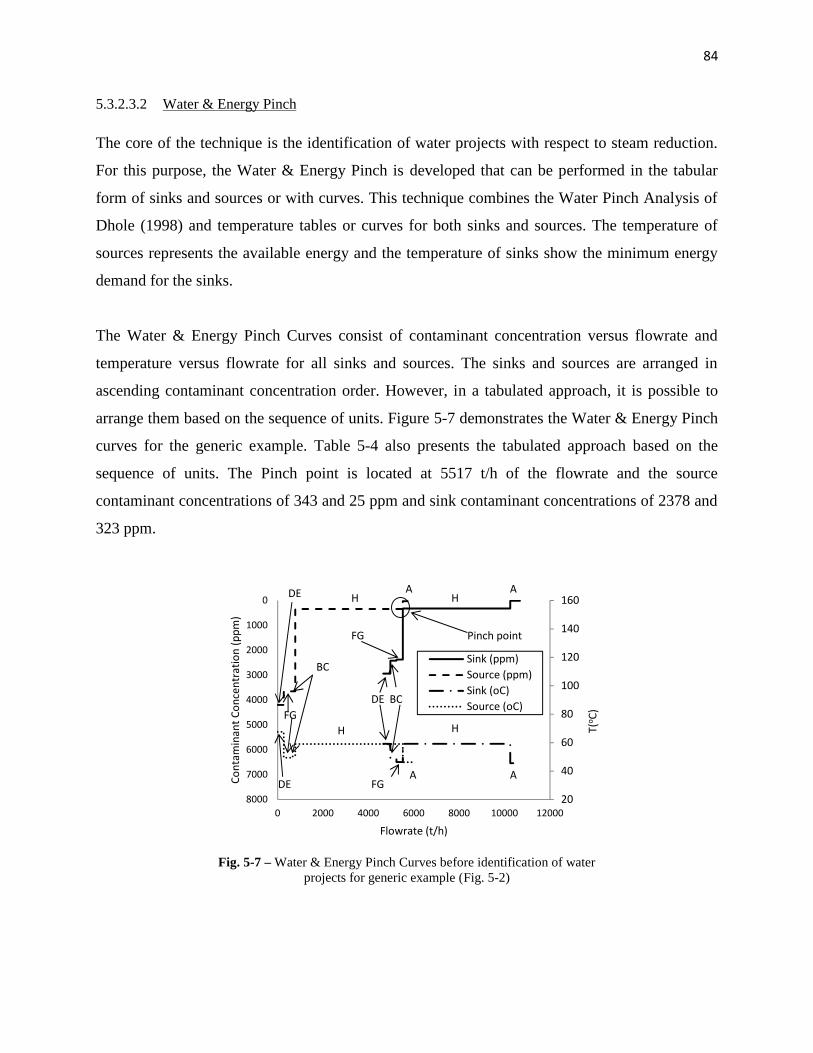
84
5.3.2.3.2 Water & Energy Pinch
The core of the technique is the identification of water projects with respect to steam reduction.
For this purpose, the Water & Energy Pinch is developed that can be performed in the tabular
form of sinks and sources or with curves. This technique combines the Water Pinch Analysis of
Dhole (1998) and temperature tables or curves for both sinks and sources. The temperature of
sources represents the available energy and the temperature of sinks show the minimum energy
demand for the sinks.
The Water & Energy Pinch Curves consist of contaminant concentration versus flowrate and
temperature versus flowrate for all sinks and sources. The sinks and sources are arranged in
ascending contaminant concentration order. However, in a tabulated approach, it is possible to
arrange them based on the sequence of units. Figure 5-7 demonstrates the Water & Energy Pinch
curves for the generic example. Table 5-4 also presents the tabulated approach based on the
sequence of units. The Pinch point is located at 5517 t/h of the flowrate and the source
contaminant concentrations of 343 and 25 ppm and sink contaminant concentrations of 2378 and
323 ppm.
Fig. 5-7 – Water & Energy Pinch Curves before identification of waterprojects for generic example (Fig. 5-2)
20
40
60
80
100
120
140
1600
1000
2000
3000
4000
5000
6000
7000
80000 2000 4000 6000 8000 10000 12000
Cont
amin
ant C
once
ntra
tion
(ppm
)
Flowrate (t/h)
Sink (ppm)Source (ppm)Sink (oC)Source (oC)
T(o C
)AA
AA
BC
BC
DE
DE
DE
FG
FG
FG
H H
H H
Pinch point

85
Table 5-4 – Tabulated Water & Energy Pinch beforeidentification of water projects for generic example(Fig. 5-2)
Sink SourceF
(t/h)C
(ppm)T
(oC)F
(t/h)C
(ppm)T
(oC)A 428 17 45.6 429 25 46.3
BC 266 2423 48.8 206 3649 50.3DE 312 2939 59.2 269 4194 67.6FG 286 2378 46.4 299 3670 49.4H 4729 323 59.2 4743 343 59.1
WW36 41 36WW44 377 44WW46 272 46
5.3.2.3.3 Water & energy projects identification
Water first should be supplied to those sinks with the lowest acceptable contaminant
concentration (A and H) and then others (BC, DE, and FG). If the acceptable contaminant
concentration of some units is close, as in the case of BC, DE, and FG, the one in which steam is
used in or after should be evaluated first. It means that the order to supply water is A, H, BC,
DE, and FG. The sources and clean water at the current temperature levels should be mixed to
obtain the contaminant concentration and temperature for the sink according to the following
conditions:
Contaminant concentration to sink ≤ acceptable contaminant concentration of the sink [6]
Temperature to sink ≥ Current temperature of the sink(Especially when there is steam injection in or after the sink) [7]
Sink A can receive the water from all sources according to rule 1. Nevertheless, Fig. 5-7
indicates that if the other sources rather than source A want to be reutilized, the clean water
consumption should substantially increased. Therefore, similar to current configuration, warm
water at 44oC (WW44) is used to dilute source A (rule 2) and make it suitable for sink A. Hence
there is no change in the current configuration (Fig. 5-8 & Table 5-5).
According to the traditional rule of “clean to clean” (Dhole, 1998; El-Halwagi et al., 2003), sink
H can receive the water from source A (Fig. 5-7). Nevertheless, according to rule 1 and 2 of this
work, this sink can only receive water from the source H and warm water. Since the current
existing warm water to this unit is WW46, this water is utilized to dilute the source H for sink H
(Fig. 5-8 & Table 5-5). This selection does not alter the current configuration of water supply at
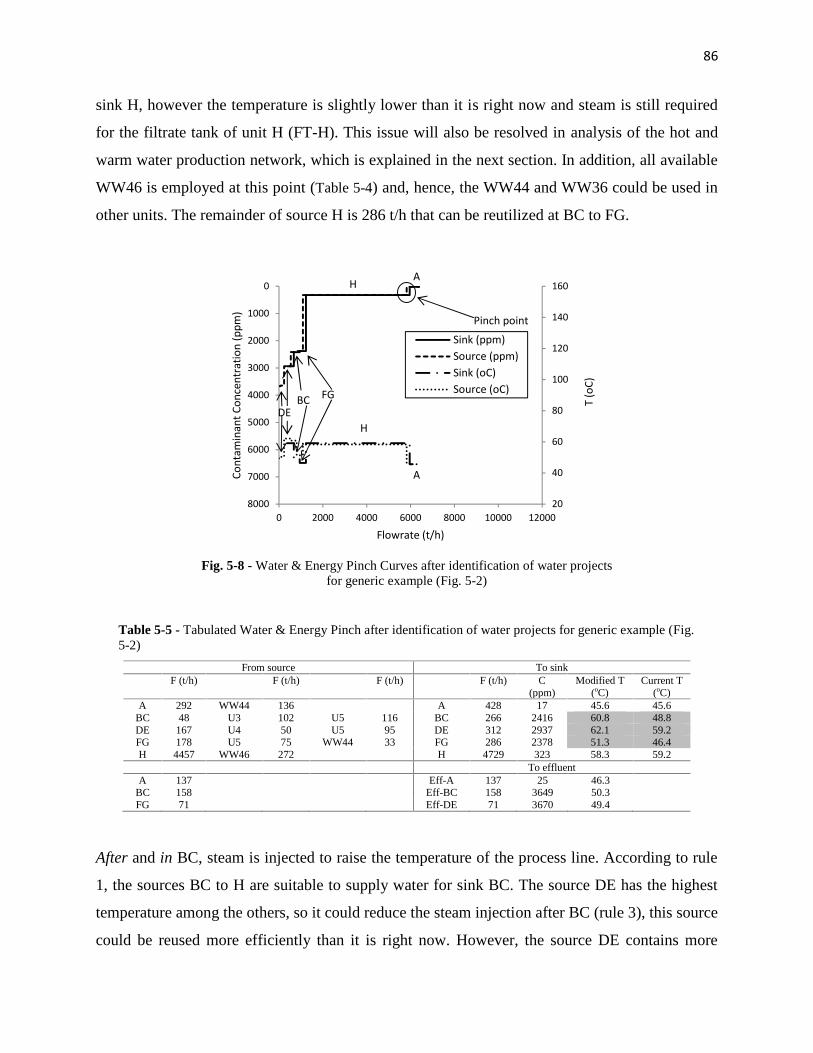
86
sink H, however the temperature is slightly lower than it is right now and steam is still required
for the filtrate tank of unit H (FT-H). This issue will also be resolved in analysis of the hot and
warm water production network, which is explained in the next section. In addition, all available
WW46 is employed at this point (Table 5-4) and, hence, the WW44 and WW36 could be used in
other units. The remainder of source H is 286 t/h that can be reutilized at BC to FG.
Fig. 5-8 - Water & Energy Pinch Curves after identification of water projectsfor generic example (Fig. 5-2)
Table 5-5 - Tabulated Water & Energy Pinch after identification of water projects for generic example (Fig.5-2)
From source To sinkF (t/h) F (t/h) F (t/h) F (t/h) C
(ppm)Modified T
(oC)Current T
(oC)A 292 WW44 136 A 428 17 45.6 45.6
BC 48 U3 102 U5 116 BC 266 2416 60.8 48.8DE 167 U4 50 U5 95 DE 312 2937 62.1 59.2FG 178 U5 75 WW44 33 FG 286 2378 51.3 46.4H 4457 WW46 272 H 4729 323 58.3 59.2
To effluentA 137 Eff-A 137 25 46.3
BC 158 Eff-BC 158 3649 50.3FG 71 Eff-DE 71 3670 49.4
After and in BC, steam is injected to raise the temperature of the process line. According to rule
1, the sources BC to H are suitable to supply water for sink BC. The source DE has the highest
temperature among the others, so it could reduce the steam injection after BC (rule 3), this source
could be reused more efficiently than it is right now. However, the source DE contains more
20
40
60
80
100
120
140
1600
1000
2000
3000
4000
5000
6000
7000
80000 2000 4000 6000 8000 10000 12000
Cont
amin
ant C
once
ntra
tion
(ppm
)
Flowrate (t/h)
Sink (ppm)Source (ppm)Sink (oC)Source (oC)
T (o
C)
AH
A
HDE
BC FG
Pinch point

87
contaminant than source BC (Fig. 5-7) and mixing the source BC with source DE violates the
traditional rule of cleanest to cleanest (Dhole, 1998; El-Halwagi et al., 2003). This shows one of
the main features of the technique that clearly reveals the importance of countercurrent flows as
well as raising the temperature for sinks, and not only the importance of contaminant
concentration. Furthermore, the source DE cannot be reused after unit B (rule 4), but can only be
used at unit C. Sink DE itself requires 167 t/h of source DE after unit D, so the remainder filtrate
from source DE (102 t/h) could be used at unit C, which needs 105 t/h of water. The rest of the
water for sink BC could be supplied by mixing either source BC or FG with source H. Source
BC is preferred over source FG because of the existing connection (rule 2) and its higher
temperature (rule 3). The result is presented in Table 5-5 and Fig. 5-8. The temperature for sink
BC significantly rises from 48.8 to 60.8oC and results in lower steam consumption at and after
unit C.
Sink DE, respecting rule 1, can receive the water from sinks DE, FG, and H. In the current
configuration, source DE provides more than 60% of the water demand for sink DE. Therefore,
according to rule 2, this connection should be retained. In the current configuration, sink DE
consumes 167 t/h of water after unit D and 145 t/h at unit E. Thus, according to rule 4, the source
FG can only be utilized at unit E, not after unit D. As mentioned earlier, 167 t/h of source DE is
reutilized after unit D and the remainder is provided from source FG and H (Fig. 5-8 & Table
5-5). This also raises the temperature of the water for sink DE from 59.2 to 62.1oC. However, it
does not affect the steam consumption directly, but it would raise the temperature of the process
line and result in steam savings at the filtrate tank of unit H (FT-H).
After and in FG there is no steam injection and the only available sources for sink FG are
sources FG and H, according to rule 1. In the current configuration sink FG receives around 55%
of its demand from source FG, so in the modification this also should be taken into account (rule
2). The remainder of source H after reutilization in BC, DE and H is 75 t/h. This water and
WW44 could be used to dilute the source FG and make it appropriate for sink FG. The final
proposition for this unit is shown in Table 5-5 and Fig. 5-8. This raises the temperature for sink
FG from 46.4 to 51.3oC. Similar to sink DE, this would not directly affect the steam consumption
but it would save steam at the filtrate tank of unit H (FT-H) by raising the temperature of the
process line.

88
The Pinch point is changed to the flowrate of 5959, sink contaminant concentrations of 324 and
17 ppm, and source contaminant concentrations of 25 and 17 ppm. By applying this step, from
the current water sources, 272 t/h of WW46 is used at sink H and 169 t/h of WW44 is utilized at
sinks A and FG. The remainder that involves 208 t/h of WW44 and all WW36 (41 t/h) is saved.
5.3.2.4 Step 4: Hot and warm water network analysis
The current hot and warm water network is illustrated in Fig. 5-9a. To produce and store three
levels of warm water (WW36, 44, and 46oC), three warm water tanks (WWT1-3), five process
stream heat exchangers (HX1-2, 4-6), and one steam heater (HX3) have been employed. The
current heat exchanged in the process stream HEXs is 28.91 MW.
A surface condenser (HX1) is used to condense a non-clean flashed steam and recovers
4.06 MW heat.
A water economizer (HX2) is employed to absorb 7.04 MW heat from a stack gas and
generate 50oC warm water.
A steam heater (HX3) is employed to produce 202 t/h of warm water at 13oC using 2.31
MW of live steam.
This water is consequently passed through E-exchanger (HX4) to recover 4.98 MW of
heat from liquid effluent (Fig. 5-2a) from the filtrate tank of unit E (FT-E) and generate
warm water at 36oC.
Surface condenser (HX5) condensates a clean flashed steam and recovers 2.55 MW of
heat.
Another water economizer (HX6) recovers 10.28 MW of heat from an air exhaust and
produces water at 46oC.
After applying step 3 and identifying the water projects and water savings, it is necessary to
reduce the saved water from the resources. The existing hot and warm water network should be
redesigned so as to reduce the saved water (249 t/h), eliminate steam as one of the goal of this
analysis, and finally identify the new water temperature based on the existing process stream
heat exchangers and their heat load. Figure 5-9b illustrates the water network after the
modification. The steam heater (HX3) is completely removed and results in 2.3 MW of steam

89
savings. In addition, surface condenser (HX5) is also removed and its clean flashed steam is
injected into warm water tank #3 (WWT3) to raise the temperature to 62oC. The temperature
level of water to A and FG rises from 44 to 46oC while for H, it rises from 46 to 62oC (Fig.
5-9b). The total heat that is exchanged by the four process stream heat exchangers (HX1, 2, 4, 6)
is 23.53 MW. This value is even smaller than the current heat exchanged (26.36 MW) of these
four heat exchangers while producing warmer and hotter water. Since the total water that passes
through these heat exchangers decreases, water at higher temperature can be produced. To
maintain the same area of heat exchangers as existing ones, the total heat exchanged should be
reduced and the temperature of each heat exchanger should also be adjusted.

90
Fig. 5-9 – (a) Existing and (b) final hot and warm water network for generic example
HX3:Steam HEX
2.31 MW8 m2
13oC
HX1: Surfacecondenser
4.06 MW32 m2
20oC
HX2: Watereconomizer
7.04 MW5162 m2
50oC
ANon-clean
flashed steam75oC
61.6oC215 t/h
Stack gas86oC
29oCC
E
GSteam192oC
Condensate95oC
202 t/h
HX4: E-Exchanger
4.98 MW764 m2
36oC
EFF-E67.6oC
30.4oC
WWT 1(44oC)
WWT 2(36oC)
HX5: Surfacecondenser
2.55 MW13 m2
11oC
HX6: Watereconomizer10.28 MW4849 m2
46oCH
Clean flashedsteam95oC
93oC272 t/h
Exhaust air75oC
42.6oC
WWT 3(46oC)
FW (2
o C)
161 t/h
136 t/h
92 t/h
88 t/h
60 t/h
41 t/h
272 t/h
(a) Current water production network
Steam heaterExisting HEX
HX1: Surfacecondenser
4.06 MW32 m2
20oC
HX2: Watereconomizer
6.36 MW5162 m2
57.6oC
ANon-clean
flashed steam75oC
61.6oC208 t/h
Stack gas86oC
34.5oC
G
H
Clean flashedsteam95oC
WWT 3(62oC)
136 t/h
33 t/h
272 t/h
HX6: Watereconomizer10.28 MW4849 m2
46oC
Exhaust air75oC
42.6oC
132 t/h
11oC
101 t/h
HX4: E-Exchanger
2.83 MW764 m2
27.7o
C
EFF-E73.9oC
31.3oC
75 t/h
265 t/h
WWT 2(24.4oC)
96 t/h
WWT 1(46oC)
FW (2
o C)
(b) Final water production network

91
5.3.2.4.1 Final configuration of the process line
Applying all the modifications of step 3 and incorporating the new water temperatures of step 4
are displayed in Fig. 5-2b as the final configuration. The changes in flowrate of each existing
connection and new connection are presented in Table 5-6. In total there are three eliminated
connections while four new connections should be made and the effluent from the filtrate tank of
unit H (Eff-H1) is completely recycled in the process. The flowrate of most of the reutilized
filtrates to different units are also changed. These results show that the existing filtrate
reutilization should not be assumed to be efficient, but can be improved upon.
Table 5-6 – (a) The final changes in flowrate of existing connectionsand (b) new connections
Connection# From To
Flowrate (m3/h)
Current Final
(a) Existing Connection
1 FT-A Before A 50 50
2 FT-A A 242 242
3 FT-BC After B 70 48
4 FT-BC C 30 Removed
5 FT-DE C 14 102
6 FT-FG C 60 Removed
7 FT-DE After D 154 167
8 FT-DE E 40 Removed
9 FT-FG E 29 50
10 FT-FG After F 156 156
11 FT-FG G 30 22
12 FT-H H 1238 1238
(b) New Connection
13 FT-H Before C - 113
14 FT-H C - 3
15 FT-H E - 95
16 FT-H G - 75
Applying the new water temperature raises the temperature to sinks. The temperature of the total
water to each sink under the current conditions, after applying step 3 (with the current water
temperature of 36, 44, and 46oC) and step 4 and determining the new water temperature (46 and
62oC), are displayed in Fig. 5-10. Results show that the temperature of water to sinks BC, DE,
and FG rose after step 3 while it dropped down for sink H and steam was still required to

92
maintain the temperature of the filtrate tank of unit H (FT-H). After applying step 4, by
providing the water at a higher temperature (62oC), the temperature of water going to sink H
returns to the desired temperature, so the steam in FT-H is not required anymore. In other words,
the heat load to FT-H is shifted from steam to water. This shows an important aspect of this
technique and the importance of performing step 4, because applying this step results in steam
savings at both the hot and warm water networks and the process line while applying only step 3
results in partial steam savings on the process line.
Fig. 5-10 – Temperature of total water and filtrate to sinks under current conditions afterapplying step 3 and 4
5.3.2.4.2 Summary of savings
The total steam and water savings as well as effluent reduction are summarized in Table 5-7. The
water is significantly saved at BC, DE, and FG and correspondingly the effluents are
substantially reduced from DE, FG, and H. However, the effluent of BC has been increased. The
total water savings and effluent reduction are 36 and 33%, respectively. The steam injection in
the process line is eliminated at unit A and the filtrate tank of unit H (FT-H) and also reduced
before unit D. The only steam heater to produce warm water (HX3) is removed. The steam
savings over the current consumption of these four steam users is 73%.
45
47
49
51
53
55
57
59
61
63
0 1000 2000 3000 4000 5000 6000 7000
T (o C
)
Flowrate (t/h)
Current
Modified-Current CleanWater NetworkModified-Modified WaterNetwork
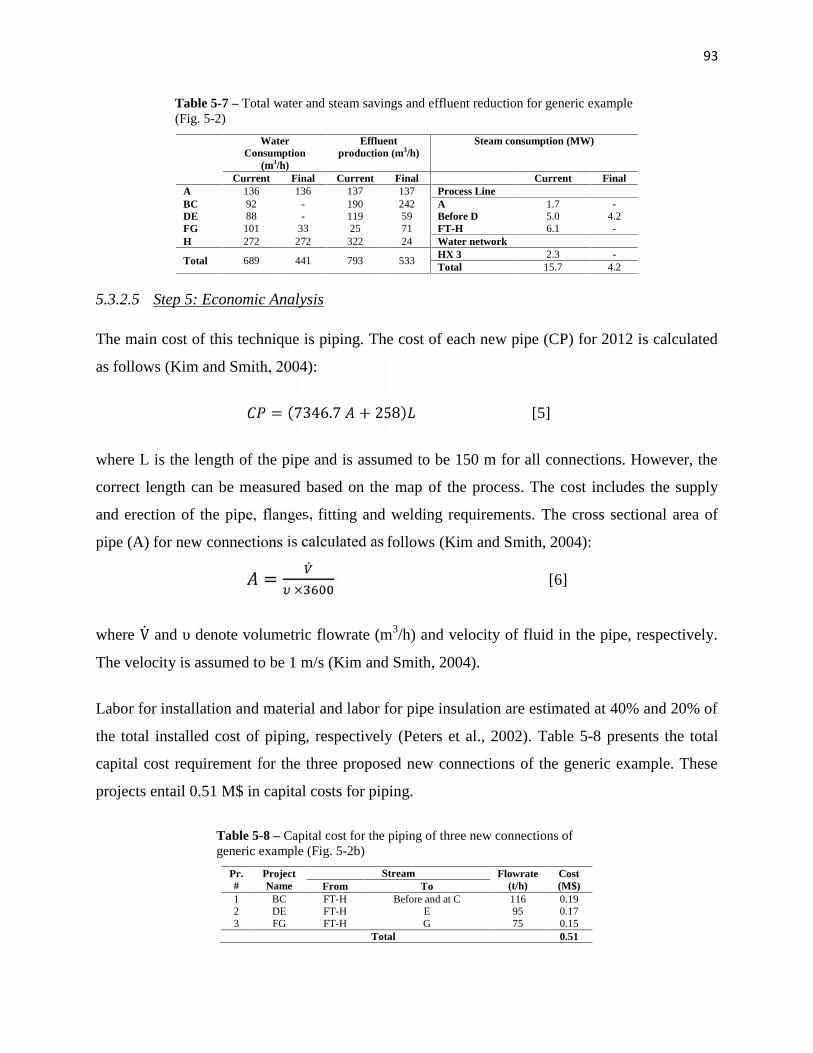
93
Table 5-7 – Total water and steam savings and effluent reduction for generic example(Fig. 5-2)
WaterConsumption
(m3/h)
Effluentproduction (m3/h)
Steam consumption (MW)
Current Final Current Final Current FinalA 136 136 137 137 Process LineBC 92 - 190 242 A 1.7 -DE 88 - 119 59 Before D 5.0 4.2FG 101 33 25 71 FT-H 6.1 -H 272 272 322 24 Water network
Total 689 441 793 533HX 3 2.3 -Total 15.7 4.2
5.3.2.5 Step 5: Economic Analysis
The main cost of this technique is piping. The cost of each new pipe (CP) for 2012 is calculated
as follows (Kim and Smith, 2004):
= (7346.7 + 258) [5]
where L is the length of the pipe and is assumed to be 150 m for all connections. However, the
correct length can be measured based on the map of the process. The cost includes the supply
and erection of the pipe, flanges, fitting and welding requirements. The cross sectional area of
pipe (A) for new connections is calculated as follows (Kim and Smith, 2004):= ̇× [6]
where V̇ and υ denote volumetric flowrate (m3/h) and velocity of fluid in the pipe, respectively.
The velocity is assumed to be 1 m/s (Kim and Smith, 2004).
Labor for installation and material and labor for pipe insulation are estimated at 40% and 20% of
the total installed cost of piping, respectively (Peters et al., 2002). Table 5-8 presents the total
capital cost requirement for the three proposed new connections of the generic example. These
projects entail 0.51 M$ in capital costs for piping.
Table 5-8 – Capital cost for the piping of three new connections ofgeneric example (Fig. 5-2b)
Pr.#
ProjectName
Stream Flowrate(t/h)
Cost(M$)From To
1 BC FT-H Before and at C 116 0.192 DE FT-H E 95 0.173 FG FT-H G 75 0.15
Total 0.51

94
5.4 Conclusion of Part I
Simultaneous energy and water networks analysis (SEWNA) has been developed for water-
based processes. The technique aims at reducing water and steam consumption at the same time.
It involves the water utilization and filtrate reutilization systems, water production and related
steam networks. It does not assume that all existing connections for water reutilization at the
process are correct, but some of them require reconsideration and improvement.
This technique has several important features;
It provides a systematic approach to extract the data for water and energy analysis. It
shows how the control volume should be defined and what data is required for the sinks
and sources. It also displays that some of the sources based on the nature and
characteristic of the process should be subtracted from the pool of sources. These
inevitable effluents generally cause the accumulation of some chemicals or particles in
the process, if they are not sent to the sewer. This ensures that the level of contaminants
in the process line would be in the safe region.
The technique also helps to identify the areas where steam can be saved.
The constraints for filtrate reutilization and water utilization in the process should be
determined as a prerequisite step for analysis, for instance, the acceptable temperature of
the reactors and the allowable temperature of the water/filtrate for temperature sensitive
units.
New rules have been proposed to redesign existing water reutilization and correct
inefficient connections. These rules do not only concern contaminant concentration of
sinks and sources, but also their temperature. The clean to clean criterion is not the main
factor for filtrate reutilization, but respecting countercurrent flow is the most important
factor. Respecting the current connections is also considered in the rules to avoid major
changes. The higher temperature filtrate and water should be supplied before steam
injection in the process line. Other rules considering the constraints of process can be
added to these three main rules.
A new Water & Energy Pinch Analysis has been developed by coupling the contaminant
concentration versus flowrate curves with temperature versus flowrate curves of sinks
95
and sources. This analysis can also be performed in tabular form. The temperature of
sinks and sources represents the minimum demand and available heat, respectively.
These curves or table help to identify the water reutilization projects respecting the
energy aspects.
The technique also involves an important step where the analysis of the existing hot and
warm water production network is carried out in order to reduce the saved water from the
origin. This analysis aims to eliminate steam heaters and steam injection for hot and
warm water production. It also exploits the existing heat exchanger network and its
available heat to produce hotter and warmer water, because the higher the temperature of
water to the process, the lower the steam injection in the process line. This is a shift in the
energy load from steam to water using the current infrastructure.
The SEWNA could significantly reduce steam at both the process line and water production
network and also reduce water consumption in a water-based process.

96
5.5 Part II: Application of simultaneous energy and water networks analysis(SEWNA) for Kraft processes
In Part I of this chapter, the simultaneous energy and water networks analysis (SEWNA) has
been presented. The objective of Part II is to apply the presented technique of Part I in Kraft
mills as an industrial application in order to assess how effective the SEWNA is. The detailed
results of mill C are shown. The overall results of applying the technique to two other Canadian
mills (A and B) are presented and the results of the three mills are compared.
5.6 Results
5.6.1 Step 1: Data extraction
The process layouts of the pulp line and the main water users of the recovery loop are
demonstrated in Fig. 5-11a to 5-13a.

97
Fig. 5-11 - (a) current, (b) final water utilization and filtrate reutilization in digesting and washing departments – mill C; dotted red lines: new connections;dashed purple lines: the existing connections with change in flowrate (W: washer, FT: filtrate tank, Sep & Scr.: separators and screeners, Dig: digester, Deknot:
deknotters, NCC-EV: non-clean condensate of evaporation, WW: warm water: FW: fresh water: HW: hot water, Eff.: effluent)
DeknotDig60oC
Chipbin 92oC 46oC
WW5015 m3/h
FT-W#245.7oC
FT-Sep &Scr 37.9oC
2oC
Woodchips
W #2 Sep & ScrW #1
252
220
FT-Deknot58.2oC
136
78oC
144
18
12430
71
2 m3/hEff-Deknot
58.2oC
FT- W#158.9oC
40
493
WW5013 m3/h
99
39 406
NCC-EV70.4oC
83
46oC
152 152
27 m3/hEff-Sep& Scr
37.7oC
111682
46oC
HW6072 m3/h
W #3&4
901 1976
87
50oC
HW60210 m3/h
FW2144 m3/h
409 m3/hEff-W#3&4
37.6oC
FT-W#547oC
25 m3/hEff-EV-170.4oC
17 m3/h
CC-EV95oC
5 m3/h
16 m3/hEff-W #257.7oC
(a) Current waterutilization & filtrate
reutilization
FT-W #3&437.6oC
DeknotDig60oC
Chipbin 92oC 59oC
FT-W #258.3oC
FT–Sep &Scr 49.1oC
2oC
Woodchips
W #2 Sep & ScrW #1
252
220
FT-Deknot64.8oC
136
83oC
144
18
12430
71
2 m3/hEff-Deknot
64.8oC
FT-W #165.7oC
40
493
100
39 406
NCC-EV70.4oC
85
53oC
152 152
27 m3/hEff-Sep& Scr
48.9oC
111682
49oC
HW57168 m3/h
FT-W #3&455.2oC
W #3 &4
896 1976
140
54oC
202 m3/hEff-W #3&4
55.2oC
FT-W #556oC
30 m3/h
FT-WEop75oC
5
12 m3/h
15 m3/hEff-W #258.3oC
(b) Modified waterutilization & filtrate
reutilization
Modified –flowrate streamNew connection

98
Fig. 5-12 - (a) Current, (b) final water utilization and filtrate reutilization in bleaching and paper machine departments – mill C; dotted red lines: newconnections; dashed purple lines: the existing connections with change in flowrate (W: washer, R: reactor; M: steam mixer, FT: filtrate tank, Mec.-P: mechanicalpulping, Cle.: cleaners, Scr.: screeners, PM: paper machine, Vac. P: vacuum pump, Fil: filter, WW: warm water: FW: fresh water: HW: hot water, CH-A: acidic
chemicals, CH-B: base chemicals, ST: steam, Eff.: effluent)
W #545.5oC
FT-W #547oC
434
50oC
50245
52 m3/hEff-W #5
47oC
WW44116 m3/h
WW3622 m3/h
ST0.2MW
Pulp M-Eop
ST
W – D0R-D038oC 49oC
5.0 MW
192 m3/hEff-D0
(Acidic Eff)49.9oC
CH-A
R- Eop95oC 67oC
CH-B
117 m3/hEff-Eop
(Alkaline Eff)25.7oC
FT-WEop67oC
R – D161.5oC 50oC
61 m3/h
26 m3/hEff-D150.2oC
FT-WD150.2oC
CH-A
58.3oC
FT– Cle59.9oC
W–D1 Cle.W–Eop
EopExch.
1471
WW4492 m3/h
30
FT-WD049.9oC
293
59WW441 m3/h
ST1.7MW
WW4476 m3/h
WW4413 m3/h
152
29
40 322
WW4441 m3/h
WW36
155 29 298
404 m3/hFW2
1943
1943
24m3/hEff-Cle.59.9oC
Mec-P50oC
FT– Scr59oC
Scr.
4
4
58.3o
C
PM
4923
12912764 284
58.3oC
602 m3/hEff-PM-2
60oC
ST10.6 MW
FT–PM60oC
108m3/hEff-PM-158.3oC
275 m3/hWW46
Vac. P-PM
31 m3/hFW2
31 m3/hEff-Vac. P–PM 2oC
(a) Current waterutilization & filtrate
reutilization
W #556oC
FT–W#556oC
434
54oC
50245
HW57138 m3/h
Pulp M-Eop
ST
W – D0R–D046oC 56oC
4.3 MW
202 m3/hEff-D0
(Acidic Eff)56.1oC
CH-A
R-Eop95oC 74oC
CH-B
89 m3/hEff-Eop
(Alkaline Eff)25.3oC
R – D161.5oC 63oC
68 m3/h
29 m3/hEff-D162.7oC
FT-WD162.7oC
CH-A
60oC
FT–Cle60oC
W–D1 Cle.W–Eop
EopExch.
1471 20
FT-WD056.1oC
293
59
HW5723 m3/h
151
29
34 322
HW57
155 26 2981943
1943
24m3/hEff-Cle.
60oC
Mec-P60oC
FT– Scr60oC
Scr.
4
4
60oCPM
4955
12912764 284
60oC
FT-PM60oC
HW59
Vac. P-PM
12 m3/hFW2
92 11 13 59 37 Fil
3119
263 m3/h
12404
76m3/hEff-PM-1
60oC
(b) Modified waterutilization & filtrate
reutilization
Modified –flowrate streamNew connection
FT-WEop75oC

99
Fig. 5-13 - (a) current, (b) final water utilization and filtrate reutilization in scrubber, recausticizing, chemical preparation, and steam plant department, - mill C;dotted red lines: new connections; dashed purple lines: the existing connections with change in flowrate (Scrub: scrubber, BL-Con: black liquor concentrator,
WeWT: weak wash tank, Dreg FT: dreg filter, LMF: lime mud filter, Clas: classifier, Scrub-Rec: scrubber of recauticizing, Ch. Prep.: chemical preparation, Mix-Ble: mixer-bleaching, Con. T: condensate tank, Con. T-Dig.: condensate tank of digesting, SC-Dig.: surface condenser of digesting, SC-EV.: surface condenser
of evaporation, WW: warm water: FW: fresh water: HW: hot water, CH-A: acidic chemicals, CH-B: base chemicals, ST: steam, Eff.: effluent)
WeWTBL-ConScrub
3 m3/h
DregFT
WW50
8 m3/hEff-Dig-1
(CC)113oC
8 m3/hFW2
19 m3/hFW2
CC-GLheater181oC
1 m3/h
4 m3/hWW48
LMF
12 m3/hWW44
Clas
2 m3/hFW2
Scrub-Rec
8 m3/hFW2
Ch.Prep.
26 m3/hFW2
Mix-Ble
1 m3/hWW44
Con.T
83 m3/hFW2
Con.T- Dig.
10 m3/hEff-Dig-2
(NCC)91.4oC
SC-Dig.
15 m3/hEff-EV-2(NCC)61.6oC
SC-EV.
6 m3/hEff-Scrub
67.1oC
(a) Current waterutilization & filtrate
reutilization
WeWTBL-ConScrub
3 m3/h
DregFT
WW508 m3/h
CC-Dig.113oC
8 m3/hFW2
LMF Clas
2 m3/hFW2
Scrub-Rec
8 m3/hFW2
Ch.Prep.
26 m3/hFW2
Mix-Ble
1 m3/hWW44
Con.T
25 m3/hHW80
Con.T- Dig.
10 m3/hEff-Dig-2
(NCC)91.4oC
SC-Dig.
15 m3/hEff-EV-2(NCC)61.6oC
SC-EV.
6 m3/hEff-Scrub
67.1oC
FT-W Eop75oC
13
7 m3/hFW2
4 12
50 m3/hFW2
(b) Modified waterutilization & filtrate
reutilization
Modified –flowrate streamNew connection

100
The data, including the flowrate, temperature, and contaminant concentration for both sinks and
sources, are extracted. Table 5-9 presents the sinks in ascending contaminant concentration
order.
Table 5-9 – List of all sinks in ascending order of contaminant concentration
SinkFlowrate
(m3/h)T
(oC)
Contaminantconcentration
(ppm)Deknotters 445 57.8 93507Digester 144 57.6 93028Chip bin 5 95 55540Washer #1 152 49.3 27753Weak wash tank-Recaust. 20 12.9 5987Washer #2 406 45.2 3048EOP 309 58.9 2939D0 267 48.9 2423
D1 286 46.9 2378Dregs filter tank-Recaust. 4 47.5 2033Lime mud filter-Recaust. 12 44.4 2033Mechanical pulping 404 50 363
Cleaners-PM 6002 59.9 346Screeners-PM 284 60 343Separators & Screeners-washing 945 37.7 231Washer #3 & 4 1204 35.4 173Washer #5 433 45.7 17Scrubber 3 50 0Paper machine-PM 279 46 0Mixer#2-Bleaching 1 44.4 0BL concentrator-Scrubber 8 2 0
Classifier-Recaust. 2 2 0Scrubber-Recaust. 8 2 0Chemical prep. 26 2 0Condensate tank 101 2 0Vacuum pump 31 2 0
Table 5-10 presents the sources, which are the filtrates that leave each stage, excluding those
streams that cannot be reutilized in process and must be sent to wastewater treatment as
inevitable effluents.
The inevitable effluent in the Kraft process can be divided into three different categories. In the
first category, the streams contain a high level of contamination, such as non-clean condensate
from surface condensers of evaporation and digesting. The streams making up the second group
must be discharged in order to prevent the accumulation of big solid particles in the pulp line,
such as rejects from deknotters, separators and screeners of washing and cleaners of the paper
machine. Finally, in the third category, there are the streams that should be drained away to
avoid the accumulation of the chemicals, such as acidic effluent of D0 and alkaline effluent of
Eop. The inevitable acidic and alkaline effluents account for 29 and 18% of the filtrates that

101
leave the D0 and Eop washers, respectively (Keshtkar et al., 2013). The respective values,
however, in the current operation of the mill are 36 and 66%. This shows the high water and
chemical loss in the bleaching section of this mill and leaves the room for improvement. Table
5-11 lists all inevitable effluents from three categories in mill C.
Table 5-10 – List of all sources in ascending order ofcontaminant concentration
SourceFlowrate(m3/h)
T(oC)Contaminantconcentration
(ppm)Deknotters 136 58.2 94593Washer #1 493 58.9 93028Eop‡ 264 67 4194Washer #2 406 45.7 4183D1 298 50.2 3670D0‡ 208 49.9 3649Screeners-PM 4 59 363Cleaners-PM 1926 59.6 346Paper machine-PM 4968 58.3 343Separators & Screeners-washing 152 37.9 240Washers #3 & 4 1976 36 229Washer #5 434 47 25Condensate tank-Digesting 8 113 0Non-clean condensate-Evap. 42 70.4 0Vacuum pump 31 2 0
‡After subtraction from inevitable effluent
Table 5-11 – List of all inevitable effluents
Inevitable effluentFlowrate(m3/h)
T(oC)Contaminantconcentration
(ppm)Deknotters 2 58.1 94538Separator & Screeners-Washing 27 37.7 144Cleaners-PM 24 59.9 339Non clean condensate of SC-Digesting 10 91.4Non clean condensate of SC-Evap. 15 61.6Scrubber effluent 6 67.1Eop * 58 67 4194D0 † 85 49.9 3649Total 227
*Alkaline effluent: 18% of filtrate from Eop washer (currently: 66%)(Keshtkar et al., 2013)†Acidic effluent: 29% of filtrate from D0 washer (currently: 36%)
(Keshtkar et al., 2013)
5.6.2 Step 2: Constraint analysis
Several potentials for steam saving could be determined in the pulp line. There are four steam
injection points (Fig. 5-11a to 5-13a),where the steam can be diminished; washer #5 (W #5), the
D0 washer (W-D0), the Eop steam mixer (M-Eop), and the white water tank of the paper

102
machine (FT-PM). There are also two other points located in the steam plant (deaerator) and
recausticing (green liquor heater) where the steam can potentially be saved.
The bleaching department consists of three reactors (Fig. 5-12a), R-D0, R-Eop, R-D1, and
temperature is one of the principal parameters of their efficiency. The acceptable temperature for
R-D0, R-Eop, and R-D1 is in the range of 20-80, 60-95, and 60-80oC, respectively (Brogdon and
Bell, 2004; Georgia Tech, 2013; Smook, 2002; van Lierop et al., 2008). Therefore, when the
projects are identified, the temperature of these units should not exceed the acceptable
temperature.
Several washers are used in the pulp line to wash the pulp. Every type of washer receives the
water at a certain temperature level and beyond this temperature, it does not perform properly.
The typical temperature of water to common pulp and paper washers are collected (Brännvall,
2009; Garza Villarreal, 2011; Orzechowska, 2006; Turner et al., 2001) and presented in Table
5-12. The current case study involves three compact baffle filter washers (W #1, 2, and 5), two
rotary vacuum drums (W #3 and 4) in the washing section, and three compact baffle filter
washers (W-D0, W-Eop, and W-D1) in bleaching section (Fig. 5-11a and 5-12a). Similar to
bleaching reactors, to identify the projects for water and energy improvements, the temperature
of supplied water or filtrate to these washers should be kept lower than typical values.
Table 5-12 – Acceptable temperature offiltrate and water to different types ofwasher
WasherTypical
temperature (oC)Rotary vacuum drum (RVD) 80-85Compact baffle filter (CBF) <100Diffusive washers <100
5.6.3 Step 3: Water and energy analysis
The Water & Energy Pinch curves for all sinks and sources are constructed in Fig. 5-15a using
extracted data from Table 5-9 and 5-10. This graph consists of contaminant concentration versus
flowrate and temperature versus flowrate for both sinks and sources. The Pinch point occurs at
the flowrate of 10911 m3/h, sink contaminant concentrations of 231 and 173 ppm, and source
contaminant concentrations of 229 and 25 ppm. These curves are used to determine the

103
modifications in water closure of the process using the water reutilization rules. As was
mentioned in Part I, the other heuristic rules can also be defined based on the nature of the
process for the identification of water reutilization projects (Keshtkar et al., 2013). In the case of
the pulp and paper process, two other rules can be recognized as follows:
Rule 5 – Do not use the effluent from recausticizing at the pulp line (Fig. 5-14): the
effluent from recausticizing contains many ionic metals and other contaminants and if it
is reutilized in the pulp line, it may damage the quality of the produced pulp. It therefore
should be avoided.
Rule 6 – Use the alkaline effluent of the pulp line in recausticizing (Fig. 5-14): a portion
of chemicals (NaOH and Na2S) that are used for cooking in the digester is lost in the pulp
line and recovery loop. The chemical make-up is required to compensate for this loss.
Alkaline effluent of the pulp line contains a significant amount of NaOH and if it is
reutilized at recausticizing, the total amount of the make-up chemical requirement and
water consumption at this section would be reduced considerably (Keshtkar et al., 2013).
Fig. 5-14 - Simple schematic of rules 5 and 6 to identify projects;Rule 5: Do not use the effluent from recausticizing at pulp line and
Rule 6: Use the alkaline effluent of pulp line in recausticizing
Figure 5-15a is used to identify the supply water for the sinks based on the existing sources and
clean water levels. The final modification of Fig. 5-15a after providing the water for each sink is
displayed in Fig. 5-15b. The Pinch point is moved towards the left side at the flowrate of 10175,
the sink contaminant concentrations of 231 and 173 ppm, and the source contaminant
concentrations of 229 and 173 ppm. This analysis results in a reduction of water consumption
from 1760 to 800 m3/h in both Kraft and mechanical pulping. The total water savings is
significantly large and accounts for 54% of current water consumption. Subsequently, the total
effluent reduction is 970 m3/h or 57% of current effluent production.
Pulp line Recausticizing
AlkalineEffluent
RecausticizingEffluent
OtherEffluents

104
Fig. 5-15 – Water & Energy Pinch Curves; (a) before and (b) after identification of water projects
5.6.4 Step 4: Hot and warm water network analysis
The saved water of step 3 should be reduced at the origin in the water network. Figure 5-16a
illustrates the current hot and warm water network of the mill. The main temperature levels of
utilized water are 46, 36, 44, 50, and 60oC. The yellow HEXs are the ones that recover the heat
from process streams while the red HEXs utilize the steam for water heating. The first objective
of this step was to eliminate steam consumption for hot or warm water production. Then the
network is redesigned based on the existing process HEXs and the available heat load of each of
these HEXs in order to generate water at a higher temperature. Since less water (800 vs. 1760
0
50
100
150
200
2500
20000
40000
60000
80000
100000
120000
140000
1600000 2000 4000 6000 8000 10000 12000 14000
Cont
amin
ant C
once
ntra
tion
(ppm
)
Flowrate (m3/h)
Contaminant-Sink (ppm)Contaminant-Source (ppm)Temperature- Source (oC)Temperature-Sink (oC)
T (o C
)
aPinch point
0
50
100
150
200
2500
20000
40000
60000
80000
100000
120000
140000
1600000 2000 4000 6000 8000 10000 12000 14000
Cont
amin
ant c
once
ntra
tion
(ppm
)
Flowrate (m3/h)
Contaminant-Sink (ppm)Contaminant-Source (ppm)Temperature- Source (oC)Initial Temperature-Sink (oC)
T (o C
)
b Pinch point

105
m3/h) is required, the higher temperature for hot and warm water can be achieved using existing
HEXs. Figure 5-16b displays the modified hot and warm water network. The main temperature
levels of utilized water rise to 57, 59, and 80oC. Utilization of water at these new temperatures
raises the temperature of the pulp line and also the condensate tank of the steam plant and
decreases the total steam injection in the pulp line and deaerator of the steam plant. The existing
area and current and final heat load of the process and steam HEXs for hot and warm water
production are presented in Table 5-13. The area does not change, but the heat load does, because
the final temperature levels of water are higher than what they currently are. Therefore, in order
to maintain the same area, the heat load should be decreased.
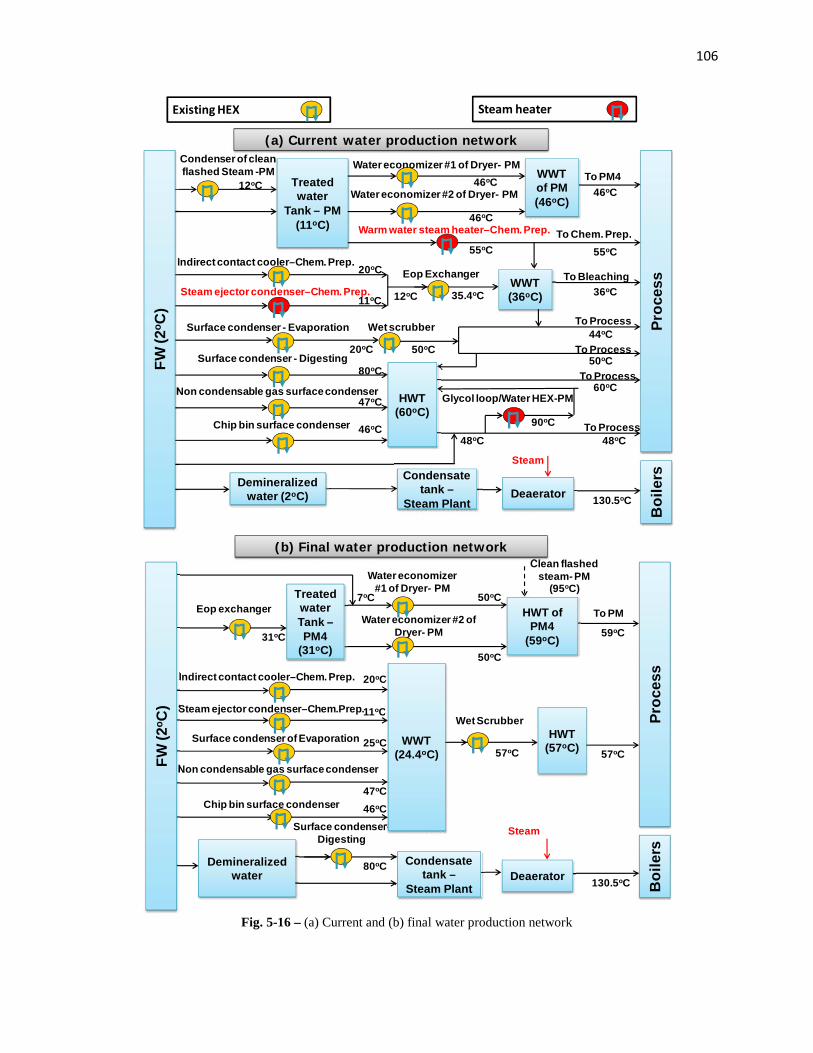
106
Fig. 5-16 – (a) Current and (b) final water production network
Condenser of cleanflashed Steam -PM
Treatedwater
Tank – PM(11oC)
12oC
Water economizer #1 of Dryer- PM46oC
WWTof PM(46oC)
Proc
ess
Water economizer #2 of Dryer- PM
46oC
To PM4
Indirect contact cooler–Chem. Prep.20oC
Steam ejector condenser–Chem. Prep.11oC
Eop Exchanger
35.4oC12oC
Warm water steam heater–Chem. Prep.
55oCTo Chem. Prep.
WWT(36oC)
To Bleaching
Surface condenser - Evaporation
20oC
Wet scrubber
50oC44oC
To Process
To Process
36oC
55oC
46oC
50oCSurface condenser - Digesting80oC
Non condensable gas surface condenser47oC
Chip bin surface condenser 46oC
To Process60oC
Glycol loop/Water HEX-PM
90oC
48oC 48oCTo Process
Demineralizedwater (2oC) Deaerator
Steam
Boi
lers
130.5oC
Condensatetank –
Steam Plant
FW (2
o C)
(a) Current water production network
Steam heaterExisting HEX
HWT(60oC)
Water economizer#1 of Dryer- PM
50oC
Proc
ess
Water economizer #2 ofDryer- PM
50oC
Indirect contact cooler–Chem. Prep. 20oC
Steam ejector condenser–Chem.Prep.11oC
Surface condenser of Evaporation
Non condensable gas surface condenser
Chip bin surface condenser
Surface condenser-Digesting
80oC
Wet Scrubber
57oC 57oCWWT
(24.4oC)25oC
47oC46oC
HWT(57oC)
Eop exchanger
31oC
TreatedwaterTank –PM4
(31oC)
Clean flashedsteam- PM
(95oC)7oC
59oC
HWT ofPM4
(59oC)
To PM
Demineralizedwater
FW (2
o C)
Deaerator
Steam
Boi
lers
130.5oC
Condensatetank –
Steam Plant
(b) Final water production network

107
Table 5-13 – Existing area and current and final heat load ofprocess and steam HEXs
HEX Area(m2)
Heat exchanged(MW)
Current FinalSurface condenser- Digesting 18 2.2 2.2Surface condenser- Evaporation 79 9.9 8.8Wet scrubber 12218 16.8 15.2Indirect contact-Chem. Prep. 249 0.6 0.6Non condensable gas surfacecondenser
50 0.2 0.2
Chip bin surface condenser 206 0.7 0.7Eop exchanger 965 5.5 6.3Water economizer #1 – PM 2621 5.6 5.6Water economizer #2 – PM 2621 5.6 3.7Surface condenser – PM 14 2.7 2.7Total of heat recovered from waste streamusing existing HEX
50 46
Steam ejector- Chem. Prep. ‡ 36 1.8 0.3Water HEX of Glycol loop – PM 237 3.8 RemovedWW steam heater – Chem. Prep. 1 0.2 RemovedTotal heat from the steam (MW) 5.5 0
‡ This HEX is employed to cool down the produced chemicals at chemicalpreparation plant. The steam is mixed with chemicals at this HEX to produce thewarm water. In the final design, the steam part is removed; however, there is stillthe heat load of chemical cooling.
5.6.4.1 Final configuration of the process line
The hot and warm water with new temperatures are substituted for the current water
temperatures. This step is incorporated into step 3 and results in raising the water temperature to
different sinks of the pulp line and recovery loop, as shown in Fig. 5-17. This rise in temperature
reduces the total steam consumption at the pulp line, recovery loop and steam plant. Table 5-14
summarizes the steam savings in both the water network and steam injection points. The total
steam savings is 32 MW and accounts for 29% of the current steam consumption of the whole
mill.
Fig. 5-17 – The change in temperature of total water and filtrate to sinksin current conditions and after applying SEWNA
35
40
45
50
55
60
65
70
0 2000 4000 6000 8000 10000 12000 14000
T (o C
)
Flowrate (m3/h)
Initial Temperature-Sink (oC)Final Temperature-Sink (oC)
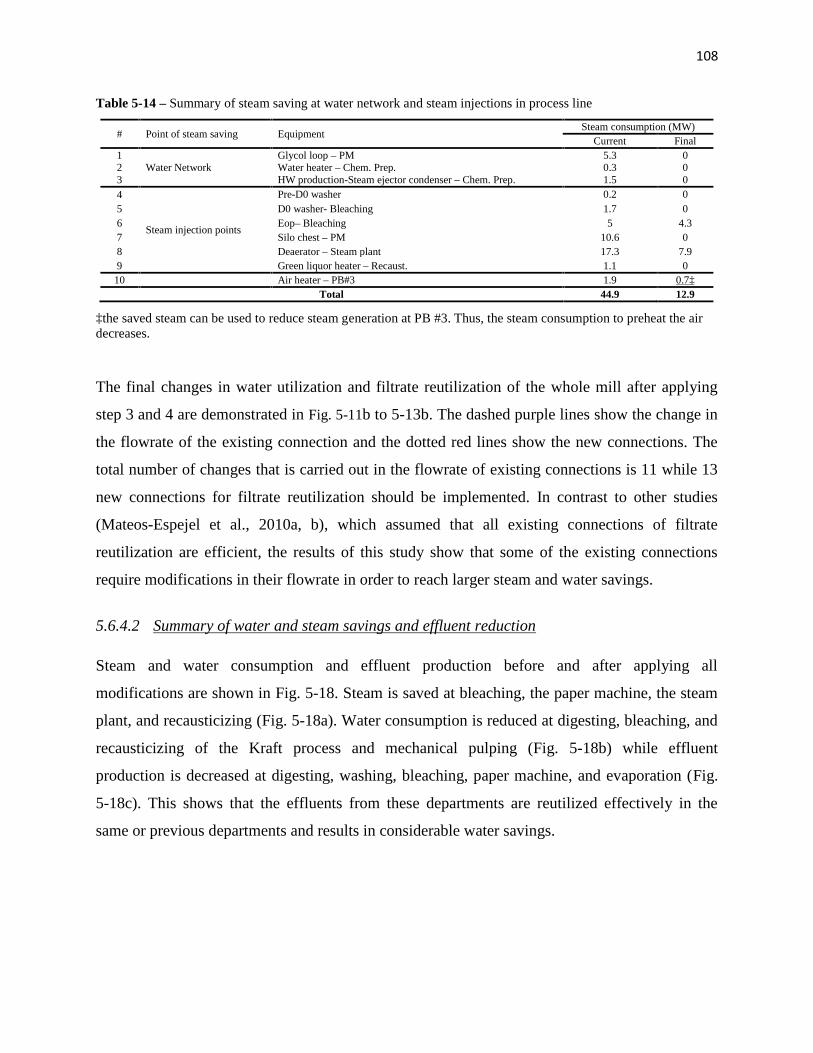
108
Table 5-14 – Summary of steam saving at water network and steam injections in process line
# Point of steam saving EquipmentSteam consumption (MW)
Current Final1
Water NetworkGlycol loop – PM 5.3 0
2 Water heater – Chem. Prep. 0.3 03 HW production-Steam ejector condenser – Chem. Prep. 1.5 04
Steam injection points
Pre-D0 washer 0.2 05 D0 washer- Bleaching 1.7 06 Eop– Bleaching 5 4.37 Silo chest – PM 10.6 08 Deaerator – Steam plant 17.3 7.99 Green liquor heater – Recaust. 1.1 0
10 Air heater – PB#3 1.9 0.7‡Total 44.9 12.9
‡the saved steam can be used to reduce steam generation at PB #3. Thus, the steam consumption to preheat the airdecreases.
The final changes in water utilization and filtrate reutilization of the whole mill after applying
step 3 and 4 are demonstrated in Fig. 5-11b to 5-13b. The dashed purple lines show the change in
the flowrate of the existing connection and the dotted red lines show the new connections. The
total number of changes that is carried out in the flowrate of existing connections is 11 while 13
new connections for filtrate reutilization should be implemented. In contrast to other studies
(Mateos-Espejel et al., 2010a, b), which assumed that all existing connections of filtrate
reutilization are efficient, the results of this study show that some of the existing connections
require modifications in their flowrate in order to reach larger steam and water savings.
5.6.4.2 Summary of water and steam savings and effluent reduction
Steam and water consumption and effluent production before and after applying all
modifications are shown in Fig. 5-18. Steam is saved at bleaching, the paper machine, the steam
plant, and recausticizing (Fig. 5-18a). Water consumption is reduced at digesting, bleaching, and
recausticizing of the Kraft process and mechanical pulping (Fig. 5-18b) while effluent
production is decreased at digesting, washing, bleaching, paper machine, and evaporation (Fig.
5-18c). This shows that the effluents from these departments are reutilized effectively in the
same or previous departments and results in considerable water savings.
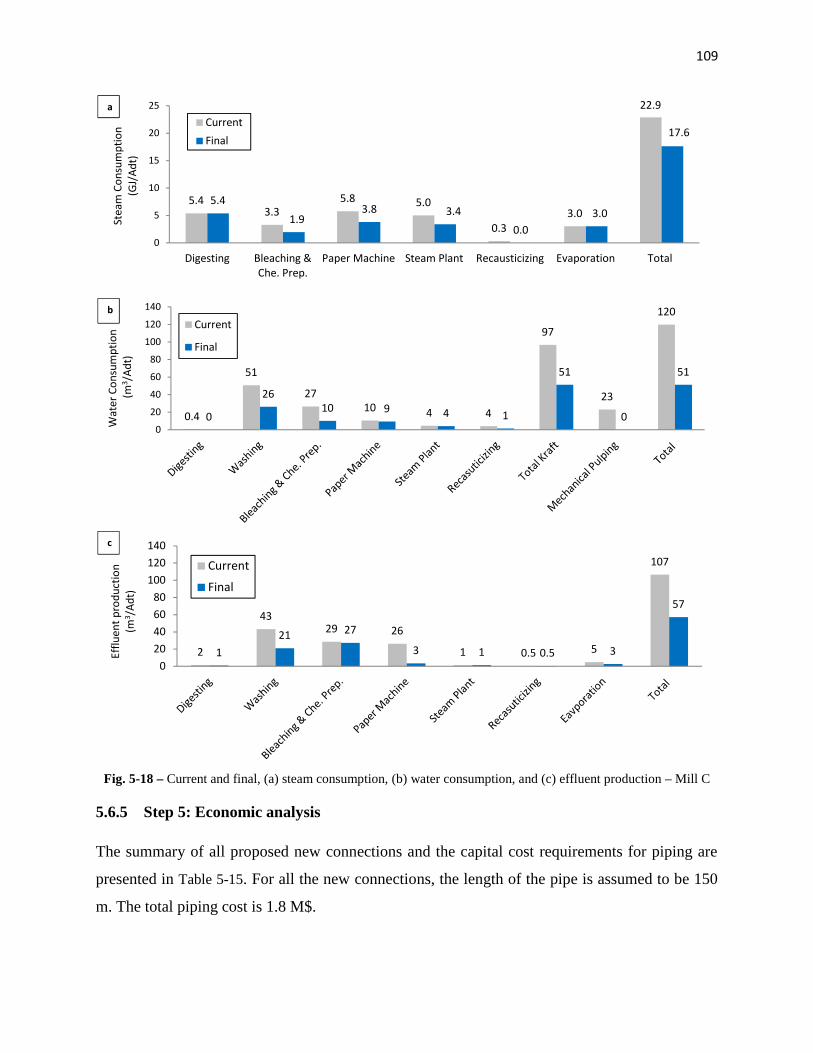
109
Fig. 5-18 – Current and final, (a) steam consumption, (b) water consumption, and (c) effluent production – Mill C
5.6.5 Step 5: Economic analysis
The summary of all proposed new connections and the capital cost requirements for piping are
presented in Table 5-15. For all the new connections, the length of the pipe is assumed to be 150
m. The total piping cost is 1.8 M$.
5.43.3
5.8 5.0
0.33.0
22.9
5.41.9
3.8 3.40.0
3.0
17.6
0
5
10
15
20
25
Digesting Bleaching &Che. Prep.
Paper Machine Steam Plant Recausticizing Evaporation Total
Stea
m C
onsu
mpt
ion
(GJ/
Adt)
CurrentFinal
a
0.4
51
2710 4 4
97
23
120
0
2610 9 4 1
51
0
51
0
20
40
60
80
100
120
140
Wat
er C
onsu
mpt
ion
(m3 /
Adt)
Current
Final
b
2
4329 26
1 0.5 5
107
121 27
3 1 0.5 3
57
020406080
100120140
Efflu
ent p
rodu
ctio
n(m
3 /Ad
t)
Current
Final
c
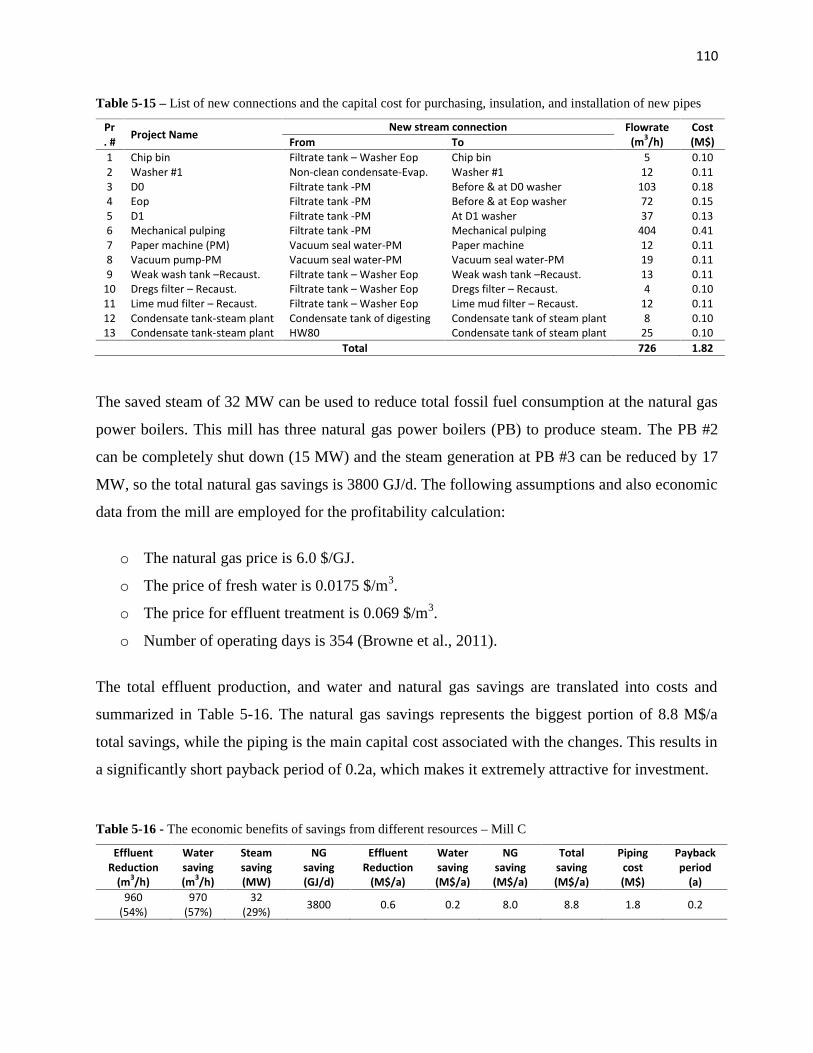
110
Table 5-15 – List of new connections and the capital cost for purchasing, insulation, and installation of new pipes
Pr. # Project Name
New stream connection Flowrate(m3/h)
Cost(M$)From To
1 Chip bin Filtrate tank – Washer Eop Chip bin 5 0.102 Washer #1 Non-clean condensate-Evap. Washer #1 12 0.113 D0 Filtrate tank -PM Before & at D0 washer 103 0.184 Eop Filtrate tank -PM Before & at Eop washer 72 0.155 D1 Filtrate tank -PM At D1 washer 37 0.136 Mechanical pulping Filtrate tank -PM Mechanical pulping 404 0.417 Paper machine (PM) Vacuum seal water-PM Paper machine 12 0.118 Vacuum pump-PM Vacuum seal water-PM Vacuum seal water-PM 19 0.119 Weak wash tank –Recaust. Filtrate tank – Washer Eop Weak wash tank –Recaust. 13 0.11
10 Dregs filter – Recaust. Filtrate tank – Washer Eop Dregs filter – Recaust. 4 0.1011 Lime mud filter – Recaust. Filtrate tank – Washer Eop Lime mud filter – Recaust. 12 0.1112 Condensate tank-steam plant Condensate tank of digesting Condensate tank of steam plant 8 0.1013 Condensate tank-steam plant HW80 Condensate tank of steam plant 25 0.10
Total 726 1.82
The saved steam of 32 MW can be used to reduce total fossil fuel consumption at the natural gas
power boilers. This mill has three natural gas power boilers (PB) to produce steam. The PB #2
can be completely shut down (15 MW) and the steam generation at PB #3 can be reduced by 17
MW, so the total natural gas savings is 3800 GJ/d. The following assumptions and also economic
data from the mill are employed for the profitability calculation:
o The natural gas price is 6.0 $/GJ.
o The price of fresh water is 0.0175 $/m3.
o The price for effluent treatment is 0.069 $/m3.
o Number of operating days is 354 (Browne et al., 2011).
The total effluent production, and water and natural gas savings are translated into costs and
summarized in Table 5-16. The natural gas savings represents the biggest portion of 8.8 M$/a
total savings, while the piping is the main capital cost associated with the changes. This results in
a significantly short payback period of 0.2a, which makes it extremely attractive for investment.
Table 5-16 - The economic benefits of savings from different resources – Mill C
EffluentReduction
(m3/h)
Watersaving(m3/h)
Steamsaving(MW)
NGsaving(GJ/d)
EffluentReduction
(M$/a)
Watersaving(M$/a)
NGsaving(M$/a)
Totalsaving(M$/a)
Pipingcost(M$)
Paybackperiod
(a)960
(54%)970
(57%)32
(29%) 3800 0.6 0.2 8.0 8.8 1.8 0.2

111
The results are compared with the previous study (Mateos-Espejel et al., 2011c), which assumed
that all existing connections of water reutilization are efficient. The authors sequentially applied
Water and Thermal Pinch Analyses to a similar Kraft mill (700 Adt/d of pulp production) in
terms of water and steam consumption. The water consumption was 110 m3/Adt and a savings of
34% was achieved, while in the case of mill C, savings of 54% (Table 5-16) were achieved.
Steam consumption was 21.1 GJ/Adt and a savings of 8.5% was accomplished whereas in the
case of mill C, steam savings of 29% were obtained. This shows that the results of SEWNA are
substantially superior to other similar studies using other techniques.
5.7 Summary of the Application in Two Other Canadian Kraft Mills (A and B)
The simultaneous energy and water networks analysis (SEWNA) is also applied in two other
Canadian mills (mill A and B). Mill A is a dissolving Kraft pulp mill and manufactures 750
Adt/d of pulp. Mill B is a Kraft paper pulp mill with two separate lines, lines 1 and 2, and
produces 1765 Adt/d of pulp. Mill C is the case study, which has been explained in detail in the
previous sections. Figure 5-19 compares the total pulp/paper production, steam and water
savings, and effluent reductions of these three mills using SEWNA. The water saving for
different cases varies in the range of 24-54% depending on how efficient the water reutilization
currently is in the mill. For example, in mill B, 10 m3/Adt of water reduction results in water
savings of 24%, indicating that this mill is currently efficient in terms of water reutilization
whereas in the case of mill C, 68 m3/Adt of water savings is equivalent to 54% in water
reduction, which shows the inefficient current water reutilization. The water reduction and
effluent reutilization in all cases yield significant steam savings, ranging between 11-29% of
current consumption.
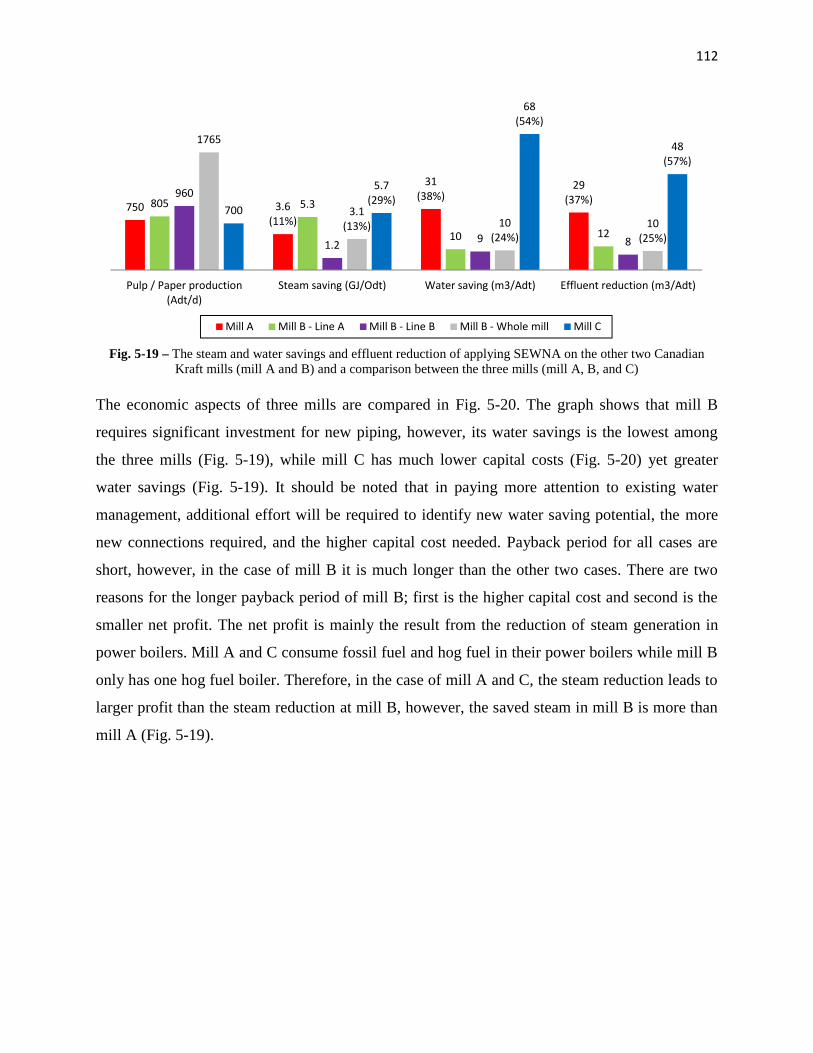
112
Fig. 5-19 – The steam and water savings and effluent reduction of applying SEWNA on the other two CanadianKraft mills (mill A and B) and a comparison between the three mills (mill A, B, and C)
The economic aspects of three mills are compared in Fig. 5-20. The graph shows that mill B
requires significant investment for new piping, however, its water savings is the lowest among
the three mills (Fig. 5-19), while mill C has much lower capital costs (Fig. 5-20) yet greater
water savings (Fig. 5-19). It should be noted that in paying more attention to existing water
management, additional effort will be required to identify new water saving potential, the more
new connections required, and the higher capital cost needed. Payback period for all cases are
short, however, in the case of mill B it is much longer than the other two cases. There are two
reasons for the longer payback period of mill B; first is the higher capital cost and second is the
smaller net profit. The net profit is mainly the result from the reduction of steam generation in
power boilers. Mill A and C consume fossil fuel and hog fuel in their power boilers while mill B
only has one hog fuel boiler. Therefore, in the case of mill A and C, the steam reduction leads to
larger profit than the steam reduction at mill B, however, the saved steam in mill B is more than
mill A (Fig. 5-19).
750 3.6(11%)
31(38%)
29(37%)805 5.3
10 12
960
1.2 9 8
1765
3.1(13%) 10
(24%)10
(25%)
700
5.7(29%)
68(54%)
48(57%)
Pulp / Paper production(Adt/d)
Steam saving (GJ/Odt) Water saving (m3/Adt) Effluent reduction (m3/Adt)
Mill A Mill B - Line A Mill B - Line B Mill B - Whole mill Mill C

113
Fig. 5-20 - The capital cost, net profit, and payback period after applyingSEWNA on two other Canadian Kraft mills (mill A and B) and a comparison
between the three mills (mill A, B, and C)
5.7.1 Benchmarking of water and steam consumption
The water and steam consumption of three mills for their current status and after applying
SEWNA are benchmarked with reference data (Fig. 5-21). The water consumption is
benchmarked against the average mills designed in the 1960s and 1980s (Johnston et al., 1996;
Turner et al., 2001). The steam consumption is benchmarked against the reference data from the
survey conducted by the Pulp and Paper Research Institute of Canada (Paprican) (CIPEC, 2008).
Figure 5-21a shows that using SEWNA, it is possible to reduce significantly the water
consumption and bring it close to mills designed in the 1980s for all three cases. Figure 5-21b
illustrates the steam consumption for the three mills. Mill A is a dissolving Kraft pulp mill with a
batch digester and is benchmarked against the data for Kraft paper pulp with a batch digester due
to a lack of data for benchmarking against dissolving Kraft pulp with a batch digester. The
principal difference between dissolving and Kraft paper pulp is that there is an extra step before
digesting, called pre-hydrolysis, to separate the hemicelluloses. Therefore, it is possible to divide
the mill into two parts for benchmarking; the pre-hydrolysis and the Kraft paper pulp with batch
digester (Keshtkar et al., 2013). The yellow portion of total steam consumption indicates the
steam consumption of the pre-hydrolysis (3.1 GJ/Adt) and the rest is allocated to Kraft paper
pulping with the batch digester. For this mill, the steam consumption smaller than the 75th
percentile of Canadian mills can be accomplished using SEWNA. The steam consumption of
mill B and C after applying SEWNA is less than median Canadian mills. These results suggest
3.4
13.4
0.3
5.3 5.9 0.9
1.8
8.8
0.2
Capital cost (M$) Net profit (M$/a) Payback period (a)
Mill A Mill B - Whole mill Mill C

114
that this technique could yield high steam savings and improve the energy efficiency of the
whole process, by simply adding new piping for some streams at a small capital cost.
Fig. 5-21 – Benchmarking of (a) water consumption and (b) steam consumption of three mills (mill A, B, and C)before and after applying SEWNA
5.8 Conclusion
The simultaneous energy and water networks analysis (SEWNA), presented in Part I of this
paper, has been applied in three Canadian Kraft pulp and paper mills (mill A, B, and C). The
detailed results have been shown for mill C while for both mills A and B only the final results
have been displayed. The substantial steam and water savings in the range of 11-29% and 24-
54%, respectively, have been accomplished. They demonstrated that using this technique, the
water and steam consumptions can be reduced significantly.
80
0
20
40
60
80
100
120
140
.
Wat
er C
onsu
mpt
ion
(m3 /
Adt)
CurrentMills design 1960s
a
28.925.7
0
3.1
6.2
9.3
12.4
15.5
18.6
21.7
24.8
27.9
. Mill A
Stea
m c
onsu
mpt
ion
(GJ/
Adt)
Pre-hydrolysis:3.1 GJ/Adt
Kraft paper pulp -Batch digesrer:
25.8 GJ/Adt
b
114
that this technique could yield high steam savings and improve the energy efficiency of the
whole process, by simply adding new piping for some streams at a small capital cost.
Fig. 5-21 – Benchmarking of (a) water consumption and (b) steam consumption of three mills (mill A, B, and C)before and after applying SEWNA
5.8 Conclusion
The simultaneous energy and water networks analysis (SEWNA), presented in Part I of this
paper, has been applied in three Canadian Kraft pulp and paper mills (mill A, B, and C). The
detailed results have been shown for mill C while for both mills A and B only the final results
have been displayed. The substantial steam and water savings in the range of 11-29% and 24-
54%, respectively, have been accomplished. They demonstrated that using this technique, the
water and steam consumptions can be reduced significantly.
80
40
120
49
30
52
Mill A Mill B Mill C
Current FinalMills design 1960s Mills design 1980s
21.9 22.9
19.1 17.6
28.925.7
18.5
21.423.1
. . Mill B Mill C
Current Final25th precentile Median
Kraft paper pulp -Batch digesrer:
22.6 GJ/Adt
114
that this technique could yield high steam savings and improve the energy efficiency of the
whole process, by simply adding new piping for some streams at a small capital cost.
Fig. 5-21 – Benchmarking of (a) water consumption and (b) steam consumption of three mills (mill A, B, and C)before and after applying SEWNA
5.8 Conclusion
The simultaneous energy and water networks analysis (SEWNA), presented in Part I of this
paper, has been applied in three Canadian Kraft pulp and paper mills (mill A, B, and C). The
detailed results have been shown for mill C while for both mills A and B only the final results
have been displayed. The substantial steam and water savings in the range of 11-29% and 24-
54%, respectively, have been accomplished. They demonstrated that using this technique, the
water and steam consumptions can be reduced significantly.
78
44
.
17.616.6
19.621.4
Mill C .
115
The results confirmed that the existing water reutilization can be improved. They proved that the
new established rules for water reutilization and also new Water and Energy Pinch Curves are
considerably more effective. Furthermore, they showed the importance of analyzing the existing
hot and warm water networks from both steam saving and economical perspectives. This
analysis yielded the steam removal for hot and warm water production. It led to water production
at higher temperatures, which resulted in steam reduction on the process line. It also avoided the
proposal of new heat exchangers for warm and hot water production. The comparison of overall
results with other similar studies also showed the superiority of the results of this technique over
other current engineering practices.
New connections were required for new piping for filtrate reutilization or water utilization. The
piping costs of 2.4, 5.3, and 1.8 M$ has been estimated for mill A, B, and C, respectively. This
shows that if the current water system is well-managed, it will be more difficult to identify water
projects and more new connections will be required, at a greater piping cost (mill B). A total
savings of 13.4, 5.9, and 8.8 M$/a has been achieved for mills A, B, and C, respectively. The
main reason for the low savings of mill B in comparison to the other two mills (mill A and C) is
that at mill B, hog fuel was the principal source of savings while in the two others, fossil fuel
savings was the main contributor to the total savings. Accordingly, the payback period for the
mills A and C was respectively 0.3 and 0.2a while for the mill B it was 0.9a. If fossil fuel savings
is the main source of energy saving (Mill A and C), the payback period is shorter whereas if hog
fuel savings is the main source of energy saving (Mill B), the payback period is longer.
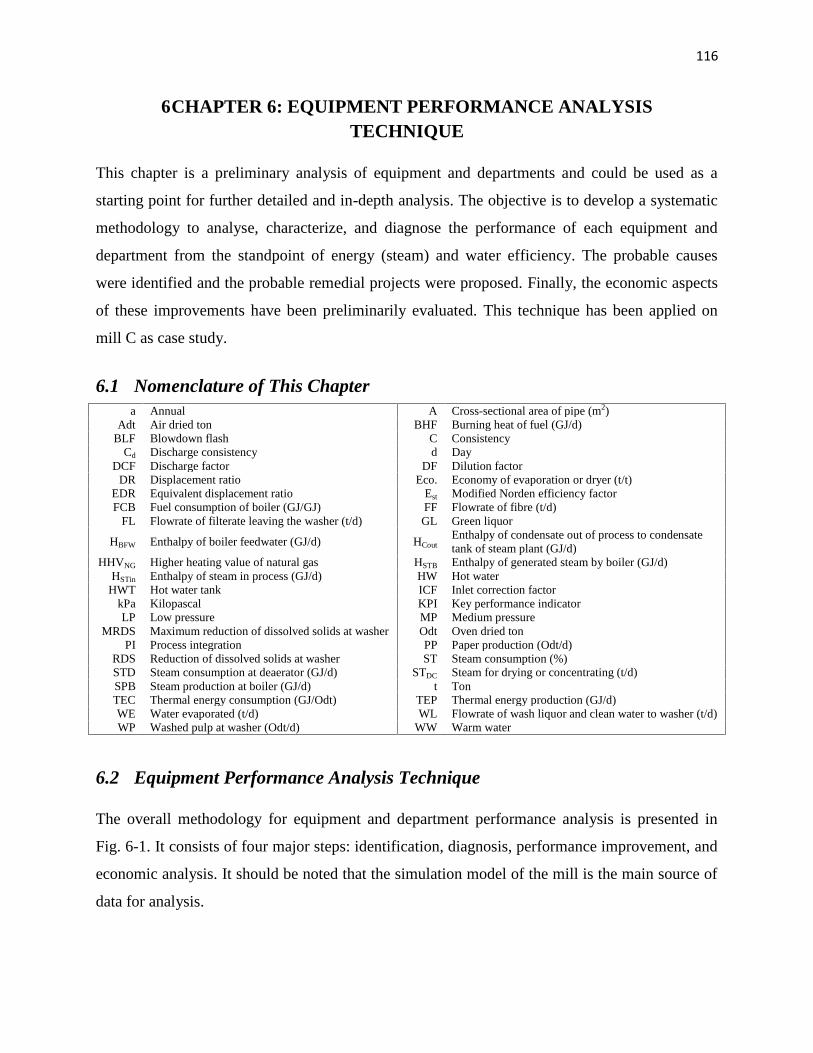
116
6CHAPTER 6: EQUIPMENT PERFORMANCE ANALYSISTECHNIQUE
This chapter is a preliminary analysis of equipment and departments and could be used as a
starting point for further detailed and in-depth analysis. The objective is to develop a systematic
methodology to analyse, characterize, and diagnose the performance of each equipment and
department from the standpoint of energy (steam) and water efficiency. The probable causes
were identified and the probable remedial projects were proposed. Finally, the economic aspects
of these improvements have been preliminarily evaluated. This technique has been applied on
mill C as case study.
6.1 Nomenclature of This Chaptera Annual A Cross-sectional area of pipe (m2)
Adt Air dried ton BHF Burning heat of fuel (GJ/d)BLF Blowdown flash C Consistency
Cd Discharge consistency d DayDCF Discharge factor DF Dilution factor
DR Displacement ratio Eco. Economy of evaporation or dryer (t/t)EDR Equivalent displacement ratio Est Modified Norden efficiency factorFCB Fuel consumption of boiler (GJ/GJ) FF Flowrate of fibre (t/d)
FL Flowrate of filterate leaving the washer (t/d) GL Green liquor
HBFW Enthalpy of boiler feedwater (GJ/d) HCoutEnthalpy of condensate out of process to condensatetank of steam plant (GJ/d)
HHVNG Higher heating value of natural gas HSTB Enthalpy of generated steam by boiler (GJ/d)HSTin Enthalpy of steam in process (GJ/d) HW Hot water
HWT Hot water tank ICF Inlet correction factorkPa Kilopascal KPI Key performance indicatorLP Low pressure MP Medium pressure
MRDS Maximum reduction of dissolved solids at washer Odt Oven dried tonPI Process integration PP Paper production (Odt/d)
RDS Reduction of dissolved solids at washer ST Steam consumption (%)STD Steam consumption at deaerator (GJ/d) STDC Steam for drying or concentrating (t/d)SPB Steam production at boiler (GJ/d) t TonTEC Thermal energy consumption (GJ/Odt) TEP Thermal energy production (GJ/d)WE Water evaporated (t/d) WL Flowrate of wash liquor and clean water to washer (t/d)WP Washed pulp at washer (Odt/d) WW Warm water
6.2 Equipment Performance Analysis Technique
The overall methodology for equipment and department performance analysis is presented in
Fig. 6-1. It consists of four major steps: identification, diagnosis, performance improvement, and
economic analysis. It should be noted that the simulation model of the mill is the main source of
data for analysis.

117
Fig. 6-1 - Methodology of equipments and department performance analysis
6.2.1 Step 1: Identification
The departments and the types of equipment utilized are determined. The key performance
indicators (KPIs), which characterize the energy or water performances of the department and
equipment, are identified based on the published data. KPIs when used efficiently can quickly
show the areas that have opportunities for energy and water savings. KPIs already exist for most
equipment, including the washers, dryers, evaporators, boilers, and deaerator and for most
departments, such as digesting, bleaching, and recausticizing.
6.2.1.1 KPI of digesting, bleaching, and recausticizing
The main KPI for these departments is the thermal energy consumption (TEC) (CIPEC, 2008) :
Step 1: Identification
Choice of department studied Type of equipment utilized Key performance indicators (KPI) for selected department and
equipment related to energy and water Reference value for KPI
Step 2: Diagnosis
Calculation of KPI for the mill Comparison with reference value of KPI:
o Within range The performance is acceptable
o Out of range Performance is not acceptable; identify cause
(Operating conditions or Inefficient equipment)
Step 3: Performance Improvement
Modification of operating conditions Replacement of equipment
Step 4: Economic analysis
Capital investment cost of performance improvement Operating cost of performance improvement

118
= [1]1
Since this mill is a combination of Kraft and mechanical pulping, the base of production for
calculation in GJ/Odt is different for each department. Digesting, washing, bleaching,
evaporation, chemical preparation, recovery boiler, and recausticizing are part of the Kraft line
and Kraft production is used for their calculation. Total Kraft pulp production is 255 Odt/d. In
the paper machine, Kraft and mechanical pulp are blended and the base of production for
calculation at this department is the total paper production of the mill, which is 630 Odt/d. Power
boilers are installed to supply enough heat for the paper machine and 630 Odt/d of paper
production is used as the base for computation. Another KPI to evaluate the water performance
of the bleaching and chemical preparation departments is water consumption (m3/Adt).
6.2.1.2 KPIs of washers in washing department
The washers are the equipment that remove the impurities from the pulp using water. They are
widely used in Kraft mills, in particular, in the washing section where a series of countercurrent
ones are employed. To better understand the KPIs for the washers of the washing department, a
schematic of a washer is shown in Fig. 6-2.
Fig. 6-2 - Simplified schematic of a washer
KPIs for washers have been presented in several studies (Crotogino et al., 1987; Luthi, 1983;
Miliander, 2009; Stromberg, 1991). These KPIs are divided into two categories: those that
represent the amount of wash liquor and water used, such as the dilution factor (DF), and those
1 The symbols are defined in the Nomenclature section of this chapter

119
that represent the efficiency of the washing, such as equivalent displacement ratio (EDR). The
high DF represents the high water consumption at the washer and the big EDR shows the
efficient washing. DF (Ek et al., 2009) and EDR (Luthi, 1983) are defined as follows:
= [2]
= (1 − )( )( ) + 1 [3]
Displacement Ratio (DR) is the parameter that shows the efficiency of displacing in the washer,
= [4]
Discharge Factor (DCF),
= . × [5]
Cd and ICF denote the discharge consistency and inlet correction factor for calculation,
respectively. ICF for dilution and thickening washers with no displacement washing is defined as
follows:
= [ ] [6]
Discharge consistency (Cd) represents the total fibre in the outlet stream from a washer:
= [7]
6.2.1.3 KPI of the paper machine dryer and evaporation
The main KPI for these pieces of equipment is economy. The economy of the paper machine
dryer is defined as steam consumed per evaporated water (Smook, 2002):
. = [8]

120
The economy of evaporation represents the mass of evaporated water per mass of steam
consumed (Beagle, 1962):
. = [9]
6.2.1.4 KPIs of the steam plant
For the boilers, the major KPI to evaluate the energy performance is fuel consumption (GJ/GJ)
(CIPEC, 2008):
= [10]
where TEP denotes thermal energy production,
= − [11]
The KPI for energy performance of the deaerator in the steam plant is the percentage of steam
consumption (CIPEC, 2008):
= × 100 [12]
6.2.1.5 Reference data for KPIs
The next step of identification is to extract the reference value for the KPIs from literature. The
reference data for thermal energy consumption (TEC) of the digesting, bleaching, and
recausticizing departments as well as the fuel consumption of boilers and steam consumption
(%) of the deaerator in the steam plant are available in the survey by the Pulp and Paper
Research Institute of Canada (Paprican). They collected the performance data of the mills around
Canada. In this survey, the k percentile is the values of a distribution with k percentage of the
values equal to or below it. For example, the 25th percentile value is equal to or greater than 25
percent of the values of the distribution (CIPEC, 2008).
121
The reference data for DF and EDR (washer’s KPIs) have been presented by Turner et al. (2001).
The reference value for the economy of the paper machine dryer and evaporation has been
presented in the handbook for P&P technologists (Smook, 2002).
6.2.2 Step 2: Diagnosis
The KPI is calculated and compared with reference values. If the calculated KPI is close to or in
the range of the reference values, it means that the department or equipment is operating
efficiently. On the other hand, if it is far from the reference values, the probable causes of
inefficiency should be identified. There is no on-site examination to perform an actual diagnosis.
The identification of probable causes has been done based on the published work and the
representative simulation model of the mill. These inefficiencies are sometimes due to poor
operating conditions or lack of maintenance and sometimes due to inefficient and old equipment.
6.2.3 Step 3: Performance improvement
Some general and probable projects are proposed to correct the inefficiencies. They are identified
based on the published work and also using the simulation model of the mill. The projects
include modification of operating conditions, improvement of maintenance or replacement of
equipment.
6.2.4 Step 4: Economic analysis
Changes in the operating conditions and improvement of maintenance entail new investment cost
and increase the operating cost of the process. The capital cost requirement is calculated based
on published work and proportionally adjusted for identified probable remedial projects.
6.2.4.1 Profitability analysis
There are some assumptions that are required for profitability analysis. They have been provided
by the mill or taken from the published work:
The natural gas price is 6.0 $/GJ. The HHV of natural gas (HHVNG) is 54.7 MJ/kg or
46.25 MJ/m3.
The price of fresh water is 0.065 $/m3 (Mateos-Espejel et al., 2011c).

122
The price for effluent treatment is 0.069 $/m3.
Number of operating days is 354 or 8500 hours per year (Browne et al., 2011).
6.3 Results
6.3.1 Digesting department
The digesting department comprises three main pieces of equipment, which use steam and water:
the chip bin, steaming vessel, and heaters of the digester (Fig. 6-3).
Fig. 6-3 - Schematic of digesting department
At the chip bin, the injection of hot water or filtrate as well as steam at atmospheric pressure is
carried out to partially remove air from chips (Smook, 2002) and soften the wood. The chip bin
consumes 5.0 m3/h of hot water at 95°C and 5.4 MW of medium pressure (MP) steam (192°C
and 1270 kPa). MP steam and non-clean steam of black liquor flash tank #1 (BL flash No.1) is
injected into the steaming vessel to preheat the chips and drive off air and non-condensable gases
(Smook, 2002). The steaming vessel consumes 6.1 MW of MP steam. The digester of the mill is
a continuous digester. The steam consumption at its upper and lower heaters is 6.0 MW of MP

123
steam. The output of the digesting step is brown pulp, which is directed to the washing
department.
The thermal energy consumption (TEC) is shown in Fig. 6-4 and compared with the reference
data. The results show that the TEC of the digesting department is 1.6 times more than the 75th
percentile. The probable reason is high heat loss through the equipment of this department due to
old (equipment more than 90 years old) or poor insulation and/or a lack of maintenance. In
addition, the clean condensate from digester heaters is discharged to the sewer. Therefore, with
better insulation and maintenance, improving the recycling of waste heat (Martin et al., 2000) as
well as sending back the clean condensate to the condensate tank of the steam plant, the heat loss
could be reduced and, consequently, bring the TEC to at least the same value as the 75th
percentile. This can result in 5.1 MW of total steam savings, which accounts for 4.6% of the total
steam consumption of the mill. The impact of heat loss reduction in the equipment has been
assessed using a simulation model. By improving the maintenance of the chip bin and steaming
vessel, the steam injection will decrease and, consequently, the quantity of mixture of non-
condensable gas and flashed steam from the steaming vessel will be reduced. This would result
in a reduction of 6 m3/h of hot water (80oC) from the surface condenser of digesting. The capital
investment to improve the digesting equipment and also piping to return the clean condensate to
the steam plant is approximately 0.28 (Martin et al., 2000) and 0.13 M$, respectively. In
addition, the operating cost also would roughly increase by 40 k$/a (Martin et al., 2000).
Fig. 6-4 - Thermal energy consumption (TEC) for digesting department
5.95
3.81
2.432.94
3.81
0
2
4
6
. Current Modified .
TEC
(GJ/
Odt
)
25th percentile Median 75th percentile
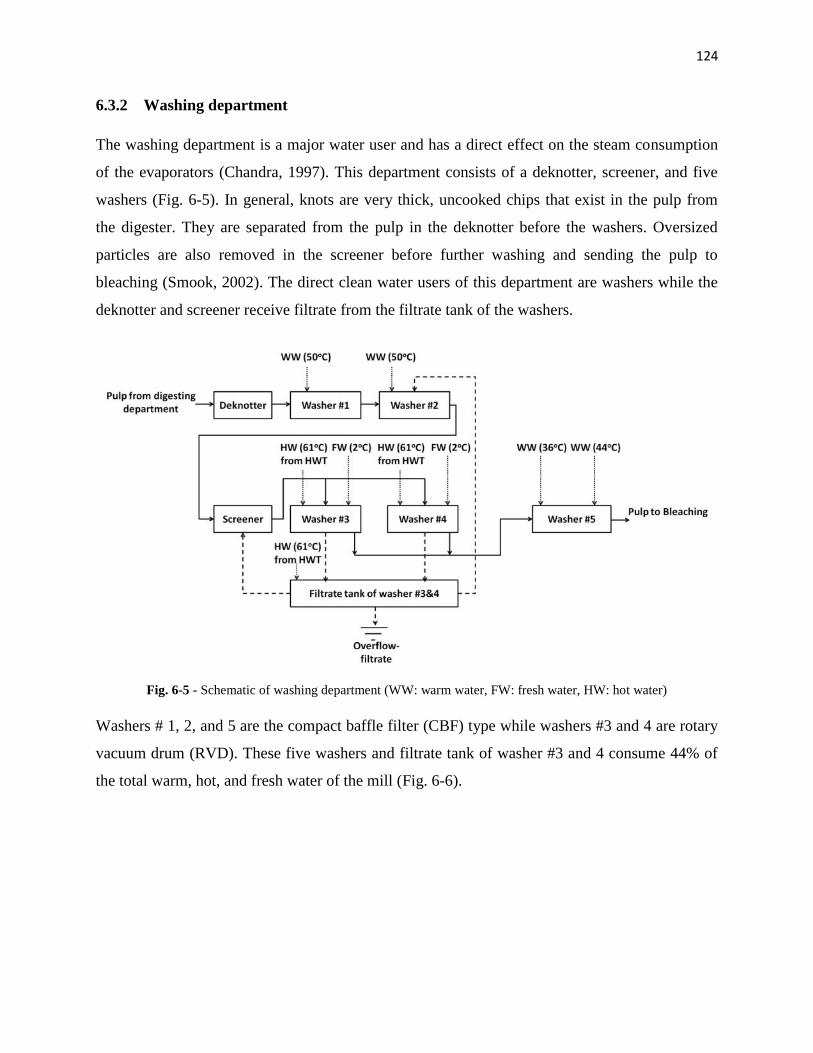
124
6.3.2 Washing department
The washing department is a major water user and has a direct effect on the steam consumption
of the evaporators (Chandra, 1997). This department consists of a deknotter, screener, and five
washers (Fig. 6-5). In general, knots are very thick, uncooked chips that exist in the pulp from
the digester. They are separated from the pulp in the deknotter before the washers. Oversized
particles are also removed in the screener before further washing and sending the pulp to
bleaching (Smook, 2002). The direct clean water users of this department are washers while the
deknotter and screener receive filtrate from the filtrate tank of the washers.
Fig. 6-5 - Schematic of washing department (WW: warm water, FW: fresh water, HW: hot water)
Washers # 1, 2, and 5 are the compact baffle filter (CBF) type while washers #3 and 4 are rotary
vacuum drum (RVD). These five washers and filtrate tank of washer #3 and 4 consume 44% of
the total warm, hot, and fresh water of the mill (Fig. 6-6).

125
Fig. 6-6 - Water consumption at washing department – current and modified after projects
The calculated DF and EDR for washers and their typical values are illustrated in Fig. 6-7. High
DF indicates high water consumption at the washer; however, it results in cleaner pulp. The high
EDR shows the high efficiency of washing. Washers # 1 and 2 operate well because the EDR for
both washers is acceptable. For washer # 1, this parameter is even higher than the typical high
value while for washer # 2, it is within the acceptable range. In addition, DF for these washers is
even lower than the typical value and shows that they do not consume too much water.
Therefore, there is no modification required for these two washers.
Both washers # 3 and 4 operate similarly; 50% of pulp is directed to # 3 and 50% to # 4 (Fig.
6-5). The DF is high compared to the reference value (Fig. 6-7), which shows the high water
consumption at the washers; however, the EDR is bigger than the reference value, which is
acceptable. Using the simulation model of the mill, reducing the water consumption is proposed
to bring the DF equal to the reference value while the EDR still remains higher than the typical
value. Thus, the total water savings for these washers is 52 m3/h (Fig. 6-6). This water is reduced
from fresh water at 2°C that causes the low temperature of the filtrate, which leaves the washers
for the filtrate tank of washers # 3 and 4 (Fig. 6-5). The total hot water at 61°C, which requires
retaining the temperature of the tank at 38°C, can be decreased from 210 to 120 m3/h (Fig. 6-6).
From an efficiency point of view, the EDR of washer # 5 is greater than the reference value (Fig.
6-7) and shows efficient washing. However, the DF of this washer is high and consumes a large
quantity of water. The DF can be corrected by reducing the warm water (44oC) consumption for
13.2 15.3
108 108137.5
210
592
13.2 15.3
82 82110.5 120
423
0
200
400
600
Washer #1 Washer #2 Washer #3 Washer #4 Washer #5 Filtrate tank ofwasher #2 &3
Total ofwashing
Wat
er c
onsu
mpt
ion
(m3 /
h)Current
Modified
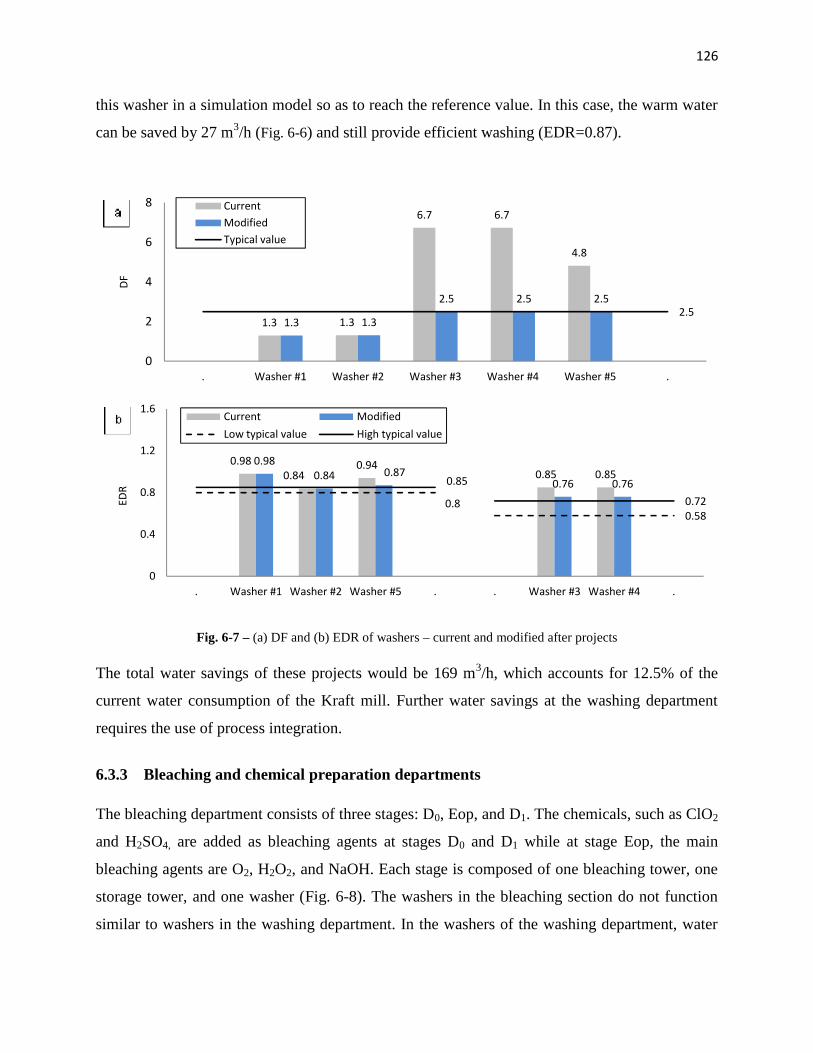
126
this washer in a simulation model so as to reach the reference value. In this case, the warm water
can be saved by 27 m3/h (Fig. 6-6) and still provide efficient washing (EDR=0.87).
Fig. 6-7 – (a) DF and (b) EDR of washers – current and modified after projects
The total water savings of these projects would be 169 m3/h, which accounts for 12.5% of the
current water consumption of the Kraft mill. Further water savings at the washing department
requires the use of process integration.
6.3.3 Bleaching and chemical preparation departments
The bleaching department consists of three stages: D0, Eop, and D1. The chemicals, such as ClO2
and H2SO4, are added as bleaching agents at stages D0 and D1 while at stage Eop, the main
bleaching agents are O2, H2O2, and NaOH. Each stage is composed of one bleaching tower, one
storage tower, and one washer (Fig. 6-8). The washers in the bleaching section do not function
similar to washers in the washing department. In the washers of the washing department, water
1.3 1.3
0
2
4
6
8
. Washer #1
DF
CurrentModifiedTypical value
0.980.84
0.98
0
0.4
0.8
1.2
1.6
. Washer #1 Washer #2
EDR
CurrentLow typical value
126
this washer in a simulation model so as to reach the reference value. In this case, the warm water
can be saved by 27 m3/h (Fig. 6-6) and still provide efficient washing (EDR=0.87).
Fig. 6-7 – (a) DF and (b) EDR of washers – current and modified after projects
The total water savings of these projects would be 169 m3/h, which accounts for 12.5% of the
current water consumption of the Kraft mill. Further water savings at the washing department
requires the use of process integration.
6.3.3 Bleaching and chemical preparation departments
The bleaching department consists of three stages: D0, Eop, and D1. The chemicals, such as ClO2
and H2SO4, are added as bleaching agents at stages D0 and D1 while at stage Eop, the main
bleaching agents are O2, H2O2, and NaOH. Each stage is composed of one bleaching tower, one
storage tower, and one washer (Fig. 6-8). The washers in the bleaching section do not function
similar to washers in the washing department. In the washers of the washing department, water
1.3
6.7 6.7
4.8
1.3 1.3
2.5 2.5 2.5
Washer #1 Washer #2 Washer #3 Washer #4 Washer #5
0.840.94
0.85 0.850.84 0.870.76 0.76
0.8
0.85
Washer #2 Washer #5 . . Washer #3 Washer #4
ModifiedLow typical value High typical value
126
this washer in a simulation model so as to reach the reference value. In this case, the warm water
can be saved by 27 m3/h (Fig. 6-6) and still provide efficient washing (EDR=0.87).
Fig. 6-7 – (a) DF and (b) EDR of washers – current and modified after projects
The total water savings of these projects would be 169 m3/h, which accounts for 12.5% of the
current water consumption of the Kraft mill. Further water savings at the washing department
requires the use of process integration.
6.3.3 Bleaching and chemical preparation departments
The bleaching department consists of three stages: D0, Eop, and D1. The chemicals, such as ClO2
and H2SO4, are added as bleaching agents at stages D0 and D1 while at stage Eop, the main
bleaching agents are O2, H2O2, and NaOH. Each stage is composed of one bleaching tower, one
storage tower, and one washer (Fig. 6-8). The washers in the bleaching section do not function
similar to washers in the washing department. In the washers of the washing department, water
2.52.5
Washer #5 .
0.850.76
0.580.72
Washer #4 .

127
plays the main role for cleaning the pulp while at the washers of the bleaching stages; both
chemicals and water play this cleaning role. Therefore, the washer of bleaching stages cannot be
evaluated like the washers of the washing department. In the bleaching department, the energy
and water performance of the whole system should be taken into account.
Fig. 6-8 - Schematic of bleaching sequences
Figure 6-9 demonstrates the summary of thermal energy and water consumptions of the
bleaching and chemical preparation departments. The steam consumption is 11.7 MW, which
corresponds to 3.51 GJ/Odt of thermal energy consumption. This number is close to the median
Canadian one, so it can be concluded that the bleaching and chemical preparation perform well
from the energy perspective. The water consumption is 24.4 m3/Adt (332 m3/h), which is below
the water consumption of the average mills designed in the 1980s, thus, these departments are
water efficient, too.

128
Fig. 6-9 – (a) Thermal energy (TEC) and (b) water consumption of bleaching and chemical preparation department
6.3.4 Paper machine department
The paper machine consumes 45.1 MW (5.15 GJ/Odt) of steam to pre-heat air, to warm up white
water at the silo chest, and to dry paper (Fig. 6-10). This accounts for 40% of total steam
consumption of the mill. The dryer by itself consumes 24.0 MW of this steam accounting for
22% of steam consumption of the mill. The calculated economy for the dryer is 1.1 ton of steam
consumed per ton of water evaporated. This number is smaller than the typical economy which is
1.3 t/t (Smook, 2002), so the paper machine dryer is energetically efficient.
Fig. 6-10 - Schematic of paper machine
3.51
0
2
4
6
. Mill
TEC
(GJ/
Odt
)25th percentileMedian75th percentile
128
Fig. 6-9 – (a) Thermal energy (TEC) and (b) water consumption of bleaching and chemical preparation department
6.3.4 Paper machine department
The paper machine consumes 45.1 MW (5.15 GJ/Odt) of steam to pre-heat air, to warm up white
water at the silo chest, and to dry paper (Fig. 6-10). This accounts for 40% of total steam
consumption of the mill. The dryer by itself consumes 24.0 MW of this steam accounting for
22% of steam consumption of the mill. The calculated economy for the dryer is 1.1 ton of steam
consumed per ton of water evaporated. This number is smaller than the typical economy which is
1.3 t/t (Smook, 2002), so the paper machine dryer is energetically efficient.
Fig. 6-10 - Schematic of paper machine
2.57
3.41
4.65
.
24.4
0
20
40
60
80
. Mill
Wat
er c
onsu
mpt
ion
(m3 /
Adt)
Mills design 1960s
Mills design 1980s
128
Fig. 6-9 – (a) Thermal energy (TEC) and (b) water consumption of bleaching and chemical preparation department
6.3.4 Paper machine department
The paper machine consumes 45.1 MW (5.15 GJ/Odt) of steam to pre-heat air, to warm up white
water at the silo chest, and to dry paper (Fig. 6-10). This accounts for 40% of total steam
consumption of the mill. The dryer by itself consumes 24.0 MW of this steam accounting for
22% of steam consumption of the mill. The calculated economy for the dryer is 1.1 ton of steam
consumed per ton of water evaporated. This number is smaller than the typical economy which is
1.3 t/t (Smook, 2002), so the paper machine dryer is energetically efficient.
Fig. 6-10 - Schematic of paper machine
55
31
.
Mills design 1960s
Mills design 1980s

129
6.3.5 Evaporation department
The first department of the recovery loop is evaporation. The mill has a six-effect evaporator,
which concentrates weak black liquor from 19 to 50% of dissolved solids (Fig. 6-11). The 50%
dissolved solids black liquor, strong black liquor, is concentrated further in the cascade
concentrator up to 71.5% using heat from the stack gas and then directed towards the recovery
boiler (Fig. 6-12).
Fig. 6-11 - Schematic of six-effect evaporator
The calculated economy for all evaporation effects is 5.75 tons of evaporated water per steam
consumed and it is larger than the typical economy (5.5 t/t). Thus, it can be concluded that the
evaporation train operates well and has reasonable energy consumption.
6.3.6 Steam plant
The steam plant is the key area where enough energy is produced to operate the mill. It
comprises one recovery boiler (RB), one bark power boiler (PB #1), and three natural gas power
boilers (PB # 2, 3 & 6) during winter conditions. The reason for the utilization of four power
boilers is that the Kraft pulp only accounts for 40% of total produced paper, so there is not
enough black liquor generated from the Kraft process for burning at the recovery boiler. Thus, it
cannot cope with the steam requirement of the mill and, in particular, the paper machine in which
both Kraft and mechanical pulps are blended and which consumes 45.1 MW of steam.

130
6.3.6.1 Boilers
The recovery boiler (RB) evaporates water from the black liquor prior to burning. This involves
passing hot stack gas from the boiler over the black liquor to drive off the water, so the black
liquor is concentrated enough to burn efficiently (Fig. 6-12) (AbitibiBOWATER). The RB
receives 34 t/h (813 t/d) of black liquor with 71.5% of total dissolved solids concentration and 96
t/h of air at 169°C. It produces 40.1 MW of MP steam, and 122 t/h of stack gas at high
temperature (478°C), which passes through the cascade concentrator to concentrate the black
liquor and produce warm water at 50°C at the scrubber (Fig. 6-12).
Fig. 6-12 – Schematic of recovery boiler, concentrator cascade, and scrubber
The flowrate of the fuel, air and stack gas temperatures, steam production, and calculated fuel
consumption for the boilers, including RB, are displayed in Fig. 6-13. The temperature of the
inlet air is an important factor for the efficiency of the boilers, the higher the inlet air
temperature, the higher the boiler efficiency. At all boilers of the mill, this temperature is high
enough and is in the range of 169-210oC. The fuel consumption of the recovery boiler is
significantly higher than the 75th percentile of Canadian mills. This shows that the quantity of
steam produced in the RB is too low. The probable causes could be high heat loss through the
envelope of the recovery boiler by convection and radiation, incomplete fuel burning, irregular
monitoring of the steam traps, or steam leakage via the pipes (Martin et al., 2000). In addition, in
131
the absence of good maintenance, the burners could probably be worn out or require adjustments
(Martin et al., 2000). The probable solutions could be to optimize the lubrication of the bearings
to reduce heat loss and wear and tear, improve maintenance and insulation of the boiler, repair
steam leakage, and monitor the steam traps, which can prevent venting significant amounts of
steam. Furthermore, the stack gas can be monitored to analyse the composition to ensure
complete fuel burning. By implementing these probable solutions, the fuel consumption can be at
least equal to the 75th percentile (2.13 GJ/GJ). Since the total received black liquor to the
recovery boiler is not altered, the steam production can be raised from 40.1 to 57.0 MW. The
total capital investment cost is approximately 0.4 M$ while the operating cost will increase about
17 k$/a (Martin et al., 2000).
The fuel consumption of PB # 1 and # 2 is greater than the 75th percentile (Fig. 6-13e). The
probable reason for this high fuel consumption could be similar to the case of the recovery
boiler. Thus, perhaps by applying the same improvements as for the RB, at least a fuel
consumption of the 75th percentile could be achieved. These improvements could lead to an
increase in steam production from 15.8 to 16.9 MW and 15.0 to 18.7 for PB # 1 and PB # 2,
respectively. They entail approximate investment costs of 0.06 and 0.09 M$ for PB #1 and #2,
respectively while the increase in their operating cost would be roughly 3 and 4 k$/a,
respectively (Martin et al., 2000). The fuel consumption of PB # 3 and # 6 is close to the
Canadian median (Fig. 6-13e). Therefore, it can be concluded that these two boilers operate well.

132
Fig. 6-13 – (a) & (b) Flowrate of fuel, (c) temperature of air and stack gas, (d) steam production, and (e) fuelconsumption (KPI) of the boilers
812.5
0
300
600
900
RB
Flow
rate
(t/d
)
Black liquor (71.5%)BarkBunker oil
169 21
0
172
172
478
322
234
0
200
400
600
RB PB#1 PB#2 PB#3
T(o C
)
Air in Stack gas
3.03
2.13
1.792.022.13
0
0.5
1
1.5
2
2.5
3
3.5
. RB .
Fuel
con
sum
ptio
n (G
J/GJ
)
25th percentile
132
Fig. 6-13 – (a) & (b) Flowrate of fuel, (c) temperature of air and stack gas, (d) steam production, and (e) fuelconsumption (KPI) of the boilers
127.2
17.3
PB#1
Black liquor (71.5%)
45.159.0
36.9
0
40
80
120
160
PB#2 PB#3 PB#6
Nat
ural
gas
con
sum
ptio
n (k
m3 /
d)
172 21
0
145
135
PB#3 PB#6
Stack gas
40.1
15.8
15
27.7
57
16.9
18.7 27
.7
0
40
80
120
160
RB PB#1 PB#2 PB#3
Stea
m p
rodu
ctio
n (M
W)
Current Modified
1.79 2.
08
1.47
1.411.67
1.67
1.47
1.792.022.13
. PB#1 PB#2 PB#3 PB#6
25th percentile Median 75th percentile
132
Fig. 6-13 – (a) & (b) Flowrate of fuel, (c) temperature of air and stack gas, (d) steam production, and (e) fuelconsumption (KPI) of the boilers
36.9
141
PB#6 Total
18.1
116.
7
27.7
18.1
138.
4
PB#3 PB#6 Total
Modified
1.41
1.41
1.28
1.38
1.67
PB#6 .
75th percentile

133
6.3.6.2 Deaerator
The most energy intensive area in the steam plant is the deaerator, which is employed to pre-heat
the water for the boilers up to 130.5°C and remove air from the water (Fig. 6-14).
Fig. 6-14 - Simple schematic of deaerator
The water and steam consumption (MW) and calculated steam consumption (%) of the deaerator
are presented in Fig. 6-15 (a-c). The deaerator consumes 15.0 % of total steam production of the
mill (Fig. 6-15c). This load can be diminished by flashing the boilers’ blowdown water (BLF)
and injecting 2.9 MW produced low pressure (LP) steam to the deaerator (Fig. 6-15d) (EPA,
2010). The capital investment cost and operating cost to install the new flash tank are 0.33 M$
and 110 k$/a, respectively (Martin et al., 2000).
Applying the aforementioned projects to the boilers increases the total requirement of feed water
to the deaerator. Thus, the fresh water to the condensate tank increases from 83 to 109 m3/h (Fig.
6-15a) and the net steam consumption at the deaerator rises from 17.6 to 19.5 MW. However, the
steam consumption (%) at the deaerator decreases to 14.1% due to LP steam from the blowdown
flash tank. Further steam reduction at the deaerator requires substituting hot or warm water to
condensate tank for fresh water (Fig. 6-14). The saved hot water (84 m3/h) at 61oC and 7 m3/h of
saved warm water (44oC) from the washing department projects as well as 8 m3/h of returned
condensate from the digesting department can be substituted for fresh water at the condensate
tank (Fig. 6-14). This decreases the demand for fresh water consumption at the condensate tank
from 109 to 10 m3/h and increases the temperature of the condensate tank from 42 to 66°C. Thus,
the steam consumption at the deaerator drops from 19.5 to 13.2 MW through which 5.7% of total
current steam consumption of the mill is saved. The total piping cost to transfer the warm and hot
waters from warm and hot water tanks to the condensate tank is 0.26 M$. By applying these two

134
projects to the deaerator, the steam consumption is reduced to 9.4%, which stands between the
median and the 75th percentile.
Fig. 6-15 – (a) Water consumption (m3/h), (b) steam consumption (MW), and (c) steam consumption (%) ofdeaerator (d) flash of blowdown (BLF)
83
109
0
40
80
120
Wat
er C
onsu
mpt
ion
(m3/
h)
15 14.1
0
4
8
12
16
20
24
Stea
m c
onsu
mpt
ion
(%)
25th percentileMedian75th percentile
d
134
projects to the deaerator, the steam consumption is reduced to 9.4%, which stands between the
median and the 75th percentile.
Fig. 6-15 – (a) Water consumption (m3/h), (b) steam consumption (MW), and (c) steam consumption (%) ofdeaerator (d) flash of blowdown (BLF)
109
17.619.5
0
5
10
15
20
25
Stea
m C
onsu
mpt
ion
(MW
)
9.4
5.98.3
11
25th percentileMedian75th percentile
d
134
projects to the deaerator, the steam consumption is reduced to 9.4%, which stands between the
median and the 75th percentile.
Fig. 6-15 – (a) Water consumption (m3/h), (b) steam consumption (MW), and (c) steam consumption (%) ofdeaerator (d) flash of blowdown (BLF)
19.5
13.2
d
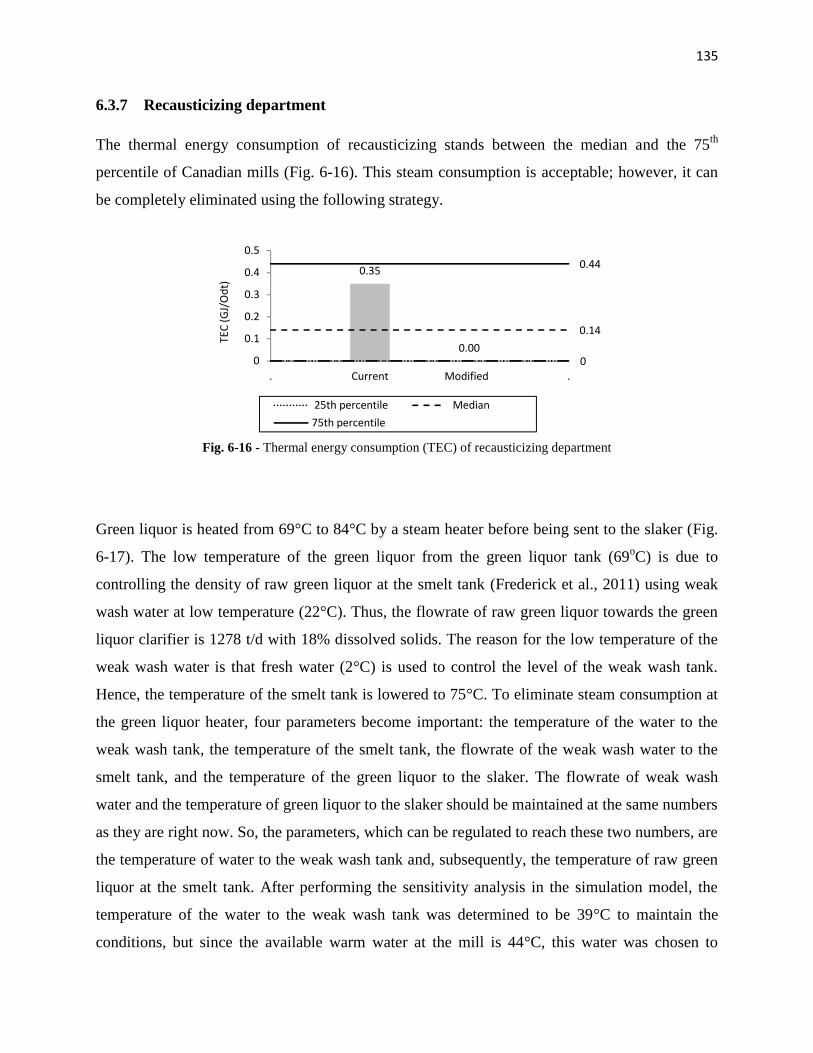
135
6.3.7 Recausticizing department
The thermal energy consumption of recausticizing stands between the median and the 75th
percentile of Canadian mills (Fig. 6-16). This steam consumption is acceptable; however, it can
be completely eliminated using the following strategy.
Fig. 6-16 - Thermal energy consumption (TEC) of recausticizing department
Green liquor is heated from 69°C to 84°C by a steam heater before being sent to the slaker (Fig.
6-17). The low temperature of the green liquor from the green liquor tank (69oC) is due to
controlling the density of raw green liquor at the smelt tank (Frederick et al., 2011) using weak
wash water at low temperature (22°C). Thus, the flowrate of raw green liquor towards the green
liquor clarifier is 1278 t/d with 18% dissolved solids. The reason for the low temperature of the
weak wash water is that fresh water (2°C) is used to control the level of the weak wash tank.
Hence, the temperature of the smelt tank is lowered to 75°C. To eliminate steam consumption at
the green liquor heater, four parameters become important: the temperature of the water to the
weak wash tank, the temperature of the smelt tank, the flowrate of the weak wash water to the
smelt tank, and the temperature of the green liquor to the slaker. The flowrate of weak wash
water and the temperature of green liquor to the slaker should be maintained at the same numbers
as they are right now. So, the parameters, which can be regulated to reach these two numbers, are
the temperature of water to the weak wash tank and, subsequently, the temperature of raw green
liquor at the smelt tank. After performing the sensitivity analysis in the simulation model, the
temperature of the water to the weak wash tank was determined to be 39°C to maintain the
conditions, but since the available warm water at the mill is 44°C, this water was chosen to
0.35
0.000
0.14
0.44
0
0.1
0.2
0.3
0.4
0.5
. Current Modified .
TEC
(GJ/
Odt
)
25th percentile Median75th percentile
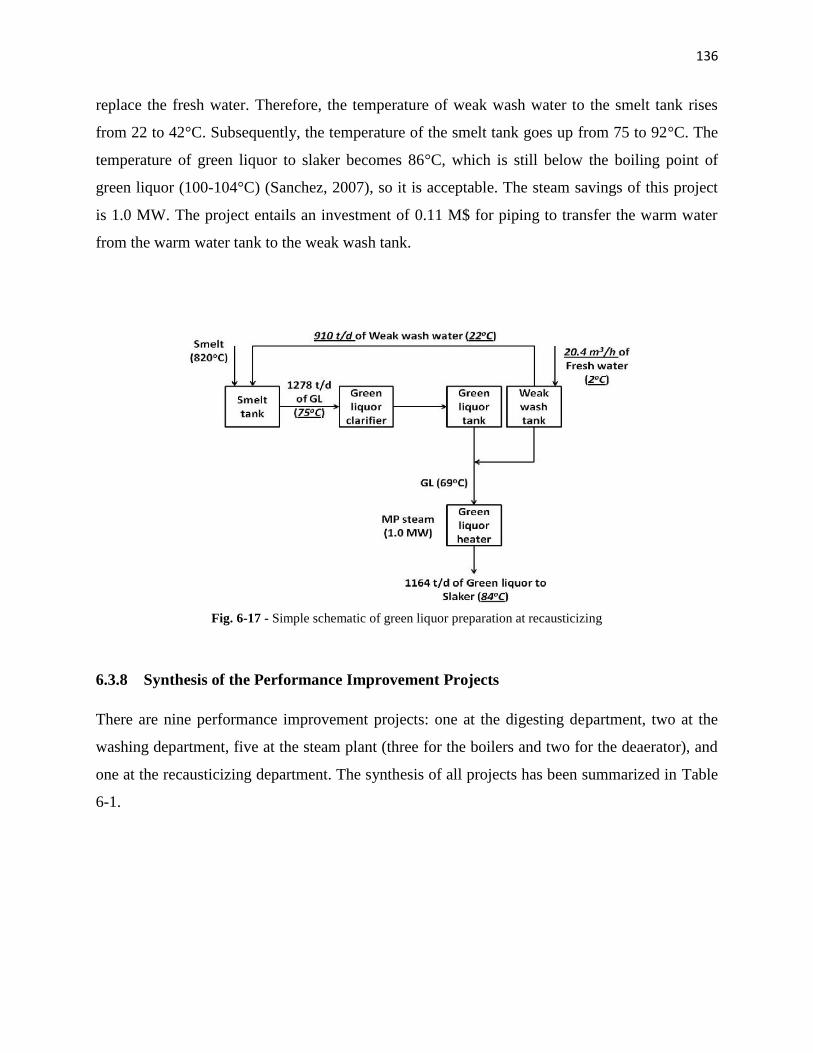
136
replace the fresh water. Therefore, the temperature of weak wash water to the smelt tank rises
from 22 to 42°C. Subsequently, the temperature of the smelt tank goes up from 75 to 92°C. The
temperature of green liquor to slaker becomes 86°C, which is still below the boiling point of
green liquor (100-104°C) (Sanchez, 2007), so it is acceptable. The steam savings of this project
is 1.0 MW. The project entails an investment of 0.11 M$ for piping to transfer the warm water
from the warm water tank to the weak wash tank.
Fig. 6-17 - Simple schematic of green liquor preparation at recausticizing
6.3.8 Synthesis of the Performance Improvement Projects
There are nine performance improvement projects: one at the digesting department, two at the
washing department, five at the steam plant (three for the boilers and two for the deaerator), and
one at the recausticizing department. The synthesis of all projects has been summarized in Table
6-1.

137
Table 6-1 – Summary of the performance improvement projects
# Project name Probable remedialsolution
Consequence of project on the process Saving / increase*
Steam(MW)
Water(m3/h)
1 Digestingdepartment
Reduce the heat lossby improving themaintenance
-Reduction of steam consumption +5.1* -
-Reduction of hot water (80oC) production atsurface condenser
- -6*
Return the cleancondensate to steamplant
-Reduction of water consumption at deaerator - +8
2 Washers #3 &4
Reduce the DF -Reduction of fresh water consumption - +52
-Reduction of hot water (61oC) consumption atfiltrate tank of washers # 3 & 4
- +90
-Increase the quantity of black liquor to recoveryboiler from 813 to 817 t/d and increase steamproduction at RB
+1.6 -
3 Washer # 5 Reduce the DF -Reduction of warm water consumption - +27
4 Recovery boiler Reduce the heat lossby improving themaintenance
-Increase steam production +16.9 -
-Increase fresh water consumption at deaerator
-Increase steam consumption at deaerator
-
-3.7
-20
-
5 Power boiler #1 Reduce the heat lossby improving themaintenance
-Increase steam production +1.1 -
-Increase fresh water consumption at deaerator
-Increase steam consumption at deaerator
-
-0.2
-1
-
6 Power boiler #2 Reduce the heat lossby improving themaintenance
-Increase steam production +3.7 -
-Increase fresh water consumption at deaerator
-Increase steam consumption at deaerator
-
-0.9
-5
-
7 Deaerator Flash blowdown andinject the producedsteam to deaerator
-Reduction of steam consumption at deaerator +2.9 -
8 Deaerator Replace fresh water tothe deaerator withsaved hot and warmwater of projects #2and #3 and cleancondensate of project#1
-Reduction of steam consumption at deaerator +6.3 -
9 Recausticizingdepartment
Replace the freshwater with saved warmwater of project #3
-Elimination of steam consumption at green liquorheater
+1.0 -
Total +33.8 +145*Plus (+) means an increase in steam generation at the boiler, also steam and water savings; minus (-) means anincrease in steam or water consumption at deaerator
Applying all projects together affects all the results. For example, the project of washers # 3 and
4 (Project #2) increases the quantity of black liquor to the recovery boiler from 813 to 817 t/d, so
the steam production at the RB increases by 1.6 MW. The digesting department project (Project
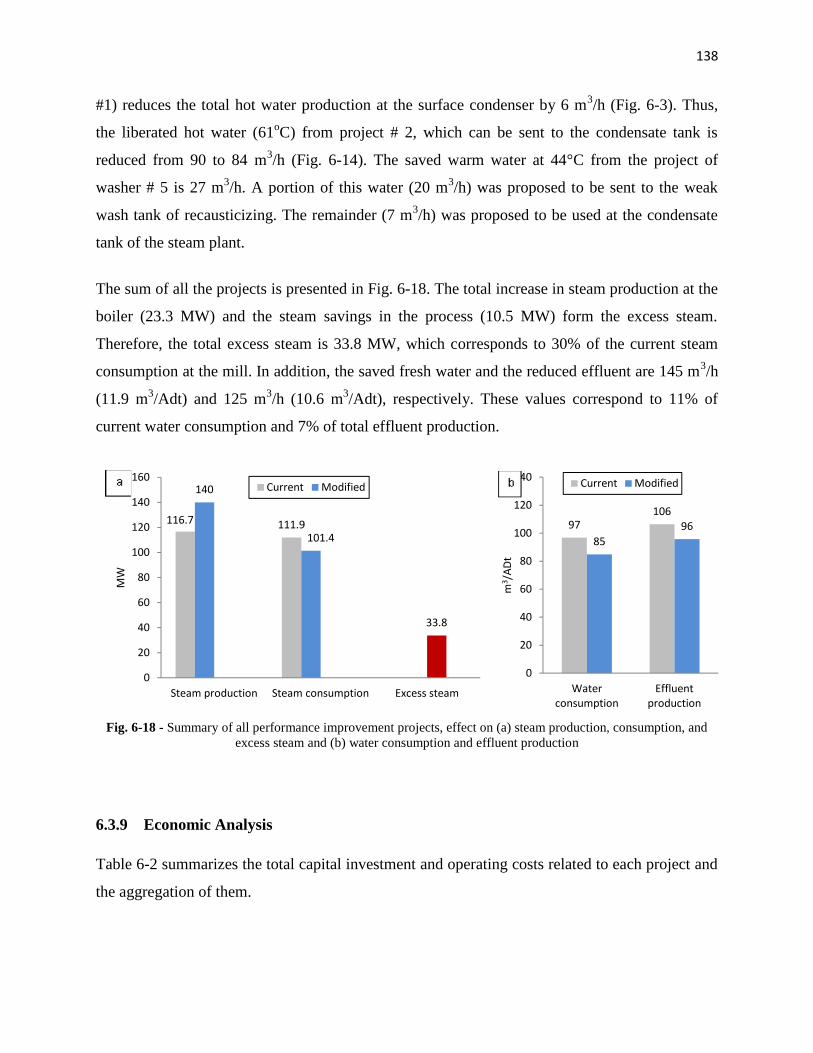
138
#1) reduces the total hot water production at the surface condenser by 6 m3/h (Fig. 6-3). Thus,
the liberated hot water (61oC) from project # 2, which can be sent to the condensate tank is
reduced from 90 to 84 m3/h (Fig. 6-14). The saved warm water at 44°C from the project of
washer # 5 is 27 m3/h. A portion of this water (20 m3/h) was proposed to be sent to the weak
wash tank of recausticizing. The remainder (7 m3/h) was proposed to be used at the condensate
tank of the steam plant.
The sum of all the projects is presented in Fig. 6-18. The total increase in steam production at the
boiler (23.3 MW) and the steam savings in the process (10.5 MW) form the excess steam.
Therefore, the total excess steam is 33.8 MW, which corresponds to 30% of the current steam
consumption at the mill. In addition, the saved fresh water and the reduced effluent are 145 m3/h
(11.9 m3/Adt) and 125 m3/h (10.6 m3/Adt), respectively. These values correspond to 11% of
current water consumption and 7% of total effluent production.
Fig. 6-18 - Summary of all performance improvement projects, effect on (a) steam production, consumption, andexcess steam and (b) water consumption and effluent production
6.3.9 Economic Analysis
Table 6-2 summarizes the total capital investment and operating costs related to each project and
the aggregation of them.
116.7 111.9
140
101.4
0
20
40
60
80
100
120
140
160
Steam production Steam consumption
MW
Current
138
#1) reduces the total hot water production at the surface condenser by 6 m3/h (Fig. 6-3). Thus,
the liberated hot water (61oC) from project # 2, which can be sent to the condensate tank is
reduced from 90 to 84 m3/h (Fig. 6-14). The saved warm water at 44°C from the project of
washer # 5 is 27 m3/h. A portion of this water (20 m3/h) was proposed to be sent to the weak
wash tank of recausticizing. The remainder (7 m3/h) was proposed to be used at the condensate
tank of the steam plant.
The sum of all the projects is presented in Fig. 6-18. The total increase in steam production at the
boiler (23.3 MW) and the steam savings in the process (10.5 MW) form the excess steam.
Therefore, the total excess steam is 33.8 MW, which corresponds to 30% of the current steam
consumption at the mill. In addition, the saved fresh water and the reduced effluent are 145 m3/h
(11.9 m3/Adt) and 125 m3/h (10.6 m3/Adt), respectively. These values correspond to 11% of
current water consumption and 7% of total effluent production.
Fig. 6-18 - Summary of all performance improvement projects, effect on (a) steam production, consumption, andexcess steam and (b) water consumption and effluent production
6.3.9 Economic Analysis
Table 6-2 summarizes the total capital investment and operating costs related to each project and
the aggregation of them.
111.9101.4
33.8
Steam consumption Excess steam
Current Modified
9785
0
20
40
60
80
100
120
140
Waterconsumption
m3 /
ADt
Current
138
#1) reduces the total hot water production at the surface condenser by 6 m3/h (Fig. 6-3). Thus,
the liberated hot water (61oC) from project # 2, which can be sent to the condensate tank is
reduced from 90 to 84 m3/h (Fig. 6-14). The saved warm water at 44°C from the project of
washer # 5 is 27 m3/h. A portion of this water (20 m3/h) was proposed to be sent to the weak
wash tank of recausticizing. The remainder (7 m3/h) was proposed to be used at the condensate
tank of the steam plant.
The sum of all the projects is presented in Fig. 6-18. The total increase in steam production at the
boiler (23.3 MW) and the steam savings in the process (10.5 MW) form the excess steam.
Therefore, the total excess steam is 33.8 MW, which corresponds to 30% of the current steam
consumption at the mill. In addition, the saved fresh water and the reduced effluent are 145 m3/h
(11.9 m3/Adt) and 125 m3/h (10.6 m3/Adt), respectively. These values correspond to 11% of
current water consumption and 7% of total effluent production.
Fig. 6-18 - Summary of all performance improvement projects, effect on (a) steam production, consumption, andexcess steam and (b) water consumption and effluent production
6.3.9 Economic Analysis
Table 6-2 summarizes the total capital investment and operating costs related to each project and
the aggregation of them.
106
8596
Waterconsumption
Effluentproduction
Current Modified

139
Table 6-2 – Summary of capital investment and operating costsof the performance improvement projects
Project# Project name
Capitalinvestmentcost (M$)
Operatingcost (k$/a)
1 Digesting department 0.41 40
4 Recovery boiler 0.40 17
5 Power boiler #1 0.06 3
6 Power boiler #2 0.09 4
7 Deaerator - Flashblowdown waster 0.33 110
8 Deaerator - HW&WW consumption 0.26 -
9 Recausticizing 0.11 -
Total 1.66 174
The excess steam of 33.8 MW can be used to diminish the total fossil fuel at the natural gas
power boilers. The PB #2 can be completely shut down (18.7 MW) and the steam generation at
PB #3 can be reduced by 15.1 MW. This causes a reduction in the steam consumption at the
deaerator by 5.8 MW, which can be used to again reduce the steam generation at PB #3. Thus,
the total reduction of steam generation would be 39.6 MW (Fig. 6-19a). This results in the total
natural gas savings of 89.2 km3/d (Fig. 6-19b). The water consumption of the deaerator also
decreases by 46 m3/h (3.4 m3/Adt).
Fig. 6-19 - Summary: shutting down the boilers, effect on (a) steam production and consumption, waterconsumption and (b) natural gas consumption
116.
7
111.
9140
101.
4
100.
4
95.6
0
40
80
120
160
200
Steamproduction
(MW)
Steamconsumption
(MW)
MW
& m
3 /AD
t
CurrentAfter saving projectsAfter shut down boiler
139
Table 6-2 – Summary of capital investment and operating costsof the performance improvement projects
Project# Project name
Capitalinvestmentcost (M$)
Operatingcost (k$/a)
1 Digesting department 0.41 40
4 Recovery boiler 0.40 17
5 Power boiler #1 0.06 3
6 Power boiler #2 0.09 4
7 Deaerator - Flashblowdown waster 0.33 110
8 Deaerator - HW&WW consumption 0.26 -
9 Recausticizing 0.11 -
Total 1.66 174
The excess steam of 33.8 MW can be used to diminish the total fossil fuel at the natural gas
power boilers. The PB #2 can be completely shut down (18.7 MW) and the steam generation at
PB #3 can be reduced by 15.1 MW. This causes a reduction in the steam consumption at the
deaerator by 5.8 MW, which can be used to again reduce the steam generation at PB #3. Thus,
the total reduction of steam generation would be 39.6 MW (Fig. 6-19a). This results in the total
natural gas savings of 89.2 km3/d (Fig. 6-19b). The water consumption of the deaerator also
decreases by 46 m3/h (3.4 m3/Adt).
Fig. 6-19 - Summary: shutting down the boilers, effect on (a) steam production and consumption, waterconsumption and (b) natural gas consumption
9785 81
Steamconsumption
(MW)
Waterconsumption
(m3/Adt)
After saving projectsAfter shut down boiler
45.159.0
36.9
0.0
14.9
0
40
80
120
160
PB#2 PB#3 PB#6
km3 /
d
CurrentAfter saving projectsAfter shut down boiler
139
Table 6-2 – Summary of capital investment and operating costsof the performance improvement projects
Project# Project name
Capitalinvestmentcost (M$)
Operatingcost (k$/a)
1 Digesting department 0.41 40
4 Recovery boiler 0.40 17
5 Power boiler #1 0.06 3
6 Power boiler #2 0.09 4
7 Deaerator - Flashblowdown waster 0.33 110
8 Deaerator - HW&WW consumption 0.26 -
9 Recausticizing 0.11 -
Total 1.66 174
The excess steam of 33.8 MW can be used to diminish the total fossil fuel at the natural gas
power boilers. The PB #2 can be completely shut down (18.7 MW) and the steam generation at
PB #3 can be reduced by 15.1 MW. This causes a reduction in the steam consumption at the
deaerator by 5.8 MW, which can be used to again reduce the steam generation at PB #3. Thus,
the total reduction of steam generation would be 39.6 MW (Fig. 6-19a). This results in the total
natural gas savings of 89.2 km3/d (Fig. 6-19b). The water consumption of the deaerator also
decreases by 46 m3/h (3.4 m3/Adt).
Fig. 6-19 - Summary: shutting down the boilers, effect on (a) steam production and consumption, waterconsumption and (b) natural gas consumption
36.9
141.0
51.8
PB#6 Total
After saving projectsAfter shut down boiler

140
The economic results of the total projects after the reduction of natural gas consumption at the
power boilers are presented in Table 6-3. The results show that the payback period would be less
than 3 months and net profit is 8.8 M$/a. Natural gas (NG) savings of 89.2 km3/d is the
equivalent of a 1.3 kt/a reduction in CO2 emissions, which is environmentally advantageous.
Table 6-3 - Economic analysis of process improvement projects at Kraft mill after the reduction of natural gasconsumption
Effluentreduction
(m3/h)
Watersavings(m3/h)
Excesssteam(MW)
NGsavings(km3/d)
Effluentreduction
(M$/a)
Watersavings(M$/a)
NGsavings(M$/a)
Increase inoperating
cost(M$/a)
Netprofit
(M$/a)
capitalcost(M$)
Paybackperiod
(a)
125(7%)
183(14%)
39.6(35%) 89.2 0.1 0.1 8.8 0.2 8.8 1.7 0.2
6.4 Conclusion
The methodology to analyze and diagnose the performance of the equipment and departments
has been developed as a systematic approach to quickly identify the steam and water saving
potentials. The KPIs related to energy and water efficiency have been determined for the main
equipment and departments. The reference data for KPIs has been extracted from the literature to
be compared with the calculated KPIs of the process. The method identifies preliminary probable
causes of inefficiencies and suggests some probable remedial projects to correct them. This study
can be a starting point for further in-depth and on-site analysis of poor performance equipment to
improve their efficiency.
The method has been applied on an Eastern Canadian mill. Some departments and equipment in
the mill performed well, such as washers #1and 2 in the washing department, bleaching and
chemical preparation departments, the dryer of the paper machine, the evaporation department,
PB #3 and #6 of the steam plant, and recausticizing. The digesting department and some of the
equipment, such as washers # 3, 4, and 5 of the washing department, RB, PB #1, PB #2, and the
deaerator of the steam plant could be improved. Nine performance improvement projects have
been proposed to correct the inefficiencies. This could result in an increase of steam generation
at the boilers by 23.3 MW and a savings of 10.5 MW of steam at the digesting department (5.1
MW), the deaerator of the steam plant (4.4 MW), and the recausticzing department (1.0 MW), so
the total excess steam would be 33.8 MW, which is 30% of current steam consumption of the

141
mill. In addition, the total water saving and effluent reduction are 145 m3/h (11.9 m3/Adt) and
125 m3/h (10.6 m3/Adt), respectively.
The total capital investment cost for the performance improvement projects is approximately 1.7
M$. The operating costs also would increase by 0.2 M$/a. The net profit is significant and as
high as 8.8 M$/a and the payback period is as short as 0.2a. The natural gas savings at the boilers
results in a1.3 kt/a CO2 emission reduction.
Further steam and water savings can be achieved by carrying out process integration.
142
7CHAPTER 7: RETROFIT HEX NETWORK DESIGNTECHNIQUE
The objective of this chapter is to address all challenges and potentials that have been presented
in section 3.3.4 of literature review by developing a new technique for the retrofit HEN design of
the water-based process. The remainder of this chapter is organized as follows:
o The technique that is called “retrofit HEN design (R-HEN) of the water-based process”
is presented and the steps are elaborated. Mill C is also used to show different aspects of
the methodology.
o The results of applying the method on the mill C are shown.
o Pinch Analysis is performed for the mill C.
o The approach and also results of R-HEN and Pinch Analysis are compared to show the
advantages of the new technique.
7.1 Retrofit HEX Network Design (R-HEN)
The Retrofit HEX network design (R-HEN) is illustrated in Fig. 7-1 and encompasses four
successive steps. In the first two steps, the constraints that are envisaged to change in the current
conditions and design are analyzed and targeting to estimate final steam saving then carried out.
The guidelines for the preparation of required data for the HEN design are presented. The
potential for heat recovery from the waste stream is evaluated. The existing heat exchangers are
characterized in order to be effectively reused in the new HEN. In step 3, a new algorithm is
developed to design the HEX network. In step 4, the economic aspects of the new design are
calculated to illustrate the economic advantages of this new technique. Each step is elaborated in
the following sections.
It should be noted that different steps of the technique are supported by limited data and
examples of the application (Kraft process).
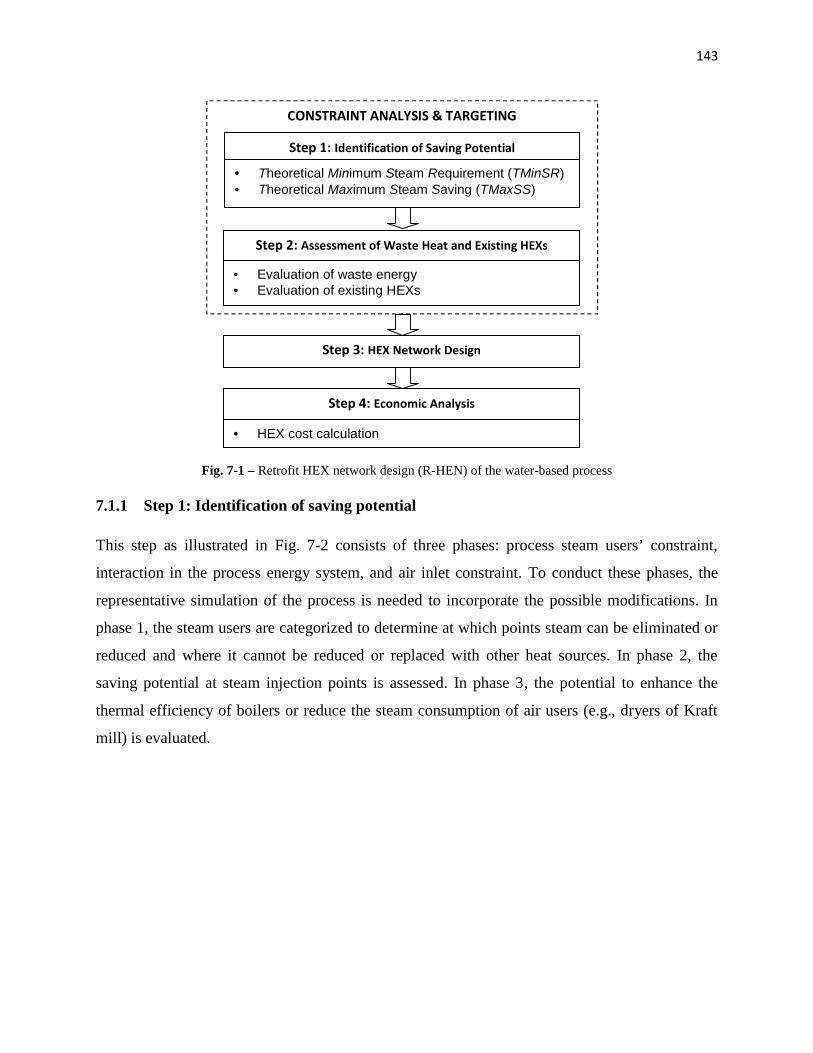
143
Fig. 7-1 – Retrofit HEX network design (R-HEN) of the water-based process
7.1.1 Step 1: Identification of saving potential
This step as illustrated in Fig. 7-2 consists of three phases: process steam users’ constraint,
interaction in the process energy system, and air inlet constraint. To conduct these phases, the
representative simulation of the process is needed to incorporate the possible modifications. In
phase 1, the steam users are categorized to determine at which points steam can be eliminated or
reduced and where it cannot be reduced or replaced with other heat sources. In phase 2, the
saving potential at steam injection points is assessed. In phase 3, the potential to enhance the
thermal efficiency of boilers or reduce the steam consumption of air users (e.g., dryers of Kraft
mill) is evaluated.
Step 3: HEX Network Design
Step 4: Economic Analysis
HEX cost calculation
CONSTRAINT ANALYSIS & TARGETING
Step 1: Identification of Saving Potential
Theoretical Minimum Steam Requirement (TMinSR) Theoretical Maximum Steam Saving (TMaxSS)
Step 2: Assessment of Waste Heat and Existing HEXs
Evaluation of waste energy Evaluation of existing HEXs

144
Fig. 7-2 – Step 1: Identification of saving potential
7.1.1.1 Phase 1: Process steam users’ constraint
The analysis of the steam users’ constraints is carried out to determine how to reduce or
eliminate steam consumption at different steam user points. Two types of steam users in the
water-based process as shown in Fig. 7-2 can be identified: steam heaters (SH) and steam
injection (SI) points. The steam heaters (SH) are divided into two categories: non-replaceable
heat source (NRHS-SH) and replaceable heat source (RHS-SH). Steam injection (SI) points are
also divided into two categories: feasible HEX heat sink (FHexHS-SI) and non-feasible HEX
heat sink (NFHexHS-SI). The latter one is classified into two subcategories: non-reducible heat
source (NRHS-NFHexHS-SI), and reducible heat source (RHS-NFHexHS-SI).
Figure 7-3 demonstrates the differences between these five categories using five different
examples:
Phase 1: Process Steam Users Constraints
Steam Heaterso Non-Replaceable Heat Source (NRHS-SH)o Replaceable Heat Source (RHS-SH)
Steam Injectionso Feasible HEX Heat Sink (FHexHS-SI)o Non-Feasible Heat Sink
Non-Reducible Heat Source (NRHS-NFHexHS-SI) Reducible Heat Source (RHS-NFHexHS-SI)
Phase 2: Interaction in Process Energy System
Raise the temperature of water to process line Analyze the temperature of water to the process line respecting:
o Acceptable temperature of different reactors (e.g.,bleaching reactors in Kraft mill)
o Acceptable temperature of water to sensitive equipment(e.g., washer in Kraft mill)
Assessment of acceptable temperature of water to washers or othertype of cleaners
Phase 3: Inlet Air Constraints
Boilers: (Tstack gas – Tair inlet) ↓ Efficiency ↑ Other air users: air inlet temperature ↑ steam consumption ↓ (e.g.,
Pulp Dryer of Kraft mill: 82-93oC)

145
o Non-replaceable heat source-steam heater (NRHS-SH): The upper heater of the
continuous digester in Kraft pulping is positioned in the digesting department (Fig. 7-3a)
and used to supply heat for cooking wood chips. The digester is the core of the pulping
process and maintaining the conditions of it, is crucial; therefore, the heat source (steam)
to heat up the liquor for the digester at the upper heater cannot be replaced with another
heat source in the process. This heat sink (cooking liquor) is not required to be included
in the data sheet for the HEN design.
o Replaceable heat source-steam heater (RHS-SH): The heat source (steam) for hot water
production from warm water can potentially be replaced with other heat sources available
in the process (Fig. 7-3b). The warm water (heat sink) is only represented in the data
sheet for the HEN design as shown in Fig. 7-3b.
o Feasible HEX heat sink-steam injection (FHexHS-SI): Figure 7-3c shows the hot water
tank where the steam is injected to raise the temperature of warm water and produce hot
water. Herein, warm water is regarded as a heat sink that needs to be heated up and the
steam is the heat source to supply the heat to attain the higher temperature. Warm water
(heat sink) can be directed to the heat exchanger; thus, it is a feasible HEX heat sink
(FHexHS-SI). In addition, the other available heat sources other than steam can be
employed to produce hot water. The warm water (heat sink) is only represented in the
data sheet for the HEN design as illustrated in Fig. 7-3c.
o Non-reducible heat source, non-feasible HEX heat sink, steam injection (NRHS-
NFHexHS-SI): Figure 7-3d illustrates the chip bin of the digesting department in Kraft
pulping. At the chip bin (Fig. 7-3d), steam is injected to partially remove air from chips
(Smook, 2002) and soften the wood. The heat sink is wood chips and the solid wood
cannot be introduced to the HEX, so it is a non-feasible HEX heat sink. In addition, the
steam (heat source) must be injected into the chip bin and there is no possibility for steam
reduction using the HEX network; it is a non-reducible heat source. The heat sink (wood
chips) is not required to be included in the data sheet for the HEN design.
o Reducible heat source, non-feasible HEX heat sink, steam injection (RHS-NFHexHS-SI):
In the deaerator of boiler house (Fig. 7-3e), the water (heat sink) cannot be directed to the
HEX because steam is used to remove the air, so it is a non-feasible HEX heat sink. On
the other hand, it is possible to target the higher temperature for make-up water to the

146
condensate tank to raise the temperature of water toward the deaerator. In this scheme,
the heat load is shifted from steam to make-up water and steam (heat source) injection
could be decreased at the deaerator. Make-up water as the only heat sink is required to be
included in the data sheet for the HEN design, as shown in Fig. 7-3e. Another heat sink,
steam injection to the deaerator, is not required to be included in the data sheet for the
HEN design.
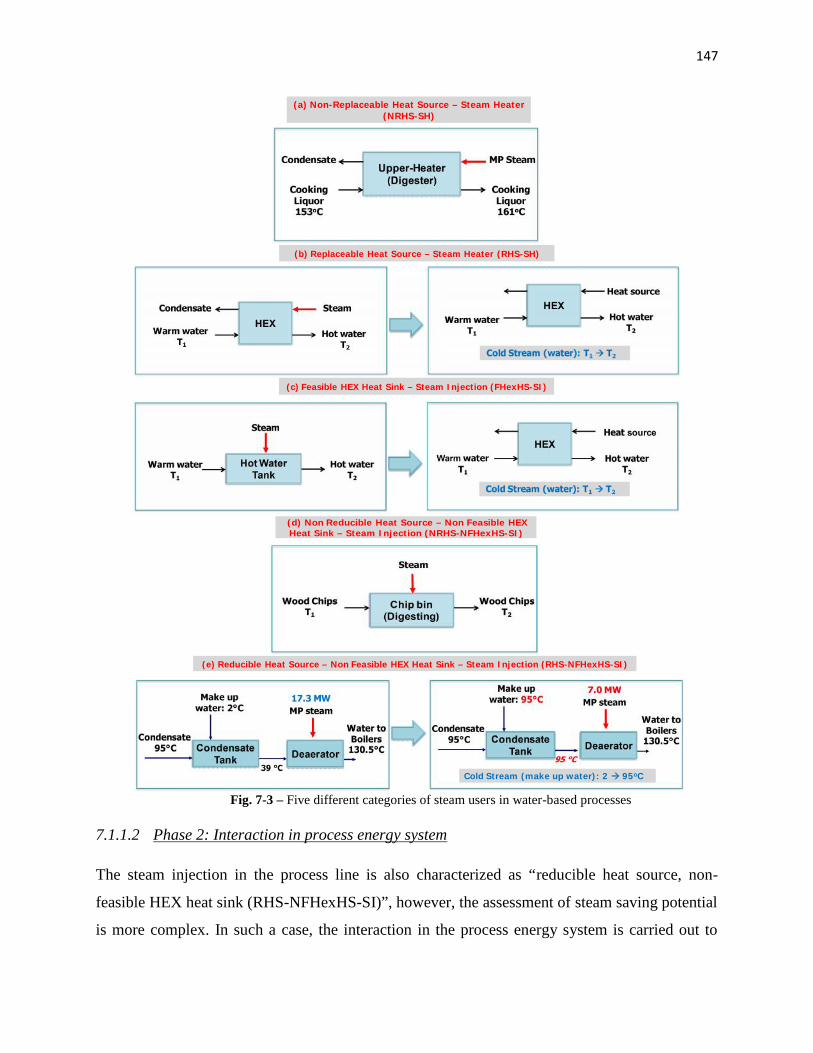
147
Fig. 7-3 – Five different categories of steam users in water-based processes
7.1.1.2 Phase 2: Interaction in process energy system
The steam injection in the process line is also characterized as “reducible heat source, non-
feasible HEX heat sink (RHS-NFHexHS-SI)”, however, the assessment of steam saving potential
is more complex. In such a case, the interaction in the process energy system is carried out to
Upper-Heater(Digester)
CookingLiquor161oC
CookingLiquor153oC
MP SteamCondensate
(a) Non-Replaceable Heat Source – Steam Heater(NRHS-SH)
HEXHot water
T2
Warm waterT1
SteamCondensate HEXHot water
T2
Warm waterT1
Heat source
Cold Stream (water): T1 T2
(b) Replaceable Heat Source – Steam Heater (RHS-SH)
Hot WaterTank
Warm waterT1
Steam
Hot waterT2
HEXHot water
T2
Warm waterT1
Heat source
Cold Stream (water): T1 T2
(c) Feasible HEX Heat Sink – Steam Injection (FHexHS-SI)
Chip bin(Digesting)
Wood ChipsT1
Steam
Wood ChipsT2
(d) Non Reducible Heat Source – Non Feasible HEXHeat Sink – Steam Injection (NRHS-NFHexHS-SI)
Water toBoilers130.5°C
Condensate95°C Condensate
Tank
Make upwater: 2°C MP steam
39 °C
17.3 MW
Deaerator
Water toBoilers130.5°C
Condensate95°C Condensate
Tank
Make upwater: 95°C MP steam
95 °C
7.0 MW
Deaerator
Cold Stream (make up water): 2 95oC
(e) Reducible Heat Source – Non Feasible HEX Heat Sink – Steam Injection (RHS-NFHexHS-SI)
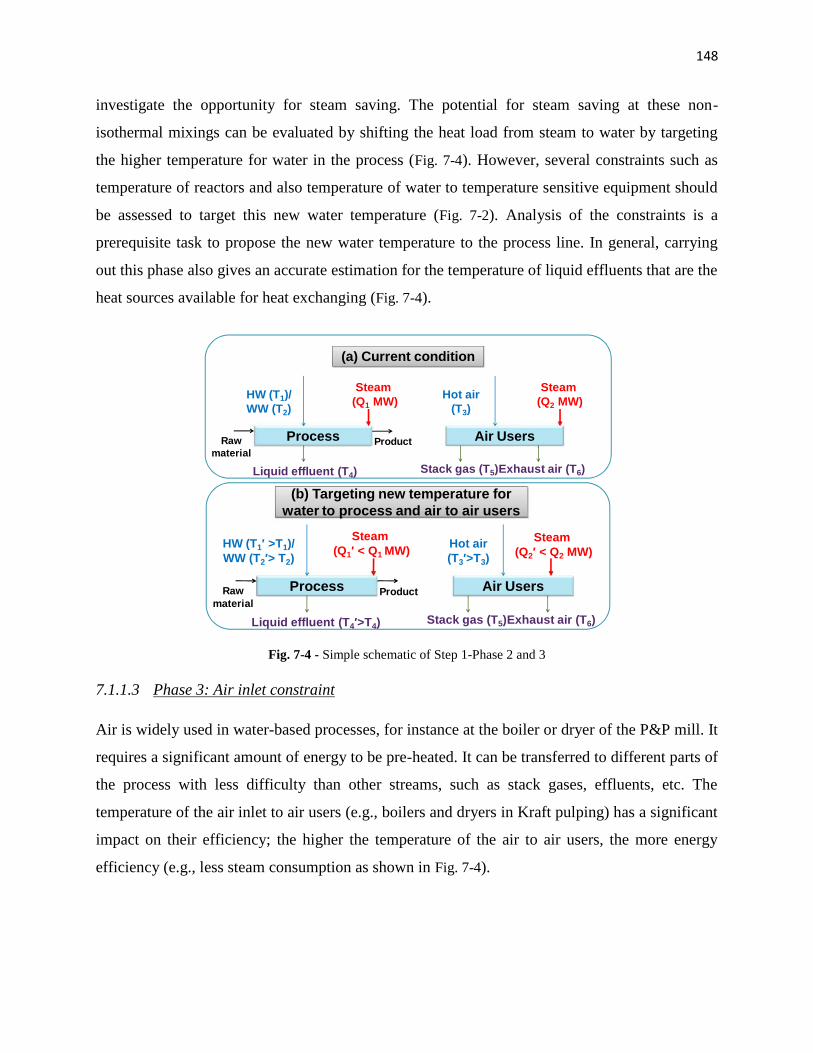
148
investigate the opportunity for steam saving. The potential for steam saving at these non-
isothermal mixings can be evaluated by shifting the heat load from steam to water by targeting
the higher temperature for water in the process (Fig. 7-4). However, several constraints such as
temperature of reactors and also temperature of water to temperature sensitive equipment should
be assessed to target this new water temperature (Fig. 7-2). Analysis of the constraints is a
prerequisite task to propose the new water temperature to the process line. In general, carrying
out this phase also gives an accurate estimation for the temperature of liquid effluents that are the
heat sources available for heat exchanging (Fig. 7-4).
Fig. 7-4 - Simple schematic of Step 1-Phase 2 and 3
7.1.1.3 Phase 3: Air inlet constraint
Air is widely used in water-based processes, for instance at the boiler or dryer of the P&P mill. It
requires a significant amount of energy to be pre-heated. It can be transferred to different parts of
the process with less difficulty than other streams, such as stack gases, effluents, etc. The
temperature of the air inlet to air users (e.g., boilers and dryers in Kraft pulping) has a significant
impact on their efficiency; the higher the temperature of the air to air users, the more energy
efficiency (e.g., less steam consumption as shown in Fig. 7-4).
Rawmaterial
Steam(Q1 MW)
Product
HW (T1)/WW (T2)
Liquid effluent (T4)
Process
(a) Current condition
Steam(Q2 MW)Hot air
(T3)
Stack gas (T5)Exhaust air (T6)
Air Users
Rawmaterial
Steam(Q1′ < Q1 MW)
Product
HW (T1′ >T1)/WW (T2′> T2)
Liquid effluent (T4′>T4)
Process
(b) Targeting new temperature forwater to process and air to air users
Steam(Q2′ < Q2 MW)
Hot air(T3′>T3)
Stack gas (T5)Exhaust air (T6)
Air Users

149
7.1.2 Step 2: Assessment of waste heat and existing HEXs
7.1.2.1 Evaluation of waste heat
The liquid and gas waste streams are the major heat sources in the process. These streams should
be analyzed carefully in order to identify the maximum potential of their available heat before
being vented into the atmosphere or sent to wastewater treatment. These streams are classified
into two categories: high and low corrosive. If the high corrosive waste stream is directed to a
HEX, its outlet temperature from HEX should be higher than if the low corrosive waste stream
one had been directed to it in order to prevent corrosion inside the HEX. Figure 7-5 illustrates
some examples of high and low corrosive streams of the Kraft process and the outlet temperature
for each of them. For instance, the stack gas outlet temperature of the recovery or hog fuel boiler
should be between 125-130oC to prevent sulfuric acid condensation in the HEX (Mostajeran
Goortani et al., 2011). On the other hand, natural gas is sulfur free and the outlet temperature of
the stack gas of the natural gas power boiler should be between 65-75oC in order to avoid water
condensation and, consequently, the carbonic acid formation. Since the exhaust air of the dryer is
not corrosive and just contains evaporated water, the outlet temperature of that from HEX can be
at a higher ∆Tmin (minimum approach temperature) than ambient temperature (here Ta=-10oC for
winter time). Since the liquid effluents are exploited to heat up liquid streams and in particular
water, the non-corrosive liquid effluents can be discharged at a higher ∆Tmin than fresh water
temperature (here TFW=2oC for winter time) while for the corrosive ones, such as acidic and
alkaline effluents, 25-30oC is proposed (Mateos-Espejel et al., 2010d, 2011c).

150
Fig. 7-5 – Two categories of waste streams; high and low corrosives (ambient temperaturein winter: Ta=-10oC, temperature of fresh water in winter: TFW=2oC, and minimum
temperature approach: ∆Tmin=10oC)
7.1.2.2 Evaluation of existing HEXs
Process stream HEXs are those HEXs that do not utilize steam. They recover the heat of waste
streams to heat up other streams, such as water, air, etc. The existing process stream HEXs are
assessed to be employed in a new design. Three different process stream HEXs are
distinguished: liquid-liquid and liquid-gas, which are mainly used to heat up water and gas-gas,
which is used to heat up air. In the new design, the area, the location, and the phases inside of
each existing HEX should be considered to minimize the changes in HEX network.
7.1.3 Step 3: HEX network design
An algorithm is developed to design the HEN and is composed of four phases (Fig. 7-6). To
explain this algorithm a simple schematic of a water-based process is used, as demonstrated in
Fig. 7-7a. In the first phase (Fig. 7-7b), the first targeting temperatures for the water used in the
process and the air in the air users (e.g., boilers, dryers, etc.), as explained in step 1, are applied
in the simulation of the process. The change in temperature of liquid effluents is also evaluated.
In phase 2 (Fig. 7-7c), the data is extracted in the excel sheet (as illustrated in Fig. 7-3 and 7-5).
The data consists of the inlet and outlet temperatures and the heat requirement of each heat sink
and the inlet temperature, acceptable outlet temperature (step 2), and the available heat at each
heat source. The heat sinks mainly include water and air streams to different unit operations
whereas all the liquid and gas effluents are involved as the heat sources.
Acidic orAlkali Eff.
Stack gas ofHog & RB
Stack gasof NG
Non-Acidic orNon-Alkali Eff.
Exhaust airof Dryer
ṁ1 , T1ṁ3 , T3ṁ2 , T2 ṁ4 , T4 ṁ5 , T5
Hot stream: (ṁ1) T1 25-30oC
Hot stream: (ṁ2) T2 125-130oC
Hot stream: (ṁ3) T3 TFW + ∆Tmin (12oC)
Hot stream: (ṁ4) T4 65-75oC
Hot stream: (ṁ5) T5 Ta + ∆Tmin (0oC)
High corrosive Low corrosive

151
Fig. 7-6 – HEX network design algorithm
In phase 3 (Fig. 7-7c), the extracted data are entered in the Aspen Energy Analyzer; however,
they could be entered in any other HEX network design software or even could be done by hand.
The minimum approach temperature (∆Tmin) for gas-gas (G-G) and gas-liquid (G-L) HEXs is
considered higher than the ∆Tmin for liquid-liquid (L-L), gas-steam (G-ST), and liquid-steam (L-
ST) HEXs. This is explained by the low heat transfer coefficient (Table 7-1) on the gas side that
results in a large HEX area. In this study, the ∆Tmin is considered 10oC for L-L, G-ST, and L-ST
(Mateos-Espejel et al., 2011c) and 15oC for G-G and G-L.
Modify targeting temperaturebased on the achievedtemperature of Phase 3
(Tn+1)
Yes
No
Phase 1: Apply Targeting Temperature on Simulation of Process(Tn)
New targeting temperatures of water to the process New targeting temperature of air inlet to air users
Phase 2: Data Extraction
Excel sheet Data required according to steps 1 and 2 of R-HEN
Phase 3: HEX Network Design
Aspen Energy Analyzer Rules to design the network
o Use only stack gas of boilers to heat water & airo Use exhaust air of air users (e.g., dryers) to heat water &
air (and white water in Kraft pulping)o Use liquid effluent to heat watero Consider distance between streams for heat exchangingo Consider the existing HEX network
Phase 4: Report the New HEX Network
New HEXs Enlarged existing HEXs
Are there enough heat sources for thenew targeted heat sinks (new targeting
temperature)?
152
The HEN is designed based on practical rules that offer direct guidelines to choose the
connections between hot and cold streams. These rules are presented as follows:
Rule 1: Use only the stack gas of boilers to heat up water and air. This rule represents
the typical air and water economizers at the boilers.
Rule 2: Use only the exhaust air of air users (e.g., dryers of Kraft pulping) to heat up
water and air (and white water in Kraft pulping). This rule shows the typical air, water,
(and white water) economizers at the air users (e.g., dryers).
Rule 3: Use liquid effluent to mainly heat up water. This rule expresses the typical
water-liquid effluent HEXs. It also suggests avoiding from the proposal of fin HEXs
(e.g., radiator) for pre-heating the air as much as possible.
Rule 4: Consider the distance between streams for heat exchanging. The best way to do
this is to use the map of the plant or mill to avoid extensive piping to transfer one
stream from one side of the process to the other. This means that the local heat recovery
should be considered first.
Rule 5: Consider the existing HEX network. This leads to minor adjustments in the
existing HEN. It also helps to employ the existing HEXs effectively. Therefore, the total
number of HEXs that should be purchased is minimized.
The first targeting temperatures require greater heat demand compared to current conditions.
After the HEX network design (Fig. 7-7c), it should be explored whether there is enough heat
available for the new heat requirements (first targeting temperature) or not. If the heat available
from the heat sources is not sufficient to supply the heat for heat sinks and achieve the first
targeting temperature, the targeting temperature should be modified. For this reason, the
designed HEX network of phase 3 (Fig. 7-7c) is used to determine the second targeting
temperature (Fig. 7-7d). The temperature obtained for water and air sinks after applying phase 3
(Fig. 7-7c) would be the second targeting temperature for the second trial.

153
Fig. 7-7 - Simple schematic of a water-based process in (a) current condition with process line, air users, water andair networks, (b) Step 3-Phase 1 of first trial, (c) Step3 – Phase 2 & 3 of first trial, (d) Step 3-Phase 1 of second trial,
(c) Step3 – Phase 2 & 3 of second trial, (e) final changes
Rawmaterial
Steam(Q1 MW)
Product
FW(TFW)
HW (T1)/WW (T2)
Liquid effluent (T4)
Process
(a) Current
Hot / warm Water Tank
HX 1
HX 2
HX 3
SteamHX 5 (Q3)
HX 4
Wat
erN
etw
ork
Steam(Q2 MW)Hot air
(T3)
Stack gas (T5)
HX 6
HX 7
HX 8
SteamHX 10(Q4)
HX 9
AIR
Net
wor
k
Fresh air(TAIR)
Exhaust air (T6)
Air Users
Rawmaterial
Steam(Q1′ < Q1 MW)
Product
HW (T1′ >T1)/WW (T2′> T2)
Liquid effluent (T4′>T4)
Process
(b) 1st Targeting Temperature forwater to process and air to air users
Steam(Q2′ < Q2 MW)
Hot air(T3′>T3)
Stack gas (T5)Exhaust air (T6)
Air Users
Stack gasExhaust air
Effluent
Hot airWWHW
T6T5
T3′
T4′
T2′T1′
Tout6Tout5Tout4
TAIRTFWTFW
T3″T2″T1″
(c) 1st HEN based on1st Targeting Temperature
Rawmaterial
Steam(Q1″< Q1 MW)
Product
HW (T1″ >T1)/WW (T2″> T2)
Liquid effluent (T4″>T4)
Process
(d) 2nd Targeting Temperature forwater to process and air to air users
Steam(Q2″ < Q2 MW)
Hot air(T3″>T3)
Stack gas (T5)Exhaust air (T6)
Air Users
Stack gasExhaust air
Effluent
Hot airWWHW
T6T5T4″
Tout6Tout5Tout4
TAIRTFWTFW
T3″T2″T1″
(e) 2nd HEN based on2nd Targeting Temperature
Rawmaterial
Product
FW(TFW)
Process
(f) Final
Hot / warm Water Tank
HX 1
HX 2
HX 3
HX11
HX 4
Fina
l Wat
erN
etw
ork
Stack gas (T5)
HX 6
HX 7
HX 8
Steam HX 10(Q4″< Q4 MW)
HX 9
Fina
l AIR
Net
wor
k
Fresh air(TAIR)
Exhaust air (T6)
Air Users
Steam(Q1″< Q1 MW)HW (T1″ >T1)/
WW (T2″> T2)
Liquid effluent (T4″>T4)
Steam(Q2″ < Q2 MW)
Hot air(T3″>T3)
HX 12

154
The second targeting temperature of water and air (Fig. 7-7d) are applied in the simulation of the
process to update the temperature of liquid effluents (phase 1). These temperatures are also
updated in the excel data sheet (phase 2) and, consequently, in the Aspen Energy Analyzer
(phase 3), as shown in Fig. 7-7e. The designed HEX network from the first trail is redesigned
with the minor changes (Fig. 7-7e). This procedure should be continued until the available heat
from heat sources provides enough heat for the heat sinks (Fig. 7-7e). However, it should be
noted that in this work two trails have always been sufficient to generate a feasible solution.
Finally, the new network is generated and reported, including the new HEXs that should be
purchased and the existing HEXs that should be enlarged (Fig. 7-7f).
7.1.3.1 Steam saving
The steam consumption is calculated for “replaceable heat source – steam heaters (RHS-SH),”
“feasible HEX heat sink- steam injection (FHEXHS-SI),” and “reducible heat source-non
feasible HEX heat sink-steam injection (RHS-NFHEXHS-SI)” to calculate the total steam
saving.
7.1.3.2 Area of HEX
The area (A) of existing and final HEXs is computed as follows:
= [1]
where Q, U, LMTD denote the heat exchanged, overall heat transfer coefficient, and logarithmic
mean temperature difference for the countercurrent flow.
The overall heat transfer coefficients for different two-side state HEXs are collected
(EngineeringPage, 2013; ToolBox, 2013) and presented in Table 7-1. For the HEXs with a range
of overall heat transfer coefficients (e.g., liquid-liquid), the area is computed with the lower and
upper bounds and the average is calculated.
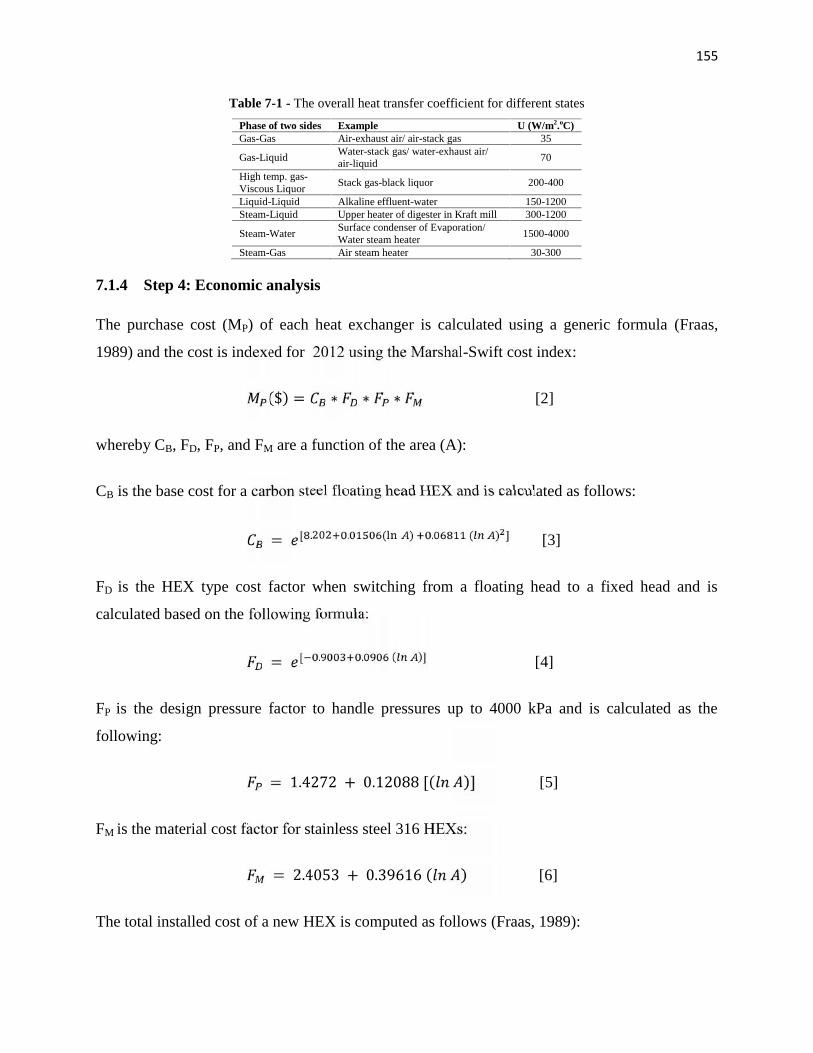
155
Table 7-1 - The overall heat transfer coefficient for different states
Phase of two sides Example U (W/m2.oC)Gas-Gas Air-exhaust air/ air-stack gas 35
Gas-LiquidWater-stack gas/ water-exhaust air/air-liquid
70
High temp. gas-Viscous Liquor
Stack gas-black liquor 200-400
Liquid-Liquid Alkaline effluent-water 150-1200Steam-Liquid Upper heater of digester in Kraft mill 300-1200
Steam-WaterSurface condenser of Evaporation/Water steam heater
1500-4000
Steam-Gas Air steam heater 30-300
7.1.4 Step 4: Economic analysis
The purchase cost (MP) of each heat exchanger is calculated using a generic formula (Fraas,
1989) and the cost is indexed for 2012 using the Marshal-Swift cost index:
($) = ∗ ∗ ∗ [2]
whereby CB, FD, FP, and FM are a function of the area (A):
CB is the base cost for a carbon steel floating head HEX and is calculated as follows:
= [ . . ( ) . ( ) ] [3]
FD is the HEX type cost factor when switching from a floating head to a fixed head and is
calculated based on the following formula:
= [ . . ( )] [4]
FP is the design pressure factor to handle pressures up to 4000 kPa and is calculated as the
following:
= 1.4272 + 0.12088 [( )] [5]
FM is the material cost factor for stainless steel 316 HEXs:
= 2.4053 + 0.39616 ( ) [6]
The total installed cost of a new HEX is computed as follows (Fraas, 1989):

156
($) = 1.31 × [7]
The operating cost for the HEXs involves two components of maintenance and repair and also
operating supplies. The maintenance and repair annually accounts for 2% of total installed cost
of the HEX while this value for operating supplies is 0.5% annually (Peters et al., 2002).
7.2 Result
The result of applying the R-HEN on the mill C is presented below.
7.2.1 Step 1: Identification of saving potential
In the phase 1 of this step, steam users are categories and presented in the second column of
Table 7-3.
7.2.1.1 Phase 2: Interaction in process energy system
An example of steam injections in the pulp line of the case study is used to clarify the interaction
in process energy system (Fig. 7-8). Figures 7-8a and b display a part of the bleaching
department in the Kraft mill. Pulp is washed out in washer #5, bleached in D0 reactor using
added chemicals, washed in D0 washer, and heated up in Eop steam mixer (Fig. 7-8a).
There are three steam injection points in this example:
at washer #5 to maintain the temperature of D0 reactor at 38oC,
at D0 washer to raise the temperature of pulp to 49oC,
and at Eop steam mixer to attain 95oC for Eop reactor.

157
Fig. 7-8 – Example of interaction in the process energy system (WW: warm water, HW: hot water)
The pulp as heat sink cannot be directed to the HEX; it is a non-feasible HEX heat sink.
However, it is possible to reduce the steam consumption. The heat load can be shifted from
steam to water by targeting the higher temperature for water in the process. To evaluate the
potential of steam saving, the current temperature of water to these pieces of equipment is
relaxed. If the temperatures of warm water (WW) 44 and 36oC rise to 85oC, the steam injection
at washer #5 and D0-washer could be completely eliminated while the steam consumption at Eop
steam mixer can potentially decrease from 5.0 to 2.9 MW (Fig. 7-8b). Therefore, the potential of
steam saving at these three steam injection points is 4.0 MW.
There are several constraints in pulp line that should be respected when the rise in water
temperature is proposed. For instance, the first constraint of the current example is the
temperature of the D0 reactor, which should always be in the acceptable range and must not go
beyond the acceptable temperature. The second constraint is the temperature of water to the
washer, which should not be more than the acceptable temperature of water to this type of
washers. In Fig. 7-8, the acceptable temperature of D0 is between 20-80oC (Brogdon and Bell,
Steam
D0 WasherD038oC
Pulp
49oC 95oC
5.0 MWWW
ṁ1 , 44oC
Filtrate tank -D0 washer ṁ5 , Acidic
Effluent50oC
PulpWasher #5
Filtrate tank –washer #5
46oC48oC
47oC
Chemicals
50oC
WWṁ2 , 36oC
67oCEop filtrate
50oCD1 filtrate
WWṁ3 , 44oCSteam
0.2 MWWW
ṁ4 , 44oCSteam
1.7 MW
(a) Current condition
Cold Stream (Water to process): 2 44oC
Hot Stream (acidic effluent): 50 25oC
Cold Stream (Water to process): 2 36oC
Eop steammixer
Steam
D0 WasherD064oC
Pulp
67oC 95oC
2.9 MWHW
ṁ1 , 85oC
Filtrate tank -D0 washer ṁ5 , Acidic
Effluent69oC
PulpWasher #5
Filtrate tank –washer #5
79oC66oC
70oC
Chemicals
69oC
HWṁ2 , 85oC
67oCEop filtrate
53oCD1 filtrate
HWṁ3 , 85oC HW
ṁ4 , 85oC
(b) Targeting newtemperature
Cold Stream (Water to process): 2 85oC
Hot Stream (acidic effluent): 69 25oC
Eop steammixer
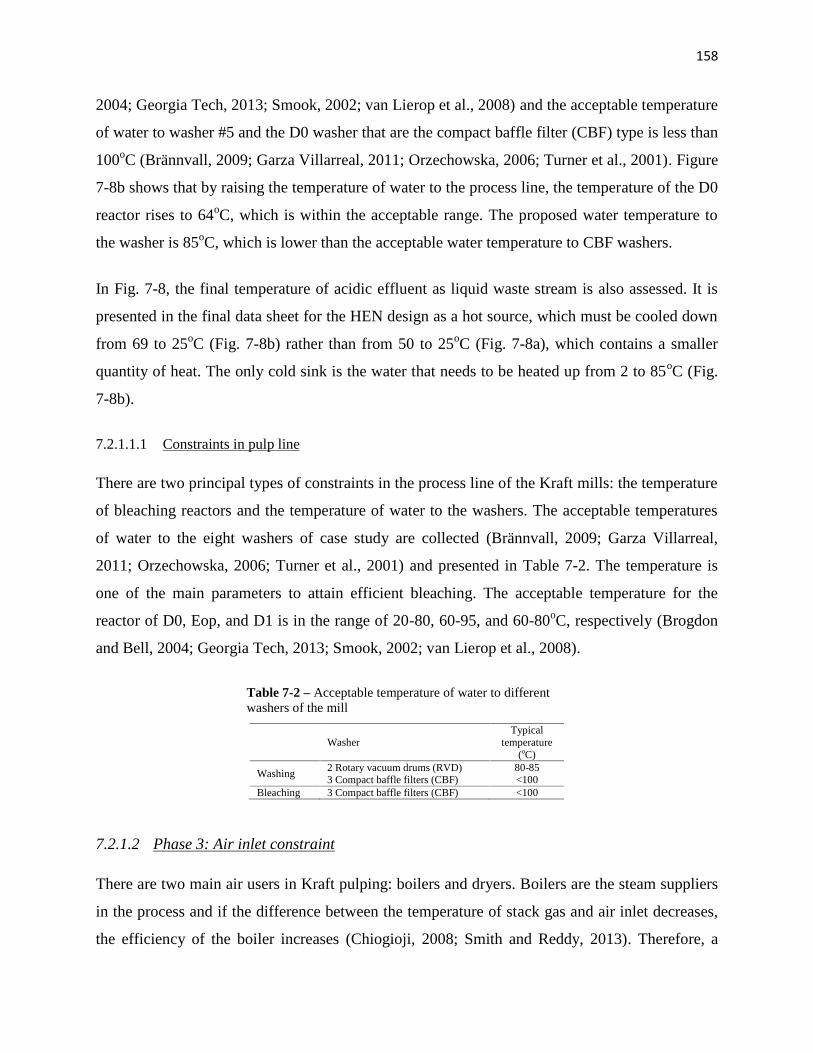
158
2004; Georgia Tech, 2013; Smook, 2002; van Lierop et al., 2008) and the acceptable temperature
of water to washer #5 and the D0 washer that are the compact baffle filter (CBF) type is less than
100oC (Brännvall, 2009; Garza Villarreal, 2011; Orzechowska, 2006; Turner et al., 2001). Figure
7-8b shows that by raising the temperature of water to the process line, the temperature of the D0
reactor rises to 64oC, which is within the acceptable range. The proposed water temperature to
the washer is 85oC, which is lower than the acceptable water temperature to CBF washers.
In Fig. 7-8, the final temperature of acidic effluent as liquid waste stream is also assessed. It is
presented in the final data sheet for the HEN design as a hot source, which must be cooled down
from 69 to 25oC (Fig. 7-8b) rather than from 50 to 25oC (Fig. 7-8a), which contains a smaller
quantity of heat. The only cold sink is the water that needs to be heated up from 2 to 85oC (Fig.
7-8b).
7.2.1.1.1 Constraints in pulp line
There are two principal types of constraints in the process line of the Kraft mills: the temperature
of bleaching reactors and the temperature of water to the washers. The acceptable temperatures
of water to the eight washers of case study are collected (Brännvall, 2009; Garza Villarreal,
2011; Orzechowska, 2006; Turner et al., 2001) and presented in Table 7-2. The temperature is
one of the main parameters to attain efficient bleaching. The acceptable temperature for the
reactor of D0, Eop, and D1 is in the range of 20-80, 60-95, and 60-80oC, respectively (Brogdon
and Bell, 2004; Georgia Tech, 2013; Smook, 2002; van Lierop et al., 2008).
Table 7-2 – Acceptable temperature of water to differentwashers of the mill
WasherTypical
temperature(oC)
Washing2 Rotary vacuum drums (RVD) 80-853 Compact baffle filters (CBF) <100
Bleaching 3 Compact baffle filters (CBF) <100
7.2.1.2 Phase 3: Air inlet constraint
There are two main air users in Kraft pulping: boilers and dryers. Boilers are the steam suppliers
in the process and if the difference between the temperature of stack gas and air inlet decreases,
the efficiency of the boiler increases (Chiogioji, 2008; Smith and Reddy, 2013). Therefore, a

159
certain amount of fuel consumption results in greater steam production or a certain amount of
steam requirement consumes a lower amount of fuel (Fig. 7-9a). A sensitivity analysis on the
effect of the air inlet temperature on the recovery boiler of the case study is conducted. Figure 7-
9a displays the effect of the air inlet on the recovery boiler of a Kraft mill. If the temperature of
the air inlet is low compared to the stack, a new air inlet temperature is targeted and represented
as the final temperature of the cold stream in the data sheet for the HEN design (Fig. 7-9b). In
Fig. 7-9b, if the air inlet temperature rises to 170oC, which requires 2.5 MW of extra heat, the
steam generation increases by 2.0 MW due to some heat loss in the boiler. This extra heat
requirement (2.5 MW) can be supplied by recovering the heat of the waste stream to produce air
at a higher temperature, which can then be transformed to valuable live steam generation (2.0
MW) at the boiler. The air temperature of 170oC is given as an example and could be targeted as
high as can be tolerated for the specific boiler.
Fig. 7-9 – (a) the effect of air inlet temperature to boiler, (b) targeting new air inlettemperature to boiler
The ideal range of the air inlet temperature to the dryer is between 82-93oC (Hill and Chaloux,
2012). A sensitivity analysis of air inlet temperature in the process simulation is conducted to
assess the impact on steam consumption. Figure 7-10a demonstrates this impact. Results show
that the higher the air inlet temperature to the dryer, the lower the steam requirement for drying.
2.4
2.8
3.2
3.6
34
38
42
46
50
0 100 200 300 400 500
Stea
m p
rodu
ctio
n (M
W)
Inlet air T (oC)
Fuel
con
sum
ptio
n (G
J/G
J)a
170oC80oC
Air
Steam38.1 MW
BoilerAir
Steam40.1 MW
Cold Stream (air): -10 80oC Cold Stream (air): -10 170oC
480oC
Stack gasBoiler
480oC
Stack gasb
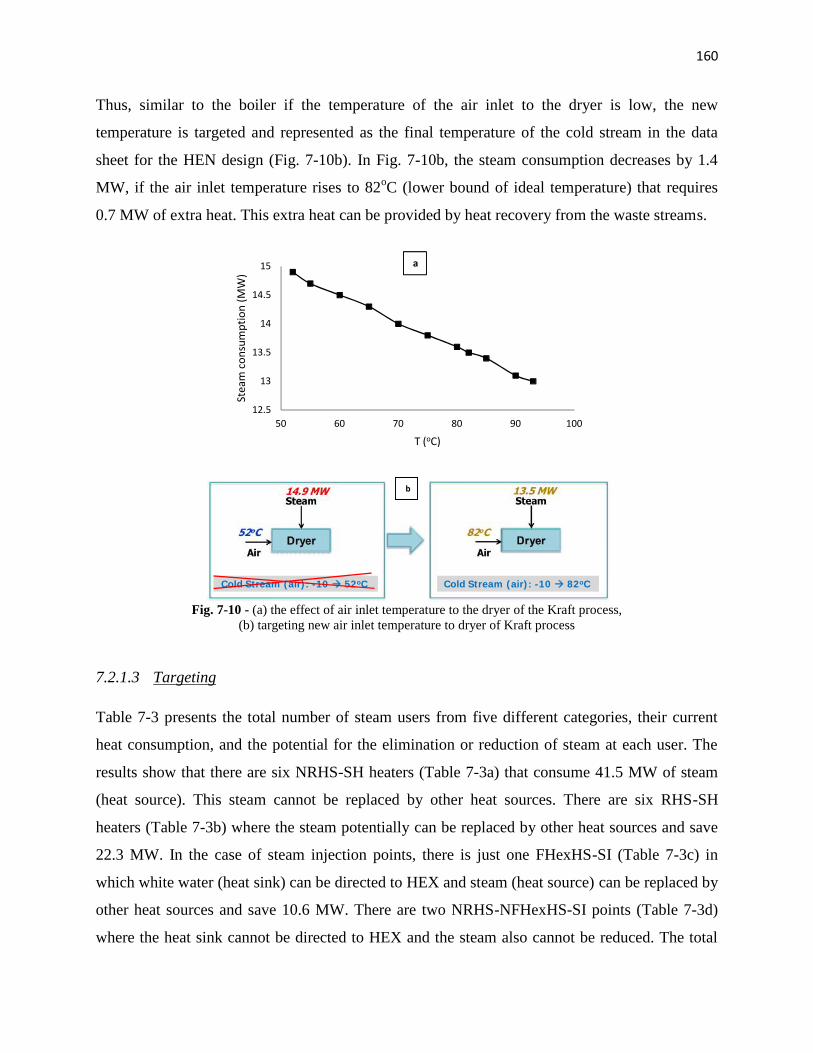
160
Thus, similar to the boiler if the temperature of the air inlet to the dryer is low, the new
temperature is targeted and represented as the final temperature of the cold stream in the data
sheet for the HEN design (Fig. 7-10b). In Fig. 7-10b, the steam consumption decreases by 1.4
MW, if the air inlet temperature rises to 82oC (lower bound of ideal temperature) that requires
0.7 MW of extra heat. This extra heat can be provided by heat recovery from the waste streams.
Fig. 7-10 - (a) the effect of air inlet temperature to the dryer of the Kraft process,(b) targeting new air inlet temperature to dryer of Kraft process
7.2.1.3 Targeting
Table 7-3 presents the total number of steam users from five different categories, their current
heat consumption, and the potential for the elimination or reduction of steam at each user. The
results show that there are six NRHS-SH heaters (Table 7-3a) that consume 41.5 MW of steam
(heat source). This steam cannot be replaced by other heat sources. There are six RHS-SH
heaters (Table 7-3b) where the steam potentially can be replaced by other heat sources and save
22.3 MW. In the case of steam injection points, there is just one FHexHS-SI (Table 7-3c) in
which white water (heat sink) can be directed to HEX and steam (heat source) can be replaced by
other heat sources and save 10.6 MW. There are two NRHS-NFHexHS-SI points (Table 7-3d)
where the heat sink cannot be directed to HEX and the steam also cannot be reduced. The total
12.5
13
13.5
14
14.5
15
50 60 70 80 90 100
Stea
m c
onsu
mpt
ion
(MW
)
T (oC)
a
DryerAir
Steam
82oC
13.5 MW
DryerAir
Steam
52oC
14.9 MW
Cold Stream (air): -10 52oC Cold Stream (air): -10 82oC
b

161
number of RHS-NFHexHS-SI points where the heat sinks cannot be introduced to HEXs but the
steam can be reduced are five and the steam can potentially be diminished from 26 to 10.3 MW
(Table 7-3e). For the case study, the air inlet temperature to the dryers and boilers is high enough
and, therefore, there is no necessity to target a new temperature for the air inlets.
Table 7-3 – The potential for steam reduction and final steam consumptionafter the HEX network design for all steam users of the mill
# EquipmentCurrent(MW)
Potential(MW)
Final afterHEX networkdesign (MW)
(a) Non-Replaceable Heat Source-Steam Heater (NRHS-SH)1 Upper heater – Digesting 3.8 3.8 3.82 Lower heater – Digesting 2.2 2.2 2.23 NaClO3 heater #1 &2 – Chem. Prep. 0.1 0.1 0.14 Chemical reboiler – Chem. Prep. 1.6 1.6 1.65 Dryer – PM 24.0 24.0 24.06 Evaporation 9.8 9.8 9.8Total NRHS-SH 41.5 41.5 41.5
(b) Replaceable Heat Source – Steam Heater (RHS-SH)1 Glycool loop – PM 7.6 0 02 Air heater - PM 4.6 0 3.03 Green liquor heater – Recaust. 1.1 0 04 Air heater – RB 6.8 0 3.05 Air heater – PB#3 1.9 0 06 Water heater – Chem. Prep. 0.3 0 0Total RHS- SH 22.3 0 6.0
(c) Feasible HEX Heat Sink – Steam Injection (FHexHS-SI)1 Silo cheat - PM 10.6 0 0Total FHexHS-SI 10.6 0 0
(d)Non-Reducible Heat Source– Non-Feasible HEX Heat Sink – Steam Injection(NRHS-NFHexHS-SI)
1 Chip bin – Digesting 5.4 5.4 5.42 Steaming vessel – Digesting 6.1 6.1 6.1Total NRHS-NFHexHS-SI 11.5 11.5 11.5(e)Reducible Heat Source– Non-Feasible HEX Heat Sink – Steam Injection (RHS-
NFHexHS-SI)1 Pre-D0 washer – Bleaching 0.2 0 02 D0 washer – Bleaching 1.7 0 03 Eop – Bleaching 5.0 2.9 4.2
4WW production at steam ejectorcondenser – Chem. Prep.
1.8 0.3 0.3
5 Deaerator – Steam plant 17.3 7.0 6.3Total NRHS-NFHexHS-SI 26.0 10.3 10.8
Table 7-4 presents the aggregate results of the theoretical minimum steam requirement
(TMinSR) and theoretical maximum steam saving (TMaxSS) for all five categories as well as the
complete mill. The results suggest that 43% of current steam consumption can potentially be
saved while at least 57% of current steam consumption is necessary and should be used at
current steam users.

162
Table 7-4 – Targeting and final steam savings by means of R-HEN
# Type of steam userCurrent(MW)
TMinSR*(MW)
Final SRafter HEN
design (MW)
TMaxSS†(MW)
Final SSafter HEN
design (MW)1 Steam
heaterNRHS-SH 41.5 41.5 41.5 0 0
2 RHS-SH 22.3 0 6.0 22.3 16.33
Steaminjection
FHexHS-SI 10.6 0 0 10.6 10.64 NRHS-NFHexHS-SI 11.5 11.5 11.5 0 05 RHS-NFHexHS-SI 26.0 10.3 10.8 15.7 16.1Total (MW) 111.9 63.3 69.8 48.6 42.1Percentage over current consumption - 57% 62% 43% 38%*TMinSR: Theoretical Minimum Steam Requirement†TMaxSS: Theoretical Maximum Steam Saving
7.2.2 Step 2: Assessment of waste heat and existing HEXs
7.2.2.1 Evaluation of waste heat
There are 12 waste streams currently used to preheat air or water. There are also 16 other waste
streams that can be included in the data sheet for the HEN design. All the waste streams and their
inlet and outlet temperatures are presented in Table 7-7. The mixed Cp of stack gas is 1.25
kJ/kg.oC (Mateos-Espejel et al., 2011c).
7.2.2.1.1 Heat recovery of exhaust air
The exhaust air of the dryer is the biggest heat source in P&P that can be recovered, because
almost all the energy of steam, which is utilized in the dryer, is transferred to the exhaust air.
However, the exhaust air contains a significant amount of evaporated water and its heat capacity
has strong non-linearity with temperature change. The data that have been published by
(Söderman and Pettersson, 2003) for the heat intervals of exhaust air at varying degrees of
humidity and different temperature intervals are employed to develop a thermodynamic table for
mixed Cp of exhaust air. Table 7-5 presents the mixed Cp of exhaust air at different levels of
humidity and temperature intervals. Figure 7-11 demonstrates the non-linearity behavior of
mixed Cp from Table 7-5. The graphs for three different humidity levels indicate that by
reducing the temperature, at first, the mixed Cp is constant until a sudden rise due to vapor
condensation. Then, by a reduction in temperature, the mixed Cp decreases again. In addition, at
lower humidity, the sudden rise in mixed Cp takes places at a lower temperature and this can be
explained by the Mollieir chart of condensation. Vapor starts to condense out of the air at a lower
temperature than the dew point. This table and graph could be used to quantify the available heat
in exhaust air.

163
Table 7-5 – Mixed Cp for exhaust air of dryer at differentlevels of humidity and temperature intervals (informationextracted from work of (Söderman and Pettersson, 2003))
Mixed Cp (kJ/kg.oC)Exhaust air Humidity(kg water /kg dried air)
0.114 0.141 0.156
Tem
pera
ture
inte
rval
(o C
)
0-10 0 0 010-20. 2.57 2.73 2.7220-30 3.81 4.05 4.0330-34 5.07 5.39 5.3734-38 6.06 6.44 6.4138-42 7.28 7.75 7.742-46 8.8 9.36 9.3146-50 10.7 11.39 11.32
50-54 10.44 13.97 13.8954-58 1.1 15.97 17.258-62 1.1 1.24 6.8362-66 1.1 1.24 1.2566-70 1.1 1.24 1.2570-80 1.1 0.98 1.180-90 0.94
Fig. 7-11 – Mixed Cp of exhaust air of dryer versus temperature at different levelsof humidity (information extracted from work of (Söderman and Pettersson, 2003))
The mixed Cp of exhaust air of dryer of the case study can be calculated by the extrapolation of
Table 7-5. The humidity of the exhaust air of the dryer is 0.110 kg water/ kg dried air and the
mixed Cp for different temperature intervals is presented in Table 7-6.
Table 7-6 – Mixed Cp of 0.110 kg water/ kg dried air humidity of dryer exhaust air of the mill at differenttemperature intervals
T interval(oC)
0-10
10-20
20-30
30-34
34-38
38-42
42-46
46-50
50-54
54-58
58-62
62-66
66-70
70-75
Mixed Cp(kJ/kg.oC)
0 2.55 3.78 5.02 6.00 7.21 8.72 10.60 9.93 1.08 1.08 1.08 1.08 1.08
0
3
6
9
12
15
18
0 20 40 60 80 100
Mix
ed C
p (k
J/kg
.o C)
T (oC)
0.1140.1410.156

164
7.2.2.2 Assessment of existing HEXs
There are three types of existing process stream HEXs in this mill: liquid-liquid (L-L), gas-liquid
(G-L), and gas-gas (G-G).
L-L HEXs are mainly employed to heat up water by recovering the heat of some waste streams
or cool down some streams.
One Eop exchanger to recover the heat of alkaline effluent at stage Eop of the bleaching
section and produces warm water (Fig. 7-15a).
Four blowdown exchangers to recover the heat of blowdown water of boilers and raise
the temperature of boilers’ feed water.
One chemical cooler in the chemical preparation section to cool down the produced
chemicals using fresh water (Fig. 7-15a).
The mill also utilizes 10 G-L HEXs and similar to the L-L HEXs, they are used to cool down
some waste streams using water and recover the heat to produce hot and warm water.
Three existing water economizers (Fig. 7-15a)
o One at the wet scrubber to exploit the heat of the recovery boiler stack gas and
produce warm water.
o Two at the dryer of the paper machine to recover the heat of exhaust air of the
dryer and produce warm water.
Four surface condensers (Fig. 7-15a)
o Three at the digesting department (surface condenser-digesting, chip bin surface
condenser, and non-condensable gas surface condenser) to condensate the non-
clean steam of the chip bin, steaming vessel, and black liquor flash tanks and
produce warm or hot water.
o One at the evaporation (surface condenser-evaporation) to similarly condensate
the non-clean steam from the last train of evaporators and produce warm water.
There is also one HEX at the paper machine (HEX of clean flashed steam-PM) to
condense the clean flashed steam of the dryer and preheat water (Fig. 7-15a).
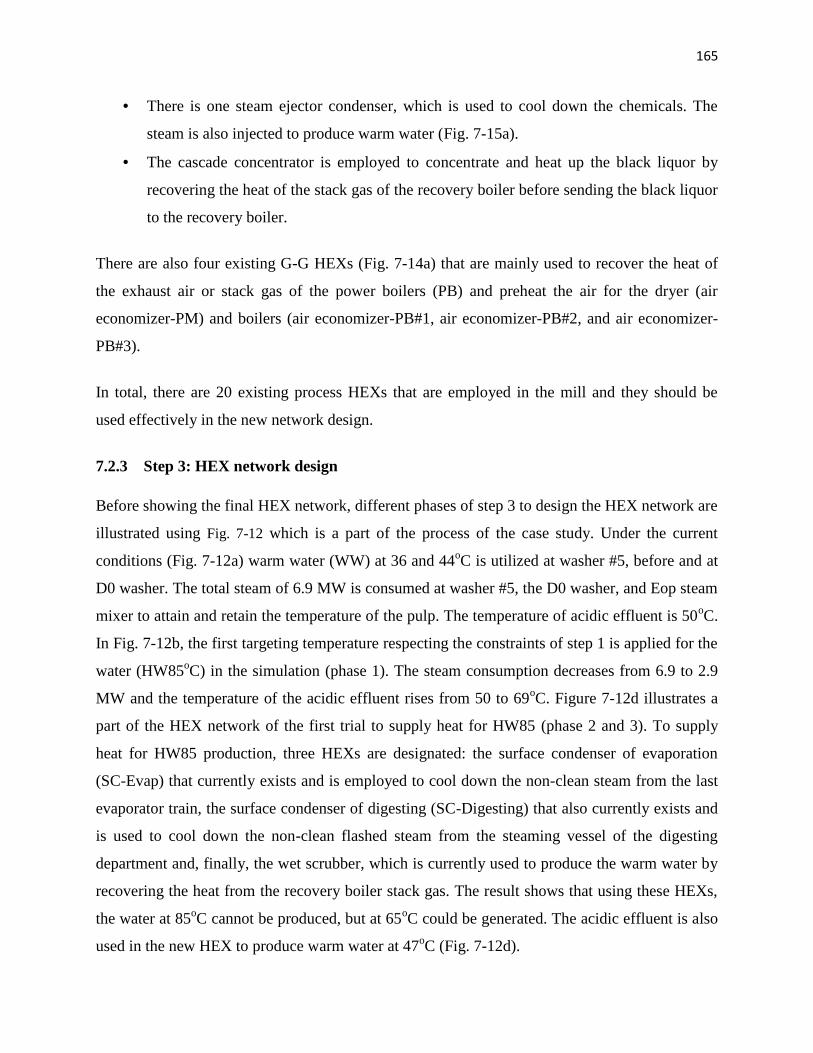
165
There is one steam ejector condenser, which is used to cool down the chemicals. The
steam is also injected to produce warm water (Fig. 7-15a).
The cascade concentrator is employed to concentrate and heat up the black liquor by
recovering the heat of the stack gas of the recovery boiler before sending the black liquor
to the recovery boiler.
There are also four existing G-G HEXs (Fig. 7-14a) that are mainly used to recover the heat of
the exhaust air or stack gas of the power boilers (PB) and preheat the air for the dryer (air
economizer-PM) and boilers (air economizer-PB#1, air economizer-PB#2, and air economizer-
PB#3).
In total, there are 20 existing process HEXs that are employed in the mill and they should be
used effectively in the new network design.
7.2.3 Step 3: HEX network design
Before showing the final HEX network, different phases of step 3 to design the HEX network are
illustrated using Fig. 7-12 which is a part of the process of the case study. Under the current
conditions (Fig. 7-12a) warm water (WW) at 36 and 44oC is utilized at washer #5, before and at
D0 washer. The total steam of 6.9 MW is consumed at washer #5, the D0 washer, and Eop steam
mixer to attain and retain the temperature of the pulp. The temperature of acidic effluent is 50oC.
In Fig. 7-12b, the first targeting temperature respecting the constraints of step 1 is applied for the
water (HW85oC) in the simulation (phase 1). The steam consumption decreases from 6.9 to 2.9
MW and the temperature of the acidic effluent rises from 50 to 69oC. Figure 7-12d illustrates a
part of the HEX network of the first trial to supply heat for HW85 (phase 2 and 3). To supply
heat for HW85 production, three HEXs are designated: the surface condenser of evaporation
(SC-Evap) that currently exists and is employed to cool down the non-clean steam from the last
evaporator train, the surface condenser of digesting (SC-Digesting) that also currently exists and
is used to cool down the non-clean flashed steam from the steaming vessel of the digesting
department and, finally, the wet scrubber, which is currently used to produce the warm water by
recovering the heat from the recovery boiler stack gas. The result shows that using these HEXs,
the water at 85oC cannot be produced, but at 65oC could be generated. The acidic effluent is also
used in the new HEX to produce warm water at 47oC (Fig. 7-12d).
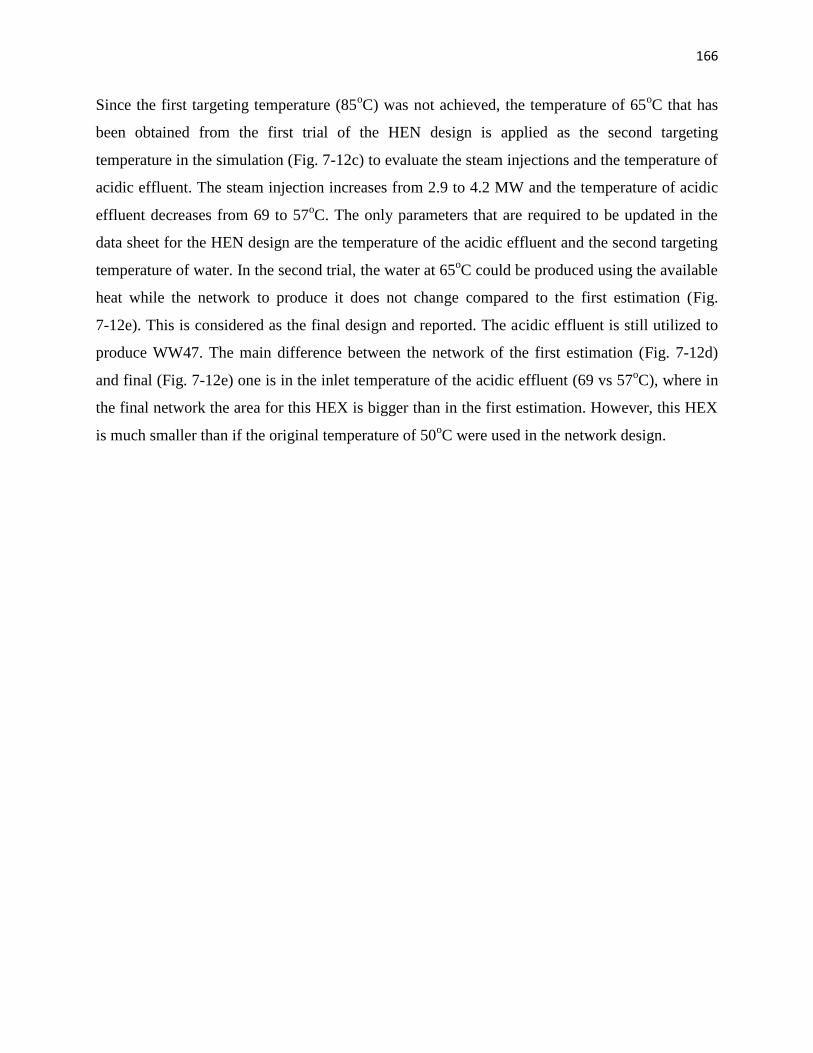
166
Since the first targeting temperature (85oC) was not achieved, the temperature of 65oC that has
been obtained from the first trial of the HEN design is applied as the second targeting
temperature in the simulation (Fig. 7-12c) to evaluate the steam injections and the temperature of
acidic effluent. The steam injection increases from 2.9 to 4.2 MW and the temperature of acidic
effluent decreases from 69 to 57oC. The only parameters that are required to be updated in the
data sheet for the HEN design are the temperature of the acidic effluent and the second targeting
temperature of water. In the second trial, the water at 65oC could be produced using the available
heat while the network to produce it does not change compared to the first estimation (Fig.
7-12e). This is considered as the final design and reported. The acidic effluent is still utilized to
produce WW47. The main difference between the network of the first estimation (Fig. 7-12d)
and final (Fig. 7-12e) one is in the inlet temperature of the acidic effluent (69 vs 57oC), where in
the final network the area for this HEX is bigger than in the first estimation. However, this HEX
is much smaller than if the original temperature of 50oC were used in the network design.
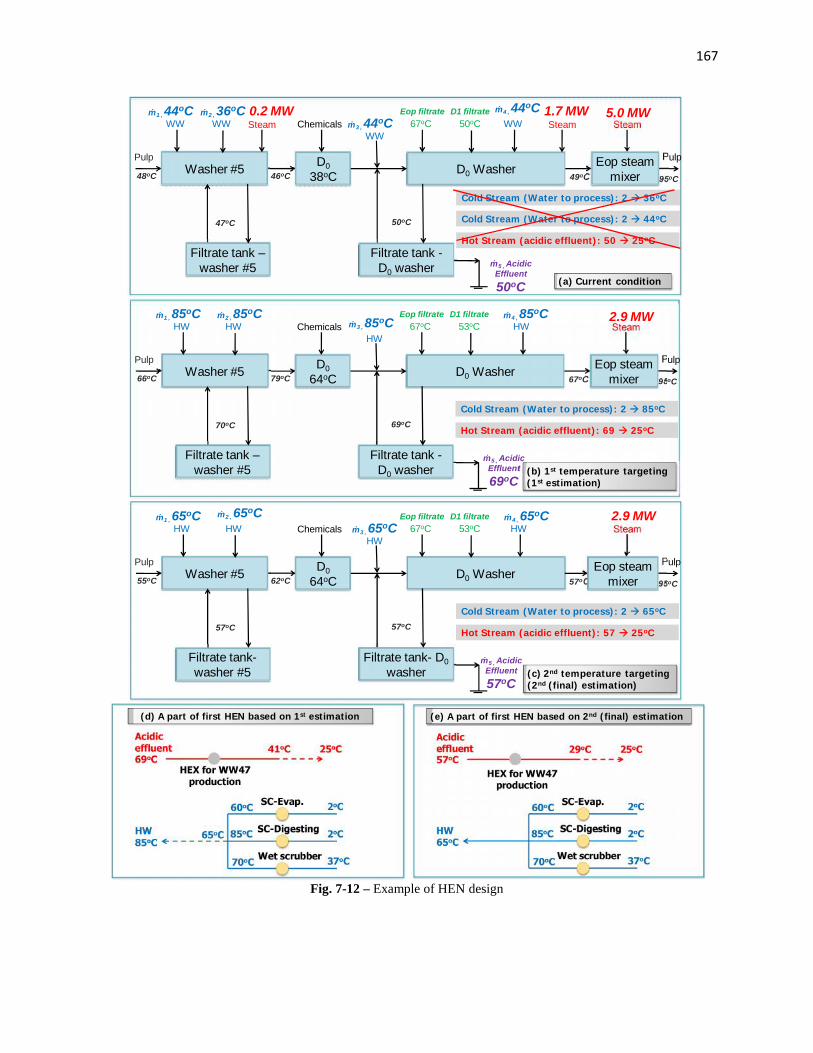
167
Fig. 7-12 – Example of HEN design
Steam
D0 WasherD038oC
Pulp
49oC 95oC
5.0 MWWW
ṁ1 , 44oC
Filtrate tank -D0 washer ṁ5 , Acidic
Effluent50oC
PulpWasher #5
Filtrate tank –washer #5
46oC48oC
47oC
Chemicals
50oC
WWṁ2 , 36oC
67oCEop filtrate
50oCD1 filtrate
WWṁ3 , 44oCSteam
0.2 MWWW
ṁ4 , 44oCSteam
1.7 MW
(a) Current condition
Cold Stream (Water to process): 2 44oC
Hot Stream (acidic effluent): 50 25oC
Cold Stream (Water to process): 2 36oC
Eop steammixer
Steam
D0 WasherD064oC
Pulp
67oC 95oC
2.9 MWHW
ṁ1 , 85oC
Filtrate tank -D0 washer
ṁ5 , AcidicEffluent69oC
PulpWasher #5
Filtrate tank –washer #5
79oC66oC
70oC
Chemicals
69oC
HWṁ2 , 85oC
67oCEop filtrate
53oCD1 filtrate
HWṁ3 , 85oC HW
ṁ4 , 85oC
(b) 1st temperature targeting(1st estimation)
Cold Stream (Water to process): 2 85oC
Hot Stream (acidic effluent): 69 25oC
Eop steammixer
Steam
D0 WasherD064oC
Pulp
57oC 95oC
2.9 MWHW
ṁ1 , 65oC
Filtrate tank- D0washer
ṁ5 , AcidicEffluent57oC
PulpWasher #5
Filtrate tank-washer #5
62oC55oC
57oC
Chemicals
57oC
HWṁ2 , 65oC
67oCEop filtrate
53oCD1 filtrate
HWṁ3 , 65oC HW
ṁ4 , 65oC
(c) 2nd temperature targeting(2nd (final) estimation)
Cold Stream (Water to process): 2 65oC
Hot Stream (acidic effluent): 57 25oC
Eop steammixer
Acidiceffluent69oC
41oC 25oC
HW85oC
60oC
HEX for WW47production
SC-Evap.
SC-Digesting
Wet scrubber
85oC
70oC 37oC
2oC
2oC
65oC
(d) A part of first HEN based on 1st estimation
Acidiceffluent57oC
29oC 25oC
HW65oC
60oC
HEX for WW47production
SC-Evap.
SC-Digesting
Wet scrubber
85oC
70oC 37oC
2oC
2oC
(e) A part of first HEN based on 2nd (final) estimation

168
7.2.3.1 Phase 1: Apply targeting temperature on simulation of the process
The first targeting temperatures for water to the process are applied on the simulation of the
Kraft process. The current and first targeting temperatures of water to the process are shown in
Fig. 7-13a and b.
When the first targeting temperatures of water to the process are applied, the temperature of
some liquid effluents from the process is also modified; the new values are given in Fig. 7-13b.
They are as follows:
Temperature of filtrate from washer #5 rises from 47 to 70oC. A part of this filtrate
overflows and goes to effluent that can be used as a heat source.
The temperature of acidic effluent, the filtrate from D0 washer, rises from 50 to 69oC.
The temperature from the rejects of cleaners and presses of the paper machine rises from
58 to 60oC.

169
Fig. 7-13 – Targeting temperature of water and changes in temperature of effluent (FW: fresh water, WW:warm water, HW: hot water, PM: paper machine)
7.2.3.2 Phase 2: Data extraction
Table 7-7 presents the extracted data for the HEX network design. The data consists of six air
and six water sinks while 28 sources are identified.
Washers#3 & 4
FW2 HW60
Washer#5
WW36 WW44
D0 & D0washer
WW44
Papermachine
WW46
Recausticizing
WW48 WW44 FW2
Condensatetank
Demineralizedwater 2
Acidic effluent50
Filtrate tank– D0 washer
Overflow47
Filtrate tank-Washer #5
Reject58
Presses –PM
Cleaners –PM
Reject58
(a)Current water temperature to processes ¤t temperature of the liquid effluents
(those ones that are modified)
Washers#3 & 4
WW40
Washer#5
HW85
D0 storage &D0 washer
HW85
Papermachine
HW77
Recausticizing
WW45
Condensatetank
Demineralizedwater 95
Acidic effluent69
Filtrate tank-D0 washer
Overflow70
Filtrate tank– Washer #5
Reject60
Presses –PM
Cleaners –PM
Reject60
(b) 1st targeting temperature for water to processes& 1st change in temperature of the liquid effluents
(those ones that are modified)
Washers#3 & 4
WW40
Washer#5
HW65
D0 storage &D0 washer
HW65
Papermachine
HW77
Recausticizing
WW45
Condensatetank
Demineralizedwater 76
Acidic effluent57
Filtrate tank -D0 washer
Overflow57
Filtrate tank–Washer #5
Reject60
Presses –PM
Cleaners –PM
Reject60
(c) Final (2nd) targeting temperature for water to processes &Final (2nd) change in temperature of the liquid effluents
(those ones that are modified)
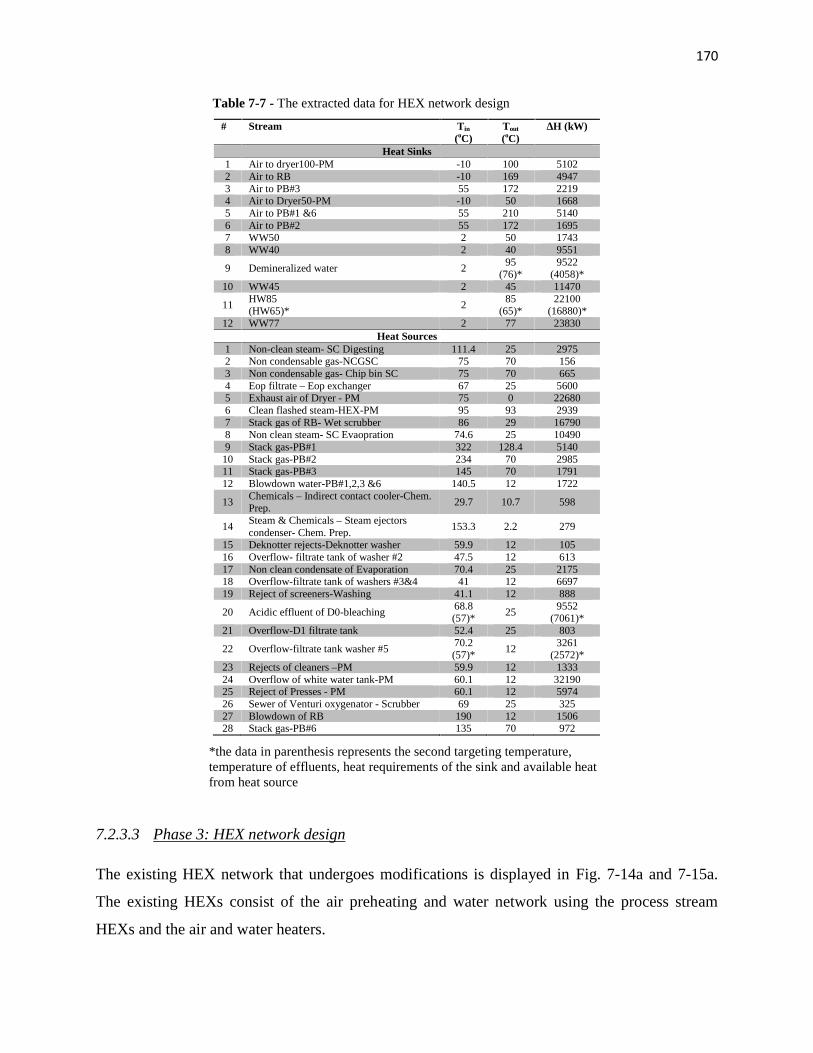
170
Table 7-7 - The extracted data for HEX network design
# Stream Tin
(oC)Tout
(oC)∆H (kW)
Heat Sinks1 Air to dryer100-PM -10 100 51022 Air to RB -10 169 49473 Air to PB#3 55 172 22194 Air to Dryer50-PM -10 50 16685 Air to PB#1 &6 55 210 51406 Air to PB#2 55 172 16957 WW50 2 50 17438 WW40 2 40 9551
9 Demineralized water 295
(76)*9522
(4058)*10 WW45 2 45 11470
11HW85(HW65)*
285
(65)*22100
(16880)*12 WW77 2 77 23830
Heat Sources1 Non-clean steam- SC Digesting 111.4 25 29752 Non condensable gas-NCGSC 75 70 1563 Non condensable gas- Chip bin SC 75 70 6654 Eop filtrate – Eop exchanger 67 25 56005 Exhaust air of Dryer - PM 75 0 226806 Clean flashed steam-HEX-PM 95 93 29397 Stack gas of RB- Wet scrubber 86 29 167908 Non clean steam- SC Evaopration 74.6 25 104909 Stack gas-PB#1 322 128.4 5140
10 Stack gas-PB#2 234 70 298511 Stack gas-PB#3 145 70 179112 Blowdown water-PB#1,2,3 &6 140.5 12 1722
13Chemicals – Indirect contact cooler-Chem.Prep.
29.7 10.7 598
14Steam & Chemicals – Steam ejectorscondenser- Chem. Prep.
153.3 2.2 279
15 Deknotter rejects-Deknotter washer 59.9 12 10516 Overflow- filtrate tank of washer #2 47.5 12 61317 Non clean condensate of Evaporation 70.4 25 217518 Overflow-filtrate tank of washers #3&4 41 12 669719 Reject of screeners-Washing 41.1 12 888
20 Acidic effluent of D0-bleaching68.8(57)*
259552
(7061)*21 Overflow-D1 filtrate tank 52.4 25 803
22 Overflow-filtrate tank washer #570.2(57)*
123261
(2572)*23 Rejects of cleaners –PM 59.9 12 133324 Overflow of white water tank-PM 60.1 12 3219025 Reject of Presses - PM 60.1 12 597426 Sewer of Venturi oxygenator - Scrubber 69 25 32527 Blowdown of RB 190 12 150628 Stack gas-PB#6 135 70 972
*the data in parenthesis represents the second targeting temperature,temperature of effluents, heat requirements of the sink and available heatfrom heat source
7.2.3.3 Phase 3: HEX network design
The existing HEX network that undergoes modifications is displayed in Fig. 7-14a and 7-15a.
The existing HEXs consist of the air preheating and water network using the process stream
HEXs and the air and water heaters.

171
After the first trial for the HEN design using first targeting temperatures (Fig. 7-13b), the results
show that using the existing heat source, the heat requirement for heat sinks cannot be met.
Therefore, the targeting temperature should be updated based on the data that have been obtained
from first HEN design (Fig. 7-13c). The second (final) targeting temperature is applied in the
simulation of the process to obtain the second temperature of liquid effluents, as displayed in
Fig. 7-13c. The second outlet temperature and heat requirement of water and also the second
temperature of liquid effluents and their available heat are updated according to Fig. 7-13c in the
data for the HEN design, as shown in Table 7-7 (data in parenthesis). The first designed HEN
needs to be modified based on the second targeting temperature and the second inlet temperature
of effluents; however, it is a minor adjustment to generate the second (final) HEN. The results
show that the available heat can cope with the second targeting temperature of the heat sinks.
The second (final) HEN is demonstrated in Fig. 7-14b and 7-15b. The yellow HEXs are existing
process stream HEXs, the red ones are steam heaters, the grey ones are new HEXs that should be
purchased, and the purple ones are the existing HEXs that need to be enlarged.
Figure 7-14b shows the new HEN to pre-heat the air for the boilers and dryers. There are five
new HEXs that should be purchased:
Three air economizers (eco.) at the dryer to pre-heat the air for the dryer and recovery
boiler (RB) by recovering the heat of exhaust air.
One air economizer at the power boiler #1 (PB #1) to pre-heat the air for the RB.
One air economizer at the PB #6 to pre-heat the air for the PB #1 and 6.
Here, it should be noted that power boilers #2 and 3 (PB #2 & 3) are shut down using saved
steam and this is the reason for not being included in Fig. 7-14b.

172
Fig. 7-14 – Current and final air pre-heating network after applying R-HEN (RB: recovery boiler, PB: powerboiler, PM: paper machine, eco.: economizer)
Figure 7-15b illustrates the new HEN for the water production network. There are four new
HEXs while the area of two existing HEXs should be increased to produce warm and hot water
(Fig. 7-15b).
One new acidic effluent exchanger to recover the heat of overflow filtrate from the D0
stage of bleaching and produce warm water at 47oC.
One new white water exchanger to recover the heat of overflow filtrate (white water)
from the filtrate tank of the paper machine and produce warm water at 50oC.
One new non-clean condensate exchanger to recover the heat of non-clean condensate
from the evaporation train and produce demineralised water at 60oC for the condensate
tank of the steam plant.
Air economizerof Dryer
30oC
Glycol loop-Air HEX50oC
Dryer airsteam heater
100oC
Dryer- PM
RB air heater 169oCRB
Air economizer of PB#1210oC PB#1
PB#6
55oC
Air economizer ofPB#2
172oCPB#2
PB#3100oC
PB#3 airsteamheater 172oC
Air economizerof PB#3
55oC
Fres
h A
ir (-
10o C
)
210oC
55oC
1st Air eco. ofDryer
55oC
Dryer airsteam heater
100oC
Dryer- PM
RB
210oC PB#1
PB#6210oC
55oC
2nd Air eco. ofDryer
55oC
3rd Air eco. of Dryer55oC
4th Air econ.of DryerFr
esh
Air
(-10
o C)
2nd Air eco.of PB#1
55oC
RB airsteamheater
169oC90oC
85oC
Air eco. ofPB#6
1st Air eco.of PB#1
(a) Current airpre-heating network
(b) Final airpre-heating network
New HEXSteam heaterExisting HEX

173
One new blowdown exchanger to recover the heat of blowdown water from the RB, and
PB #1 and 6 and produce demineralised water at 95oC for the condensate tank of the
steam plant.
The existing area of HEX for clean flashed steam should be enlarged to produce water at
77oC by condensing the clean flashed steam from the dryer of the paper machine.
The existing area for the surface condenser of evaporation should be enlarged to produce
water at 60oC by condensing the non-clean steam from the evaporation train.
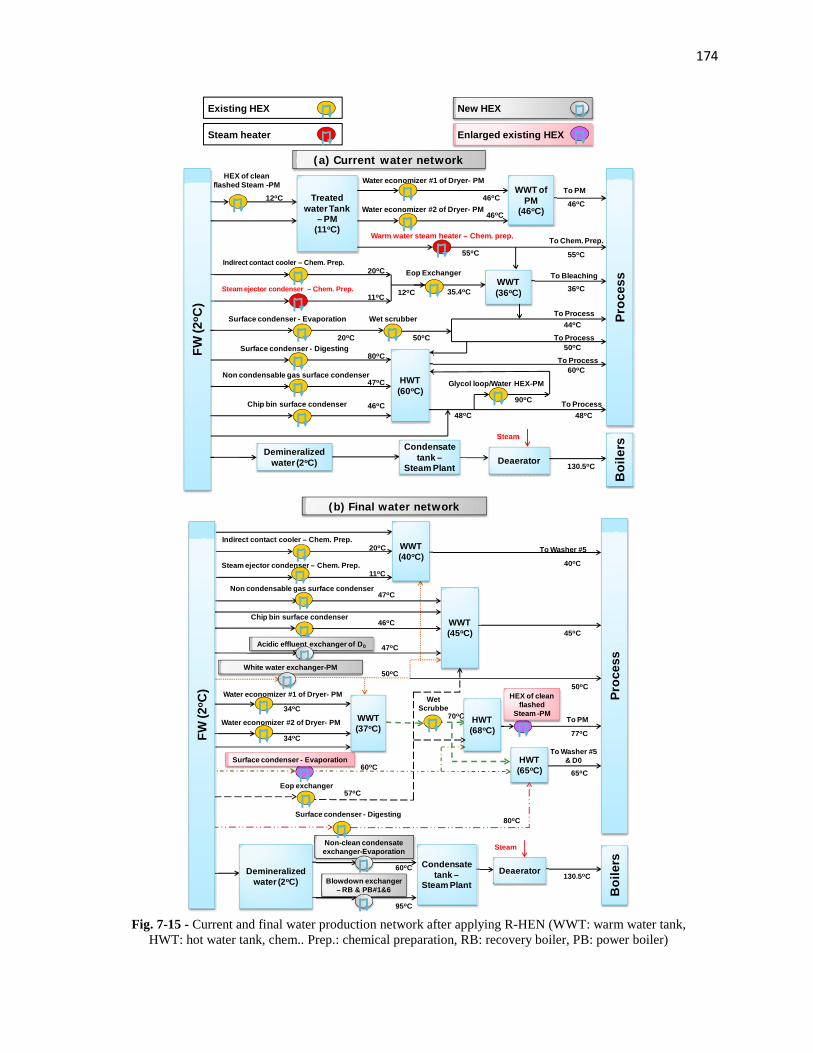
174
Fig. 7-15 - Current and final water production network after applying R-HEN (WWT: warm water tank,HWT: hot water tank, chem.. Prep.: chemical preparation, RB: recovery boiler, PB: power boiler)
HEX of cleanflashed Steam -PM
Treatedwater Tank
– PM(11oC)
12oC
Water economizer #1 of Dryer- PM
46oCWWT of
PM(46oC)
Proc
ess
Water economizer #2 of Dryer- PM46oC
To PM
Indirect contact cooler – Chem. Prep.20oC
Steam ejector condenser – Chem. Prep.11oC
Eop Exchanger
35.4oC12oC
Warm water steam heater – Chem. prep.
55oCTo Chem. Prep.
WWT(36oC)
To Bleaching
Surface condenser - Evaporation
20oC
Wet scrubber
50oC44oC
To Process
To Process
36oC
55oC
46oC
50oCSurface condenser - Digesting80oC
Non condensable gas surface condenser47oC
Chip bin surface condenser 46oC
To Process60oC
Glycol loop/Water HEX-PM
90oC
HWT(60oC)
48oC 48oCTo Process
Demineralizedwater (2oC) Deaerator
Steam
Boi
lers
130.5oC
Condensatetank –
Steam Plant
FW (2
o C)
(a) Current water network
New HEX
Enlarged existing HEXSteam heater
Existing HEX
Water economizer #1 of Dryer- PM
34oC
Proc
ess
Water economizer #2 of Dryer- PM
34oC
Indirect contact cooler – Chem. Prep.20oC
Steam ejector condenser – Chem. Prep.11oC
Surface condenser - Evaporation60oC
Non condensable gas surface condenser47oC
Chip bin surface condenser46oC
Surface condenser - Digesting80oC
WetScrubbe
r 70oCWWT(37oC)
Eop exchanger57oC
Acidic effluent exchanger of D0 47oC
White water exchanger-PM50oC
45oC
To PM
77oC
HWT(68oC)
To Washer #5& D0
65oC
HWT(65oC)
WWT(45oC)
To Washer #5
40oC
WWT(40oC)
50oCHEX of clean
flashedSteam -PM
Deaerator
Steam
130.5oCCondensate
tank –Steam Plant B
oile
rs
Non-clean condensateexchanger-Evaporation
60oC
Blowdown exchanger– RB & PB#1&6
95oC
FW (2
o C)
Demineralizedwater (2oC)
(b) Final water network

175
Steam saving
It has been estimated in step 1 that steam can be saved at RHS-SH, FHexHS-SI, and RHS-
NFHexHS-SI. Table 7-3 presents the current, estimated, and final steam consumption. The
results show that at RHS-SH, the estimation was to replace the steam with other heat sources but
in practice for 6 MW of steam at air heater-PM and air heater-RB, the goal cannot be achieved,
however, the steam saving is still significant (16.3 MW). At the FHexHS-SI, the steam injection
(10.6 MW) can be completely eliminated, as was estimated. At RHS-NFHexHS-SI, the steam
injection can be reduced by 15.2 MW while the estimate was 15.7 MW, which is substantially
close to the final result.
Table 7-4 displays the total steam requirement in the current HEX network, estimated using the
targeting approach, and after the final network design. It also shows the estimated steam saving
using the targeting approach and final steam saving after the final network design. The total
steam saving is significantly high and accounts for 38% of current steam consumption of the
mill. The results also show that the theoretical maximum steam saving (TMaxSS) is considerably
close to the final steam saving (43 vs. 38%). It can be concluded that this technique yields a high
steam saving and also gives an accurate estimation for steam saving at the early stage of the
network design.
7.2.4 Step 4: Economic analysis
7.2.4.1 Cost of HEX
The area and the cost of new and enlarged HEXs are calculated and presented in Table 7-8.
Table 7-8a summarizes nine new HEXs that should be purchased while Table 7-8b presents two
existing HEXs that should be enlarged to more effectively recover the heat. The total new area
requirement is 9850 m2 to exchange 39.6 MW of heat. The new area entails 13.4 M$ of
investment while it adds 335 k$/a (0.4 M$/a) to the operating costs of the mill.

176
Table 7-8 – New HEXs to be purchased and existing HEXs to beenlarged
# Name of HEXHeat
exchanging(MW)
Area(m2)
Installedcost(M$)
(a) New HEXs1 2nd air economizer of dryer 0.5 384 0.422 3rd air economizer of dryer 1.8 1441 1.883 4th air economizer of dryer 1.8 1442 1.884 2nd air economizer of PB#1 1.0 961 1.165 Air economizer of PB#6 1.0 374 0.416 Acidic effluent exchanger-D0 6.3 1377 1.787 White water exchanger-PM 16.4 3141 5.068 Non-clean condensate exchanger-
Evaporation1.8 356 0.39
9 Blowdown exchanger –RB & PB#1& 6
2.3 264 0.29
Total for new HEXs 32.9 9740 13.27(b) The enlarged existing HEXs
1 Surface condenser – Evaporation 4.4 62 0.062 HEX of clean flashed steam - PM 2.3 49 0.7Total for enlarged existing HEXs 6.5 111 0.13TOTAL 39.6 9850 13.4
7.2.4.2 Profitability analysis
The saved steam (42.1 MW) can be used to eliminate natural gas consumption by shutting down
PBs #2 and #3. The total natural gas saving is 4820 GJ/d. The following assumptions are used
for profitability calculations:
1. The natural gas price is 6.0 $/GJ.
2. The number of operating days is 354 days (Browne et al., 2011).
All the costs and saving are summarized in Table 7-9. The natural gas saving is 10.3 M$/a while
the new HEX requires 0.4 M$/a for new operating costs, which leads to 9.9 M$/a of extra net
profit for the mill. This results in a significantly short payback period of 1.3a, which makes it
extremely attractive for investment.
Table 7-9 – The economic analysis of steam saving and new area required
Steamsaving(MW)
NG saving(GJ/d)
NGsaving(M$/a)
Capitalcost (M$)
Newoperating
cost(M$/a)
Net profit(M$/a)
Paybackperiod
(a)
42.1(38%)
4800 10.3 13.4 0.4 9.9 1.3
177
7.3 Pinch Analysis
Pinch analysis of the mill is also carried out to reveal the differences with R-HEN. It consists of
the following steps:
Data extraction
Constructing Pinch Curves
o Identification of MHR, maximum internal heat recovery, maximum steam saving
o Identification of Pinch point
Constructing existing HEX network
o Identification of Pinch violation based on Pinch rules.
Redesigning the HEN using Pinch rules
o Dividing the problem into two parts; below and above the Pinch
o Designing above and below the Pinch separately and the elimination of loops in
the network
o Elimination or reduction of Pinch violation
o Proposition of new HEXs and enlargement in existing HEXs
7.3.1 Results of Application of Pinch Analysis
The data for Pinch analysis are presented in Table 7-10. The sinks are involved in all existing
water and air requirements at different temperatures, all existing steam users, including steam
heaters and steam injections. The sources include all liquid effluents, stack gases, and exhaust
air.

178
Table 7-10 - The extracted data for Pinch Analysis
# Stream Tin
(oC)Tout
(oC)∆H
(kW) Stream Tin
(oC)Tout
(oC)∆H
(kW)Heat Sinks Heat Sources
1 Air to dryer100-PM -10 100 5102 Non-clean steam- SC Digesting 111.4 25 29752 Air to RB -10 169 4947 Non condensable gas-NCGSC 75 70 156
3 Air to PB#3 55 172 2219Non condensable gas- Chip binSC
75 70 665
4 Air to Dryer50-PM -10 50 1668 Eop filtrate – Eop exchanger 67 25 56005 Air to PB#1 &6 55 210 5140 Exhaust air of Dryer - PM 75 0 22680
6 Air to PB#2 55 172 1695Clean flashed steam-condenser-PM
95 93 2939
7 WW50 2 50 1723 Stack gas of RB- Wet scrubber 86 29 16790
8 WW44.4 2 44.4 18230Non clean steam- SCEvaporation
74.6 25 10490
9 WW35.7 2 35.7 2417 Stack gas-PB#1 322 128.4 514010 HW61 2 61 19080 Stack gas-PB#2 234 70 298511 WW47.5 2 47.5 206 Stack gas-PB#3 145 70 179112 WW46 2 46 13980 Blowdown water-PB#1,2,3 &6 140.5 12 1722
13 WW55 2 55 20Chemicals – Indirect contactcooler-Chem. Prep.
29.7 10.7 598
14Liquor-upper heater ofDigesting
152.7 160.5 2939Steam& Chemicals – Steamejectors condenser- Chem.Prep.
153.3 2.2 279
15Liquor-Lower heater ofdigesting
160.6 169 1653Deknotter rejects-Deknotterwasher
59.9 12 105
16Glycol-Steam HEX of glycolloop
130 133.7 5482Overflow- filtrate tank washer#2
47.5 12 613
17Green liquor – GL heater ofrecaust.
69.2 84 740Non clean condensate ofEvaporation
70.4 25 2175
18NaClO3 –Steam heater#1-Chem. Prep.
42.3 85 43Overflow-filtrate tank ofwashers #3&4
37.6 12 12030
19Chemicals-Chemicalreboiler-Chem. Prep.
71.3 73 1398 Reject of screeners-Washing 37.7 12 785
20 Dryer-PM 129.8 162 19260 Acidic effluent of D0-bleaching 49.9 25 546321 Evaporation 147.9 192.2 7615 Overflow-D1 filtrate tank 50.2 25 736
22BL 42.6% -Cascadeconcentrator
77.8 120 14490Overflow-filtrate tank ofwasher #5
47 12 2053
23 Boiler feed water to PB#1 130.5 135.4 133 Rejects of cleaners -PM 59.9 12 1333
24 Boiler feed water to PB#2 130.5 135.4 126Overflow of white water tank-PM
60 12 32920
25 Boiler feed water to PB#3 130.5 135.4 233 Reject of Presses - PM 58.3 12 5740
26 Boiler feed water to PB#6 130.5 135.4 152Sewer of Venturi oxygenator -Scrubber
66.9 25 310
27Wood-Chip bin steaminjection
2 92 4675 Blowdown of RB 190 12 1506
28Wood-steaming vessel steaminjection
92 143.2 4821 Stack gas-PB#6 135 70 972
29Pulp-Washer #5 steaminjection
45.2 45.5 208Glycol-Air & Water heater ofglycol loop-PM
133.7 130 5482
30Pulp-D0 washer steaminjection
43.4 49.1 1614Stack gas of RB-Cascadeconcentrator of BL42.6%
250.3 125.4 14490
31 Pulp- Eop steam injection 49.5 95 4324 Blowdown water-PB#1 188.6 140.5 133
32White water-Silo chest steaminjection
58.3 60 9644 Blowdown water-PB#2 188.6 140.5 126
33Boiler feed water-Deaeratorsteam injection
43.5 130.5 13930 Blowdown water-PB#3 188.6 140.5 233
34 Blowdown water-PB#6 188.6 140.5 152
Figure 7-16 illustrates the Pinch Curves of the mill. The Pinch point is located at 63.3oC and the
minimum heating requirement (MHR) is 51.3 MW. The maximum potential of internal heat

179
recovery (MIHR) is 118.3 MW. According to MHR (51.3 MW) and the current steam
consumption (112 MW), the maximum potential steam saving is 60.7 MW (54%).
Fig. 7-16 – Pinch Curves of the mill
A part of the existing HEX network that undergoes modifications is displayed in Fig. 7-17a and
7-18a. The Pinch rules for HEN design are used to modify the existing HEXs. Figures 7-17b and
7-18b illustrate the modified HEX network for air preheating and the water production network
based on Pinch Analysis. There are three types of Pinch violations in the existing network
according to the Pinch rules: 7.9 MW steam injection below the Pinch point, 3.4 MW steam
utilization at heaters below the Pinch point, and finally 19.9 MW cross Pinch heat recovery.
-20
30
80
130
180
230
280
330
0 50 100 150 200 250
Tem
pera
ture
(oC
)
Enthalpy (MW)
Hot CurveCold Curve
CSC=112 MW
MHR=51.3 MW
Pinch Point =63.3oC
MIHR=118.3 MW

180
Fig. 7-17 – Current and final air pre-heating network after applying Pinch Analysis (RB: recovery boiler, PB:power boiler, PM: paper machine, eco.: economizer)
Air economizerof Dryer
30oC
Glycol loop-Air HEX50oC
44
Dryer air steamheater
100oC
Dryer- PM
RB air heater169oC RB
Air economizer of PB#1210oC PB#1
PB#6
55oC
Air economizer of PB#2172oC
PB#2
PB#3100oC
PB#3 airsteamheater
172oC
Air economizerof PB#3
55oC
Fres
h A
ir (-
10o C
)
210oC
55oC
1st Air eco. ofDryer
55oC
Dryer airsteam heater
100oC
Dryer- PM
RB
210oC PB#1
PB#6210oC
55oC
2nd Air eco. ofDryer
55oC
3rd Air eco. of Dryer 55oC
4th Air econ.of Dryer
Fres
h A
ir (-
10o C
)
2nd Air eco.of PB#3
55oC
RB air steam heater
169oC
77oC
85oC
Air eco. ofPB#6
1st Air eco.of PB#1
2nd Air eco.of PB#1
113oC
PB#3100oC
PB#3 airsteamheater
172oC
1st Air eco. ofPB#3
55oC
(a) Current airpre-heating network
(b) Final airpre-heating network
New HEXSteam heaterExisting HEX
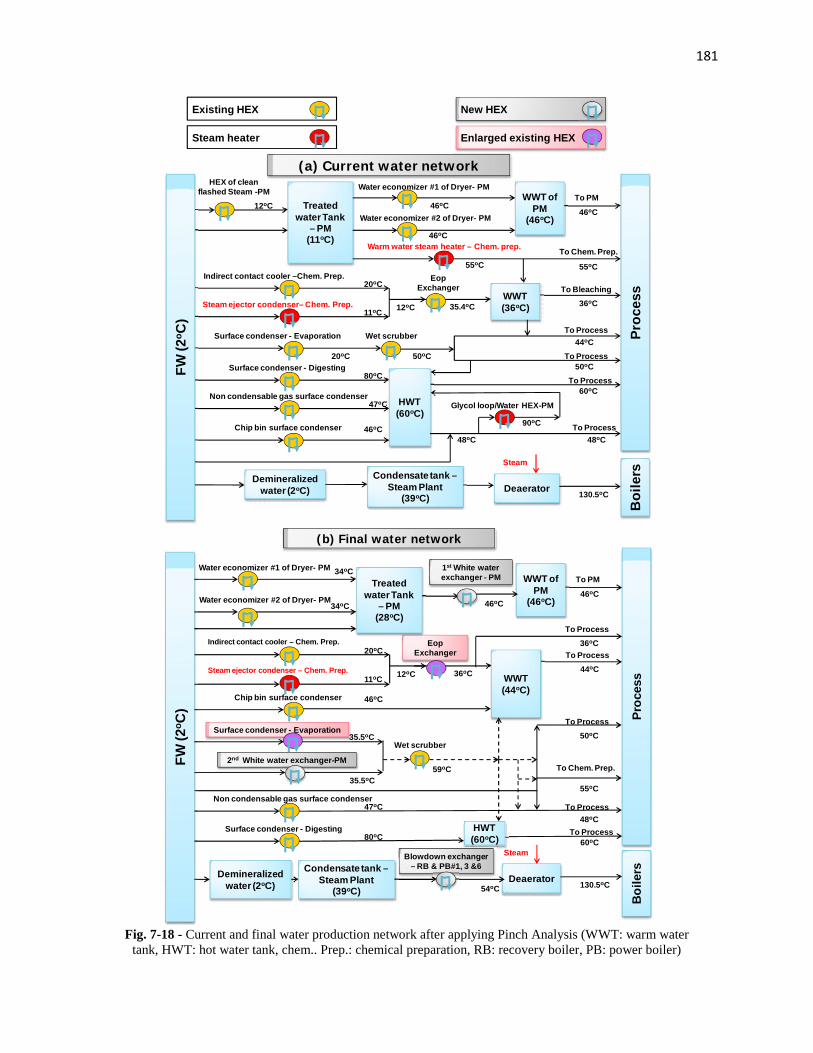
181
Fig. 7-18 - Current and final water production network after applying Pinch Analysis (WWT: warm watertank, HWT: hot water tank, chem.. Prep.: chemical preparation, RB: recovery boiler, PB: power boiler)
HEX of cleanflashed Steam -PM
Treatedwater Tank
– PM(11oC)
12oC
Water economizer #1 of Dryer- PM
46oCWWT of
PM(46oC)
Proc
ess
Water economizer #2 of Dryer- PM
46oC
To PM
Indirect contact cooler –Chem. Prep.20oC
Steam ejector condenser– Chem. Prep.11oC
EopExchanger
35.4oC12oC
Warm water steam heater – Chem. prep.
55oCTo Chem. Prep.
WWT(36oC)
To Bleaching
Surface condenser - Evaporation
20oC
Wet scrubber
50oC44oC
To Process
To Process
36oC
55oC
46oC
50oCSurface condenser - Digesting80oC
Non condensable gas surface condenser47oC
Chip bin surface condenser 46oC
To Process60oC
Glycol loop/Water HEX-PM
90oC
HWT(60oC)
48oC 48oCTo Process
Demineralizedwater (2oC) Deaerator
Steam
Boi
lers
130.5oC
Condensate tank –Steam Plant
(39oC)
FW (2
o C)
(a) Current water network
New HEX
Enlarged existing HEXSteam heater
Existing HEX
Water economizer #1 of Dryer- PM 34oCWWT of
PM(46oC)
Proc
ess
Water economizer #2 of Dryer- PM34oC
To PM
Indirect contact cooler – Chem. Prep.20oC
Steam ejector condenser – Chem. Prep.11oC
EopExchanger
36oC12oC
To Chem. Prep.
WWT(44oC)
To Process
Surface condenser - Evaporation35.5oC
Wet scrubber
59oC
44oC
46oC
Surface condenser - Digesting80oC
Non condensable gas surface condenser47oC
Chip bin surface condenser 46oC
To Process60oC
HWT(60oC)
48oCTo Process
To Process36oC
1st White waterexchanger - PM
46oC
Treatedwater Tank
– PM(28oC)
2nd White water exchanger-PM
35.5oC
To Process50oC
55oC
(b) Final water network
Deaerator
Steam
130.5oC
Boi
lers
Blowdown exchanger– RB & PB#1, 3 &6
54oC
Demineralizedwater (2oC)
FW (2
o C)
Condensate tank –Steam Plant
(39oC)

182
The Pinch violation due to steam injection below the Pinch point cannot be significantly
corrected because, aside from the deaerator steam injection, the remainder of the heat sinks of
these injections is pulp that cannot be directed to HEX. Therefore, except in the case of the
deaerator (Fig. 7-18b) where the water can be directed to the HEX after the condensate tank and
recover the heat before sending it to the deaerator, in the other cases, there is no possibility to
reduce the Pinch violation. At these points, the Pinch violation is reduced from 7.9 to 6.0 MW.
The Pinch violation of steam heaters decreases considerably from 3.4 to 0.2 MW. The cross
Pinch violation is also reduced from 19.9 to 15.6 MW. The reason for the small decrease in the
Pinch violation is due to physical constraints. A large reduction in Pinch violations imposes
many new HEXs that cannot be justified economically. In total, from the existing 31.2 MW of
Pinch violations, 21.8 MW still remain after the final design. It is important to stress that in the
retrofit HEX design due to physical and process constraints, there is not much freedom to make
many modifications and eliminate all the Pinch violations.
The modified network requires purchasing nine new HEXs and the enlargement of the area of
two existing HEXs. The total new area requirement is 8140 m2 for the heat exchanging of 24.3
MW, which leads to 22.7 MW of steam saving. The steam saving of 20% is identical with the
result of Pinch analyses that have been reported in the literature, including 15-17% of
(AmericanProcess, 2010), 13% of (Mateos-Espejel et al., 2010d, 2011c), 15% of (Savulescu et
al., 2005c), etc. Total installed cost of the new area is 10.1 M$ while it adds 252 k$/a (0.3 M$/a)
to operating costs. The saved steam can be used to shut down the natural gas power boiler #2
(15.0 MW) and reduce the steam generation at the natural gas power boiler #3 (7.7 MW). This
results in 2600 GJ/d of natural gas saving that can be translated to 6.5 M$/a of saving. The net
profit after the deduction of the new operating costs of new HEXs is 6.2 M$/a while the payback
period will be 1.6a.
7.4 Comparison of R-HEN with Pinch Analysis
The R-HEN and Pinch analysis are compared from two different perspectives: approach and
results. From the approach point of view, R-HEN and Pinch Analysis is compared in Table 7-11.

183
Table 7-11 – Comparison between R-HEN and Pinch Analysis from the approach perspective
R-HEN Pinch Analysis
TargetingRequires only simulation ofprocess and classification ofsteam users
Requires simulation of process, dataextraction, constructing the Pinch Curves
Required Data for HEN design
Less numberof sinks:mainly waterand air
For casestudy: 12sinks
Sinks: all water and air, allsteam users including steaminjections and steam heaters
For casestudy: 33sinks
Defining targeting temperature for water toreduce the effect of non-isothermal mixingsteam injection respecting constraints
√ ×Defining targeting temperature for air toenhance the efficiency of air users respectingconstraints
√ ×Advance evaluation of temperature of wastestreams (main heat sources) using simulation ofthe process
√ ×Practical and straightforward guidelines forHEN design √ ×
The Pinch rules for HEN design sometimes restrict the potential for heat recovery and may result
in oversized HEXs due to strictly adhering to the minimum allowable approach temperature
(∆Tmin=10oC).
Pinch Analysis does not offer direct guidelines for choosing the connections between hot and
cold streams. In Pinch Analysis, the HEN is designed for above and below the Pinch point and
then the loops are eliminated while in R-HEN, there is no loop creation and elimination.
Therefore, computation time and effort for HEN design is reduced.
From a results perspective, the total steam saving, the estimation of steam saving at the
beginning (targeting), capital costs, net profit, and payback period of R-HEN and Pinch Analysis
are compared. Figure 7-19 compares two methods in terms of steam saving and targeting. Figure
7-19a displays that the steam saving is almost twice as much for R-HEN compared to Pinch
analysis. There can be two different reasons for this:
One reason is the application of the first step of the R-HEN method where the constraints
are analyzed and the new targeting temperature for water to the process is proposed to
reduce the effect of non-isothermal mixing of steam. The new targeting temperature of air
to the dryer and boilers is also defined

184
The second is the utilization of practical rules for designing the HEX network in the third
step of R-HEN rather than Pinch rules. Typically, the temperature of fresh air (-10oC) and
water (2oC) as the main sinks in the water-based process is low. To preheat the air and
produce warm or hot water by recovering the waste heat, cross Pinching is inevitable.
Therefore, if the Pinch rules are intended to be respected, it would restrict the heat
recovery.
Fig. 7-19 – (a) Estimation and final steam requirement and steam saving by means of R-HEN and Pinchanalysis, (b) benchmarking of steam consumption after applying both R-HEN and Pinch analysis
The targeting results show that the R-HEN estimates steam saving of 43% at the beginning while
the final saving after redesigning the network is 38% (Fig. 7-19a). These two values are
considerably close. Using Pinch Analysis, the targeting is 54% and the final saving is 20%,
which are extremely far apart. Thus, it can be concluded that R-HEN suggests the more accurate
estimation for steam saving at the beginning of the analysis compared to Pinch Analysis.
Figure 7-19b illustrates the steam consumption (GJ/Adt) for the current process and after
applying two methods and benchmarks them against the steam consumption of the 25th
percentile, the median, and 75th percentile of Canadian mills (CIPEC, 2008). The graph shows
that using R-HEN, the steam consumption can be brought less than the 25th percentile of
Canadian mills that are new mills or well-managed in terms of steam consumption. On the other
hand, using Pinch analysis, it is only possible to bring this parameter close to the median
Canadian mills. The result is still good, but it is not the best one.
112 112
63.3(57%)
69.8(62%)
48.6(43%) 42.1
(38%)
0
20
40
60
80
100
120
R-HEN
MW
Current Min Steam requiement
Final Steam requirement Max Steam saving
Final steam saving
184
The second is the utilization of practical rules for designing the HEX network in the third
step of R-HEN rather than Pinch rules. Typically, the temperature of fresh air (-10oC) and
water (2oC) as the main sinks in the water-based process is low. To preheat the air and
produce warm or hot water by recovering the waste heat, cross Pinching is inevitable.
Therefore, if the Pinch rules are intended to be respected, it would restrict the heat
recovery.
Fig. 7-19 – (a) Estimation and final steam requirement and steam saving by means of R-HEN and Pinchanalysis, (b) benchmarking of steam consumption after applying both R-HEN and Pinch analysis
The targeting results show that the R-HEN estimates steam saving of 43% at the beginning while
the final saving after redesigning the network is 38% (Fig. 7-19a). These two values are
considerably close. Using Pinch Analysis, the targeting is 54% and the final saving is 20%,
which are extremely far apart. Thus, it can be concluded that R-HEN suggests the more accurate
estimation for steam saving at the beginning of the analysis compared to Pinch Analysis.
Figure 7-19b illustrates the steam consumption (GJ/Adt) for the current process and after
applying two methods and benchmarks them against the steam consumption of the 25th
percentile, the median, and 75th percentile of Canadian mills (CIPEC, 2008). The graph shows
that using R-HEN, the steam consumption can be brought less than the 25th percentile of
Canadian mills that are new mills or well-managed in terms of steam consumption. On the other
hand, using Pinch analysis, it is only possible to bring this parameter close to the median
Canadian mills. The result is still good, but it is not the best one.
112
51.3(46%)
89.2(80%)
60.6(54%)
22.7(20%)
Pinch Analysis
Min Steam requiement
Max Steam saving
22.919.2
0
5
10
15
20
25
Stea
m c
onsu
mpt
ion
(GJ/
Adt)
Current
Final-R-HEN
Median
184
The second is the utilization of practical rules for designing the HEX network in the third
step of R-HEN rather than Pinch rules. Typically, the temperature of fresh air (-10oC) and
water (2oC) as the main sinks in the water-based process is low. To preheat the air and
produce warm or hot water by recovering the waste heat, cross Pinching is inevitable.
Therefore, if the Pinch rules are intended to be respected, it would restrict the heat
recovery.
Fig. 7-19 – (a) Estimation and final steam requirement and steam saving by means of R-HEN and Pinchanalysis, (b) benchmarking of steam consumption after applying both R-HEN and Pinch analysis
The targeting results show that the R-HEN estimates steam saving of 43% at the beginning while
the final saving after redesigning the network is 38% (Fig. 7-19a). These two values are
considerably close. Using Pinch Analysis, the targeting is 54% and the final saving is 20%,
which are extremely far apart. Thus, it can be concluded that R-HEN suggests the more accurate
estimation for steam saving at the beginning of the analysis compared to Pinch Analysis.
Figure 7-19b illustrates the steam consumption (GJ/Adt) for the current process and after
applying two methods and benchmarks them against the steam consumption of the 25th
percentile, the median, and 75th percentile of Canadian mills (CIPEC, 2008). The graph shows
that using R-HEN, the steam consumption can be brought less than the 25th percentile of
Canadian mills that are new mills or well-managed in terms of steam consumption. On the other
hand, using Pinch analysis, it is only possible to bring this parameter close to the median
Canadian mills. The result is still good, but it is not the best one.
19.2
15.516.619.621.4
Final-Pinch Analysis
25th precentile
75th percentile

185
The required capital cost for R-HEN is 13.4 M$ respecting the total steam saving, which is 42.1
MW (318 k$ capital cost/MW saving) and is much less than the one for Pinch analysis, which is
10.1 M$ respecting 22.7 MW steam saving (445 k$/MW). The higher steam saving of R-HEN
also results in larger net profit (9.9 vs 6.2 M$) and a shorter payback period (1.3 vs 1.6a)
compared to Pinch analysis.
7.5 Conclusion
The retrofit HEX network design (R-HEN) has been developed for water-based processes to
improve the heat integration of the existing HEX network.
This method requires a representative simulation of the process. It consists of four
progressive steps.
It analyzed the physical and process constraints, such as “hard” and “soft” temperatures
of sensitive units in the process to avoid proposition of non-feasible projects.
A targeting approach has been developed based on the constraints and also the
classification of steam users to give a realistic estimation for steam saving in advance.
The steam users are classified into five categories for this reason. This approach requires
less data and effort to achieve an accurate targeting.
Non-isothermal mixing (NIM) has been included in the method by defining the targeting
temperature for water to the process to shift the heat load from steam injection to water.
The waste streams have been classified to effectively exploit their available heat.
R-HEN requires a lower number of sinks data for the HEN design. Mainly water and air
sinks have been included in the data sheet.
A systematic algorithm has been developed to perform retrofit HEN design using
practical rules. It gave a direct guideline to choose the connections between hot and cold
streams. The computation time and effort to design the HEN was reduced significantly.
The method has been applied on a Kraft pulp mill as a good example of water-based processes.
The results showed that nine new HEXs should be purchased in both air and water networks and
the area of two existing HEXs also should be increased. The total new area requirement and
capital cost for this were 9850 m2 and 13.4 M$, respectively. The revamped network led to a

186
considerably large steam saving of 42.1 MW that accounts for 38% of current steam
consumption. The net profit of this steam saving was high (9.9 M$/a) and the payback period
substantially short (1.3a).
Pinch Analysis has also been applied on the same case study. The results of both methods have
been compared. The total steam saving of Pinch Analysis was 20%, which was significantly
lower that the steam saving (38%) of R-HEN. The targeting results also showed that the R-HEN
estimated a steam saving of 43% at the beginning and the final saving after redesigning the
network was 38%, which were considerably close. Pinch analysis by means of Pinch Curves
estimated to save 54% of steam while the final saving was 20%, which exposed a serious gap.
The R-HEN yielded the high steam saving and also gave an accurate anticipation for steam
saving at the early stage of the network design in comparison with Pinch Analysis. The
comparison of required capital costs, net profit, and payback period also revealed the economic
advantages of R-HEN over Pinch Analysis.

187
8 CAHPTER 8: STEAM AND WATER ANALYSIS ENHANCEMENTAND INTEGRATION METHODOLOGY
The objective of this chapter is to develop a steam and water analysis enhancement and
integration (SWAEI) methodology to improve the water and thermal energy efficiency of water-
based processes by combining different PI techniques. The simulation models of three mills (mill
A, B, and C) were developed and used as a source of data for steam and water analyses.
Applying the possible changes under the current conditions is also carried out in the simulation.
The pre-benchmarking is conducted to diagnose the inefficiencies in water and steam systems.
Simultaneous energy and water networks analysis (SEWNA), equipment performance analysis
(EPA), and the retrofit HEX design network (R-HEN) are applied in sequence to identify the
projects to enhance energy and water efficiencies. Some alternatives to use the excess steam are
evaluated, including cogeneration, trigeneration and selling steam. A strategy is proposed to
implement water and energy projects. The methodology has been demonstrated by applying it on
three Canadian Kraft mills.
The chapter is organized in the following sections. SWAEI methodology and its steps are
presented after which the detailed results of three mills are shown. The results of mill C are then
compared with the results of applying stand alone SEWNA, EPA, or R-HEN on mill C. The
results of all three mills are compared. Finally, the sensitivity analysis in the major parameters is
conducted.
8.1 Steam and Water Analysis Enhancement and Integration (SWAEI)Methodology
SWAEI methodology is developed to enhance the water and thermal energy efficiency by
combining different PI techniques to exploit their synergies.
Figure 8-1 demonstrates the structure of SWAEI methodology. It consists of six successive steps:
o Step 1: Development of base case and its process simulation as a source of data for
analysis
o Step 2: Pre-benchmarking current performance to identify the area of inefficiencies
o Step 3: Identification of energy and water projects

188
o Step 4: Heat pumping and cogeneration
o Step 5: Draw a strategic guideline to implement the identified projects of steps 3 and 4
based on the economic parameters
o Step 6: Post-benchmarking to evaluate the overall efficiency improvements of water and
steam systems
Each step will be elaborated in the next sections and the results will be presented.
Fig. 8-1 – Steam and water analysis enhancement and integration (SWAEI) methodology
8.1.1 Step 1: Data Base and Process Simulation
The required data are collected and the simulation of process is developed on CADSIM Plus®
software (Aurel Systems Inc) based on the methodology of Mateos et al. (2010c; 2011d). The
simulation is used to extract data for analyses and apply proposed changes to evaluate the impact
on the process.
Step 3 - Identification of Energy & Water Improvement Projects
Step 3-3 – Retrofit HEXNetwork Design(R-HEN)
Step 3-2 – EquipmentPerformance Analysis(EPA)
Step 3-1 – SimultaneousEnergy & Water NetworksAnalysis (SEWNA)
Step 1 – Data BaseProcess Simulation
Step 2 – Pre-BenchmarkingCurrent performance
Step 4 – Energy Upgrading &Conversion
Step 5 – ImplementationStrategy
Step 6 – Post-Benchmarking

189
8.1.2 Step 2: Benchmarking Current Performance
The current performance of the mill is benchmarked against current practices from two different
perspectives:
o Steam consumption (GJ/Adt)
o Water consumption (m3/Adt)
The steam consumption of the principal steam users and the complete mill is benchmarked
against the reference data from the survey by the Pulp and Paper Research Institute of Canada
(Paprican) (CIPEC, 2008). The water consumption is benchmarked against the published data for
the average mills designed in the 1960s and 1980s (Johnston et al., 1996; Turner et al., 2001).
8.1.2.1 Scope of savings
A rule of thumb approach to calculate the scope of water (SWS) and steam savings (SSS) has
been developed by analyzing the final results of the three case studies as follows:
= × 100 [1]
= & & × 100 [2]
where CWC and RMWC denote current water consumption (m3/Adt), and reference mills’ water
consumption (m3/Adt), respectively. The scope of water saving can be assessed for the main
departments (washing, bleaching, PM, recausticizng, and the steam plant) and then added
together. It also can be evaluated for the whole mill, all at once, based on the total water
consumption. TSC is the total steam consumption of the mill. Air and water heating steam
saving, A&WSS, involves all steam for producing hot and warm water, heating the process and
non-process air. Injection & Deaerator Steam Saving, I&DSS, represents the scope for steam
saving at steam injection points and the deaerator in order to decrease the negative effects of
non-isothermal mixing. Utilization of hot water rather than low temperature water at the pulp
line and deaerator can significantly reduce the steam injection at the pulp line and steam
consumption at the deaerator. To raise these temperatures, the heat exchanger network should be
190
upgraded to recover heat from the waste streams efficiently. By analyzing the final results of the
mills, it is assumed that 70% of the steam at such points can be saved using this strategy.
These two generic formulas can be used to simply calculate the scope of steam and water savings
with the least number of data.
8.1.3 Step 3: Identification of Energy and Water Projects
The identification of energy and water efficiency improvement projects is illustrated in Fig. 8-1
and comprises three process integration techniques that have been developed and presented in
chapters 5, 6, and 7. The simultaneous energy and water networks analysis (SEWNA),
equipment performance analysis (EPA), and retrofit HEX network design (R-HEN) of water-
based processes are engaged as three progressive steps. These techniques should be performed in
sequence in order to use their synergies and avoid counteraction.
8.1.3.1 Justification of the order
The HEX network should always be generated at the final step to ensure that there is no change
in the streams that are included in the HEN design as cold and hot streams. Therefore, the
SEWNA and EPA should be carried out before R-HEN.
The EPA could be before or after SEWNA. However, it is recommended herein to apply it after
SEWNA, because if the water reutilization network is stabilized, evaluating the performance of
some pieces of equipment that relate to the water network (e.g., washers, the evaporator, the
recovery boiler, etc. in Kraft pulping) is more advantageous. For example, a change in the water
reutilization network increases the concentration of weak black liquor sent to the evaporators
and, subsequently, increases the total amount of black liquor sent to the recovery boiler. These
changes will alter the performance of the evaporator trains and recovery boiler. Therefore, to
avoid applying EPA twice (once before SEWNA and once after); it is more advantageous to
apply it after SEWNA to ensure that the changes in the water network and performance of these
pieces of equipment are taken into account.

191
8.1.4 Step 4: Energy Upgrading and Conversion
The excess steam of step 3 is first used to eliminate or reduce the fossil fuel consumption at the
boilers. The usage of the remainder of excess steam is examined according to the four following
alternatives:
o Alt. 1: cogeneration and selling electricity to the grid
o Alt. 2: trigeneration and selling electricity to the grid
o Alt. 3: selling steam to the local district, cogeneration, and selling electricity to the grid
o Alt. 4: selling steam to the local district, trigeneration, and selling electricity to the grid
These alternatives are compared based on different economic aspects, such as capital cost, net
profit and payback period to select the most promising one.
The absorption heat pump (AHP) is an expensive device and, hence, the proposal to install one
should be examined carefully. This device should be used when necessary, for instance, if there
is a vast amount of heat that can be used to produce the LP steam (in trigeneration). The
maximum heat recovery is achieved using R-HEN and it is not vital to recover and upgrade the
low temperature heat using AHP. Therefore, the only option that is examined is trigeneration,
which is a coupling of the AHP and cogeneration so as to save steam and increase the capacity
for electricity generation.
8.1.4.1 Cost of Trigeneration
The total installed cost (MT) of the back-pressure turbine (BPT) and condensing turbine (CT) is
calculated based on the following generic formula (Cakembergh-Mas et al., 2010; Seider et al.,
2009):
($) = 1.3 (1.18 × × ) [3]
where the FBM is the base module coefficient and for the steam turbine has been fixed at 3.5
(Cakembergh-Mas et al., 2010) and CP, which is the purchasing cost of the turbine, is calculated
based on the Sieder et al. (2009) approach and costs are indexed to 2012. The total operating cost
of the turbine includes maintenance and the operating supplies. The maintenance is assumed to

192
be $0.0054/kWhr (DellChallenge, 2013) and operating supplies are approximately 0.5% of the
total installed cost of the turbine (Peters et al., 2002).
The total installed cost of the absorption heat pump (AHP) is 610 $/kW (for 2012) times the
generator heat load for the single-stage (Bakhtiari et al., 2010a). Maintenance and repairs are
estimated at 2% and operating supplies are 0.5% of the total installed cost of AHP (Peters et al.,
2002).
8.1.5 Step 5: Implementation Strategy
A two-phase strategy is proposed to effectively and economically prioritize and implement the
identified projects of steps 3 and 4:
Elimination or reduction of fossil fuel
Electricity generation and/or selling steam to local district
The economic parameters to calculate the profitability are individuals for each case. All prices
are in 2012 Canadian dollars.
8.1.6 Step 6: Post-benchmarking
Similar to pre-benchmarking, a post-benchmarking is carried out to quantify the improvement of
water and steam efficiencies. In addition, the final steam and water savings are compared with
the results of the “scope of saving” to identify the accuracy and effectiveness of the “scope of
saving”.
Results
Detailed results for the three mills are presented in the following sections.
8.2 Mill A
8.2.1 Step 2: Pre-benchmarking with current practice
Figure 8-2 and 8-3 illustrate the results of pre-benchmarking. The steam consumption of mill A
is benchmarked against the data for Kraft paper pulp with a batch digester due to the lack of data
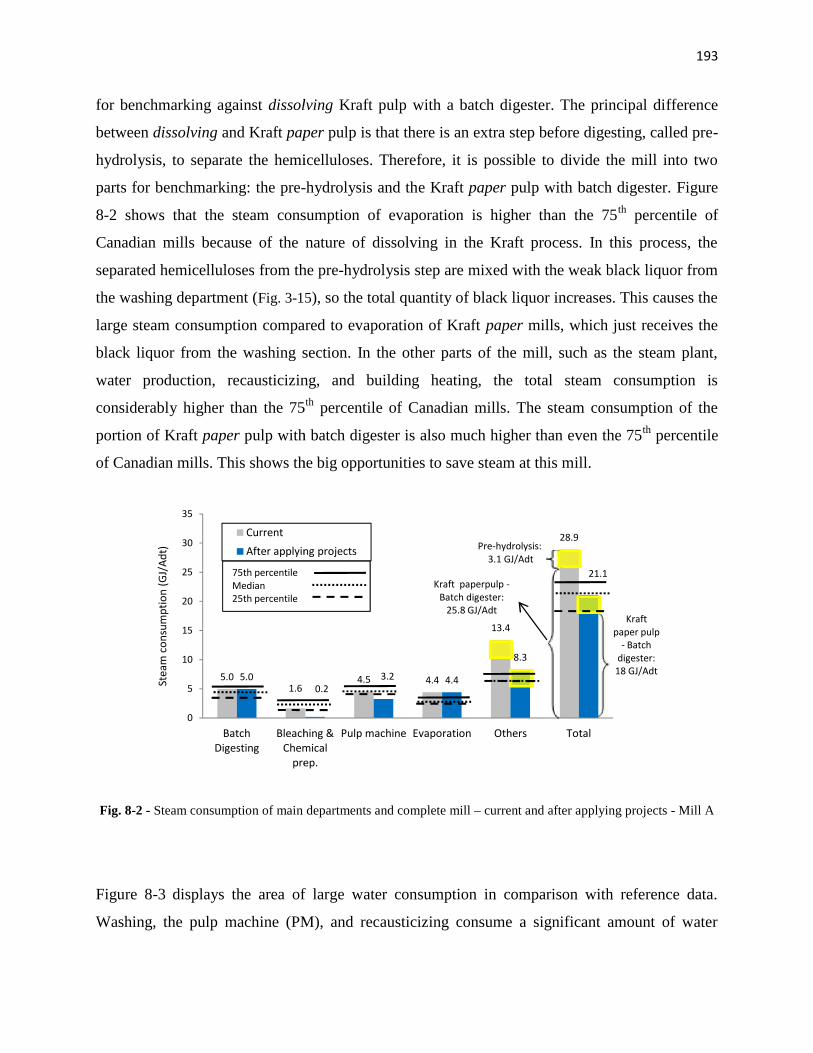
193
for benchmarking against dissolving Kraft pulp with a batch digester. The principal difference
between dissolving and Kraft paper pulp is that there is an extra step before digesting, called pre-
hydrolysis, to separate the hemicelluloses. Therefore, it is possible to divide the mill into two
parts for benchmarking: the pre-hydrolysis and the Kraft paper pulp with batch digester. Figure
8-2 shows that the steam consumption of evaporation is higher than the 75th percentile of
Canadian mills because of the nature of dissolving in the Kraft process. In this process, the
separated hemicelluloses from the pre-hydrolysis step are mixed with the weak black liquor from
the washing department (Fig. 3-15), so the total quantity of black liquor increases. This causes the
large steam consumption compared to evaporation of Kraft paper mills, which just receives the
black liquor from the washing section. In the other parts of the mill, such as the steam plant,
water production, recausticizing, and building heating, the total steam consumption is
considerably higher than the 75th percentile of Canadian mills. The steam consumption of the
portion of Kraft paper pulp with batch digester is also much higher than even the 75th percentile
of Canadian mills. This shows the big opportunities to save steam at this mill.
Fig. 8-2 - Steam consumption of main departments and complete mill – current and after applying projects - Mill A
Figure 8-3 displays the area of large water consumption in comparison with reference data.
Washing, the pulp machine (PM), and recausticizing consume a significant amount of water
5.01.6
5.0
0
5
10
15
20
25
30
35
BatchDigesting
Bleaching &Chemical
prep.
Stea
m c
onsu
mpt
ion
(GJ/
Adt)
CurrentAfter applying projects
75th percentileMedian25th percentile
193
for benchmarking against dissolving Kraft pulp with a batch digester. The principal difference
between dissolving and Kraft paper pulp is that there is an extra step before digesting, called pre-
hydrolysis, to separate the hemicelluloses. Therefore, it is possible to divide the mill into two
parts for benchmarking: the pre-hydrolysis and the Kraft paper pulp with batch digester. Figure
8-2 shows that the steam consumption of evaporation is higher than the 75th percentile of
Canadian mills because of the nature of dissolving in the Kraft process. In this process, the
separated hemicelluloses from the pre-hydrolysis step are mixed with the weak black liquor from
the washing department (Fig. 3-15), so the total quantity of black liquor increases. This causes the
large steam consumption compared to evaporation of Kraft paper mills, which just receives the
black liquor from the washing section. In the other parts of the mill, such as the steam plant,
water production, recausticizing, and building heating, the total steam consumption is
considerably higher than the 75th percentile of Canadian mills. The steam consumption of the
portion of Kraft paper pulp with batch digester is also much higher than even the 75th percentile
of Canadian mills. This shows the big opportunities to save steam at this mill.
Fig. 8-2 - Steam consumption of main departments and complete mill – current and after applying projects - Mill A
Figure 8-3 displays the area of large water consumption in comparison with reference data.
Washing, the pulp machine (PM), and recausticizing consume a significant amount of water
1.64.5 4.4
13.4
28.9
0.23.2 4.4
8.3
21.1
Bleaching &Chemical
prep.
Pulp machine Evaporation Others Total
After applying projects
75th percentileMedian25th percentile
Kraft paperpulp -Batch digester:
25.8 GJ/Adt
Pre-hydrolysis:3.1 GJ/Adt
Kraftpaper pulp
- Batchdigester:18 GJ/Adt
193
for benchmarking against dissolving Kraft pulp with a batch digester. The principal difference
between dissolving and Kraft paper pulp is that there is an extra step before digesting, called pre-
hydrolysis, to separate the hemicelluloses. Therefore, it is possible to divide the mill into two
parts for benchmarking: the pre-hydrolysis and the Kraft paper pulp with batch digester. Figure
8-2 shows that the steam consumption of evaporation is higher than the 75th percentile of
Canadian mills because of the nature of dissolving in the Kraft process. In this process, the
separated hemicelluloses from the pre-hydrolysis step are mixed with the weak black liquor from
the washing department (Fig. 3-15), so the total quantity of black liquor increases. This causes the
large steam consumption compared to evaporation of Kraft paper mills, which just receives the
black liquor from the washing section. In the other parts of the mill, such as the steam plant,
water production, recausticizing, and building heating, the total steam consumption is
considerably higher than the 75th percentile of Canadian mills. The steam consumption of the
portion of Kraft paper pulp with batch digester is also much higher than even the 75th percentile
of Canadian mills. This shows the big opportunities to save steam at this mill.
Fig. 8-2 - Steam consumption of main departments and complete mill – current and after applying projects - Mill A
Figure 8-3 displays the area of large water consumption in comparison with reference data.
Washing, the pulp machine (PM), and recausticizing consume a significant amount of water
21.1
Kraftpaper pulp
- Batchdigester:18 GJ/Adt
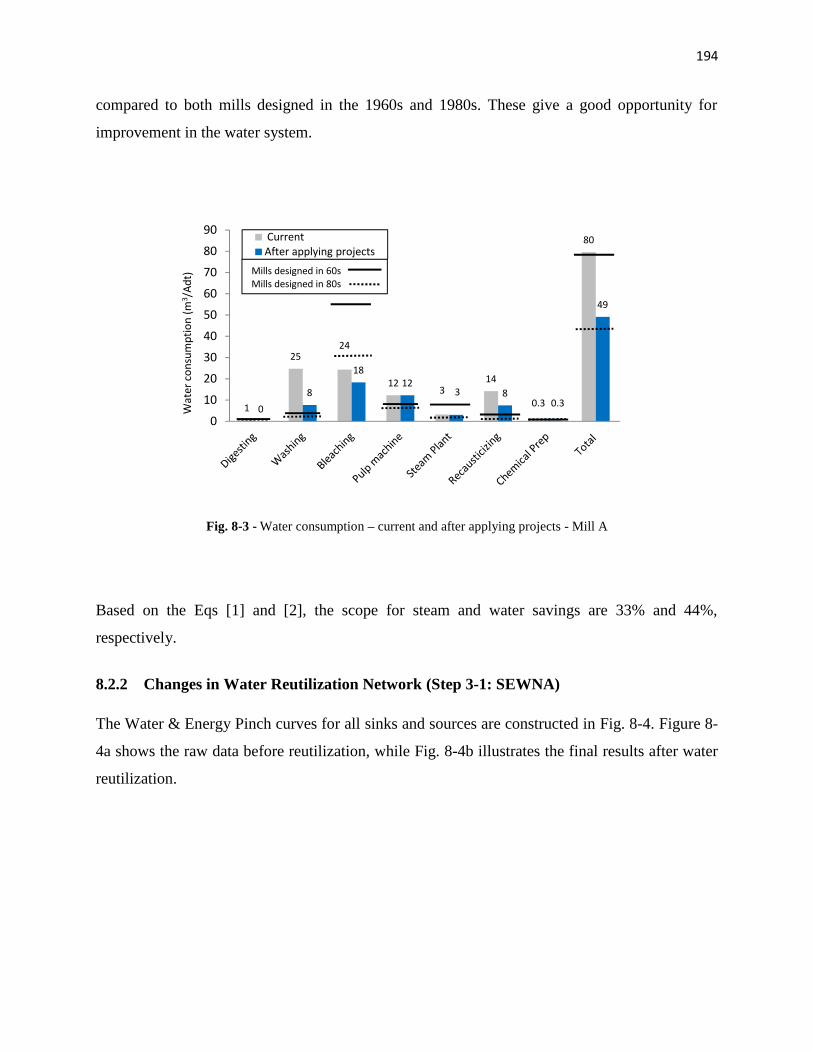
194
compared to both mills designed in the 1960s and 1980s. These give a good opportunity for
improvement in the water system.
Fig. 8-3 - Water consumption – current and after applying projects - Mill A
Based on the Eqs [1] and [2], the scope for steam and water savings are 33% and 44%,
respectively.
8.2.2 Changes in Water Reutilization Network (Step 3-1: SEWNA)
The Water & Energy Pinch curves for all sinks and sources are constructed in Fig. 8-4. Figure 8-
4a shows the raw data before reutilization, while Fig. 8-4b illustrates the final results after water
reutilization.
1
2524
123
14
0.3
80
08
1812
3 80.3
49
0
10
20
30
40
50
60
70
80
90
Wat
er c
onsu
mpt
ion
(m3 /
Adt)
CurrentAfter applying projects
Mills designed in 60sMills designed in 80s

195
Fig. 8-4 - Water & Energy Pinch Curves, (a) before water reutilization, (b) after water reutilization – Mill A
The final changes in water utilization and filtrate reutilization of the whole mill are demonstrated
in Fig. 8-5b to 8-7b. Dashed purple lines show the change in the flowrate of the existing
connection and the dotted red lines show the new connections. The total number of changes that
is carried out in the flowrate of existing connections is 16 while 22 new connections for filtrate
reutilization should be implemented. Total water savings is 948 m3/h that accounts for 38% of
current water consumption. The total effluent decreases by 893 m3/h or 36% of current effluent
production.
0
50
100
150
200
2500
20000
40000
60000
80000
100000
120000
140000
160000
180000
2000000 7000 14000 21000 28000
Cont
amin
ant C
once
ntra
tion
(ppm
)
Flowrate (t/h)
Contaminant- Sink (ppm)
Contaminant- Source (ppm)
Temperature- Source (oC)
Temperature- Sink (oC) T (o C
)
aPinch point
0
50
100
150
200
2500
20000
40000
60000
80000
100000
120000
140000
160000
180000
2000000 7000 14000 21000 28000
Cont
amin
ant C
once
ntra
tion
(ppm
)
Flowrate (t/h)
Contaminant- Sink (ppm)Contaminant- Source (ppm)Temperature- Source (oC)Initial Temperature- Sink (oC)
b
T (o C
)
Pinch point

196
Fig. 8-5 - (a) current, (b) final water utilization and filtrate reutilization in washing and bleaching departments – Mill A; dotted red lines: new connections; dashedpurple lines: the existing connections with change in flowrate (W: washer, FT: filtrate tank, Sep & Scr.: separators and screeners, Deknot: deknotters, R: reactor,
M: steam mixer, PM: pulp machine, ST: steam, NCC-EV: non-clean condensate of evaporation, WW: warm water: FW: fresh water: HW: hot water, Eff.: effluent)
Deknot 93oC 86oC
HW8546 t/h
FT-W#2-484oC
Pulp fromBatch
digestersW #2-4 Sep &
ScrW #1
2138
226
94oC
6 t/hEff-Deknot
91oC
FT- W#189oC
76 224
HW85405 t/h
367
3026
NCC-EV89oC
70oC
177 t/hEff-Sep& Scr
60oC
251853
60oC
WW34239 t/h
W #5
1304 2564
427
42oC
446 t/hEff-W#5
60oCFT-W#1&2-PM
59oC
236 t/h
521 t/hEff-W #2-4
84oC
(a) Current waterutilization & filtrate
reutilization
FT-W #560oC
FW380 t/h
R-D041oC
CH-A
M-Eop
ST
W – D0 54oC
7.9 MW
585 t/hEff-D0 (Acidic
Eff) 41oC
392
FT-WD041oC
1319
WW3415 t/h
790
FT-WE269oC
FT-WD275oC
59 49
R-Eop80oC
CH-B
W – Eop 82oC
151 t/hEff-Eop
(Alkaline Eff)80oC
1158
FT-WEop80oC
1309
HW9282 t/h
WW3415 t/h
236
FT-WD175oC
FW3212 t/h
78
Deknot 93oC84oC
FT-W#2-484oC
Pulp fromBatch
digestersW #2-4 Sep &
ScrW #1
2091
203
94oC
6 t/hEff-Deknot
92oC FT- W#190oC
54 257
509
3026
NCC-EV89oC
85oC
177 t/hEff-Sep& Scr
81oC
251853
81oC
HW73239 t/h
W #5
1118 2564
75oC
17 t/hEff-W#5
80oC
FT-W#1&2-PM78oC
236 t/h
403 t/hEff-W #2-4
84oC
FT-W #580oC
R-D077oC
CH-A
M-EopW – D0 54oC
467 t/hEff-D0 (Acidic
Eff) 78oC
61
FT-WD078oC
1319790
FT-WE281oC
FT-WD283oC
79 29
R-Eop80oC
CH-B
W – Eop 82oC
151 t/hEff-Eop
(Alkaline Eff)80oC
1158
FT-WEop80oC
1309
HW8582 t/h
(b) Modified waterutilization & filtrate
reutilization
Modified –flowrate stream
New connection
23 164
15412
161
185
FT-WD178oC
15
HW85144 t/h
150 37
15
W#1EDR:0.45 0.80 (ideal EDR:0.80)By increase of total water to W#1
from 848 881 t/h

197
Fig. 8-6 - (a) Current, (b) final water utilization and filtrate reutilization in bleaching and pulp machine departments – Mill A; dotted red lines: new connections;dashed purple lines: the existing connections with change in flowrate (W: washer, R: reactor; M: steam mixer, FT: filtrate tank, Cle.: cleaners, Scr.: screeners,PM: pulp machine, Vac. P: vacuum pump, Fil: filter, WW: warm water: FW: fresh water: HW: hot water, CH-A: acidic chemicals, CH-B: base chemicals, ST:
steam, Eff.: effluent)
82oCPulp M-
E2
ST
W – D1R-D175oC 76oC
0.9 MWCH-A
R- E270oC
CH-B
FT-WE269oC
R – D282oC 60oC
90 t/h
71 t/hEff-D275oC
FT-WD275oC
CH-A
59oCW–D2 Scr.W–E2
1568
FT-WD175oC
1716
FW36 t/h
547 1306
SW6598 t/hWW34
1545 1753
21 t/hEff-Scr.
59oC
Cle. 59oC PM
1680
3776622
80oC
ST4.6 MW
97 t/hHW85
(a) Current waterutilization & filtrate
reutilization
M-D1
ST0.9 MW
To FT-WD0
236 t/h
WW3415 t/h
HW8582 t/h
HW8573 t/h
WW3415 t/h
FW331 t/h
70067oC
672
To WeWT58 t/h
To W-D059 t/h
M-D2
ST
70oC
3.6 MW
88 19 t/hEff-Cle.
56oC
62 t/hWW34
117 t/h
FT-W#1&2-PM59oC
W#1&2–PM
SW65
5136
WW3425 t/h
1196
To FT-W#5427 t/h
PM2(80oC)39 t/h
106 t/hWW45
59oC
78716
964FT–PM61oC
ST1.8 MW
82oCPulp M-
E2W – D1R-D175oC 80oC
CH-A
R- E280oC
CH-B
FT-WE281oC
R – D282oC 86oC
90 t/h
FT-WD283oC
CH-A
78oCW–D2 Scr.W–E2
1489 1716
HW8523 t/h
1169 1306
SW8583 t/hHW85
1545 1753
21 t/hEff-Scr.
78oC
Cle. 78oC PM
1680
3776622
80oC
97 t/hHW85
M-D1
ST0.8 MW
To W-D0150 t/h
HW8573 t/h
To WeWT58 t/h
To W-D079 t/h
M-D2
ST
82oC
0.7 MW
19 t/hEff-Cle.
78oC
117 t/h
FT-W#1&2-PM78oC
W#1&2–PM
SW85
5136
HW8525 t/h
1196
To W#1-5 & W-D0 381 t/h
PM2(80oC)39 t/h
168 t/hHW85
77oC
78716
964FT–PM74oC
ST0.2 MW
(b) Modified waterutilization & filtrate
reutilization
Modified –flowrate streamNew connection
79
15
9
77 t/hEff-D178oC
FT-WD178oC
HW8550 t/h
15
56
15

198
Fig. 8-7 - (a) current, (b) final water utilization and filtrate reutilization in scrubber, recausticizing,and steam plant department, - Mill A; dotted red lines: new connections; dashed purple lines: theexisting connections with change in flowrate (Scrub-RB: scrubber of recovery boiler, LMS: lime
mud storage, Scrub-Recaust.: Scrubber of recauticizing, Con. T: condensate tank, Fil: filter)
8.2.3 Synthesis of the performance improvement projects (Step 3-2: EPA)
There is only one performance improvement project at washer #1 as shown in Fig. 8-5b. The
EDR of the washer is 0.46, which is considerably smaller than the ideal one (0.80). To resolve
this and improve the performance of the washer, total filtrate to this washer increases from 848
to 881 t/h.
8.2.4 HEX network changes (Step 3-3: R-HEN)
8.2.4.1 Targeting
The steam consumption of the current condition, after applying SEWNA and EPA, and also after
performing the targeting stages for five different categories of steam users is presented in Table
8-1. The results show that eight NRHS-SH heaters (Table 8-1a) consume 114.4 MW of steam
and cannot be replaced by other heat sources. However, by targeting the new temperature of air
to the dryers, the steam can be reduced to 111.8 MW. There are seven RHS-SH heaters (Table
8-1b) where the steam has been reduced from 57.8 to 55.0 MW using SEWNA and the
Scrub.-Recaust.LMSScrub
- RB
4 t/hFW3
8 t/hFW3
242 t/hFW3
Con.T
96 t/hWW40
(a) Current waterutilization & filtrate
reutilization
Lime Kilncooling
100 t/hFW3
Scrub.-Recaust.LMSScrub
- RB
142 t/hFW3
Con.T
96 t/hHW80
Lime Kilncooling
84Fil 100
100
(b) Modified waterutilization & filtrate
reutilization
Modified –flowrate stream
New connection

199
remainder can also be replaced by other heat sources. In the case of steam injection points, there
are four FHexHS-SI (Table 8-1c) that were completely eliminated using SEWNA (11.9 MW). At
the four NRHS-NFHexHS-SI points (Table 8-1d), the steam consumption cannot be reduced
using the HEN design. The total number of RHS-NFHexHS-SI points is seven (Table 8-1d) and
steam has been decreased from 30.1 to 16.5 MW using SEWNA. It can potentially be declined to
12.0 MW by targeting the new temperature for water to the pulp line.
Table 8-1 - The steam consumption of the current situation, after applying SEWNA, EPA and also thepotential for steam reduction using R-HEN and final steam consumption after HEX network design forall steam users of the mill – Mill A
# EquipmentCurrent(MW)
AfterSEWNA
(MW)
AfterEPA
(MW)
Potential usingR-HEN(MW)
Final after HEXnetwork design
(MW)(a) Non-Replaceable Heat Source-Steam Heater (NRHS-SH)
1 Cooking liquor #1 – Digesting 19.0 19.0 19.0 19.0 19.02 Cooking liquor #2 – Digesting 19.0 19.0 19.0 19.0 19.03 Cooking liquor #3 – Digesting 2.5 2.5 2.5 2.5 2.54 Cooking liquor #4 – Digesting 2.4 2.4 2.4 2.4 2.45 Oil heater – Steam Plant 3.0 3.0 3.0 3.0 3.06 Dryer #1 - PM 15.9 15.9 15.9 14.8 14.87 Dryer #2 - PM 14.5 14.5 14.5 13.0 13.08 Evaporation 38.1 38.1 38.1 38.1 38.1Total NRHS-SH 114.4 114.4 114.4 111.8 111.8
(b) Replaceable Heat Source – Steam Heater (RHS-SH)1 Air heater – Buildings, Dryers & RB 23.9 23.9 23.9 0 02 MP steam air heater –RB 8.7 8.7 8.7 0 6.23 HP steam air heater – RB 9.6 9.6 9.6 0 6.94 HP steam air heater – PB 3.0 3.0 3.0 0 05 Black liquor heater – Steam plant 9.8 9.8 9.8 0 9.86 Heater of hot water 85oC production 1.1 0 0 0 07 Heater of soft water 65oC production 1.7 0 0 0 0Total RHS- SH 57.8 55.0 55.0 0 22.9
(c) Feasible HEX Heat Sink – Steam Injection (FHexHS-SI)1 Filtrate tank of pulp machine - PM 4.6 0 0 0 02 Hot water tank – Recausticizing 5.0 0 0 0 03 Hot water 71oC production 0.2 0 0 0 04 Hot water 92oC production 0.8 0 0 0 05 Soft water 65oC production 1.3 0 0 0 0Total FHexHS-SI 11.9 0 0 0 0
(d)Non-Reducible Heat Source– Non-Feasible HEX Heat Sink – Steam Injection (NRHS-NFHexHS-SI)1 Pre-hydrolysis – Digester (MP) 10.1 10.1 10.1 10.1 10.12 Pre-hydrolysis – Digester (LP) 16.9 16.9 16.9 16.9 16.93 Water treatment 0.1 0.1 0.1 0.1 0.14 Steam plant 8.6 8.6 8.6 8.6 8.6Total NRHS-NFHexHS-SI 35.7 35.7 35.7 35.7 35.7
(e)Reducible Heat Source– Non-Feasible HEX Heat Sink – Steam Injection (RHS-NFHexHS-SI)1 Eop steam mixer – Bleaching 7.9 2.0 2.0 0 02 D1 steam mixer - Bleaching 0.9 1.2 1.2 0.8 0.83 E2 steam mixer – Bleaching 0.9 0.4 0.4 0 04 D2 steam mixer - Bleaching 3.6 1.2 1.2 0.7 0.75 Steam mixer of pulp machine 0.8 0.4 0.4 0 06 Lazy steam shower of pulp machine 1.0 1.0 1.0 0.2 0.27 Deaerator – Steam Plant 15.0 10.3 10.3 10.3 10.3Total NRHS-NFHexHS-SI 30.1 16.5 16.5 12.0 12.0

200
Table 8-2 presents the aggregate results of the theoretical minimum steam requirement
(TMinSR) and theoretical maximum steam saving (TMaxSS) for all five categories as well as the
complete mill. The results suggest that by applying SEWNA and EPA, 11% of current steam
consumption has already been saved and 25% can also potentially be saved by means of R-HEN
while at least 64% of current steam consumption is necessary and should be used by current
steam users.
Table 8-2 - The aggregation of all types of steam users for the current situation after applying NSWEA and EPAplus the targeting and final steam saving by means of R-HEN – Mill A
# Type of steam userCurrent(MW)
AfterSEWNA
(MW)
AfterEPA
(MW)
TMinSR*using R-
HEN(MW)
Final SRafter HEXnetworkdesign(MW)
TMaxSS†using R-
HEN(MW)
Final SSusing HEX
networkdesign (MW)
1 Steamheater
NRHS-SH 114.4 114.4 114.4 111.8 111.8 2.6 2.62 RHS-SH 57.8 55.0 55.0 0 22.9 55.0 32.13 Steam
injection
FHexHS-SI 11.9 0 0 0 0 0 04 NRHS-NFHexHS-SI 35.7 35.7 35.7 35.7 35.7 0 05 RHS-NFHexHS-SI 30.1 16.5 16.5 12.0 12.0 4.5 4.5Total (MW) 249.9 221.6 221.6 159.5 182.4 62.1 39.2Percentage over currentconsumption
- 89% 89% 64% 73% 25% 16%
*TMinSR: Theoretical Minimum Steam Requirement†TMaxSS: Theoretical Maximum Steam Saving
8.2.4.2 HEX network
A part of the existing HEX network that undergoes the modifications is displayed in Fig. 8-8a
and 8-9a. The existing HEX network consists of the air and black liquor (BL) preheating and
warm/hot water production networks using the process stream HEXs and the air and water
heaters. Figure 8-8b and 8-9b illustrate the final HEX network after applying the HEN design
algorithm.
Figure 8-8b shows the new HEN to pre-heat the air and BL for boilers and the dryer. The total
new HEXs that should be purchased are five condensers at the condensing turbine, one HEX to
condense the clean flashed steam of the dryer, and one new air economizer at the recovery boiler
(RB) and one at the power boiler (2nd air economizer of PB). There is also one relocated HEX
(1st condenser of condensing turbine) that is currently used as the air heater for buildings, dryers,
and RB. The current high pressure steam air heater of the power boiler (PB) should be relocated

201
and enlarged to be employed as the second HEX to condense the clean flashed steam of the
dryer. The existing cascade concentrator of black liquor should also be enlarged.
Fig. 8-8 - (a) Current and (b) final air and black liquor (BL) pre-heating network after applying SWAEImethodology – Mill A (RB: recovery boiler, PB: power boiler, PM: pulp machine, eco.: economizer, MP: mediumpressure, HP: high pressure, cascade con.: cascade concentrator, DS: dissolved solid, CFST: clean flashed steam of
dryer, con. Condenser)
Figure 8-9b illustrates the new HEN for the warm/hot water production network. The total new
HEXs for the water production network are six while the area of two existing HEXs should be
increased. The new temperatures of hot and warm water have been incorporated in water
utilization network of Fig. 8-5b to 8-7b.
Air economizerof Dryer #1
55oC
Air heater25oC
Dryer#1
RB MPSteam air
heater
218oCRB
Aireconomizer
of PB158oC
PB
RB
BLheater
Cascadecon.
BL 52%of DS99oC
(a) Current air & BLpre-heating network
(b) Final air & BLpre-heating network
BL 67%of DS115oC
BL 67%of DS121oC RB
BLheater
Cascadecon.
BL 52%of DS99oC
BL 67%of DS115oC
BL 67%of DS121oC
Buildings
Air economizerof Dryer #2
52oCDryer
#2
RB HPSteam air
heater
25oC
135oC
158oC
PB HPSteam air
heater
Fres
h A
ir (-
8oC
)
128oC
Air eco. ofDryer #1
82oC
1st con. of CT25oC
Dryer#1
RB MPSteam air
heater
218oCRB
1st Air eco. of PB
161oC PB
Buildings
RB HPSteam air
heater
135oC
158oC
New HEX
Enlarged existing HEXSteam heater
Existing HEX Relocated HEX
Relocated & Enlarged HEX
2nd con. of CT
25oC
25oC
1st HEX ofCFST-PM
47oC
3rd con.of CT
10oC
25oC
Air eco. ofDryer #2
82oC Dryer#2
47oC
4th con.of CT
13oC
25oC
2nd HEX ofCFST-PM
Air eco.of RB
63oC
5th con.of CT
25oC
2nd Air eco. of PB
128oC
6th con.of CT
25oC
Fres
h A
ir (-
8oC
)
128oC

202
Fig. 8-9 - (a) Current and (b) final water production network after applying SWAEI methodology – Mill A (WWT:warm water tank, HWT: hot water tank, RB: recovery boiler, PB: power boiler, Eff-Cle.: effluent of cleaners)
MP steamcondensate
exchanger- Digesting
FW (3
o C)
Surface condenser#1 &2 of Evap. WWT
(41oC)45oC
Surface condenser ofDigesting
40oC 13oC
HEX #3Scrubber
34oC
45oC
34oC
Blow Exchanger-Digesting
84oC
HW Steamheater
HWT(84oC)
85oC
Proc
ess
HWT ofRecaust.
(80oC)
Steam
To Recaust.
Steam 92oCTo EopWasher
Softwatertank(3oC)
Soft watertank
(54oC)80oCSoft water
steam heater
60oC
Steam
65oCSoft water
Steam
71oCTo pre coat drive filter of Recaust.
Demineralizedwater (3oC)
HEX #1 -Scrubber HEX #2 -Scrubber
25oC 40oCTo Condensate tank – Steam Plant
Water economizer – Dryer #1
45oCTo cleaners - PM
34oC
80oC
(a) Current water production network
New HEX
Steam heater
Existing HEX
Enlarged existing HEX
MP steam condensateexchanger- Digesting
Surface condenser#1 &2 of Evap.
45oC
Surface condenser ofDigesting
40oC
HEX #3Scrubber
34oC
45oC 1st Blowexchanger-Digesting
85oC
Proc
ess
HWT of Recaust.(80oC)
To Recaust.
SoftwaterTank(3oC)
Soft watertank
(85oC)85oC Soft water
Demineralizedwater (3oC)
HEX #1 –Scrubber
HEX #2 –Scrubber
25oC 39oC
To Condensatetank – Steam Plant
Water economizer– Dryer #1
45oC
FW (3
o C)
38oC
Cooler of overflowof FT-W#5
57oC
Alkaline effluentexchanger of Eop
57oC
Acidic effluentExchanger of D0
57oCWWT(44oC)
85oC
HWT(57oC)
Cooler of Eff-Cle. - washing
70oC 80oC
Black liquorcooler
Cooler of overflow of FT-W#2-4
73oC73oC
80oC
34oC
85oC
85oC
(b) Final water production network
2nd Blowexchanger-Digesting
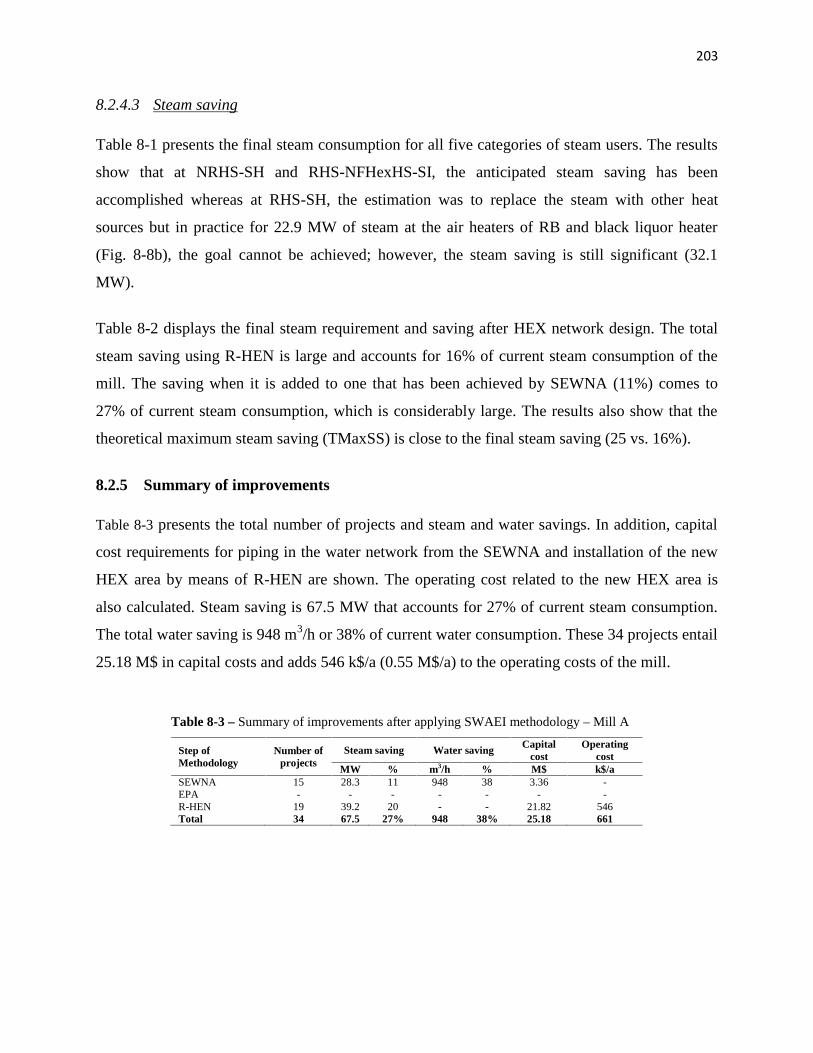
203
8.2.4.3 Steam saving
Table 8-1 presents the final steam consumption for all five categories of steam users. The results
show that at NRHS-SH and RHS-NFHexHS-SI, the anticipated steam saving has been
accomplished whereas at RHS-SH, the estimation was to replace the steam with other heat
sources but in practice for 22.9 MW of steam at the air heaters of RB and black liquor heater
(Fig. 8-8b), the goal cannot be achieved; however, the steam saving is still significant (32.1
MW).
Table 8-2 displays the final steam requirement and saving after HEX network design. The total
steam saving using R-HEN is large and accounts for 16% of current steam consumption of the
mill. The saving when it is added to one that has been achieved by SEWNA (11%) comes to
27% of current steam consumption, which is considerably large. The results also show that the
theoretical maximum steam saving (TMaxSS) is close to the final steam saving (25 vs. 16%).
8.2.5 Summary of improvements
Table 8-3 presents the total number of projects and steam and water savings. In addition, capital
cost requirements for piping in the water network from the SEWNA and installation of the new
HEX area by means of R-HEN are shown. The operating cost related to the new HEX area is
also calculated. Steam saving is 67.5 MW that accounts for 27% of current steam consumption.
The total water saving is 948 m3/h or 38% of current water consumption. These 34 projects entail
25.18 M$ in capital costs and adds 546 k$/a (0.55 M$/a) to the operating costs of the mill.
Table 8-3 – Summary of improvements after applying SWAEI methodology – Mill A
Step ofMethodology
Number ofprojects
Steam saving Water saving Capitalcost
Operatingcost
MW % m3/h % M$ k$/aSEWNA 15 28.3 11 948 38 3.36 -EPA - - - - - - -R-HEN 19 39.2 20 - - 21.82 546Total 34 67.5 27% 948 38% 25.18 661

204
8.2.6 Step 4: Energy Upgrading and Conversion
This mill currently has two back pressure turbines that produce medium (MP) and low (LP)
pressure steam and 19.7 MW of electricity (Fig. 8-10a). In total, 257 MW of steam at different
levels is consumed at the process and 18.3 MW of energy is lost in turbines.
The saved steam is used to reduce the bunker oil consumption at the power boiler. This leads to a
reduction of 20.0 MW of high pressure (HP) steam generation. The remainder of saved steam is
47.5 MW, which is not sufficient for exportation and, hence, two alternatives involving selling
steam to the local district are excluded from the study for this mill. Therefore, the two other
alternatives, including cogeneration only and trigeneration and selling electricity to the grid are
examined and illustrated in Fig. 8-10b and c.

205
Fig. 8-10 - (a)Current cogeneration, (b) Alt. 1, (c) Alt. 2 – Mill A (G: generator, C: condenser, A: absorber, E,evaporator, Gen.: turbine generator)
Gen.
Electricity
MP Steam
MP Steamto process
Gen.
Electricity
LP Steamto process
MP Back-PressureTurbine
LP Back-PressureTurbine
178.5 MW65.9 MW
15.9 MW 3.8 MW275.3 MW
HP Steamfrom boilers
(a) Current – Cogeneration
HP Steamto process12.6 MW
184.6 MW
78.1MW
64.0 MW
Gen.
Electricity
MP Steam
MP Steamto process
Gen.
Electricity
LP Steam
Gen.
Electricity
LP Steamto process
MP Back-PressureTurbine
LP Back-PressureTurbine
CondensateTurbine
Condensate
116.6 MW62.9 MW
16.0 MW 4.2 MW 8.0 MW255.3 MW
HP Steamfrom boilers
HP Steamto process6.9 MW
185.4 MW
62.7MW
42.0 MW
(b) Alt. 1 - Cogeneration and selling electricity to grid
Gen.
Electricity
MP Steam
MP Steamto process
Gen.
Electricity
LP Steam
Gen.
Electricity
LP Steamto process
MP Back-PressureTurbine
LP Back-PressureTurbine
CondensateTurbine
Condensate
116.6 MW62.9 MW
12.0 MW 1.8 MW 14.4 MW255.3 MW
HP Steamfrom boilers
HP Steamto process6.9 MW
138.3 MW
110.1MW
E A
C G
QE
QG
QA+ QC
Non-cleansteam of
Evaporation
121.3 MW37.7 MW
LP Steam
154.3 MW
LP Steam
(c) Alt. 2 - Trigeneration and selling electricity to grid

206
In Alt. 1 (Fig. 8-10b) by installation of a condensing turbine, 8.5 MW of extra electricity can be
generated.
There is only one source of non-clean steam (Fig. 8-10c) that can be utilized at the evaporator
(E) of LiBr/H2O AHP with the coefficient of performance (COP) of 1.55 (Marinova et al., 2007)
and generate low pressure (LP) steam at the absorber (A) and condenser (C). This non-clean
steam is currently condensed at surface condensers #1 and 2 of evaporation to produce warm
water (Fig. 8-9). Therefore, to produce this warm water, the adjustment to replace the non-clean
steam with other heat sources in the HEX network is considered. The MP steam (121.3 MW)
from the MP back pressure turbine is used as the heat deriver at the generator (G) of AHP and in
total can save 33 MW (13%) of steam consumption. However, this excess saving does not result
in extra electricity generation in comparison to Alt. 1 (28.2 vs. 28.2 MW). The reason for no
further electricity generation is that the HP steam is used to produce MP steam rather than being
introduced to the MP back pressure turbine. In addition, a large quantity of MP steam is used to
upgrade the heat at AHP, and the quantity of steam going toward the LP back pressure turbine is
also reduced.
The Alt. 1 is more attractive for implementation. The economic aspects of both alternatives are,
however, presented in the next section. The total capital cost of Alt. 1 is 8.03 M$ to purchase a
new condensing turbine with 431 k$/a of operating costs while the capital cost of cogenerations
and AHP of Alt. 2 are respectively 10.95 and 60.12 M$ and add around 2.2 M$/a in operating
costs.
8.2.7 Economic analysis of the two alternatives
As mentioned earlier, the saved steam of 67.5 MW can be used to reduce 52 t/d of bunker oil
consumption. The remainder of steam is used according to two alternatives (Fig. 8-10b and c).
The following economic data of the mill and assumptions are employed for the profitability
calculation on the 2012 basis:
o The bunker oil price is 650 $/t.
o The price of fresh water is 0.038 $/m3.
o The price for effluent treatment is 0.10 $/m3.

207
o The selling price of electricity to the grid is 90 $/MWhr (Mateos-Espejel et al., 2011c).
o Number of operating days is 354 (Browne et al., 2011).
The total reduction in effluent production, water and bunker oil savings, and electricity
generation are translated into costs and summarized in Table 8-4. The bunker oil savings is the
biggest portion of net profit in both alternatives. Purchasing the new HEX area and condensing
turbine in Alt. 1 are the main contributors to total capital costs. The capital cost of Alt. 2 is
around three fold of Alt.1 and is due to purchasing very expensive AHP. The payback period of
Alt. 1, which is the installation of cogeneration and selling electricity to the grid, is short and
takes 1.8a to recover all the capital costs. On the other hand, the payback period of Alt. 2 with
trigeneration and selling electricity to the grid is long (5.8a). Therefore, the short payback period,
low capital cost, and higher net profit make the Alt. 1 extremely attractive for investment.
Table 8-4 - The economic benefit of savings from different resources – Mill A
EffluentReduction
(m3/h)
Watersaving(m3/h)
ExcessSteam(MW)
Bunkeroil
saving(t/d)
Extraelectricitygenerationfor selling
(MW)
EffluentReduction
(M$/a)
Watersaving(M$/a)
Alt. 1893
(36%)948
(38%)67.5
(27%)52 8.5 0.8 0.3
Alt. 2893
(36%)948
(38%)67.5
(27%)52 8.5 0.8 0.3
Bunker oilsaving(M$/a)
Sellingextra
electricity(M$/a)
Increase inoperating
cost (M$/a)
Netprofit(M$/a)
Total Capitalcost (M$)
Payback period(a)
Alt. 1 12.0 6.5 1.0 18.6 33.2 1.8Alt. 2 12.0 6.5 2.7 16.9 97.0 5.8
8.2.8 Step 5: Implementation strategy
According to the profitability analysis, Alt. 1 is more promising for implementation. To
implement all the energy and water projects and cogeneration that are involved in Alt. 1, a two-
phase strategy is employed (Table 8-5):
Phase 1: Reduction of bunker oil consumption from power boiler
To perform this phase, all water reutilization projects that have been shown in Fig. 8-5 to
9-7 and also the HEX network of the water production network that has been illustrated
in Fig. 8-9 should be implemented. These projects require 15.6 M$ of investment costs

208
and will lead to 32.8 MW of steam saving and result in 12.8 M$/a in net profits with the
short payback period of 1.2a.
Phase 2: Extra electricity generation
The HEX network of the air production network that has been shown in Fig. 8-8 is
proposed to be implemented at this phase. This results in 34.7 MW of additional steam
saving that can be used to generate 8.5 MW of extra electricity by the installation of a
new condensing turbine as shown in Fig. 8-10b. The extra electricity is assumed to be
sold to the grid and to generate new profit of 5.8 M$/a. Implementation of this phase
entails 17.6 M$ of investment for HEXs and the turbine and the payback period is 3.0a
that is much longer than the phase 1. However, the combination of two phases leads to a
short payback period of 1.8a.
Table 8-5 - Strategy to implement Alt. 1 – Mill A
Projects to be doneSteamsaving(MW)
Capitalcost(M$)
Netprofit(M$/a)
Paybackperiod
(a)Phase 1: Reduction of80% of bunker oilconsumption
1-All water reutilization2-HEXs of water network
32.8 15.6 12.8 1.2
Phase 2: Extraelectricity generation
3-HEXs of air network4-Condensing turbine
34.7 17.6 5.8 3.0
Total 67.5 33.2 18.6 1.8
8.2.9 Step 6: Post benchmarking
Figure 8-2 and 8-3 demonstrate the post-benchmarking results if all the projects are
implemented. Figure 8-2 displays that the steam consumption at bleaching, the pulp machine,
and other users has been significantly reduced and this has brought the total steam consumption
of the portion of Kraft paper pulping with batch digester lower than the 25th percentile of
Canadian mills. Figure 8-3 also shows that the water consumption has been considerably reduced
at washing, bleaching, and recausticizing. The total water consumption has been brought close to
average mills designed in the 1980s.
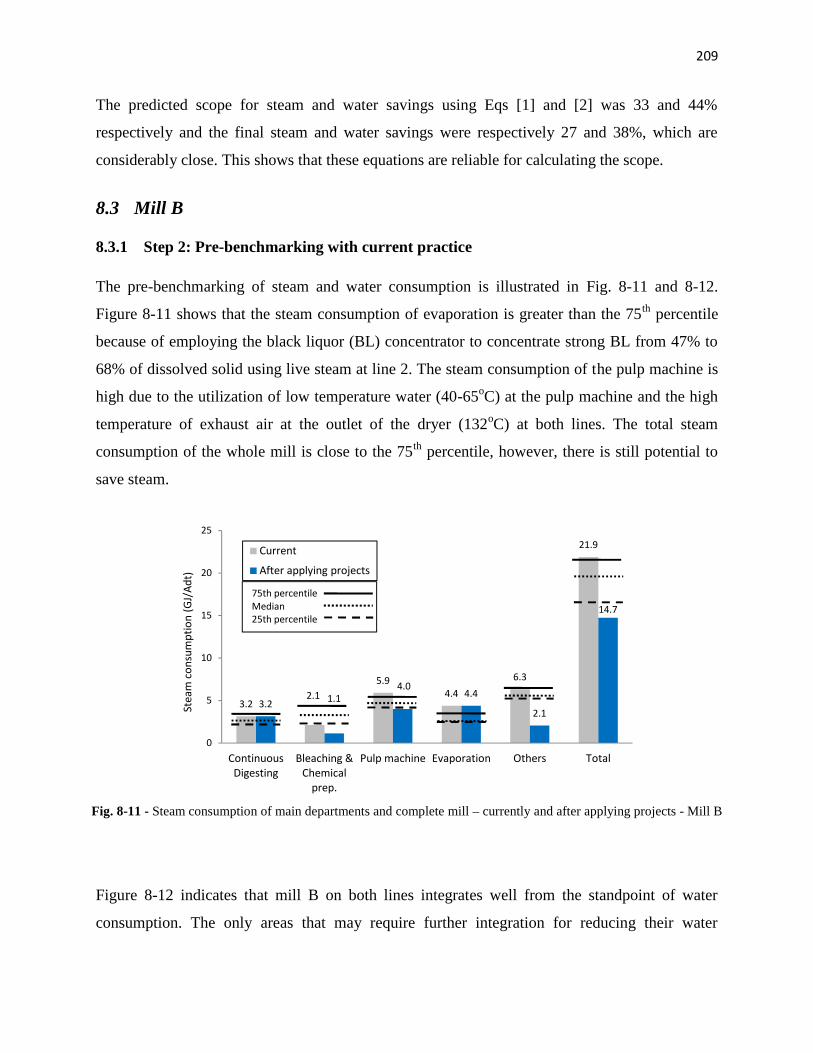
209
The predicted scope for steam and water savings using Eqs [1] and [2] was 33 and 44%
respectively and the final steam and water savings were respectively 27 and 38%, which are
considerably close. This shows that these equations are reliable for calculating the scope.
8.3 Mill B
8.3.1 Step 2: Pre-benchmarking with current practice
The pre-benchmarking of steam and water consumption is illustrated in Fig. 8-11 and 8-12.
Figure 8-11 shows that the steam consumption of evaporation is greater than the 75th percentile
because of employing the black liquor (BL) concentrator to concentrate strong BL from 47% to
68% of dissolved solid using live steam at line 2. The steam consumption of the pulp machine is
high due to the utilization of low temperature water (40-65oC) at the pulp machine and the high
temperature of exhaust air at the outlet of the dryer (132oC) at both lines. The total steam
consumption of the whole mill is close to the 75th percentile, however, there is still potential to
save steam.
Fig. 8-11 - Steam consumption of main departments and complete mill – currently and after applying projects - Mill B
Figure 8-12 indicates that mill B on both lines integrates well from the standpoint of water
consumption. The only areas that may require further integration for reducing their water
3.22.1
5.94.4
6.3
21.9
3.2 1.14.0
4.4
2.1
14.7
0
5
10
15
20
25
ContinuousDigesting
Bleaching &Chemical
prep.
Pulp machine Evaporation Others Total
Stea
m c
onsu
mpt
ion
(GJ/
Adt)
Current
After applying projects
75th percentileMedian25th percentile
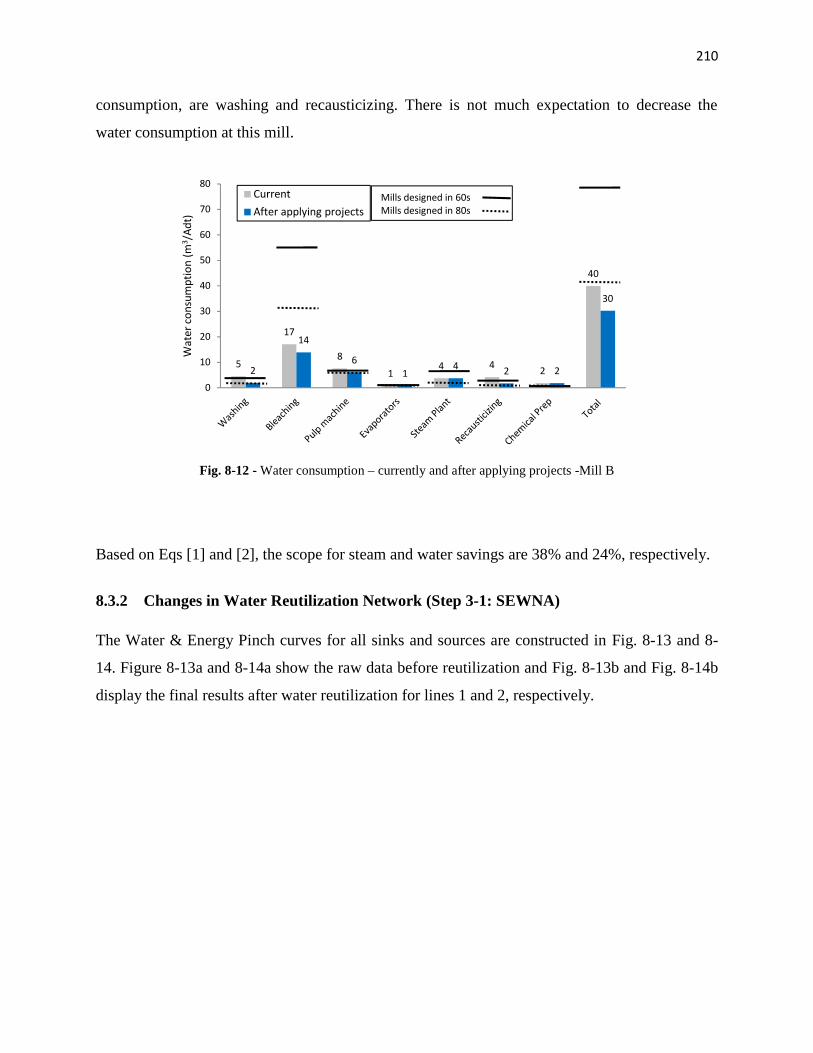
210
consumption, are washing and recausticizing. There is not much expectation to decrease the
water consumption at this mill.
Fig. 8-12 - Water consumption – currently and after applying projects -Mill B
Based on Eqs [1] and [2], the scope for steam and water savings are 38% and 24%, respectively.
8.3.2 Changes in Water Reutilization Network (Step 3-1: SEWNA)
The Water & Energy Pinch curves for all sinks and sources are constructed in Fig. 8-13 and 8-
14. Figure 8-13a and 8-14a show the raw data before reutilization and Fig. 8-13b and Fig. 8-14b
display the final results after water reutilization for lines 1 and 2, respectively.
5
17
8
14 4 2
40
2
14
61
4 2 2
30
0
10
20
30
40
50
60
70
80W
ater
con
sum
ptio
n (m
3 /Ad
t)CurrentAfter applying projects
Mills designed in 60sMills designed in 80s

211
Fig. 8-13 - Water & Energy Pinch Curves, (a) before water reutilization, (b) after water reutilization – Mill B, Line 1
0
20
40
60
80
100
120
140
160
180
2000
20000
40000
60000
80000
100000
120000
140000
160000
180000
2000000 6000 12000 18000 24000
Cont
amin
ant C
once
ntra
tion
(ppm
)
Flowrate (t/h)
Contaminant-Sink (ppm)Contaminant-Source (ppm)Temperature-Source (oC)Temperature-Sink (oC) T
(o C)
aPinch point
0
20
40
60
80
100
120
140
160
180
2000
20000
40000
60000
80000
100000
120000
140000
160000
180000
2000000 6000 12000 18000 24000
Cont
amin
ant C
once
ntra
tion
(ppm
)
Flowrate (t/h)
Contaminant-Sink (ppm)Contaminant-Source (ppm)Temperature-Source (oC)Initial Temperature-Sink (oC) T
(o C)
Pinch pointb

212
Fig. 8-14 - Water & Energy Pinch Curves, (a) before water reutilization, (b) after water reutilization – Mill B, Line 2
The final changes in water utilization and filtrate reutilization of line 1 are demonstrated in Fig.
8-15b to 8-17b. Figure 8-18b to 8-20b also illustrate the changes in line 2. The total number of
changes that is carried out in the flowrate of the existing connections is 28 and 17 for line 1 and
2, respectively. The total new connections required at line 1 and 2 are 29 and 8, respectively.
With these changes, 350 (23%) and 348 m3/h (25%) of water can be respectively saved at lines 1
and 2. The total effluent reduction of the mill is 706 m3/h (25%).
0
20
40
60
80
100
120
140
160
180
2000
20000
40000
60000
80000
100000
120000
140000
160000
180000
2000000 8000 16000 24000 32000
Cont
amin
ant c
once
ntra
tion
(ppm
)
Flowrate (t/h)
Contaminant-Sink (ppm)
Contaminant-Source (ppm)
Temperature-Source (oC)
Temperature-Sink (oC) T (o C
)
Pinch point
a
0
20
40
60
80
100
120
140
160
180
2000
20000
40000
60000
80000
100000
120000
140000
160000
180000
200000
0 8000 16000 24000 32000
Cont
amin
ant C
once
ntra
tion
(ppm
)
Flowrate (t/h)
Contaminant-Sink (ppm)
Contaminant-Source (ppm)
Temperature-Source (oC)
Initial Temperature-Sink (oC)
T (o C
)
b
Pinch point
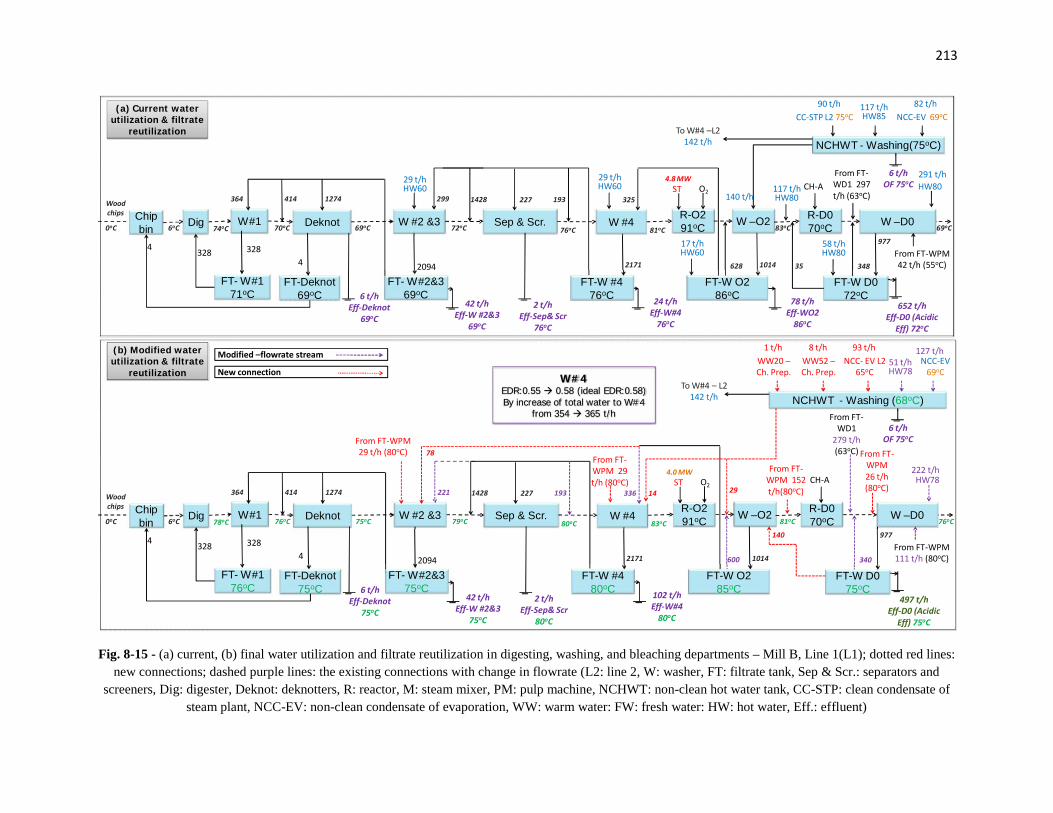
213
Fig. 8-15 - (a) current, (b) final water utilization and filtrate reutilization in digesting, washing, and bleaching departments – Mill B, Line 1(L1); dotted red lines:new connections; dashed purple lines: the existing connections with change in flowrate (L2: line 2, W: washer, FT: filtrate tank, Sep & Scr.: separators and
screeners, Dig: digester, Deknot: deknotters, R: reactor, M: steam mixer, PM: pulp machine, NCHWT: non-clean hot water tank, CC-STP: clean condensate ofsteam plant, NCC-EV: non-clean condensate of evaporation, WW: warm water: FW: fresh water: HW: hot water, Eff.: effluent)
DeknotDig 69oCChipbin 6oC 72oC0oC
Woodchips
Sep & Scr.W #2 &3
1274
FT-Deknot69oC
4
74oC
6 t/hEff-Deknot
69oC
2094
HW6029 t/h
299
2 t/hEff-Sep& Scr
76oC
2271428
76oC
HW6029 t/h
W #4
2171
325
81oC
24 t/hEff-W#4
76oC
(a) Current waterutilization & filtrate
reutilization
FT-W #476oC
4
W#1
FT- W#171oC
328328
70oC
414364
42 t/hEff-W #2&3
69oC
FT- W#2&369oC
193
HW85117 t/h
NCC-EV 69oC82 t/h
CC-STP L2 75oC90 t/h
6 t/hOF 75oC
NCHWT - Washing(75oC)
R-O291oC
O2ST4.8 MW
W –O2
1014628
78 t/hEff-WO2
86oC
FT-W O286oC
HW6017 t/h
140 t/h
To W#4 –L2142 t/h
83oCR-D070oC
CH-A
977
348
FT-W D072oC
HW8058 t/h
652 t/hEff-D0 (Acidic
Eff) 72oC
HW80117 t/h
35
W –D069oC
HW80291 t/h
From FT-WPM42 t/h (55oC)
From FT-WD1 297t/h (63oC)
DeknotDig 75oCChipbin 6oC 79oC0oC
Woodchips
Sep & Scr.W #2 &3
1274
FT-Deknot75oC
4
78oC
6 t/hEff-Deknot
75oC
2094
221
2 t/hEff-Sep& Scr
80oC
2271428
80oCW #4
2171
336
83oC
102 t/hEff-W#4
80oC
FT-W #480oC
4
W#1
FT- W#176oC
328328
76oC
414364
42 t/hEff-W #2&3
75oC
FT- W#2&375oC
193
HW7851 t/h NCC-EV
69oC
127 t/hNCC- EV L2
65oC
93 t/h
6 t/hOF 75oC
R-O291oC
O2ST4.0 MW
W –O2
1014600
FT-W O285oC
To W#4 – L2142 t/h
81oCR-D070oC
CH-A
977
340
FT-W D075oC
497 t/hEff-D0 (Acidic
Eff) 75oC
W –D076oC
HW78222 t/h
From FT-WPM111 t/h (80oC)
From FT-WD1
279 t/h(63oC)
(b) Modified waterutilization & filtrate
reutilization
Modified –flowrate stream
New connection
From FT-WPM29 t/h (80oC) 78
From FT-WPM 29t/h (80oC)
14
WW52 –Ch. Prep.
8 t/hWW20 –Ch. Prep.
1 t/h
NCHWT - Washing (68oC)
29
140
From FT-WPM 152t/h(80oC)
From FT-WPM26 t/h(80oC)
W#4EDR:0.55 0.58 (ideal EDR:0.58)By increase of total water to W#4
from 354 365 t/h
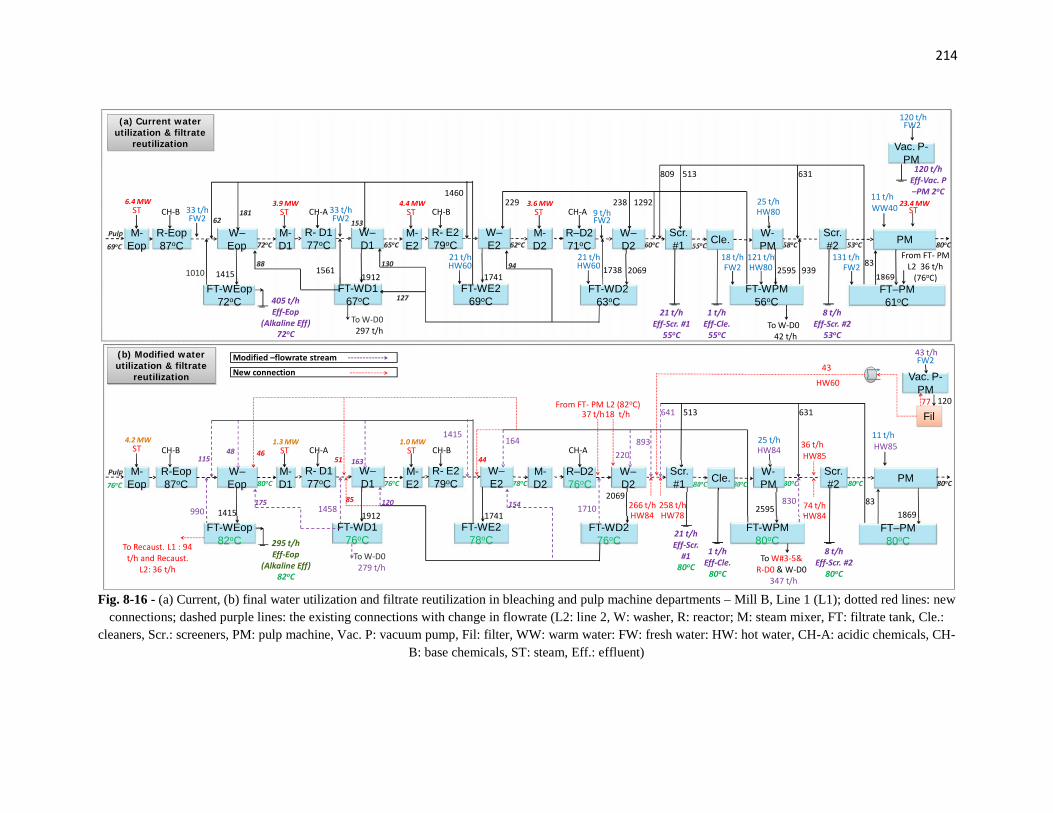
214
Fig. 8-16 - (a) Current, (b) final water utilization and filtrate reutilization in bleaching and pulp machine departments – Mill B, Line 1 (L1); dotted red lines: newconnections; dashed purple lines: the existing connections with change in flowrate (L2: line 2, W: washer, R: reactor; M: steam mixer, FT: filtrate tank, Cle.:
cleaners, Scr.: screeners, PM: pulp machine, Vac. P: vacuum pump, Fil: filter, WW: warm water: FW: fresh water: HW: hot water, CH-A: acidic chemicals, CH-B: base chemicals, ST: steam, Eff.: effluent)
69oC
Pulp M-D1
ST
W–Eop
R-Eop87oC 72oC
3.9 MWCH-B
R- D177oC
CH-A
FT-WD167oC
R–D271oC 60oC
FT-WD263oC
CH-A
55oCW–D2
Scr.#1
W–D1
1010 1415 15611912
1738 2069
21 t/hEff-Scr. #1
55oC
58oC PM
1869
1292
80oC
11 t/hWW40
(a) Current waterutilization & filtrate
reutilization
M-Eop
ST6.4 MW
M-D2
ST
62oC
3.6 MW 25 t/h
FT-WPM56oC
W-PM
HW80
259583
FT–PM61oC
ST23.4 MW
FW233 t/h
62181
88
FW233 t/h
405 t/hEff-Eop
(Alkaline Eff)72oC
FT-WEop72oC
M-E2
ST
65oC
4.4 MW
R- E279oC
CH-B
FT-WE269oC
W–E2
1460
1741130 HW60
21 t/h
153
94
127
FW2
HW6021 t/h
1 t/hEff-Cle.
55oC
Cle.121 t/hHW80 939
18 t/hFW2
To W-D0297 t/h
238229
To W-D042 t/h
513809
Scr.#2
8 t/hEff-Scr. #2
53oC
53oC
631
From FT- PML2 36 t/h
(76oC)
9 t/h
131 t/hFW2
Vac. P-PM
120 t/hFW2
120 t/hEff-Vac. P–PM 2oC
76oC
Pulp M-D1
ST
W–Eop
R-Eop87oC 80oC
1.3 MWCH-B
R- D177oC
CH-A
FT-WD176oC
R–D276oC
FT-WD276oC
CH-A
80oCW–D2
W–D1
990 1415 14581912
17102069
21 t/hEff-Scr.
#180oC
80oC PM
1869
893
80oC
11 t/hHW85
M-Eop
ST4.2 MW
M-D278oC
25 t/h
W-PM
HW84
259583
FT–PM80oC
11548
175
295 t/hEff-Eop
(Alkaline Eff)82oC
FT-WEop82oC
M-E2
ST
76oC
1.0 MW
R- E279oC
CH-B
FT-WE278oC
W–E2
1415
1741120
163
154
80oC
1 t/hEff-Cle.
80oC
Cle.
830
To W-D0279 t/h
220164
To W#3-5&R-D0 & W-D0
347 t/h
513641
Scr.#2
8 t/hEff-Scr. #2
80oC
80oC
631From FT- PM L2 (82oC)
(b) Modified waterutilization & filtrate
reutilization
Modified –flowrate streamNew connection
46
85
51 44
37 t/h18 t/h
266 t/hHW84
258 t/hHW78
Scr.#1
HW60
43 t/hFW2
Fil77
43Vac. P-
PM
36 t/hHW85
74 t/hHW84
To Recaust. L1 : 94t/h and Recaust.
L2: 36 t/h
120
FT-WPM80oC

215
Fig. 8-17 - (a) current, (b) final water utilization and filtrate reutilization at recausticizing - Mill B,Line 1 (L1); dotted red lines: new connections; dashed purple lines: the existing connections withchange in flowrate (L2: line 2, DVScrEx: dust vent scrubber exchanger, NCHWT-Recaust.: non-
clean hot water tank of recausticizing, FT-WEop: filtrate tank of washer Eop, NCC-Evap.: non-cleancondensate of evaporation, CC: clean condensate, FW: fresh water: HW: hot water, Eff.: effluent)
Recaust. L1
DVScrEx
23 t/hFW2
24 t/hFW2
(a) Current waterutilization & filtrate
reutilization
24 t/hEff-lime Kiln 8oC
21 t/hEff-lime Kiln-L2 8oC
Lime Kilncooling
NCHWT-Recaust. L1 (74oC)
NCC-Evap. L265oC
153 t/hNCC-Evap. L1
69oC
45 t/h 46 t/hHW95.L1
73 t/hHW80.L2
CC-Recaut. L1120oC
6 t/h
231 t/h (85oC)To Recaust. –L2
89 t/h(85oC)
Steam
Recaust.
DVScrEx
13 t/hFW2
Lime Kilncooling
NCHWT-Recaust. L1 (74oC)
NCC-Evap. L265oC
117 t/h 73 t/hHW85
137 t/h
23
1
10 t/hFrom lime kiln .L2
8oC
94 t/hFrom FT-WEop. L1
82oC
To Recaust. –L253 t/h
(b) Modified waterutilization & filtrate
reutilization
Modified –flowrate stream
New connection
85oC

216
Fig. 8-18 - (a) current, (b) final water utilization and filtrate reutilization in digesting, washing, and bleaching departments – Mill B, Line 2 (L2); dotted red lines:new connections; dashed purple lines: the existing connections with change in flowrate (L1: line 1, R: reactor, W: washer, FT: filtrate tank, Sep & Scr.: separators
and screeners, Dig: digester, Deknot: deknotters, NCHWT: non-clean hot water tankWW: warm water: FW: fresh water: HW: hot water, Eff.: effluent)
DeknotDig 81oCChipbin 2oC0oC
Woodchips
500
21 23 t/hEff-Sep& Scr.
80oC
81oC W #3
2644
448
76oC
59 t/hEff-W#3
80oC
(a) Current waterutilization & filtrate
reutilization
FT-W #380oC
1
W#1&2
414369
85oC
1268414
W #4
1238673
FT-W #474oC
FromNCHWT -
washing L1(75oC)142 t/h
72oC
R-D070oC
CH-A
2643
1406
FT-W D065oC
295 t/hEff-D0 (Acidic
Eff) 72oC
HW6512 t/h
1026
W –D065oC
HW65136 t/h
70oC
113oC Sep & Scr.
21
152 271
89
To WBLT45 t/h
FT- W#1 &2104oC
WW5012 t/h
HW6583 t/h
FT-Deknot80oC
WW5089 t/h
174 t/h
From Mix. Of FT-WD1 & HW65
(70oC)22 t/h
DeknotDig 80oCChipbin 2oC0oC
Woodchips
500
21 23 t/hEff-Sep& Scr.
79oC
79oC W #3
2644
448
74oC
59 t/hEff-W#3
79oC
FT-W #379oC
1
W#1&2
414369
90oC
1268414
W #4
1238673
FT-W #472oC
FromNCHWT -washingL1 (68oC)237 t/h
72oC
R-D071oC
CH-A
2643
1406
FT-W D072oC
295 t/hEff-D0 (Acidic
Eff) 72oC
HW786 t/h
1026
W –D074oC
HW78170 t/h
70oC
113oC Sep & Scr.
21
152 271
89
To WBLT45 t/h
FT- W#1 &2104oC
FT-Deknot80oC
HW7295 t/h
140 t/h
From FT-WD1(70oC)
22 t/h
(b) Modified waterutilization & filtrate
reutilization
Modified –flowrate stream
New connection
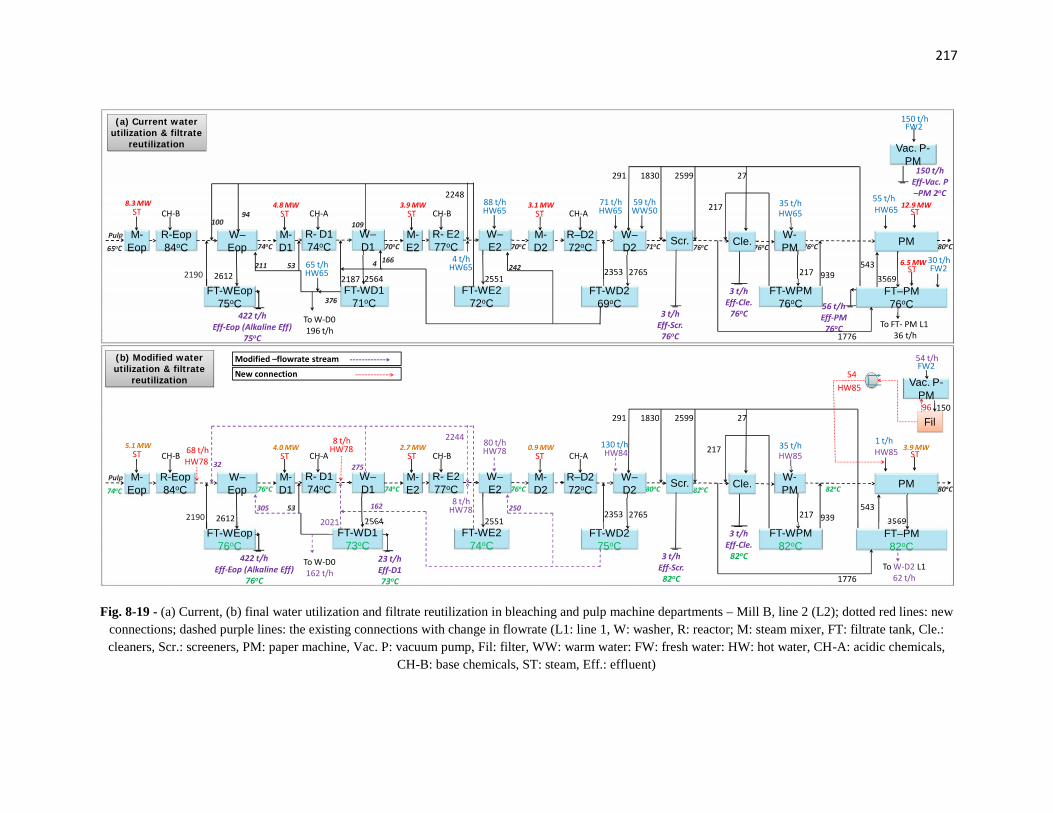
217
Fig. 8-19 - (a) Current, (b) final water utilization and filtrate reutilization in bleaching and pulp machine departments – Mill B, line 2 (L2); dotted red lines: newconnections; dashed purple lines: the existing connections with change in flowrate (L1: line 1, W: washer, R: reactor; M: steam mixer, FT: filtrate tank, Cle.:cleaners, Scr.: screeners, PM: paper machine, Vac. P: vacuum pump, Fil: filter, WW: warm water: FW: fresh water: HW: hot water, CH-A: acidic chemicals,
CH-B: base chemicals, ST: steam, Eff.: effluent)
65oC
Pulp M-D1
ST
W–Eop
R-Eop84oC 74oC
4.8 MWCH-B
R- D174oC
CH-A
FT-WD171oC
R–D272oC 71oC
FT-WD269oC
CH-A
76oCW–D2 Scr.W–
D1
2190 2612 2187 25642353 2765
3 t/hEff-Scr.
76oC
76oC PM
3569
80oC
55 t/hHW65
(a) Current waterutilization & filtrate
reutilization
M-Eop
ST8.3 MW
M-D2
ST
70oC
3.1 MW 35 t/h
FT-WPM76oC
W-PM
HW65
217543
ST12.9 MW
10094
211
422 t/hEff-Eop (Alkaline Eff)
75oC
FT-WEop75oC
M-E2
ST
70oC
3.9 MW
R- E277oC
CH-B
FT-WE272oC
W–E2
2248
2551
166HW654 t/h
109
242
76oC
3 t/hEff-Cle.
76oC
Cle.
939
1830
56 t/hEff-PM
76oC To FT- PM L136 t/h
HW6565 t/h
376
53
To W-D0196 t/h
4
HW6588 t/h
291
HW6571 t/h
WW5059 t/h
2599
217
27
ST6.5 MW 30 t/h
FW2
FT–PM76oC
1776
Vac. P-PM
150 t/hFW2
150 t/hEff-Vac. P–PM 2oC
74oC
Pulp M-D1
ST
W–Eop
R-Eop84oC 76oC
4.0 MWCH-B
R- D174oC
CH-A
R–D272oC 80oC
FT-WD275oC
CH-A
82oCW–D2 Scr.W–
D1
2190 2612 2021 25642353 2765
3 t/hEff-Scr.
82oC
82oC PM
3569
80oC
1 t/hHW85
M-Eop
ST5.1 MW
M-D2
ST
76oC
0.9 MW 35 t/h
FT-WPM82oC
W-PM
HW85
217543
ST3.9 MW
32
305
422 t/hEff-Eop (Alkaline Eff)
76oC
FT-WEop76oC
M-E2
ST
74oC
2.7 MW
R- E277oC
CH-B
FT-WE274oC
W–E2
2244
2551HW788 t/h
275
250
3 t/hEff-Cle.
82oC
Cle.
939
1830
To W-D2 L162 t/h
53
To W-D0162 t/h
162
HW7880 t/h
291
HW84130 t/h
2599
217
27
FT–PM82oC
1776
HW7868 t/h HW78
8 t/h
23 t/hEff-D173oC
FT-WD173oC
HW85
54 t/hFW2
Fil96
54Vac. P-
PM150
(b) Modified waterutilization & filtrate
reutilization
Modified –flowrate stream
New connection
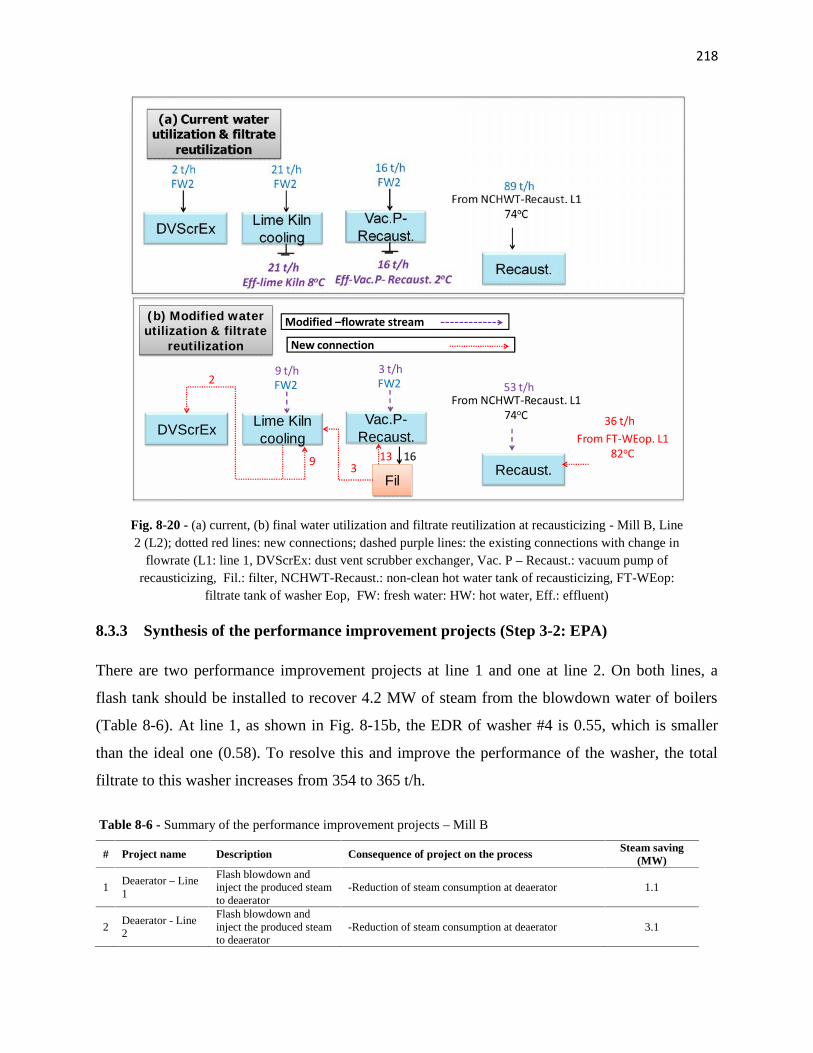
218
Fig. 8-20 - (a) current, (b) final water utilization and filtrate reutilization at recausticizing - Mill B, Line2 (L2); dotted red lines: new connections; dashed purple lines: the existing connections with change in
flowrate (L1: line 1, DVScrEx: dust vent scrubber exchanger, Vac. P – Recaust.: vacuum pump ofrecausticizing, Fil.: filter, NCHWT-Recaust.: non-clean hot water tank of recausticizing, FT-WEop:
filtrate tank of washer Eop, FW: fresh water: HW: hot water, Eff.: effluent)
8.3.3 Synthesis of the performance improvement projects (Step 3-2: EPA)
There are two performance improvement projects at line 1 and one at line 2. On both lines, a
flash tank should be installed to recover 4.2 MW of steam from the blowdown water of boilers
(Table 8-6). At line 1, as shown in Fig. 8-15b, the EDR of washer #4 is 0.55, which is smaller
than the ideal one (0.58). To resolve this and improve the performance of the washer, the total
filtrate to this washer increases from 354 to 365 t/h.
Table 8-6 - Summary of the performance improvement projects – Mill B
Recaust.
DVScrEx
2 t/hFW2
21 t/hFW2
(a) Current waterutilization & filtrate
reutilization
21 t/hEff-lime Kiln 8oC
Lime Kilncooling
16 t/hFW2
16 t/hEff-Vac.P- Recaust. 2oC
Vac.P-Recaust.
89 t/hFrom NCHWT-Recaust. L1
74oC
Recaust.
DVScrEx
9 t/hFW2
Lime Kilncooling
3 t/hFW2
Vac.P-Recaust.
53 t/hFrom NCHWT-Recaust. L1
74oC
2
Fil
13 169 3
From FT-WEop. L182oC
36 t/h
(b) Modified waterutilization & filtrate
reutilization
Modified –flowrate stream
New connection
# Project name Description Consequence of project on the process Steam saving(MW)
1Deaerator – Line1
Flash blowdown andinject the produced steamto deaerator
-Reduction of steam consumption at deaerator 1.1
2Deaerator - Line2
Flash blowdown andinject the produced steamto deaerator
-Reduction of steam consumption at deaerator 3.1
219
8.3.4 HEX network changes (Step 3-3: R-HEN)
8.3.4.1 Targeting
The steam consumption of current conditions, after applying SEWNA and EPA, and also after
performing the targeting stages for five different categories of steam users of lines 1 and 2 is
respectively presented in Table 8-7 and 8-8.
For line 1, the results show that four NRHS-SH heaters (Table 8-7a) consume 72.1 MW of steam
that cannot be replaced by other heat sources. There are four RHS-SH heaters (Table 8-7b)
where the steam has been reduced from 32.3 to 3.1 MW using SEWNA and the remainder can
also be replaced by other heat sources. In the case of steam injection points, there is no FHexHS-
SI (Table 8-7c). At the two NRHS-NFHexHS-SI points (Table 8-7d), the steam consumption
cannot be reduced using the HEN design. The total number of RHS-NFHexHS-SI points is eight
(Table 8-7e) and steam has been decreased from 66.2 to 49.8 MW using two other methods
(SEWNA and EPA). It can potentially be decreased to 17.4 MW by targeting the new
temperature for water to the pulp line and deaerator.
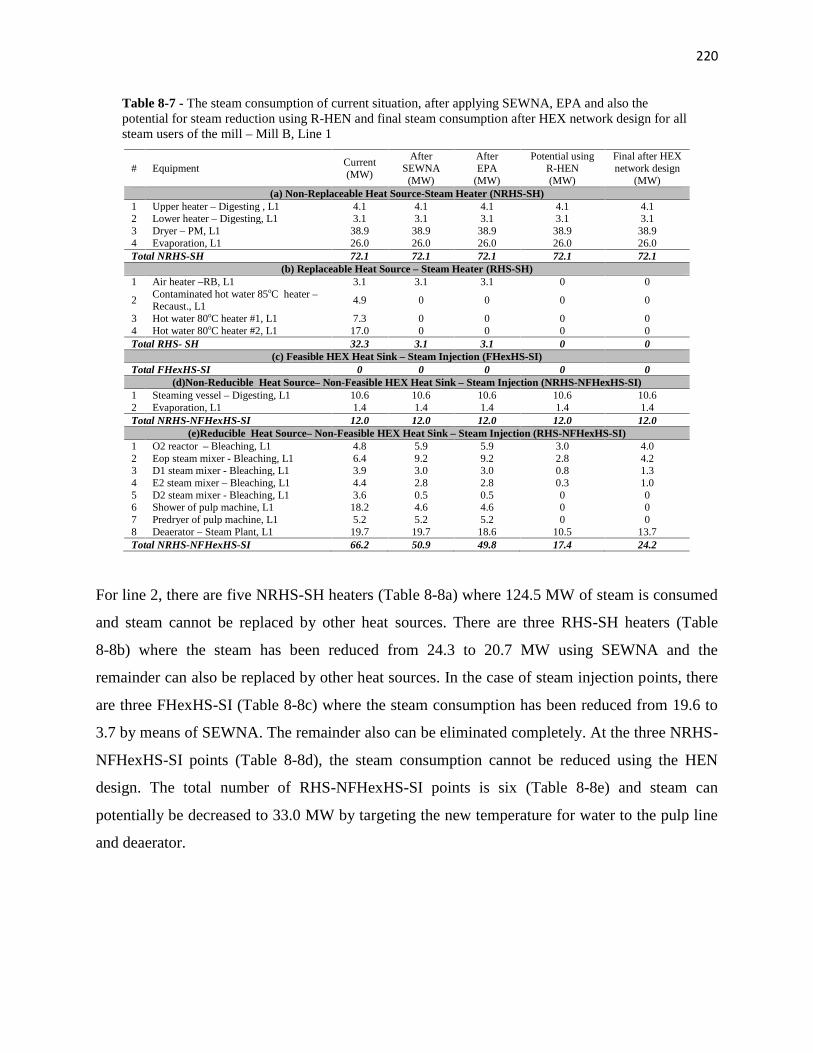
220
Table 8-7 - The steam consumption of current situation, after applying SEWNA, EPA and also thepotential for steam reduction using R-HEN and final steam consumption after HEX network design for allsteam users of the mill – Mill B, Line 1
# EquipmentCurrent(MW)
AfterSEWNA
(MW)
AfterEPA
(MW)
Potential usingR-HEN(MW)
Final after HEXnetwork design
(MW)(a) Non-Replaceable Heat Source-Steam Heater (NRHS-SH)
1 Upper heater – Digesting , L1 4.1 4.1 4.1 4.1 4.12 Lower heater – Digesting, L1 3.1 3.1 3.1 3.1 3.13 Dryer – PM, L1 38.9 38.9 38.9 38.9 38.94 Evaporation, L1 26.0 26.0 26.0 26.0 26.0Total NRHS-SH 72.1 72.1 72.1 72.1 72.1
(b) Replaceable Heat Source – Steam Heater (RHS-SH)1 Air heater –RB, L1 3.1 3.1 3.1 0 0
2Contaminated hot water 85oC heater –Recaust., L1
4.9 0 0 0 0
3 Hot water 80oC heater #1, L1 7.3 0 0 0 04 Hot water 80oC heater #2, L1 17.0 0 0 0 0Total RHS- SH 32.3 3.1 3.1 0 0
(c) Feasible HEX Heat Sink – Steam Injection (FHexHS-SI)Total FHexHS-SI 0 0 0 0 0
(d)Non-Reducible Heat Source– Non-Feasible HEX Heat Sink – Steam Injection (NRHS-NFHexHS-SI)1 Steaming vessel – Digesting, L1 10.6 10.6 10.6 10.6 10.62 Evaporation, L1 1.4 1.4 1.4 1.4 1.4Total NRHS-NFHexHS-SI 12.0 12.0 12.0 12.0 12.0
(e)Reducible Heat Source– Non-Feasible HEX Heat Sink – Steam Injection (RHS-NFHexHS-SI)1 O2 reactor – Bleaching, L1 4.8 5.9 5.9 3.0 4.02 Eop steam mixer - Bleaching, L1 6.4 9.2 9.2 2.8 4.23 D1 steam mixer - Bleaching, L1 3.9 3.0 3.0 0.8 1.34 E2 steam mixer – Bleaching, L1 4.4 2.8 2.8 0.3 1.05 D2 steam mixer - Bleaching, L1 3.6 0.5 0.5 0 06 Shower of pulp machine, L1 18.2 4.6 4.6 0 07 Predryer of pulp machine, L1 5.2 5.2 5.2 0 08 Deaerator – Steam Plant, L1 19.7 19.7 18.6 10.5 13.7Total NRHS-NFHexHS-SI 66.2 50.9 49.8 17.4 24.2
For line 2, there are five NRHS-SH heaters (Table 8-8a) where 124.5 MW of steam is consumed
and steam cannot be replaced by other heat sources. There are three RHS-SH heaters (Table
8-8b) where the steam has been reduced from 24.3 to 20.7 MW using SEWNA and the
remainder can also be replaced by other heat sources. In the case of steam injection points, there
are three FHexHS-SI (Table 8-8c) where the steam consumption has been reduced from 19.6 to
3.7 by means of SEWNA. The remainder also can be eliminated completely. At the three NRHS-
NFHexHS-SI points (Table 8-8d), the steam consumption cannot be reduced using the HEN
design. The total number of RHS-NFHexHS-SI points is six (Table 8-8e) and steam can
potentially be decreased to 33.0 MW by targeting the new temperature for water to the pulp line
and deaerator.

221
Table 8-8 - The steam consumption of current situation, after applying SEWNA, EPA and also thepotential for steam reduction using R-HEN and final steam consumption after HEX network design for allsteam users of the mill – Mill B, Line 2
# EquipmentCurrent(MW)
AfterSEWNA
(MW)
AfterEPA
(MW)
Potential usingR-HEN(MW)
Final after HEXnetwork design
(MW)(a) Non-Replaceable Heat Source-Steam Heater (NRHS-SH)
1 Upper heater – Digesting , L2 15.1 15.1 15.1 15.1 15.12 Lower heater – Digesting, L2 9.7 9.7 9.7 9.7 9.73 Dryer – PM, L2 38.9 38.9 38.9 38.9 38.94 Evaporation, L2 23.9 23.9 23.9 23.9 23.95 Black liquor concentrator, L2 36.9 36.9 36.9 36.9 36.9Total NRHS-SH 124.5 124.5 124.5 124.5 124.5
(b) Replaceable Heat Source – Steam Heater (RHS-SH)1 Space air heater, L2 14.7 14.7 14.7 0 02 Air heater – RB & PB, L2 6.0 6.0 6.0 0 03 Hot water 65oC heater, L2 3.6 0 0 0 0Total RHS- SH 24.3 20.7 20.7 0 0
(c) Feasible HEX Heat Sink – Steam Injection (FHexHS-SI)1 Filtrate tank of pulp machine, L2 6.5 3.7 3.7 0 02 Hot water 75oC production, L1 8.1 0 0 0 03 Hot water 60oC production, L2 5.0 0 0 0 0Total FHexHS-SI 19.6 3.7 3.7 0 0
(d)Non-Reducible Heat Source– Non-Feasible HEX Heat Sink – Steam Injection (NRHS-NFHexHS-SI)1 Steaming vessel – Digesting, L2 21.9 21.9 21.9 21.9 21.92 Evaporation, L2 1.4 1.4 1.4 1.4 1.43 Steam plant, L2 0.4 0.4 0.4 0.4 0.4Total NRHS-NFHexHS-SI 23.7 23.7 23.7 23.7 23.7
(e)Reducible Heat Source– Non-Feasible HEX Heat Sink – Steam Injection (RHS-NFHexHS-SI)1 Eop steam mixer - Bleaching, L2 8.3 9.7 9.7 2.7 5.12 D1 steam mixer - Bleaching, L2 4.8 6.8 6.8 3.5 4.03 E2 steam mixer – Bleaching, L2 3.9 4.5 4.5 2.5 2.74 D2 steam mixer - Bleaching, L2 3.1 5.5 5.5 0 0.95 Shower of pulp machine, L2 12.9 13.1 13.1 1.6 3.96 Deaerator – Steam Plant, L2 39.6 39.6 36.5 22.7 28.0Total NRHS-NFHexHS-SI 72.6 79.2 76.1 33.0 44.6
Table 8-9 presents the aggregate results of the theoretical minimum steam requirement
(TMinSR) and theoretical maximum steam saving (TMaxSS) for all five categories at both lines
and the whole mill. The results suggest that by applying SEWNA and EPA, 14% of current
steam consumption has already been saved and 23% can also be potentially saved by means of
R-HEN while at least 63% of current steam consumption is necessary and should be used by
current steam users.

222
Table 8-9 - The aggregation of all types of steam users for current situation, after applying NSWEA and EPA andthe targeting and final steam saving by means of R-HEN – Mill B
# Type of steam user Current(MW)
AfterSEWNA
(MW)
AfterEPA
(MW)
TMinSR*using R-
HEN(MW)
Final SRafter HEXnetworkdesign(MW)
TMaxSS†using R-
HEN(MW)
Final SSusing HEX
networkdesign (MW)
Line 11 team
heaterNRHS-SH 72.1 72.1 72.1 72.1 72.1 0 0
2 RHS-SH 32.3 3.1 3.1 0 0 3.1 3.13
Steaminjection
FHexHS-SI 0 0 0 0 0 0 04 NRHS-NFHexHS-SI 12.0 12.0 12.0 12.0 12.0 0 05 RHS-NFHexHS-SI 66.2 50.9 49.8 17.4 24.2 32.6 25.8Total (MW) 182.6 138.1 137.0 101.5 108.3 35.7 28.9Percentage over current consumption - 76% 75% 56% 59% 19% 16%
Line 21 Steam
heaterNRHS-SH 124.5 124.5 124.5 124.5 124.5 0 0
2 RHS-SH 24.3 20.7 20.7 0 0 20.7 20.73
Steaminjection
FHexHS-SI 19.6 3.7 3.7 0 0 3.7 3.74 NRHS-NFHexHS-SI 23.7 23.7 23.7 23.7 23.7 0 05 RHS-NFHexHS-SI 72.6 79.2 76.1 33.0 44.6 43.1 31.5Total (MW) 264.7 251.8 248.7 181.2 192.8 67.5 55.9Percentage over current consumption - 95% 94% 68% 73% 26% 21%
Whole mill1 Steam
heaterNRHS-SH 196.6 196.6 196.6 196.6 196.6 0 0
2 RHS-SH 56.6 23.8 23.8 0 0 23.8 23.83
Steaminjection
FHexHS-SI 19.6 3.7 3.7 0 0 3.7 3.74 NRHS-NFHexHS-SI 35.7 35.7 35.7 35.7 35.7 0 05 RHS-NFHexHS-SI 138.8 130.1 125.9 50.4 68.8 75.7 57.3Total (MW) 447.3 389.9 385.7 282.7 301.1 103.2 84.8Percentage over current consumption - 87% 86% 63% 67% 23% 19%
*TMinSR: Theoretical Minimum Steam Requirement†TMaxSS: Theoretical Maximum Steam Saving
8.3.4.2 HEX network
A part of the existing HEX network of both lines that undergoes the modifications is displayed in
Fig. 8-21a to 8-23a. The existing HEX network consists of the air preheating and warm/hot water
production networks using the process stream HEXs and the air and water heaters. Figure 8-21b
to 8-23b illustrate the final HEX network after applying the HEN design algorithm.
Figure 8-21b shows the new HEN to pre-heat the air for buildings, boilers, and dryers of both
lines. The total new HEXs that should be purchased are one condenser at the condensing turbine
of each line, two air economizers at the dryer and recovery boiler of line 2. There are also two
relocated HEX (1st condenser of condensing turbine – both in lines 1 and 2) that are currently
used as the air heater of recovery and power boilers of line 2 and the space air heater of
buildings. The current air heater of the recovery boiler (RB) of line 1 should be relocated and
enlarged to be employed as the first air economizer of the dryer on line 2.

223
Fig. 8-21 - (a) Current and (b) final air pre-heating network after applying SWAEI methodology – Mill B,Line 1(L1) &2 (L2); (RB: recovery boiler, PB: power boiler, PM: paper machine, eco.: economizer, CT:
condensing turbine, con.: condenser)
Figure 8-22b to 8-23b illustrate the new HEN for the warm/hot water production network of
lines 1 and 2. The total new HEXs for the water production network are 13 (five in line 1, and
eight in line 2). The green liquor (GL) cooler of recausticizing of both lines (Fig. 8-22a) should
be enlarged to produce hot water (HW) at 84oC (Fig. 8-22b). Water heater #2 of line 1 (Fig.
8-22a) should be relocated and used as a cooler for clean flashed steam of the pulp machine on
line 1 (Fig. 8-22b). Water heater #1 on line 1 (Fig. 8-22a) also should be relocated and enlarged
in order to be replaced with the existing and non-efficient cooler of non-clean steam of digesting
on line 2 (Fig. 8-23b). The contaminated water heater (Fig. 8-22a) should be relocated and used
(a) Current air pre-heating network
(b) Final air pre-heating network
Air eco. ofDryer –L1
90oC
1st con. of CT - L125oC
Dryer–L1
RB –L1
Buildings
New HEXSteam heater
Existing HEX Relocated HEX
Relocated & Enlarged HEX
2nd con. of CT – L1
25oC
25oC
Air HEX-Glycolloop – L1
25oC
1st con. of CT – L225oC
2nd air eco. ofDryer –L2
3rd air eco. ofDryer –L2
Air HEX-Glycol
loop – L21st air eco. of
Dryer –L2Dryer–L225oC 43oC
90oC
90oC
RB –L2
PB –L2
Air eco. ofRB-L2
39oC 80oC
80oC
80oC
80oC
Air eco. ofDryer –L1
90oC
25oC
Dryer–L1
RB –L1
Buildings
Air HEX-Glycolloop – L1
25oC
Space air heater
RB –L2
PB –L2
Fres
h A
ir (-
8oC
)
Air eco. ofDryer –L2
90oC Dryer–L2
Air HEX-Glycolloop – L2
25oC
80oCAir heater of RB L145oC
35oC 80oC 80oC
80oCAir heater of RB &PB L2
2nd con. of CT – L225oC
Fres
h A
ir (-
8oC
)

224
as the first cooler of blowdown water of the RB and PB on line 2 (Fig. 8-23b). Blow cooler of
digesting on line 2 (Fig. 8-23a) should be enlarged and used as 2nd blow cooler (Fig. 8-23b).
Water heater of line 2 (Fig. 8-23a) should be relocated and enlarged in order to be used as 2nd
cooler of blowdown water of RB and PB on line 2 (Fig. 8-23b). Finally, the condensate cooler of
the pulp machine (PM) on line 2 is enlarged and used to raise the temperature of white water at
the PM of line 2.
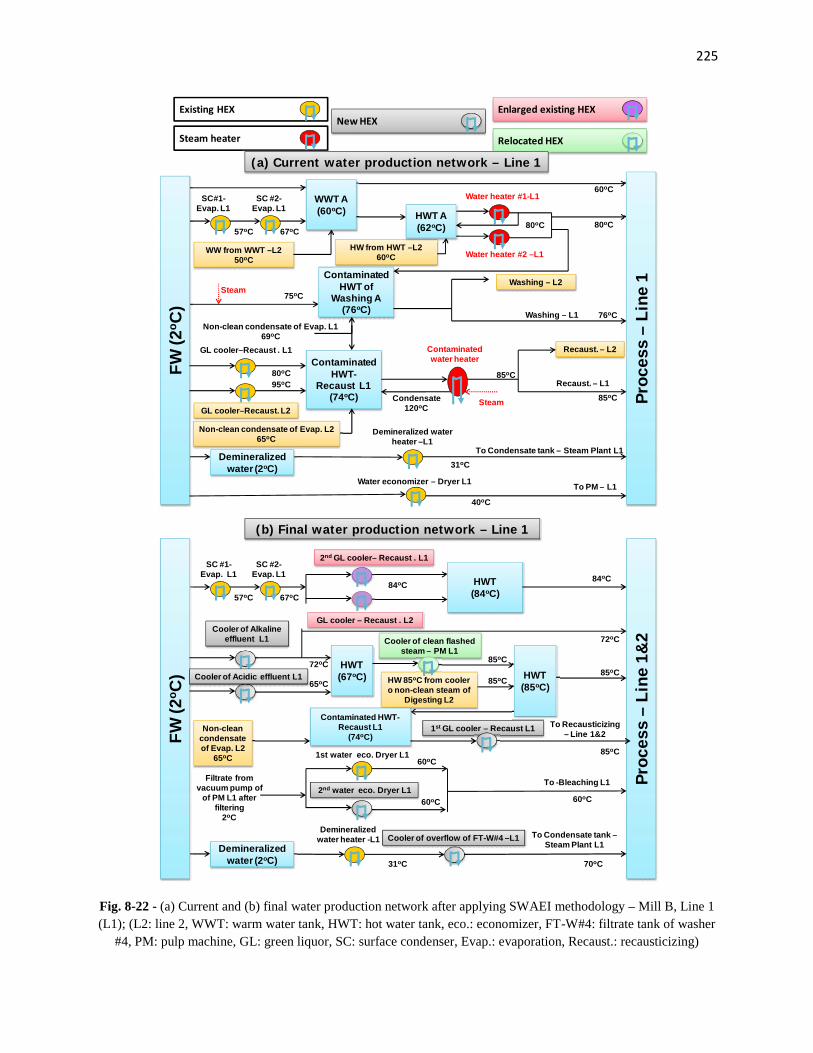
225
Fig. 8-22 - (a) Current and (b) final water production network after applying SWAEI methodology – Mill B, Line 1(L1); (L2: line 2, WWT: warm water tank, HWT: hot water tank, eco.: economizer, FT-W#4: filtrate tank of washer
#4, PM: pulp machine, GL: green liquor, SC: surface condenser, Evap.: evaporation, Recaust.: recausticizing)
GL cooler–Recaust. L2
FW (2
o C)
SC#1-Evap. L1
57oC
WW from WWT –L250oC
75oC
Water heater #2 –L1
80oC
Proc
ess
–Li
ne 1Contaminated
HWT ofWashing A
(76oC)
Steam
ContaminatedHWT-
Recaust L1(74oC)
95oC
Contaminatedwater heater
85oCRecaust. – L1
Demineralizedwater (2oC)
Demineralized waterheater –L1
31oCTo Condensate tank – Steam Plant L1
Water economizer – Dryer L1
40oC
To PM – L1
SC #2-Evap. L1
67oC
GL cooler–Recaust . L1
80oC
Non-clean condensate of Evap. L169oC
Condensate120oC Steam
Recaust. – L2
Washing – L1
Washing – L2
HW from HWT –L260oC
Water heater #1-L1
HWT A(62oC)
WWT A(60oC)
80oC
60oC
76oC
85oC
New HEXEnlarged existing HEX
Steam heater
Existing HEX
Relocated HEX
(a) Current water production network – Line 1
Non-clean condensate of Evap. L265oC
FW (2
o C)
SC #1-Evap. L1
57oC
Proc
ess
–Li
ne 1
&2
Demineralizedwater (2oC)
Demineralizedwater heater -L1
31oC
To Condensate tank –Steam Plant L1
SC #2-Evap. L1
67oC
Cooler of overflow of FT-W#4 –L1
70oC
GL cooler – Recaust . L2
84oC
2nd GL cooler– Recaust . L1
HWT(84oC)
84oC
60oC
2nd water eco. Dryer L1Filtrate from
vacuum pump ofof PM L1 after
filtering2oC
60oC
To -Bleaching L1
60oC
65oC
Cooler of Alkalineeffluent L1
HWT(67oC)Cooler of Acidic effluent L1
72oC 85oC
Cooler of clean flashedsteam – PM L1
85oC
72oC
HW 85oC from coolero non-clean steam of
Digesting L2
85oC
1st GL cooler – Recaust L1 To Recausticizing– Line 1&2
85oC
Contaminated HWT-Recaust L1
(74oC)
HWT(85oC)
Non-cleancondensateof Evap. L2
65oC
(b) Final water production network – Line 1
1st water eco. Dryer L1
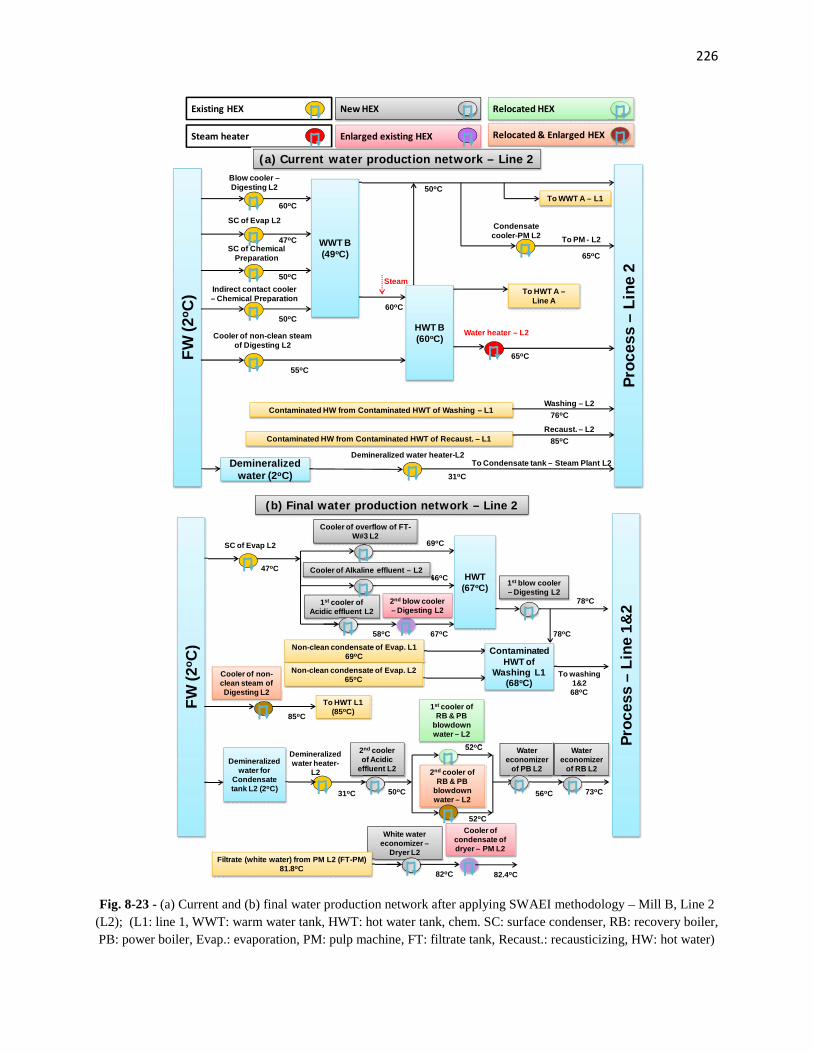
226
Fig. 8-23 - (a) Current and (b) final water production network after applying SWAEI methodology – Mill B, Line 2(L2); (L1: line 1, WWT: warm water tank, HWT: hot water tank, chem. SC: surface condenser, RB: recovery boiler,PB: power boiler, Evap.: evaporation, PM: pulp machine, FT: filtrate tank, Recaust.: recausticizing, HW: hot water)
FW (2
o C)
To WWT A – L1
Proc
ess
–Li
ne 2
Steam
47oC
Recaust. – L2
Demineralizedwater (2oC)
Demineralized water heater-L2
31oCTo Condensate tank – Steam Plant L2
To PM - L2
Blow cooler –Digesting L2
60oC
Contaminated HW from Contaminated HWT of Recaust. – L1
Water heater – L2
WWT B(49oC)
85oC
Contaminated HW from Contaminated HWT of Washing – L1Washing – L2
76oC
SC of Evap L2
50oC
SC of ChemicalPreparation
50oC
Indirect contact cooler– Chemical Preparation
55oC
Cooler of non-clean steamof Digesting L2
50oC
60oC
65oC
Condensatecooler-PM L2
To HWT A –Line A
65oC
HWT B(60oC)
New HEX
Enlarged existing HEXSteam heater
Existing HEX Relocated HEX
Relocated & Enlarged HEX
(a) Current water production network – Line 2
FW (2
o C)
SC of Evap L2
47oC
Proc
ess
–Li
ne 1
&2
Demineralizedwater heater-
L2
31oC
69oC
Cooler of overflow of FT-W#3 L2
66oCCooler of Alkaline effluent – L2
58oC
1st cooler ofAcidic effluent L2
67oC
2nd blow cooler– Digesting L2
78oC
1st blow cooler– Digesting L2
78oCNon-clean condensate of Evap. L1
69oC
To HWT L1(85oC)
Cooler of non-clean steam ofDigesting L2
85oC
Demineralizedwater for
Condensatetank L2 (2oC)
2nd coolerof Acidic
effluent L2
50oC
52oC
2nd cooler ofRB & PB
blowdownwater – L2
52oC
Watereconomizer
of PB L2
56oC
Watereconomizer
of RB L2
73oC
ContaminatedHWT of
Washing L1(68oC)
To washing1&268oC
(b) Final water production network – Line 2
HWT(67oC)
82oC
White watereconomizer –
Dryer L2
Cooler ofcondensate ofdryer – PM L2
82.4oC
1st cooler ofRB & PB
blowdownwater – L2
Non-clean condensate of Evap. L265oC
Filtrate (white water) from PM L2 (FT-PM)81.8oC

227
8.3.4.3 Steam saving
Table 8-7 and 8-8 present the final steam consumption for all five categories of steam users for
lines 1 and 2, respectively.
For the line 1, the results show that at RHS-SH (Table 8-7b), the anticipated steam saving has
been accomplished whereas at RHS-NFHexHS-SI (Table 8-7e), the goal cannot be achieved;
however, the steam can be significantly reduced from 49.8 to 24.2 MW.
For line 2, the results show that at RHS-SH, FHexHS-SI (Table 8-8b and c), the anticipated
steam savings have been obtained while at RHS-NFHexHS-SI (Table 8-8e), the estimated saving
cannot be reached; however, the steam can be considerably decreased from 76.1 to 44.6 MW.
Table 8-9 presents the final steam requirement and saving after HEX network design for both
lines and the whole mill. The total steam saving using R-HEN is large and accounts for 19% of
current steam consumption of the mill. The savings when added to ones that have been achieved
by SEWNA and EPA (14%) come to 33% of current steam consumption, which is considerably
high. The results also show that the theoretical maximum steam saving (TMaxSS) is close to the
final steam saving (23 vs. 19%).
8.3.5 Summary of improvements
Table 8-10 presents the total number of projects and steam and water savings on both lines and
the whole mill. In addition, capital cost requirements for piping in the water network from the
SEWNA and installation of flash tanks by EPA, the new HEX area by means of R-HEN are
shown. The operating cost relating to the flash tanks and new HEX area is also calculated. Steam
saving is 146.2 MW that accounts for 33% of current steam consumption. The total water saving
is 695 m3/h or 24% of current water consumption. These 60 projects entail 40.98 M$ in capital
costs and add 1027 k$/a (1.03 M$/a) to the operating costs of the mill.

228
Table 8-10 - Summary of improvements applying three process integration techniquesin sequence for Lines 1 and 2 and the whole mill – Mill B
Step ofMethodology
Number ofprojects
Steam saving Water saving Capitalcost
Operatingcost
MW % m3/h % M$ k$/aLine 1
SEWNA 17 44.5 24 350 23 4.36 -EPA 1 1.1 1 -3 0 0.15 42R-HEN 9 28.7 16 - - 14.46 373Total 27 74.3 41% 347 23% 18.97 415
Line 2SEWNA 13 12.9 5 348 25 0.98 -EPA 1 3.1 1 - - 0.35 118R-HEN 19 55.9 22 - - 19.68 494Total 33 71.9 27% 348 25% 21.01 612
Whole millSEWNA 30 57.4 13 698 24 5.34 -EPA 2 4.2 1 -3 0 0.50 160R-HEN 28 84.6 19 - - 35.14 867Total 60 146.2 33% 695 24% 40.98 1027
8.3.6 Step 4: Energy Upgrading, Conversion, and Selling Steam
This mill currently has on each line two back pressure turbines that produce medium (MP) and
low (LP) pressure steam and 48.9 MW of electricity (Fig. 8-24a). In total, 447.3 MW of MP and
LP steams are consumed at the process and 60.5 MW of energy is lost in the turbines. It should
be noted that this mill does not utilize fossil fuel for steam generation and, hence, the reduction
of the existing steam capacity is not attractive due to low cost of steam produced from bark.
The saved steam is examined to be used in four alternatives, as illustrated in Fig. 8-24b-e.
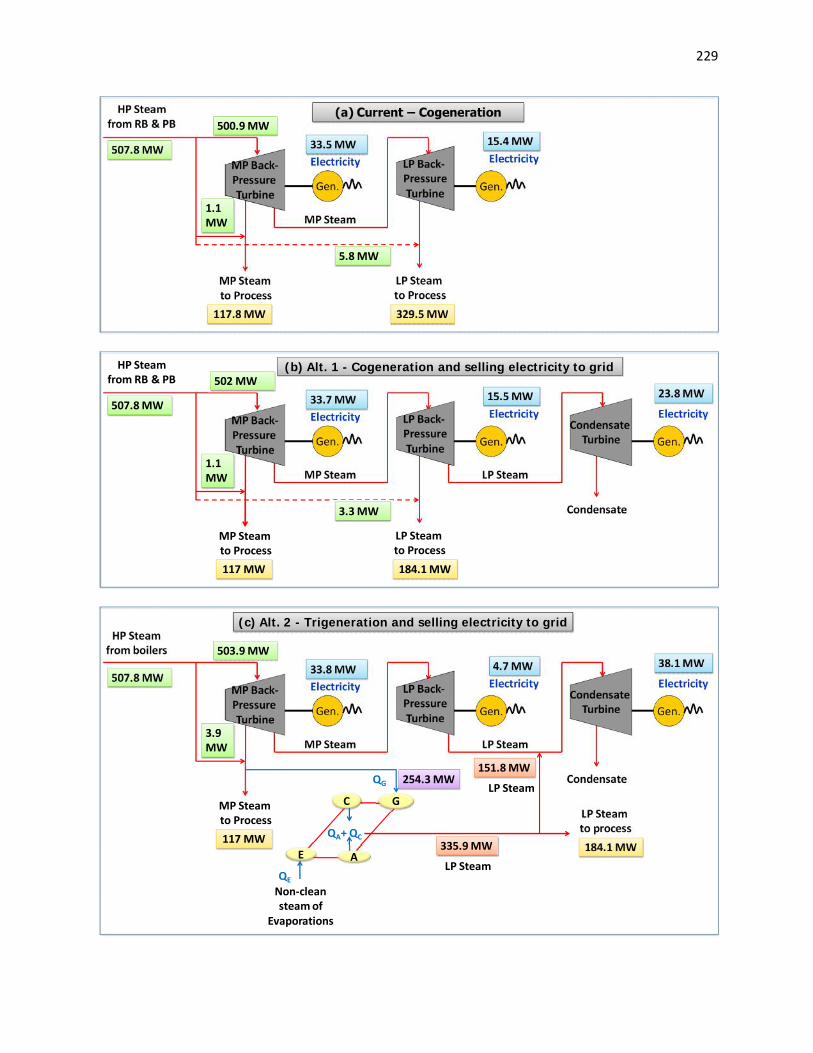
229
Gen.
Electricity
MP Steam
MP Steamto Process
Gen.
Electricity
LP Steamto Process
MP Back-PressureTurbine
LP Back-PressureTurbine
329.5 MW117.8 MW
33.5 MW 15.4 MW507.8 MW
HP Steamfrom RB & PB
(a) Current – Cogeneration500.9 MW
1.1MW
5.8 MW
Gen.
Electricity
MP Steam
Gen.
Electricity
LP Steam
Gen.
ElectricityMP Back-PressureTurbine
LP Back-PressureTurbine
CondensateTurbine
Condensate
33.7 MW 15.5 MW 23.8 MW
(b) Alt. 1 - Cogeneration and selling electricity to grid
MP Steamto Process
LP Steamto Process184.1 MW117 MW
507.8 MW
HP Steamfrom RB & PB 502 MW
1.1MW
3.3 MW
Gen.
Electricity
MP Steam
Gen.
Electricity
LP Steam
Gen.
Electricity
LP Steamto process
MP Back-PressureTurbine
LP Back-PressureTurbine
CondensateTurbine
Condensate
184.1 MW
33.8 MW 4.7 MW 38.1 MW507.8 MW
HP Steamfrom boilers 503.9 MW
E A
C G
QE
QG
QA+ QC
Non-cleansteam of
Evaporations
254.3 MW151.8 MW
LP Steam
335.9 MW
LP Steam
(c) Alt. 2 - Trigeneration and selling electricity to grid
117 MW
3.9MW
MP Steamto Process
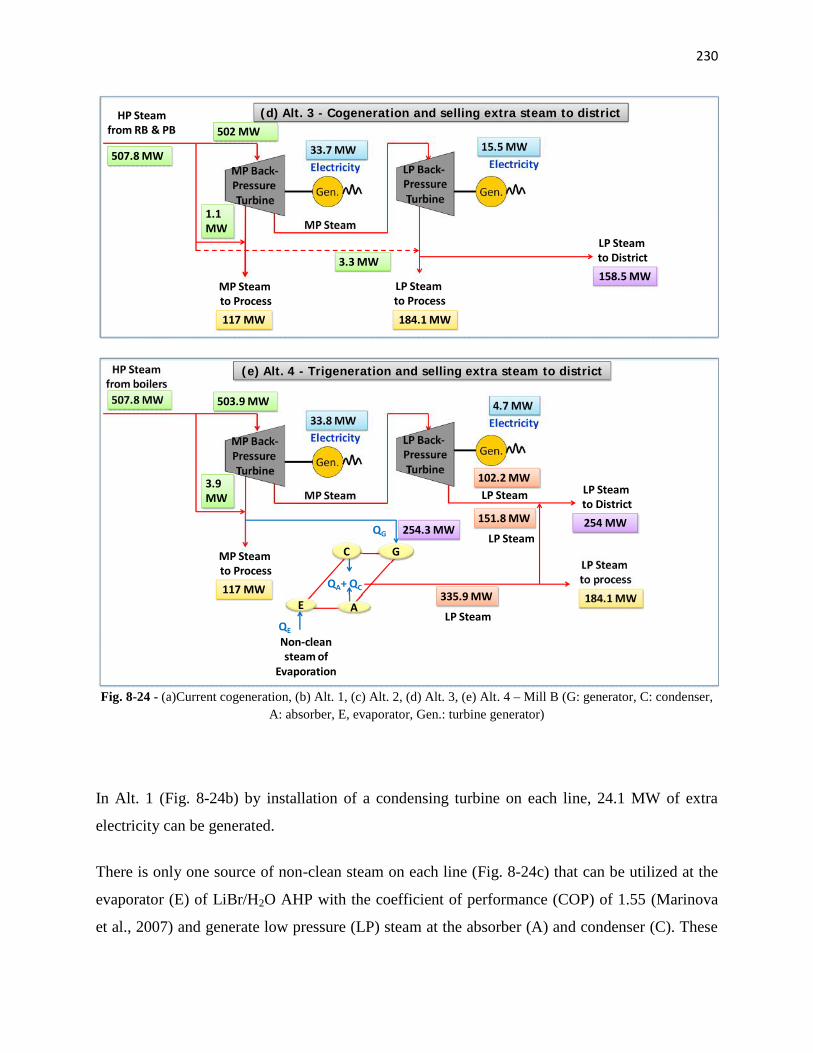
230
Fig. 8-24 - (a)Current cogeneration, (b) Alt. 1, (c) Alt. 2, (d) Alt. 3, (e) Alt. 4 – Mill B (G: generator, C: condenser,A: absorber, E, evaporator, Gen.: turbine generator)
In Alt. 1 (Fig. 8-24b) by installation of a condensing turbine on each line, 24.1 MW of extra
electricity can be generated.
There is only one source of non-clean steam on each line (Fig. 8-24c) that can be utilized at the
evaporator (E) of LiBr/H2O AHP with the coefficient of performance (COP) of 1.55 (Marinova
et al., 2007) and generate low pressure (LP) steam at the absorber (A) and condenser (C). These
Gen.
Electricity
MP Steam
Gen.
ElectricityMP Back-PressureTurbine
LP Back-PressureTurbine
33.7 MW 15.5 MW
MP Steamto Process
LP Steamto Process184.1 MW117 MW
507.8 MW
HP Steamfrom RB & PB 502 MW
1.1MW
3.3 MW
(d) Alt. 3 - Cogeneration and selling extra steam to district
LP Steamto District158.5 MW
Gen.
Electricity
MP Steam
Gen.
Electricity
LP Steamto process
MP Back-PressureTurbine
LP Back-PressureTurbine
184.1 MW
33.8 MW4.7 MW507.8 MW
HP Steamfrom boilers
503.9 MW
E A
C G
QE
QG
QA+ QC
Non-cleansteam of
Evaporation
254.3 MW151.8 MW
LP Steam
335.9 MW
LP Steam
117 MW
3.9MW
MP Steamto Process
(e) Alt. 4 - Trigeneration and selling extra steam to district
LP Steam LP Steamto District254 MW
102.2 MW

231
non-clean steams are currently condensed at surface condensers of evaporations to produce warm
water (Fig. 8-22 and 8-23). Therefore, to produce these warm waters, the adjustment to replace
the non-clean steams with other heat sources is considered in the HEX network. The total MP
steam of 254.3 MW from the MP back pressure turbines is used as the heat deriver at the
generator (G) of AHPs and in total can save 81.6 MW (18%) of steam consumption. However,
this excess saving does not result in significant extra electricity generation in comparison to Alt.
1 (27.7 vs. 24.1 MW). The reason for so little extra electricity generation is that the large
quantity of MP steam is used to upgrade the heat at AHPs, and the quantity of steam towards LP
back pressure turbine is reduced.
In Alt. 3 (Fig. 8-24d) all excess LP steam (158.5 MW) can be sold to district.
Alternative #4 (Fig. 8-24e) is similar to Alt. 2 (Fig. 8-24c) but instead of the installation of
condensing turbines, the excess steam (254 MW) can be sold to the district.
The total capital cost of Alt. 1 is 12.57 M$ to purchase two new condensing turbines with 1170
k$/a of operating costs while the capital cost of the cogenerations and AHPs of Alt. 2 are
respectively 21.6 and 109.41 M$ and add around 4.1 M$/a in operating costs. For Alt. 4, the
capital and operating costs of AHPs are 109.41 M$ and 2.7 M$/a, respectively.
8.3.7 Economic analysis of four alternatives
The saved steam is used according to four alternatives (Fig. 8-24b-e). The following economic
data of the mill and assumptions are employed for a profitability calculation on a 2012 basis:
o The price of electricity is 44 $/MWhr.
o The price of fresh water is 0.0175 $/m3.
o The price for effluent treatment is 0.10 $/m3.
o The selling price of electricity to the grid is 90 $/MWhr (Mateos-Espejel et al., 2011c).
o The selling price of steam to the local district is 4.17 $/GJ (Mateos-Espejel et al., 2011c).
o Number of operating days is 354 (Browne et al., 2011).
The total reduction in effluent production, water saving, extra electricity generation, and excess
steam for selling are translated into costs and summarized in Table 8-11. In Alt. 1 and 2, selling

232
extra electricity and for Alt. 3 and 4, selling excess steam is the biggest portion of net profit.
Purchasing new HEX area in both Alt. 1 and 3 is the main contributor to total capital cost while
in the case of Alt. 2 and 4, the capital cost is three times more than the two other alternatives due
to purchasing very expensive AHPs. If there is no market for the excess steam, Alt. 3 and 4 will
be excluded and Alt. 1 as an extremely attractive option is proposed to be implemented. On the
other hand, if there is a market for the excess steam, then Alt. 2 is the best one among the others
in terms of the smallest capital cost (42.5 M$) and the shortest payback period (2.1a) and also in
comparison with Alt. 1 could generate a higher profit (20.0 vs. 17.0 M$/a).
Table 8-11 - The economic benefit of savings from different resources – Mill B
EffluentReduction
(m3/h)
Watersaving(m3/h)
Steam saving(MW)
Extraelectricitygenerationfor selling
(MW)
Excesssteam
forselling(MW)
EffluentReduction
(M$/a)
Watersaving(M$/a)
Alt.1 – Cogeneration andselling extra electricity
706(25%)
695(24%)
146.2(33%)
24.1 - 0.6 0.1
Alt. 2 – Trigeneration andselling extra electricity
706(25%)
695(24%)
228.9(51%)
27.7 - 0.6 0.1
Alt. 3 – Selling excesssteam to local district
706(25%)
695(24%)
146.2(33%)
- 158.5 0.6 0.1
Alt. 4 – Trigeneration andselling excess steam to localdistrict
706(25%)
695(24%)
228.9(51%)
-10.4† 254 0.6 0.1
Selling extraelectricity
(M$/a)
Sellingthe
excesssteam(M$/a)
Purchasingextra
electricity(M$/a)
Increase inoperating
cost (M$/a)
Netprofit(M$/a)
Total Capitalcost (M$)
Paybackperiod
(a)
Alt.1 – Cogeneration andselling extra electricity
18.5 - - 2.2 17.0 53.4 3.1
Alt. 2 – Trigeneration andselling extra electricity
21.2 - - 5.2 16.7 173.1 10.4
Alt. 3 – Selling excesssteam to local district
- 20.4 - 1.1 20.0 42.5 2.1
Alt. 4 – Trigeneration andselling excess steam to localdistrict
- 32.4 3.9 3.8 25.4 151.9 6.0
†the excess steam is sold to the local district, the capacity of electricity generation is reduced and electricity deficit should be purchased from grid
8.3.8 Step 5: Implementation strategy
According to the profitability analysis, Alt. 1 and 3 are more promising for implementation.
Since there is no fossil fuel saving, for both alternatives, one phase is employed, as shown in
Table 8-12.

233
Table 8-12 - Strategy to implement Alt. 1 and 3 – Mill B
Projects to be doneSteamsaving(MW)
Capitalcost(M$)
Netprofit(M$/a)
Paybackperiod
(a)Alt.1 – Cogeneration and selling extra electricity
Phase 1: Extraelectricity generation
1-All water reutilization2-All performanceimprovements of equipments3-HEXs of water network4-HEXs of air network5-Condensing turbines
146.2 53.4 17.0 3.1
Alt. 3 – Selling excess steam
Phase 1: Excesssteam selling
1-All water reutilization2-All performanceimprovements of equipments3-HEXs of water network4-HEXs of air network5-Selling steam to local district
146.2 42.5 20.0 2.1
8.3.9 Step 6: Post benchmarking
Figure 8-11 and 8-12 demonstrate the post-benchmarking results if all the projects are
implemented. Figure 8-11 displays that the steam consumption at bleaching, the pulp machines,
and other users has been significantly reduced and this has brought down the total steam
consumption of the whole mill much lower than the 25th percentile of Canadian mills. Figure 8-
12 also shows that the water consumption has been reduced at washing, bleaching, the pulp
machine, and recausticizing.
The predicted scope for steam and water savings using Eqs [1] and [2] was respectively 38 and
24% and the final steam and water savings were respectively 33 and 24%, which are
considerably close. This again proves the robustness of these equations for the calculation of
scope.
8.4 Mill C
8.4.1 Step 2: Pre-benchmarking with current practices
The pre-benchmarking of steam and water consumption is illustrated in Fig. 8-25 and 8-26.
Figure 8-25 shows that the steam consumption of the digesting department is much greater than
the 75th percentile; however the identification of the saving potential requires in-depth analysis of
the equipment of this department. This value for bleaching and chemical preparation and
evaporation is reasonable. The steam consumption at the paper machine (PM) is higher than the
75th percentile because water at low temperature is supplied to the PM and results in the low

234
temperature of white water that leaves the machine. This white water is recycled to the PM and
to maintain its temperature a significant amount of steam is injected into the white water tank.
This steam can be reduced or removed by providing higher temperature water to the PM. The
total steam consumption of the mill stands above the 75th percentile of Canadian mills and,
therefore, there is room for improvement.
Fig. 8-25 – Steam consumption of main departments and complete mill – current and afterapplying projects
Figure 8-26 shows that the water consumption of the washing is considerably high due to poor
countercurrent filtrate reuse. In addition, hot water is utilized to maintain the temperature of the
filtrate tank of washers #3 and 4 at 37.6oC (Fig. 8-28a). The white water is not reutilized
efficiently at other departments, which causes the large effluent production from the filtrate tank
of the paper machine (Fig. 8-29a). Therefore, applying the process integration could significantly
reduce the water consumption and effluent production in this mill. It should be noted that the
total water consumption and effluent production are 1760 and 1720 m3/h (Table 3-1), but in Fig.
8-26, in terms of m3/Adt, they are different. The reason is that the base for calculation of m3/Adt
in digesting, washing, bleaching, the steam plant, and chemical preparation is the total Kraft
production (280 Adt/d) while for the paper machine it is the total mixture of Kraft and
5.43.3
5.8
3.0
5.4
22.9
3.8
1.6
3.3
3.01.9
13.7
0
5
10
15
20
25
ContinuousDigesting
Bleaching &Chemical
prep.
Papermachine
Evaporation Others Total
Stea
m c
onsu
mpt
ion
(GJ/
Adt) Current
After applying projects
75th percentileMedian25th percentile

235
mechanical production (700 Adt/d) and for mechanical it is the total mechanical pulping
production (420 Adt/d).
Fig. 8-26 - Water consumption – current and after applying projects
Based on Eqs [1] and [2], the scope for steam and water savings is 41% and 54%, respectively.
8.4.2 Changes in Water Reutilization Network (Step 3-1: SEWNA)
The Water & Energy Pinch curves for all sinks and sources are constructed in Fig. 8-27. Figure
8-27a shows the raw data before reutilization while Fig. 8-27b displays the final results after
water reutilization.
0.4
51
24
104 4 2
97
23
120
0
22
8 94 1 2
47
0
47
0
20
40
60
80
100
120
140W
ater
con
sum
ptio
n (m
3 /Ad
t) CurrentAfter applying projects
Mills design 1960sMills design 1980s

236
Fig. 8-27 – Water & Energy Pinch Curves, (a) before water reutilization, (b) after water reutilization – Mill C
The final changes in water utilization and filtrate reutilization of the whole mill is demonstrated
in Fig. 8-28b to 8-30b. Dashed purple lines show the change in the flowrate of existing
connections and the dotted red lines show the new connections. The total number of changes that
is carried out in the flowrate of existing connections is 11 while 13 new connections for filtrate
reutilization should be implemented. Total water savings is 994 m3/h that accounts for 57% of
current water consumption at both mechanical and Kraft pulping. The total effluent decreases by
982 m3/h or 58% of current effluent production.
0
50
100
150
200
2500
20000
40000
60000
80000
100000
120000
140000
1600000 2000 4000 6000 8000 10000 12000 14000
Cont
amin
ant C
once
ntra
tion
(ppm
)
Flowrate (m3/h)
Contaminant-Sink (ppm)Contaminant-Source (ppm)Temperature- Source (oC)Temperature-Sink (oC)
T (o C
)
aPinch point
0
50
100
150
200
2500
20000
40000
60000
80000
100000
120000
140000
1600000 2000 4000 6000 8000 10000 12000 14000
Cont
amin
ant c
once
ntra
tion
(ppm
)
Flowrate (m3/h)
Contaminant-Sink (ppm)Contaminant-Source (ppm)Temperature- Source (oC)Initial Temperature-Sink (oC)
T (o C
)
b Pinch point

237
Fig. 8-28 – (a) current, (b) final water utilization and filtrate reutilization in digesting and washing departments – mill C; dotted red lines: new connections;dashed purple lines: the existing connections with change in flowrate (W: washer, FT: filtrate tank, Sep & Scr.: separators and screeners, Dig: digester, Deknot:
deknotters, NCC-EV: non-clean condensate of evaporation, WW: warm water: FW: fresh water: HW: hot water, Eff.: effluent)
DeknotDig60oC
Chipbin 92oC 46oC
WW5015 m3/h
FT-W#245.7oC
FT-Sep &Scr 37.9oC
2oC
Woodchips
W #2 Sep & ScrW #1
252
220
FT-Deknot58.2oC
136
78oC
144
18
12430
71
2 m3/hEff-Deknot
58.2oC
FT- W#158.9oC
40
493
WW5013 m3/h
99
39 406
NCC-EV70.4oC
83
46oC
152 152
27 m3/hEff-Sep& Scr
37.7oC
111682
46oC
HW6072 m3/h
W #3&4
901 1976
87
50oC
HW60210 m3/h
FW2144 m3/h
409 m3/hEff-W#3&4
37.6oC
FT-W#547oC
25 m3/hEff-EV-170.4oC
17 m3/h
CC-EV95oC
5 m3/h
16 m3/hEff-W #257.7oC
(a) Current waterutilization & filtrate
reutilization
FT-W #3&437.6oC
DeknotDig61oC
Chipbin 92oC 59oC
FT-Sep &Scr 51.5oC
2oC
Wood chipsW #2 Sep & ScrW #1
252
220
FT-Deknot60oC
136
76oC
144
18
12430
71
2 m3/hEff-Deknot
60oC
FT-W#161oC
40
493
100
39 406
NCC-EV70.4oC
85
55oC
152 152
27 m3/hEff-Sep& Scr
51.5oC
111682
51.5oC
HW57144 m3/h
W #3 &4
896 1976
140
63oC
202 m3/hEff-W #3&4
55.2oC
Ft- W#568oC
30 m3/h
FT-WEop78.5oC
5
12 m3/h
15 m3/hEff-W#2
59oC
(b) Modified waterutilization & filtrate
reutilization
Modified –flowrate stream
New connection DF: 6.7 4.6 (ideal DF:2.5)By reduction 24 m3/h of water
EDR: 0.85 0.81 (ideal EDR:0.58)
FT-W#259oC
FT-W #3 &452oC

238
Fig. 8-29 - (a) Current, (b) final water utilization and filtrate reutilization in bleaching and paper machine departments – mill C; dotted red lines: newconnections; dashed purple lines: the existing connections with change in flowrate (W: washer, R: reactor; M: steam mixer, FT: filtrate tank, Mec.-P: mechanicalpulping, Cle.: cleaners, Scr.: screeners, PM: paper machine, Vac. P: vacuum pump, Fil: filter, WW: warm water: FW: fresh water: HW: hot water, CH-A: acidic
chemicals, CH-B: base chemicals, ST: steam, Eff.: effluent)
W #545.5oC
FT-W #547oC
434
50oC
50245
52 m3/hEff-W #5
47oC
WW44116 m3/h
WW3622 m3/h
ST0.2MW
Pulp M-Eop
ST
W – D0R-D038oC 49oC
5.0 MW
192 m3/hEff-D0 (Acidic
Eff) 49.9oC
CH-A
R- Eop95oC 67oC
CH-B
117 m3/hEff-Eop
(Alkaline Eff)25.7oC
FT-WEop67oC
R – D161.5oC 50oC
61 m3/h
26 m3/hEff-D150.2oC
FT-WD150.2oC
CH-A
58.3oC
FT– Cle59.9oC
W–D1 Cle.W–Eop
EopExch.
1471
WW4492 m3/h
30
FT-WD049.9oC
293
59WW441 m3/h
ST1.7MW
WW4476 m3/h
WW4413 m3/h
152
29
40 322
WW44
41 m3/h
WW36
155 29 298
404 m3/hFW2
1943
1943
24m3/hEff-Cle.59.9oC
Mec-P50oC
FT– Scr59oC
Scr.
4
4
58.3o
C
PM
4923
12912764 284
58.3oC
602 m3/hEff-PM-2
60oC
ST10.6 MW
FT–PM60oC
108m3/hEff-PM-1
58.3oC
275 m3/hWW46
Vac. P-PM
31 m3/hFW2
31 m3/hEff-Vac. P–PM 2oC
(a) Current waterutilization & filtrate
reutilization
W #574oC
FT- W#568oC
434
63oC
50245
HW7039 m3/h
Pulp M-Eop
ST
W – D0R – D060oC 66oC
3.3 MW
202 m3/hEff-D0
(Acidic Eff)66oC
CH-A
R - Eop95oC 78oC
CH-B
89 m3/hEff-Eop
(Alkaline Eff)25.1oC
FT-WEop78.5oC
R – D173oC 67oC
68 m3/h
29 m3/hEff-D166.5oC
FT-WD166.5oC
CH-A
69oC
FT-Cle69oC
W –D1 Cle.W –
Eop
EopExch.
1471 20
FT-W D066oC
293
59
HW5723 m3/h
151
29
34 322
HW57
155 26 2981943
1943
24m3/hEff-Cle.
69oC
Mec-P69oC
FT– Scr69oC
Scr.
4
4
69oCPM
4955
12912764 284
69oC
FT– PM69oC
HW70
Vac. P-PM
12 m3/hFW2
92 11 13 59 37 Fil
3119
263 m3/h
12404
76m3/hEff-PM-1
69oC
(b) Modified waterutilization & filtrate
reutilization
Modified –flowrate stream
New connection
HW8172 m3/h
DF: 4.75 2.5 (ideal DF:2.5)By reduction 27 m3/h of water
EDR: 0.94 0.84 (ideal EDR:0.80)

239
Fig. 8-30 - (a) current, (b) final water utilization and filtrate reutilization in scrubber, recausticizing, chemical preparation, and steam plant department, - mill C;dotted red lines: new connections; dashed purple lines: the existing connections with change in flowrate (Scrub: scrubber, BL-Con: black liquor concentrator,
WeWT: weak wash tank, Dreg FT: dreg filter, LMF: lime mud filter, Clas: classifier, Scrub-Rec: scrubber of recauticizing, Ch. Prep.: chemical preparation, Mix-Ble: mixer-bleaching, Con. T: condensate tank, Con. T-Dig.: condensate tank of digesting, SC-Dig.: surface condenser of digesting, SC-EV.: surface condenser
of evaporation, WW: warm water: FW: fresh water: HW: hot water, CH-A: acidic chemicals, CH-B: base chemicals, ST: steam, Eff.: effluent)
WeWTBL-ConScrub
3 m3/h
DregFT
WW50
8 m3/hEff-Dig-1
(CC)113oC
8 m3/hFW2
19 m3/hFW2
CC-GLheater181oC
1 m3/h
4 m3/hWW48
LMF
12 m3/hWW44
Clas
2 m3/hFW2
Scrub-Rec
8 m3/hFW2
Ch.Prep.
26 m3/hFW2
Mix-Ble
1 m3/hWW44
Con.T
83 m3/hFW2
Con.T- Dig.
10 m3/hEff-Dig-2
(NCC)91.4oC
SC-Dig.
15 m3/hEff-EV-2
(NCC)61.6oC
SC-EV.
6 m3/hEff-Scrub
67.1oC
(a) Current waterutilization & filtrate
reutilization
WeWTBL-ConScrub
3 m3/h
DregFT
WW508 m3/hCC-Dig.113oC
8 m3/hFW2
LMF Clas
2 m3/hFW2
Scrub-Rec
8 m3/hFW2
Ch.Prep.
26 m3/hFW2
Mix-Ble
1 m3/hWW44
Con.T
47 m3/hHW62
Con.T- Dig.
10 m3/hEff-Dig-2
(NCC)91.4oC
SC-Dig.
15 m3/hEff-EV-2
(NCC)61.6oC
SC-EV.
6 m3/hEff-Scrub
67.1oC
FT-WEop78.5oC
13
7 m3/hFW2
4 12
(b) Modified waterutilization & filtrate
reutilization
Modified –flowrate stream
New connectionBy shutting down PB#2, 3 & 6
the water requirementreduces from 83 47 m3/h

240
8.4.3 Synthesis of the performance improvement projects (Step 3-2: EPA)
The synthesis of all projects is summarized in Table 8-13. There are seven performance
improvement projects: one in the digesting department, two in the washing department, and four
in the steam plant (three for the boilers and one for the deaerator). The projects for washers #3
and 4 (a), washer #5 (b), and deaerator (c) have already been incorporated in water network
changes, as shown in Fig. 8-28b to 8-30b.
Table 8-13 – Summary of the performance improvement projects – Mill C
*Plus (+) means increase in steam generation at boiler, steam saving, and water saving; minus (-) means increase insteam or water consumption
8.4.4 HEX network changes (Step 3-3: R-HEN)
8.4.4.1 Targeting
The steam consumption of current conditions, after applying SEWNA and EPA, and also after
performing the targeting stages for five different categories of steam users is presented in Table
8-14. The results show that six NRHS-SH heaters (Table 8-14a) consume 41.5 MW of steam and
after performing EPA is reduced to 40.9 MW and cannot be replaced by other heat sources.
# Project nameProbable remedialsolution
Consequence of project on the processSaving / increase*Steam(MW)
Water(m3/h)
1Digestingdepartment
Reduce the heat loss byimproving themaintenance
-Reduction of steam consumption +5.2* -
a Washers #3 & 4Reduce the DF from 6.7to 4.6 (ideal DF=2.5)
-Reduction of hot water consumption - +24-Increase the quantity of black liquor to recoveryboiler from 813 to 818 t/d and increase steamproduction at RB
+1.8 -
b Washer #5Reduce the DF from 4.75to 2.5 (ideal DF=2.5)
-Reduction of warm water consumption - +27
2 Recovery boilerReduce the heat loss byimproving themaintenance
-Increase steam production +16.9 --Increase fresh water consumption at deaerator-Increase steam consumption at deaerator
-3.7* -20
3 Power boiler #1Reduce the heat loss byimproving themaintenance
-Increase steam production +1.1 --Increase fresh water consumption at deaerator-Increase steam consumption at deaerator
-0.2 -1
4 Power boiler #2Reduce the heat loss byimproving themaintenance
-Increase steam production +3.7 --Increase fresh water consumption at deaerator-Increase steam consumption at deaerator
-0.9 -5
5 DeaeratorFlash blowdown andinject the produced steamto deaerator
-Reduction of steam consumption at deaerator +2.9 -
c Deaerator
Replace fresh water tothe deaerator with savedhot and warm water ofwashers#3,4,5
-Reduction of steam consumption at deaerator +1.0 -
Total +27.8 +25
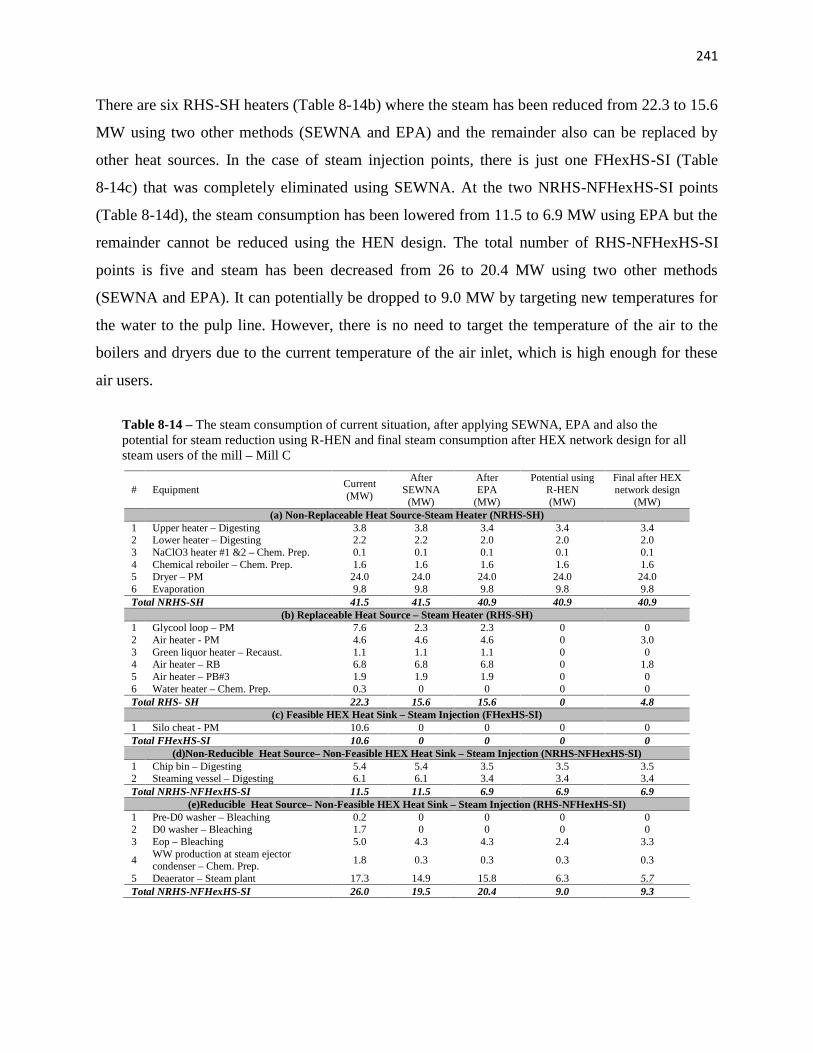
241
There are six RHS-SH heaters (Table 8-14b) where the steam has been reduced from 22.3 to 15.6
MW using two other methods (SEWNA and EPA) and the remainder also can be replaced by
other heat sources. In the case of steam injection points, there is just one FHexHS-SI (Table
8-14c) that was completely eliminated using SEWNA. At the two NRHS-NFHexHS-SI points
(Table 8-14d), the steam consumption has been lowered from 11.5 to 6.9 MW using EPA but the
remainder cannot be reduced using the HEN design. The total number of RHS-NFHexHS-SI
points is five and steam has been decreased from 26 to 20.4 MW using two other methods
(SEWNA and EPA). It can potentially be dropped to 9.0 MW by targeting new temperatures for
the water to the pulp line. However, there is no need to target the temperature of the air to the
boilers and dryers due to the current temperature of the air inlet, which is high enough for these
air users.
Table 8-14 – The steam consumption of current situation, after applying SEWNA, EPA and also thepotential for steam reduction using R-HEN and final steam consumption after HEX network design for allsteam users of the mill – Mill C
# EquipmentCurrent(MW)
AfterSEWNA
(MW)
AfterEPA
(MW)
Potential usingR-HEN(MW)
Final after HEXnetwork design
(MW)(a) Non-Replaceable Heat Source-Steam Heater (NRHS-SH)
1 Upper heater – Digesting 3.8 3.8 3.4 3.4 3.42 Lower heater – Digesting 2.2 2.2 2.0 2.0 2.03 NaClO3 heater #1 &2 – Chem. Prep. 0.1 0.1 0.1 0.1 0.14 Chemical reboiler – Chem. Prep. 1.6 1.6 1.6 1.6 1.65 Dryer – PM 24.0 24.0 24.0 24.0 24.06 Evaporation 9.8 9.8 9.8 9.8 9.8Total NRHS-SH 41.5 41.5 40.9 40.9 40.9
(b) Replaceable Heat Source – Steam Heater (RHS-SH)1 Glycool loop – PM 7.6 2.3 2.3 0 02 Air heater - PM 4.6 4.6 4.6 0 3.03 Green liquor heater – Recaust. 1.1 1.1 1.1 0 04 Air heater – RB 6.8 6.8 6.8 0 1.85 Air heater – PB#3 1.9 1.9 1.9 0 06 Water heater – Chem. Prep. 0.3 0 0 0 0Total RHS- SH 22.3 15.6 15.6 0 4.8
(c) Feasible HEX Heat Sink – Steam Injection (FHexHS-SI)1 Silo cheat - PM 10.6 0 0 0 0Total FHexHS-SI 10.6 0 0 0 0
(d)Non-Reducible Heat Source– Non-Feasible HEX Heat Sink – Steam Injection (NRHS-NFHexHS-SI)1 Chip bin – Digesting 5.4 5.4 3.5 3.5 3.52 Steaming vessel – Digesting 6.1 6.1 3.4 3.4 3.4Total NRHS-NFHexHS-SI 11.5 11.5 6.9 6.9 6.9
(e)Reducible Heat Source– Non-Feasible HEX Heat Sink – Steam Injection (RHS-NFHexHS-SI)1 Pre-D0 washer – Bleaching 0.2 0 0 0 02 D0 washer – Bleaching 1.7 0 0 0 03 Eop – Bleaching 5.0 4.3 4.3 2.4 3.3
4WW production at steam ejectorcondenser – Chem. Prep.
1.8 0.3 0.3 0.3 0.3
5 Deaerator – Steam plant 17.3 14.9 15.8 6.3 5.7Total NRHS-NFHexHS-SI 26.0 19.5 20.4 9.0 9.3
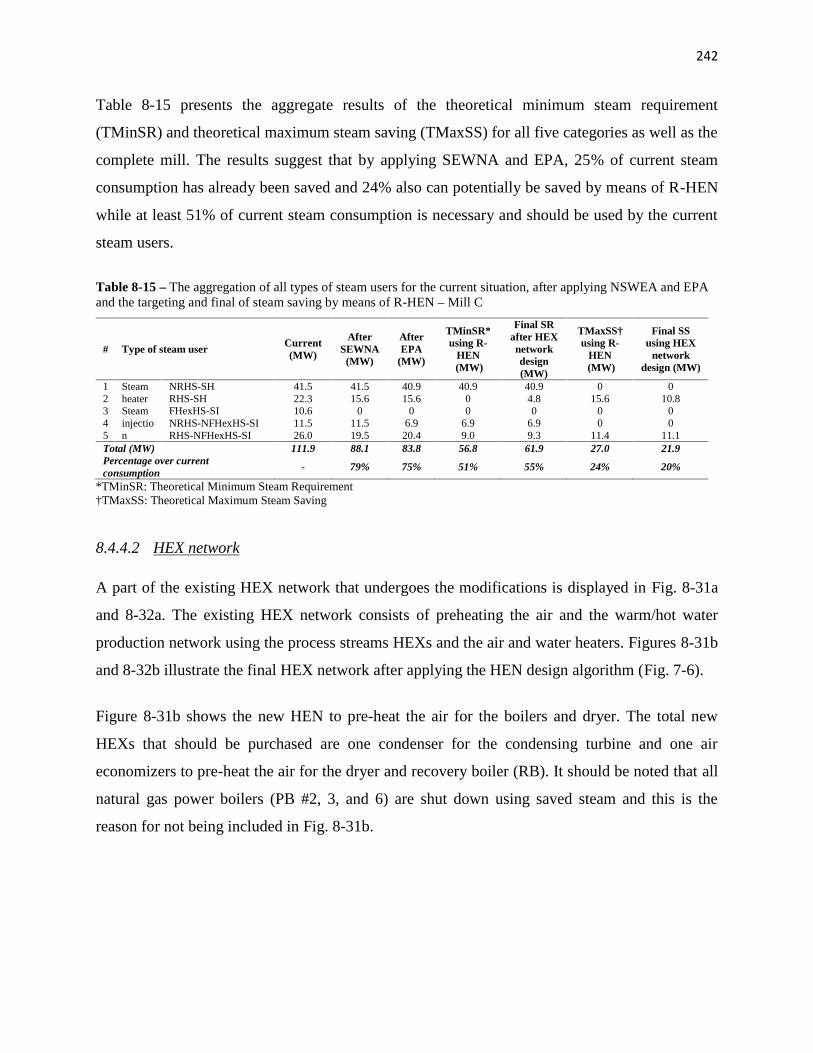
242
Table 8-15 presents the aggregate results of the theoretical minimum steam requirement
(TMinSR) and theoretical maximum steam saving (TMaxSS) for all five categories as well as the
complete mill. The results suggest that by applying SEWNA and EPA, 25% of current steam
consumption has already been saved and 24% also can potentially be saved by means of R-HEN
while at least 51% of current steam consumption is necessary and should be used by the current
steam users.
Table 8-15 – The aggregation of all types of steam users for the current situation, after applying NSWEA and EPAand the targeting and final of steam saving by means of R-HEN – Mill C
# Type of steam userCurrent(MW)
AfterSEWNA
(MW)
AfterEPA
(MW)
TMinSR*using R-
HEN(MW)
Final SRafter HEXnetworkdesign(MW)
TMaxSS†using R-
HEN(MW)
Final SSusing HEX
networkdesign (MW)
1 Steamheater
NRHS-SH 41.5 41.5 40.9 40.9 40.9 0 02 RHS-SH 22.3 15.6 15.6 0 4.8 15.6 10.83 Steam
injection
FHexHS-SI 10.6 0 0 0 0 0 04 NRHS-NFHexHS-SI 11.5 11.5 6.9 6.9 6.9 0 05 RHS-NFHexHS-SI 26.0 19.5 20.4 9.0 9.3 11.4 11.1Total (MW) 111.9 88.1 83.8 56.8 61.9 27.0 21.9Percentage over currentconsumption
- 79% 75% 51% 55% 24% 20%
*TMinSR: Theoretical Minimum Steam Requirement†TMaxSS: Theoretical Maximum Steam Saving
8.4.4.2 HEX network
A part of the existing HEX network that undergoes the modifications is displayed in Fig. 8-31a
and 8-32a. The existing HEX network consists of preheating the air and the warm/hot water
production network using the process streams HEXs and the air and water heaters. Figures 8-31b
and 8-32b illustrate the final HEX network after applying the HEN design algorithm (Fig. 7-6).
Figure 8-31b shows the new HEN to pre-heat the air for the boilers and dryer. The total new
HEXs that should be purchased are one condenser for the condensing turbine and one air
economizers to pre-heat the air for the dryer and recovery boiler (RB). It should be noted that all
natural gas power boilers (PB #2, 3, and 6) are shut down using saved steam and this is the
reason for not being included in Fig. 8-31b.
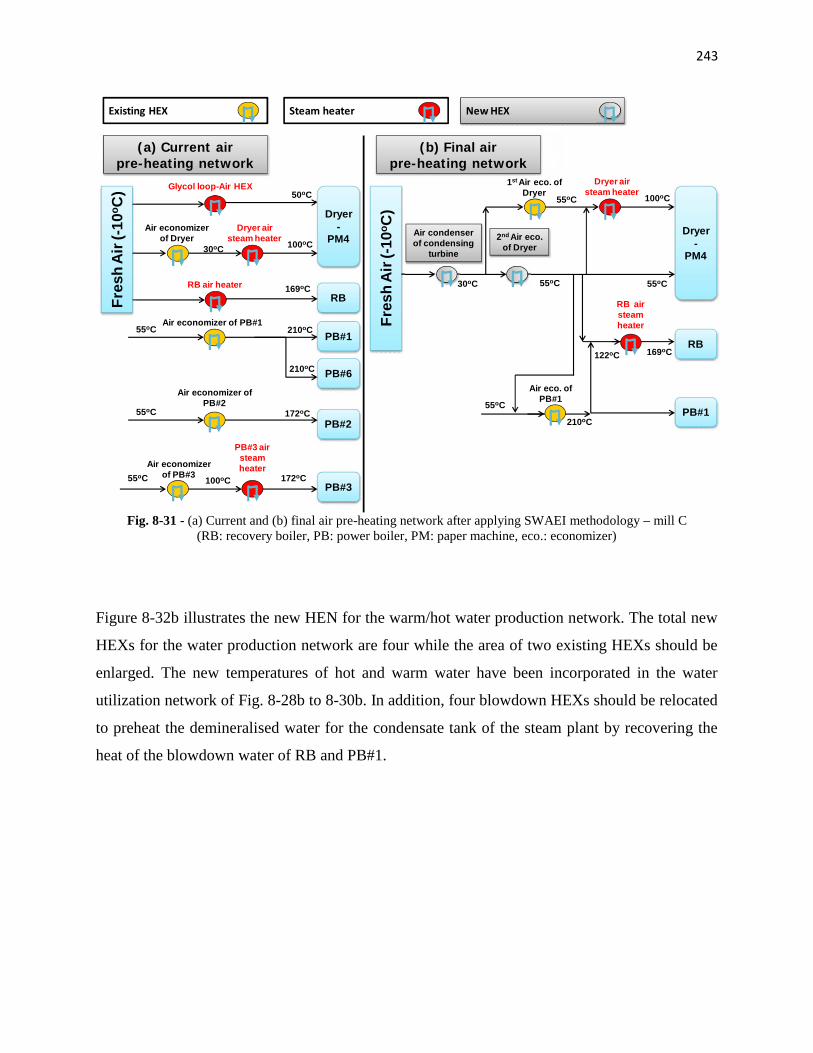
243
Fig. 8-31 - (a) Current and (b) final air pre-heating network after applying SWAEI methodology – mill C(RB: recovery boiler, PB: power boiler, PM: paper machine, eco.: economizer)
Figure 8-32b illustrates the new HEN for the warm/hot water production network. The total new
HEXs for the water production network are four while the area of two existing HEXs should be
enlarged. The new temperatures of hot and warm water have been incorporated in the water
utilization network of Fig. 8-28b to 8-30b. In addition, four blowdown HEXs should be relocated
to preheat the demineralised water for the condensate tank of the steam plant by recovering the
heat of the blowdown water of RB and PB#1.
Air economizerof Dryer
30oC
Glycol loop-Air HEX50oC
Dryer airsteam heater
100oC
Dryer-
PM4
RB air heater 169oCRB
Air economizer of PB#1210oC PB#1
PB#6
55oC
Air economizer ofPB#2
172oCPB#2
PB#3100oC
PB#3 airsteamheater
172oCAir economizer
of PB#355oC
Fres
h A
ir (-
10o C
)
210oC
55oC
1st Air eco. ofDryer
55oC
Dryer airsteam heater
100oC
Dryer-
PM4
RB
210oCPB#1
55oC
Air condenserof condensing
turbine
55oC
2nd Air eco.of Dryer
55oC
RB airsteamheater
169oC
Air eco. ofPB#1
(a) Current airpre-heating network
(b) Final airpre-heating network
New HEXSteam heaterExisting HEX
122oC
Fres
h A
ir (-
10o C
)
30oC

244
Fig. 8-32 - (a) Current and (b) final water production network after applying SWAEI methodology – mill C (WWT:warm water tank, HWT: hot water tank, chem. Prep.: chemical preparation, RB: recovery boiler, PB: power boiler)
HEX of cleanflashed Steam -PM
Treatedwater Tank
– PM4(11oC)
12oC
Water economizer #1 of Dryer- PM
46oC WWT ofPM4
(46oC)
Proc
ess
Water economizer #2 of Dryer- PM
46oC
To PM
Indirect contact cooler – Chem. Prep.20oC
Steam ejector condenser – Chem. Prep.11oC
Eop Exchanger
35.4oC12oC
Warm water steam heater – Chem. prep.
55oCTo Chem. Prep.
WWT(36oC)
To Bleaching
Surface condenser - Evaporation
20oC
Wet scrubber
50oC44oC
To Process
To Process
36oC
55oC
46oC
50oCSurface condenser - Digesting80oC
Non condensable gas surface condenser47oC
Chip bin surface condenser 46oC
To Process60oC
Glycol loop/Water HEX-PM
90oC
HWT(60oC)
48oC 48oCTo Process
Demineralizedwater (2oC) Deaerator
Steam
Boi
lers
130.5oC
Condensatetank –
Steam Plant
FW (2
o C)
(a) Current water production network
New HEXEnlarged existing HEXSteam heater
Existing HEX Relocated HEX
Surface condenser -Evaporation
85oC
Water economizer #1 of Dryer- PM
38oC
HWT(81oC)
Proc
ess
Water economizer #2 of Dryer- PM
38oC
To Washer #5
Indirect contact cooler – Chem. Prep.20oC
Steam ejector condenser – Chem. Prep.10oC
Cooler of filtratetank Washer
#3&4 overflow-Washing
40oC7oC
57oC
81oC
Non condensable gas surface condenser57oC
Chip bin surface condenser57oC
Surface condenser - Digesting85oC
Cooler of non-cleancondensate -Digesting
70oC
40oCWet Scrubber
70oC
WWT(38.5oC)
To Washer #5& PM
70oCHWT(70oC)
1st Eop exchanger70oC
70oC 40oC
WWT(57oC)
Acidic effluentexchanger of D0
55oC
FW (2
o C)
BlowdownHEXs
62oC
To Process
70oC
Deaerator
Steam
130.5oC Boi
lers
Demineralizedwater (2oC)
Condensatetank –
Steam Plant
(b) Final water production networkHEX of clean flashed
Steam -PM
2nd Eop exchanger70oC
245
8.4.4.3 Steam saving
Table 8-14 presents the final steam consumption for all five categories of steam users. The
results show that at RHS-SH, the estimation was to replace the steam with other heat sources, but
in practice for 4.8 MW of steam at the air heater-PM and air heater-RB, the goal cannot be
achieved; however, the steam saving is still significant (10.8 MW). At RHS-NFHexHS-SI, the
steam injection can be reduced by 11.1 MW while the estimation was 11.4 MW, which are
substantially close to one another.
Table 8-15 displays the final steam requirement after the final HEN design. It also shows the
estimated steam saving using the R-HEN approach and final steam savings after the final
network design. The total steam saving using R-HEN is considerably high and accounts for 20%
of current steam consumption of the mill. The saving when it is added to ones that have been
achieved by SEWNA and EPA (25%) comes to 45% of current steam consumption, which is
extremely high. The results also show that the theoretical maximum steam saving (TMaxSS) is
considerably close to the final steam saving (24 vs. 20%).
8.4.5 Summary of improvements
Table 8-16 presents the total number of projects, the increase in steam production, and steam and
water savings. In addition, capital cost requirements for piping in the water network from the
SEWNA, the improvement of equipment and departments using EPA, and the installation of the
new HEX area by means of R-HEN are shown. The operating costs related to the performance
changes and the new HEX area are also calculated. The excess steam consists of an increase in
steam generation at the boilers and steam saving. It is 73.5 MW that accounts for 66% of current
steam consumption. The total water saving is 1019 m3/h or 58% of current water consumption.
These 30 projects entail 9.54 M$ in capital costs and add 338 k$/a (0.34 M$/a) to the operating
costs of the mill.

246
Table 8-16 – Summary of improvements applying three process integration techniques in sequence – Mill C
Step ofMethodology
Number ofprojects
Increase in steamgeneration at the
boilersSteam saving Water saving
Capitalcost
Operatingcost
MW % MW % m3/h % M$ k$/aNSWEA 14 - - 23.8 21 994 57 1.72 -EPA 5 23.5 21 4.3 4 25 1 1.26 174R-HEN 12 - - 21.9 20 - - 6.56 164Total 31 23.5 21% 50 45% 1019 58% 9.54 338
8.4.6 Step 4: Energy Upgrading and Conversion
The excess steam is used to shut down all three natural gas (NG) power boilers that produce 64.5
MW of steam. Since the quantity of excess steam after shutting down the NG boilers and
excluding the need of mill is not sufficient for exporting to the local district, the two alternatives
of selling steam are excluded from the study for this mill. Therefore, the two other alternatives,
including cogeneration only and trigeneration, are examined and illustrated in Fig. 8-33. In the
current configuration of the steam plant of the mill, there is no installed turbine and, hence, there
is no necessity to generate high pressure (HP) steam at the boilers. Herein, in both
configurations, it has been assumed that the mill is able to produce the HP steam rather than the
existing medium pressure (MP) steam.

247
Fig. 8-33 - (a)Alt. 1 – Cogeneration and selling electricity to the grid, (b) Alt. 2 – trigeneration and selling electricityto the grid – mill C (G: generator, C: condenser, A: absorber, E, evaporator, Gen.: turbine generator)
In Alt. 1 (Fig. 8-33a) with the installation of the MP and LP back-pressure turbines and
condensing turbine, 9.1 MW of electricity can be generated.
There are two sources of non-clean steams (Fig. 8-33b) that can be utilized at the evaporator (E1
or E2) of LiBr/H2O AHP with the coefficient of performance (COP) of 1.55 (Marinova et al.,
2007) and generate low pressure (LP) steam at the absorber (A1 or A2) and condenser (C1 or C2).
These non-clean steams are currently condensed at the surface condensers of evaporation and
digesting to produce hot and warm water (Fig. 8-32). Therefore, to produce these hot and warm
waters, the adjustment to replace the non-clean steams with other heat sources is considered. The
MP steam (35.8 MW) from the MP back pressure turbine is used as the heat driver at the
generator (G1 or G2) of AHPs and in total can save 11.9 MW (10%) of steam consumption.
Gen.
Electricity
MP SteamMP Steamto process
Gen.
Electricity
LP Steam
Gen.
Electricity
LP Steamto process
MP Back-PressureTurbine
LP Back-PressureTurbine
CondensateTurbine
Condensate
54.7 MW7.2 MW
5.0 MW 3.3 MW 0.8 MW75.3 MW
HP Steamfrom boilers
(a) Alt. 1 - Cogeneration and selling electricity to grid
Gen.
Electricity
HP Steamfrom boilers
MP Steam
MP Steamto process
Gen.
Electricity
LP Steam
Gen.
Electricity
LP Steamto process
LP Back-PressureTurbine
CondensateTurbine
Condensate
E1 A1
C1 G1
QE1
QG1
QA1+ QC1
E2 A2
C2 G2
QE2
QG2
QA2+ QC2
MP Back-PressureTurbine
Non-cleansteam ofDigesting
Non-cleansteam of
Evaporation
5.0 MW 1.5 MW 2.9 MW75.3 MW
6.3 MW 29.2 MW
38.9 MW8.5 MW
7.3 MW
7.2 MW
(b) Alt. 2 - Trigeneration and selling electricity to grid

248
However, this excess saving does not result in significant extra electricity generation in
comparison to Alt. 1 (9.4 vs. 9.1MW). In this sense, Alt. 1 is more attractive for implementation;
however, the economic aspects of both alternatives are presented in next section.
The total capital cost of Alt. 1 is 7.73 M$ to purchase three turbines with 456 k$/a of operating
costs while the capital cost of the cogenerations and AHPs of Alt. 2 are respectively 9.29 and
20.85 M$ and add approximately 1.0 M$/a in operating costs.
8.4.6.1 Economic analysis of two alternatives
As mentioned earlier, the excess steam of 73.5 MW can be used to eliminate the need for fossil
fuel consumption. The natural gas power boilers #2, #3, and #6 that respectively generate 18.7,
27.7, and 18.1 MW steam can be completely shut down, so the total natural gas saving is 6520
GJ/d. The remainder of steam is used according to two alternatives (Fig. 8-33). The following
economic data of the mill and also some assumptions are employed for the profitability
calculation on the 2012 basis:
o The natural gas price is 6.0 $/GJ.
o The price of fresh water is 0.0175 $/m3.
o The price for effluent treatment is 0.069 $/m3.
o The selling price of electricity to the grid is 90 $/MWhr (Mateos-Espejel et al., 2011c).
o Number of operating days is 354 (Browne et al., 2011).
The total reduction in effluent production, water and natural gas savings, and electricity
generation are translated into costs and summarized in Table 8-17. The natural gas saving is the
biggest portion of net profit in both alternatives. Purchasing the new HEX area and turbines in
Alt. 1 are the main contributors to total capital costs. The capital cost of Alt. 2 is more than twice
that of Alt.1 and it is due to purchasing very expensive AHPs. The payback period of Alt. 1,
which is the installation of cogeneration and selling electricity to the grid, is attractively short
and takes 0.8a to recover all the capital costs. On the other hand, the payback period of Alt. 2
with trigeneration and selling electricity to the grid is slightly shorter than two years (1.9a).
Therefore, the short payback period, low capital cost, and higher net profit make Alt. 1 extremely
attractive for investment.
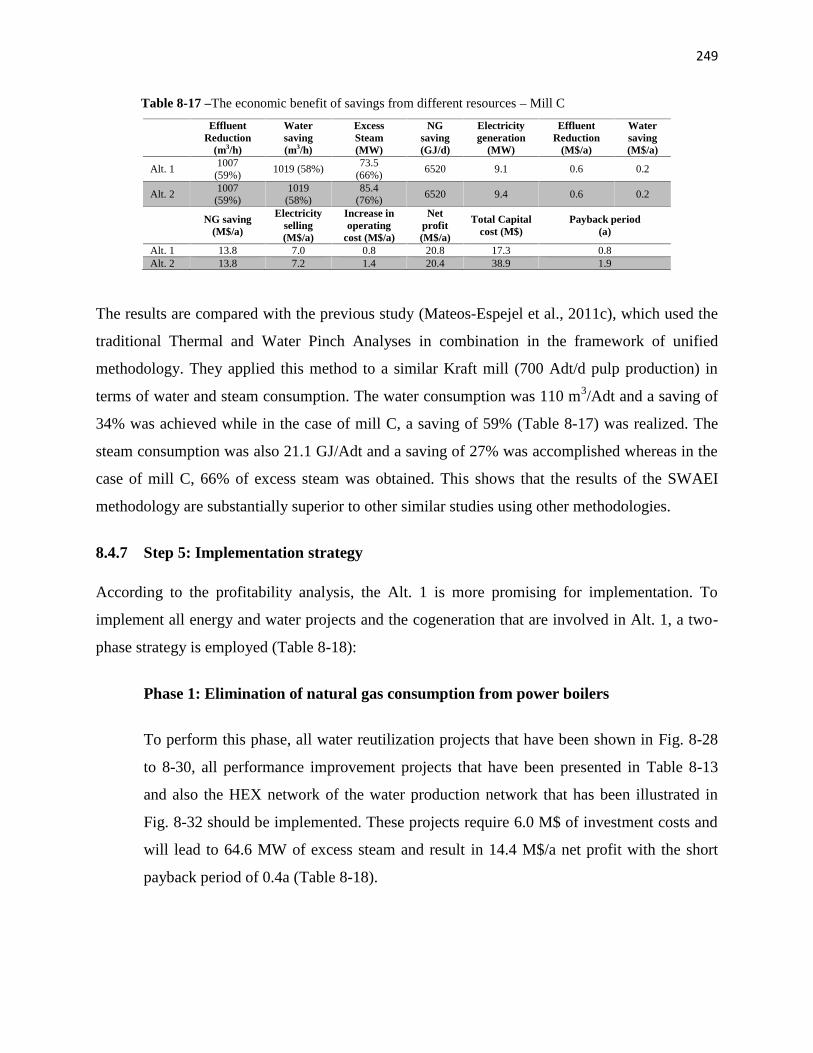
249
Table 8-17 –The economic benefit of savings from different resources – Mill C
EffluentReduction
(m3/h)
Watersaving(m3/h)
ExcessSteam(MW)
NGsaving(GJ/d)
Electricitygeneration
(MW)
EffluentReduction
(M$/a)
Watersaving(M$/a)
Alt. 11007
(59%)1019 (58%)
73.5(66%)
6520 9.1 0.6 0.2
Alt. 21007
(59%)1019
(58%)85.4
(76%)6520 9.4 0.6 0.2
NG saving(M$/a)
Electricityselling(M$/a)
Increase inoperating
cost (M$/a)
Netprofit(M$/a)
Total Capitalcost (M$)
Payback period(a)
Alt. 1 13.8 7.0 0.8 20.8 17.3 0.8Alt. 2 13.8 7.2 1.4 20.4 38.9 1.9
The results are compared with the previous study (Mateos-Espejel et al., 2011c), which used the
traditional Thermal and Water Pinch Analyses in combination in the framework of unified
methodology. They applied this method to a similar Kraft mill (700 Adt/d pulp production) in
terms of water and steam consumption. The water consumption was 110 m3/Adt and a saving of
34% was achieved while in the case of mill C, a saving of 59% (Table 8-17) was realized. The
steam consumption was also 21.1 GJ/Adt and a saving of 27% was accomplished whereas in the
case of mill C, 66% of excess steam was obtained. This shows that the results of the SWAEI
methodology are substantially superior to other similar studies using other methodologies.
8.4.7 Step 5: Implementation strategy
According to the profitability analysis, the Alt. 1 is more promising for implementation. To
implement all energy and water projects and the cogeneration that are involved in Alt. 1, a two-
phase strategy is employed (Table 8-18):
Phase 1: Elimination of natural gas consumption from power boilers
To perform this phase, all water reutilization projects that have been shown in Fig. 8-28
to 8-30, all performance improvement projects that have been presented in Table 8-13
and also the HEX network of the water production network that has been illustrated in
Fig. 8-32 should be implemented. These projects require 6.0 M$ of investment costs and
will lead to 64.6 MW of excess steam and result in 14.4 M$/a net profit with the short
payback period of 0.4a (Table 8-18).
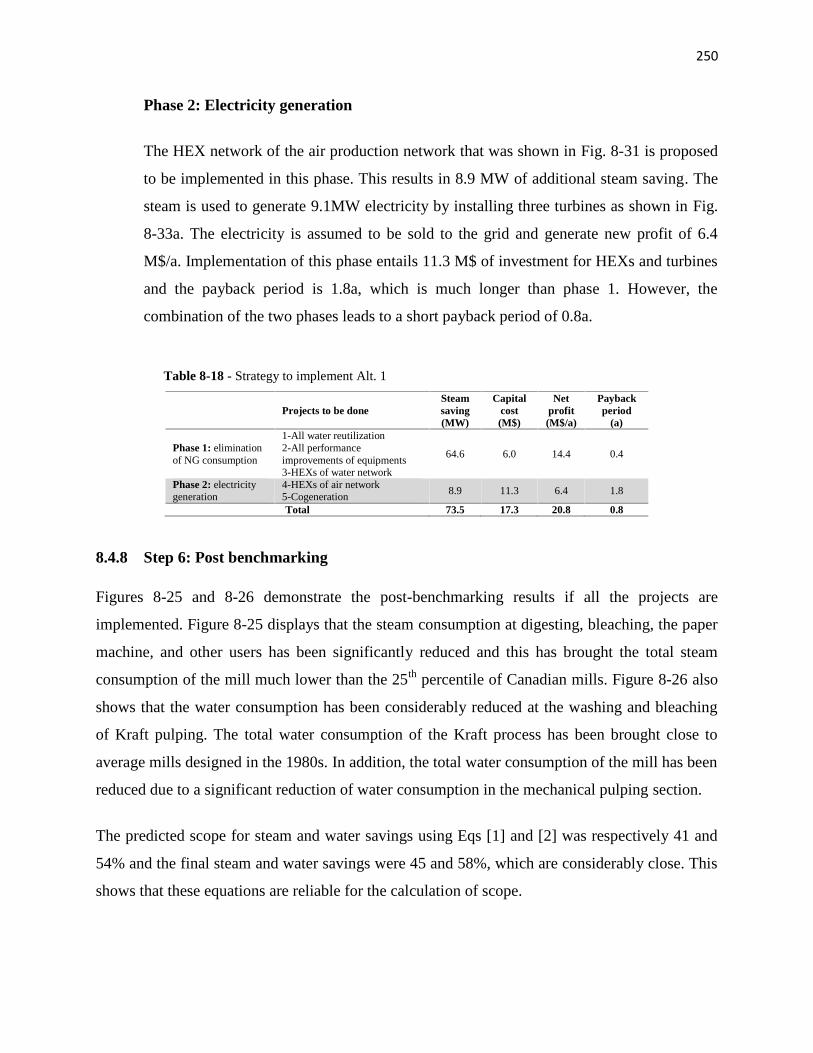
250
Phase 2: Electricity generation
The HEX network of the air production network that was shown in Fig. 8-31 is proposed
to be implemented in this phase. This results in 8.9 MW of additional steam saving. The
steam is used to generate 9.1MW electricity by installing three turbines as shown in Fig.
8-33a. The electricity is assumed to be sold to the grid and generate new profit of 6.4
M$/a. Implementation of this phase entails 11.3 M$ of investment for HEXs and turbines
and the payback period is 1.8a, which is much longer than phase 1. However, the
combination of the two phases leads to a short payback period of 0.8a.
Table 8-18 - Strategy to implement Alt. 1
Projects to be doneSteamsaving(MW)
Capitalcost(M$)
Netprofit(M$/a)
Paybackperiod
(a)
Phase 1: eliminationof NG consumption
1-All water reutilization2-All performanceimprovements of equipments3-HEXs of water network
64.6 6.0 14.4 0.4
Phase 2: electricitygeneration
4-HEXs of air network5-Cogeneration
8.9 11.3 6.4 1.8
Total 73.5 17.3 20.8 0.8
8.4.8 Step 6: Post benchmarking
Figures 8-25 and 8-26 demonstrate the post-benchmarking results if all the projects are
implemented. Figure 8-25 displays that the steam consumption at digesting, bleaching, the paper
machine, and other users has been significantly reduced and this has brought the total steam
consumption of the mill much lower than the 25th percentile of Canadian mills. Figure 8-26 also
shows that the water consumption has been considerably reduced at the washing and bleaching
of Kraft pulping. The total water consumption of the Kraft process has been brought close to
average mills designed in the 1980s. In addition, the total water consumption of the mill has been
reduced due to a significant reduction of water consumption in the mechanical pulping section.
The predicted scope for steam and water savings using Eqs [1] and [2] was respectively 41 and
54% and the final steam and water savings were 45 and 58%, which are considerably close. This
shows that these equations are reliable for the calculation of scope.

251
8.4.9 Comparison of stand alone techniques and SWAEI methodology
Three stand alone techniques (SEWNA, EPA, and R-HEN) have already been applied to mill C
in previous chapters (5, 6, and 7). The results of SWAEI methodology and stand alone
techniques are compared in Fig. 8-34. The graph shows that the excess steam, including steam
saving and an increase in steam generation at the boilers, are improved significantly by coupling
these three techniques compared to engaging them separately. In addition, the capital cost
requirement is slightly bigger for SWAEI compared to R-HEN, because cogeneration requires
7.7 M$. If this cost is excluded from the total cost of SWAEI, the capital cost from HEXs, water
reutilization, and performance improvement projects would be 9.6 M$, which is less than the
capital cost of R-HEN because some of the improvements are done in SEWNA and EPA. In
addition, most of the elimination or reduction of non-isothermal mixing (NIM) is carried out in
SEWNA. Therefore, it is not necessary to purchase many new HEXs to recover the heat and also
eliminate or reduce NIM. The net profit is furthermore significantly larger when three techniques
along with cogeneration are performed together due to the elimination of fossil fuel and
electricity generation while in a separate application, only a part of fossil fuel can be reduced.
These differences make the shorter payback period for the SWAEI methodology in comparison
to case of R-HEN.
Fig. 8-34 – Comparison between the results of applying three techniques stand alone and in sequence in theframework of SWAEI methodology – Mill C
32
1.7
33.842.1
73.5
Excess steam (MW) Capital cost (M$)
SEWNA standalone
R-HEN standalone
251
8.4.9 Comparison of stand alone techniques and SWAEI methodology
Three stand alone techniques (SEWNA, EPA, and R-HEN) have already been applied to mill C
in previous chapters (5, 6, and 7). The results of SWAEI methodology and stand alone
techniques are compared in Fig. 8-34. The graph shows that the excess steam, including steam
saving and an increase in steam generation at the boilers, are improved significantly by coupling
these three techniques compared to engaging them separately. In addition, the capital cost
requirement is slightly bigger for SWAEI compared to R-HEN, because cogeneration requires
7.7 M$. If this cost is excluded from the total cost of SWAEI, the capital cost from HEXs, water
reutilization, and performance improvement projects would be 9.6 M$, which is less than the
capital cost of R-HEN because some of the improvements are done in SEWNA and EPA. In
addition, most of the elimination or reduction of non-isothermal mixing (NIM) is carried out in
SEWNA. Therefore, it is not necessary to purchase many new HEXs to recover the heat and also
eliminate or reduce NIM. The net profit is furthermore significantly larger when three techniques
along with cogeneration are performed together due to the elimination of fossil fuel and
electricity generation while in a separate application, only a part of fossil fuel can be reduced.
These differences make the shorter payback period for the SWAEI methodology in comparison
to case of R-HEN.
Fig. 8-34 – Comparison between the results of applying three techniques stand alone and in sequence in theframework of SWAEI methodology – Mill C
1.7
8.8
0.21.7
8.8
0.2
13.4
9.9
17.3
20.8
Capital cost (M$) Net profit (M$/a) Payback period (a)
EPA standalone
SWAEI methodology
Cogeneration7.7 M$
SEWNA,EPA, &R-HEN9.6 M$
Electricty ofCogeneration:
6.4 M$/a
Fossil fuel &wastewaterand water
treantment:14.4 M$/a
251
8.4.9 Comparison of stand alone techniques and SWAEI methodology
Three stand alone techniques (SEWNA, EPA, and R-HEN) have already been applied to mill C
in previous chapters (5, 6, and 7). The results of SWAEI methodology and stand alone
techniques are compared in Fig. 8-34. The graph shows that the excess steam, including steam
saving and an increase in steam generation at the boilers, are improved significantly by coupling
these three techniques compared to engaging them separately. In addition, the capital cost
requirement is slightly bigger for SWAEI compared to R-HEN, because cogeneration requires
7.7 M$. If this cost is excluded from the total cost of SWAEI, the capital cost from HEXs, water
reutilization, and performance improvement projects would be 9.6 M$, which is less than the
capital cost of R-HEN because some of the improvements are done in SEWNA and EPA. In
addition, most of the elimination or reduction of non-isothermal mixing (NIM) is carried out in
SEWNA. Therefore, it is not necessary to purchase many new HEXs to recover the heat and also
eliminate or reduce NIM. The net profit is furthermore significantly larger when three techniques
along with cogeneration are performed together due to the elimination of fossil fuel and
electricity generation while in a separate application, only a part of fossil fuel can be reduced.
These differences make the shorter payback period for the SWAEI methodology in comparison
to case of R-HEN.
Fig. 8-34 – Comparison between the results of applying three techniques stand alone and in sequence in theframework of SWAEI methodology – Mill C
0.2
1.3
0.8
Payback period (a)
Electricty ofCogeneration:
6.4 M$/a

252
8.5 Comparison of the Results of Three Kraft Mills
Water and steam consumption of three mills in their current situation and after applying SWAEI
methodology is benchmarked against reference data (Fig. 8-35). Figure 8-35a shows that by
applying SWAEI methodology, it is possible to significantly reduce the water consumption and
bring it close to average mills designed in the 1980s. However, mill B is currently well-managed
in terms of its water system and consumes even less than average mills designed in the 1980s but
the water reutilization system has been improved. This could also explain the lower water saving
(24%) of this mill compared to two other cases.
Figure 8-35b illustrates the steam consumption for three mills. Mill A is a dissolving Kraft pulp
with a batch digester and is benchmarked against the data for Kraft paper pulp with a batch
digester due to a lack of data for benchmarking against dissolving Kraft pulp with a batch
digester. As mentioned, the principal difference between dissolving and Kraft paper pulp is that
there is an extra step before digesting, called pre-hydrolysis, to separate the hemicelluloses.
Therefore, it is possible to divide the mill into two parts for benchmarking: the pre-hydrolysis
and the Kraft paper pulp with the batch digester (Keshtkar et al., 2013). For this mill, steam
consumption of less than the 25th percentile of Canadian mills can be accomplished by applying
the SWAEI methodology. The steam consumption of mills B and C after applying the
methodology is also smaller than the 25th percentile of Canadian ones. These results suggest that
this methodology could yield high steam and water savings. It could also make the performance
of the mill similar to the most efficient mills in Canada from a steam and water consumption
perspectives.
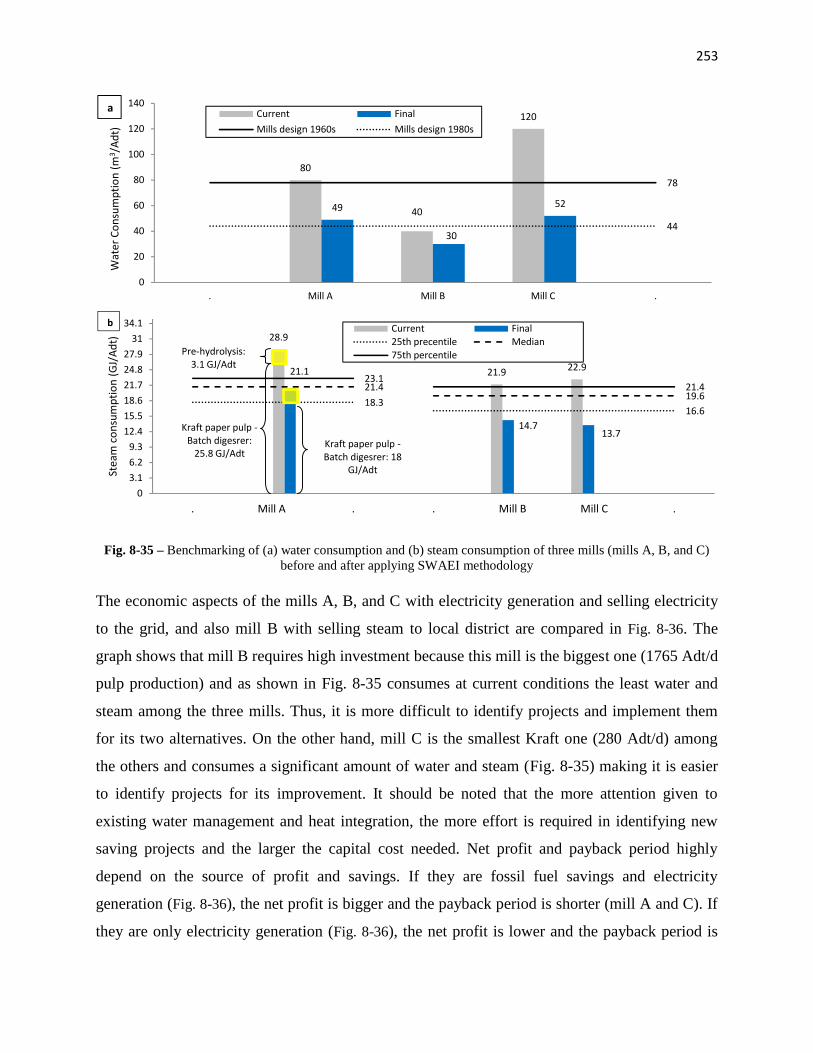
253
Fig. 8-35 – Benchmarking of (a) water consumption and (b) steam consumption of three mills (mills A, B, and C)before and after applying SWAEI methodology
The economic aspects of the mills A, B, and C with electricity generation and selling electricity
to the grid, and also mill B with selling steam to local district are compared in Fig. 8-36. The
graph shows that mill B requires high investment because this mill is the biggest one (1765 Adt/d
pulp production) and as shown in Fig. 8-35 consumes at current conditions the least water and
steam among the three mills. Thus, it is more difficult to identify projects and implement them
for its two alternatives. On the other hand, mill C is the smallest Kraft one (280 Adt/d) among
the others and consumes a significant amount of water and steam (Fig. 8-35) making it is easier
to identify projects for its improvement. It should be noted that the more attention given to
existing water management and heat integration, the more effort is required in identifying new
saving projects and the larger the capital cost needed. Net profit and payback period highly
depend on the source of profit and savings. If they are fossil fuel savings and electricity
generation (Fig. 8-36), the net profit is bigger and the payback period is shorter (mill A and C). If
they are only electricity generation (Fig. 8-36), the net profit is lower and the payback period is
80
0
20
40
60
80
100
120
140
. Mill A
Wat
er C
onsu
mpt
ion
(m3 /
Adt)
CurrentMills design 1960s
a
28.9
21.1
03.16.29.3
12.415.518.621.724.827.9
3134.1
. Mill A
Stea
m c
onsu
mpt
ion
(GJ/
Adt)
Kraft paper pulp -Batch digesrer:
25.8 GJ/Adt
Pre-hydrolysis:3.1 GJ/Adt
b
253
Fig. 8-35 – Benchmarking of (a) water consumption and (b) steam consumption of three mills (mills A, B, and C)before and after applying SWAEI methodology
The economic aspects of the mills A, B, and C with electricity generation and selling electricity
to the grid, and also mill B with selling steam to local district are compared in Fig. 8-36. The
graph shows that mill B requires high investment because this mill is the biggest one (1765 Adt/d
pulp production) and as shown in Fig. 8-35 consumes at current conditions the least water and
steam among the three mills. Thus, it is more difficult to identify projects and implement them
for its two alternatives. On the other hand, mill C is the smallest Kraft one (280 Adt/d) among
the others and consumes a significant amount of water and steam (Fig. 8-35) making it is easier
to identify projects for its improvement. It should be noted that the more attention given to
existing water management and heat integration, the more effort is required in identifying new
saving projects and the larger the capital cost needed. Net profit and payback period highly
depend on the source of profit and savings. If they are fossil fuel savings and electricity
generation (Fig. 8-36), the net profit is bigger and the payback period is shorter (mill A and C). If
they are only electricity generation (Fig. 8-36), the net profit is lower and the payback period is
80
40
120
49
30
52
Mill A Mill B Mill C
FinalMills design 1960s Mills design 1980s
21.9 22.9
14.713.7
21.1
18.321.423.1
. . Mill B Mill C
Current Final25th precentile Median75th percentile
Kraft paper pulp -Batch digesrer: 18
GJ/Adt
253
Fig. 8-35 – Benchmarking of (a) water consumption and (b) steam consumption of three mills (mills A, B, and C)before and after applying SWAEI methodology
The economic aspects of the mills A, B, and C with electricity generation and selling electricity
to the grid, and also mill B with selling steam to local district are compared in Fig. 8-36. The
graph shows that mill B requires high investment because this mill is the biggest one (1765 Adt/d
pulp production) and as shown in Fig. 8-35 consumes at current conditions the least water and
steam among the three mills. Thus, it is more difficult to identify projects and implement them
for its two alternatives. On the other hand, mill C is the smallest Kraft one (280 Adt/d) among
the others and consumes a significant amount of water and steam (Fig. 8-35) making it is easier
to identify projects for its improvement. It should be noted that the more attention given to
existing water management and heat integration, the more effort is required in identifying new
saving projects and the larger the capital cost needed. Net profit and payback period highly
depend on the source of profit and savings. If they are fossil fuel savings and electricity
generation (Fig. 8-36), the net profit is bigger and the payback period is shorter (mill A and C). If
they are only electricity generation (Fig. 8-36), the net profit is lower and the payback period is
78
44
.
13.7
16.619.621.4
Mill C .

254
longer (mill B – electricity generation) because mill B does not use fossil fuel for its boilers and
the saved steam is just used to generate electricity. However, if there is a market for exporting
large quantities of steam (mill B- selling steam to local district), the net profit will increase and
the payback period will be shorter (Fig. 8-36).
Fig. 8-36 – Comparison of the capital cost, net profit, and payback period after applying SWAEI methodology onthree Canadian Kraft mills (mills A, B, and C)
8.6 Sensitivity Analysis over Main Parameters of Selected Alternatives
Sensitivity analysis on profitability criteria has been carried out on two types of factors: the
effect of summer condition and also cost factors.
8.6.1 Effects of summer condition
In this study, the winter condition as worst case and harshest condition has been evaluated while
the summer condition would slightly change the final results (Fig. 8-37). In this sense, six
months are considered as winter and six months as summer. The temperatures are -10 and 25oC
for air and 2 and 15oC for fresh air in winter and summer conditions, respectively. The results
show that the total excess steam and net profit for all cases are greater than if the winter
condition would be taken into account while net profit reduces.
33.2
18.6 1.8
53.4
17.0
3.1
42.5
20 2.117.3
20.8
0.8
Capital cost (M$) Net profit (M$/a) Payback period (a)
Mill A-Fossil fuel saving & Electricity generation Mill B-Electricity generation
Mill B-Selling steam to local district Mill C-Fossil fuel saving & Electricity generation

255
Fig. 8-37 - Effect of summer condition on the final results of selected alternatives
8.6.2 Effects of cost factors
Different scenarios of cost factors have been examined for selected alternatives over whole year
condition (6 months summer & 6 months winter). In all cases, the effect of cost factor over
payback period has been assessed. The scenarios are defined in Table 8-19. The cost factors are
capital cost, bunker oil, electricity, steam, and natural gas prices.
Table 8-19 - Scenarios for sensitivity analysis over cost factors
Cost Factor Mill ScenariosWorst Medium-Worst Base Medium- Best Best
Capital cost-CC (M$) A, B& C CC+10% CC+5% CC CC-5% CC-10%Bunker oil price-BOP ($/t) A 450 550 650 750 850Electricity price-EP ($/MWh) A, B& C 70 80 90 100 110Steam price-STP ($/GJ) B 2.97 3.57 4.17 4.77 5.37Natural gas price-NGP ($/GJ) C 2 4 6 7 8BOP($/t)+EP($/MWh) A 450, 70 550, 80 650, 90 750, 100 850, 110CC (M$) +BOP($/t)+EP($/MWh) A CC+10%, 450, 70 CC+5%, 550, 80 CC, 650, 90 CC-5%, 750, 100 CC-10%, 850, 110CC (M$) +EP($/MWh) B CC+10%, 70 CC+5%, 80 CC, 90 CC-5%, 100 CC-10%, 110CC (M$) +STP($/GJ) B CC+10%, 2.97 CC+5%, 3.57 CC, 4.17 CC-5%, 4.77 CC-10%, 5.37NGP($/GJ)+EP($/MWh) C 2, 70 4, 80 6, 90 7, 100 8, 110CC (M$) +NGP($/GJ)+EP($/MWh) C CC+10%, 2, 70 CC+5%, 4, 80 CC, 6, 90 CC-5%, 7, 100 CC-10%, 8, 110
The results of sensitivity analysis are summarized in Fig. 8-38. The figure shows that the most
sensitive parameter for mill A and C is fossil fuel price while the two other parameters (capital
2718.6 1.8
28
19.0 1.7
33
17.0
3.136
19.3
2.833
20.0 2.1
36
21.8 1.9
66
20.8
0.8
68
21.1
0.8
Excess Steam (%) Net Profit (M$/a) Payback Period (a)
Winter Condition - Mill A (Fossil fuel saving+Electricity Generation)
50% Winter+50% Summer Condition - Mill A (Fossil fuel saving+Electricity Generation)
Winter Condition - Mill B (Electricity Generation)
50% Winter+50% Summer Condition - Mill B (Electricity Generation)
Winter Condition - Mill B (Steam Sale)
50% Winter+50% Summer Condition - Mill B (Steam Sale)
Winter Condition - Mill C (Fossil fuel saving+Electricity Generation)
50% Winter+50% Summer Condition - Mill C (Fossil fuel saving+Electricity Generation)
256
cost and electricity price) have minor impacts on the length of payback period. Combination of
different scenarios such as “fossil fuel (BOP or NGP) and electricity (EP) prices” scenario and
“capital cost (CC), BOP or NGP, and EP” would increase the effect on payback period.
However, even in the worst case, the payback period is still reasonable. For the case of mill A, it
is less than three years while with the base case in winter condition, it was 1.5 years. For mill C,
it is less than two years while with the base case in winter condition, it was 0.8 years.
For the case of mill B and only electricity generation, the electricity price is more sensitive than
capital cost. Similar to mill A, combination of them would increase the effect on payback period.
The worst case scenario in this alternative does not seem attractive whereas even the payback
period of medium-worst case (3.3a) is close to winter condition (3.1a) and still is justified for
investment.
For the mill B and only selling steam to local district, the steam price is more sensitive than
capital cost. Combination of them would increase the effect on payback period. However, even
the worst case scenario is still attractive for investment compared to winter condition that
resulted in 2.1 years of payback period.

257
Fig. 8-38 - Effect of capital cost (CC), bunker oil price (BOP), electricity price (EP), steam price (STP), natural gasprice (NGP), and combination of them over payback period for selected alternatives for implementation and whole
year (6 months summer & 6 months winter) and comparison with only winter condition (red dot)
8.7 Conclusion
The steam and water analysis enhancement and integration (SWAEI) methodology has been
developed to improve the energy and water efficiency of a water-based process. This method
combines different techniques to achieve the goal. The base case is defined and the simulation of
the process is constructed to supply data for analysis and also incorporate the proposed
modifications. The pre-benchmarking identifies the areas of inefficiencies in water and steam
systems. The scope for saving is easily identified by means of the developed rule of thumb
approach.
1.1
1.5
1.9
2.3
2.7
0 1 2 3 4 5
Payb
ack
perio
d (a
)
Number of scenario
Mill A - Fossil fuel saving & Electricty Gen.
CC BOPEP BOP+EPCC+BOP+EP Winter Condition
1.8
2.4
3.0
3.6
4.2
0 1 2 3 4 5
Payb
ack
perio
d (a
)
Number of scenario
Mill B - Electricity generation
CC EP CC+EP Winter Condition
1.3
1.6
1.9
2.2
2.5
2.8
3.1
0 1 2 3 4 5
Payb
ack
perio
d (a
)
Number of scenario
MillB - Steam Sale
CC STP CC+STP Winter Condition
0.5
0.8
1.1
1.4
1.7
2.0
0 1 2 3 4 5
Payb
ack
perio
d (a
)
Number of scenario
Mill C - Fossil fuel saving & Electricity Gen.
CC NGPEP NGP+EPCC+NGP+EP Winter Condition
258
SWAEI methodology employs three recent techniques to identify projects for improvements.
These techniques include simultaneous energy and water networks analysis (SEWNA),
equipment performance analysis (EPA), and retrofit HEX network design (R-HEN). Sequential
application of these techniques results in significantly more steam saving than if they would have
been applied individually. This sequential application leads to complementary projects to
maximize steam saving.
The proposition of a heat pump requires in-depth evaluation of the technical and economical
factors. This analysis shows that heat pumping is not always a promising solution. Cogeneration
always is a good option to improve the energy efficiency of the whole process and generate
electricity to sell to the grid after the reduction or elimination of fossil fuel consumption. When
the quantity of excess steam is huge, selling the steam to the local district also is a profitable
alternative. Either selling electricity or steam generates new revenue for the process.
The strategy for implementation would provide the roadmap to achieve the process with
significantly
o less steam and water consumption,
o lower/free fossil fuel consumption,
o less negative environmental impact by lower CO2 emissions and wastewater generation,
o greener and more sustainable products,
o and, finally, bigger net profit.
The methodology is not specific to a certain water-based process. However, each process has its
own specific characteristics and defining the constraints should be carried out individually.
The SWAEI methodology has been validated by applying it on three Kraft mills as a good
example of a water-based process with large water and steam consumption. The excess steam
and water saving were in the range of 27-66% and 24-58%, respectively. These results are
superior to results of other available process integration techniques. The results of sensitivity
analysis show that the most important cost factor is the price of fossil fuel and then the other
energy price (steam or electricity).

259
GENERAL DISCUSSION
Benchmarking Technique
The steam and water systems can be simply diagnosed by two approaches. First, the current
steam and water consumptions of the process are benchmarked with the average practice.
Second, the comparison of the steam and water allocations for different uses of different plants
indicates the inefficiencies in steam and water uses for different areas of a process. In addition,
the identification of similarities and differences of HEX and water reutilization networks could
be used to propose the steam and water improvement measures by taking advantage of positive
characteristics. These analyses determine the preliminary potential for thermal energy and water
efficiency improvements. However, an in-depth analysis by means of process integration
techniques is required to determine practical projects.
The benchmarking analysis has been carried out for three Canadian Kraft mills. Several potential
steam and water savings have been identified.
Simultaneous Energy and Water Networks Analysis (SEWNA)
SEWNA aims to enhance the efficiency of water utilization and filtrate reutilization systems,
water production and related steam networks so as to save steam and water. The existing
connections for water reutilization can be improved.
A guideline to extract data for water-energy analysis has been provided. The physical and
process constraints, such as hard and soft temperatures, should be considered to determine the
water reutilization measures. New established rules and the Water and Energy Pinch Analysis
(either graphical or tabular form) help to straightforwardly identify water reutilization projects,
correct existing connections, and reduce the effect of non-isothermal mixing at the process line
while respecting countercurrent flow, temperature, contaminant concentration, and energy
aspects.
The analysis of the water production network has an important impact on improving the
effectiveness of SEWNA. The saved water in the process line is reduced at the origin in the
water production network. The energy demand to produce warm and hot water decreases. This
260
results in the elimination of steam consumption for water production and generates water at a
higher temperature for the process line. The utilization of warmer and hotter water in the process
leads to lower steam consumption.
SEWNA has been applied in three Canadian Kraft mills and resulted in significant steam and
water savings with a short payback period.
Equipment Performance Analysis (EPA)
EPA analyzes and diagnoses the performance of equipment and departments from steam and
water consumption perspectives. This technique quickly determines preliminary probable causes
using key performance indicators (KPI). It also proposes probable remedial solutions to improve
the efficiency of equipment and departments and save steam and water. The results of this
technique are starting points for further in-depth and on-site analysis of the poorly performing
equipment and departments.
EPA has been applied to a Canadian Kraft mill and the results indicate that the steam generation
at the boilers can be substantially increased and also steam and water can be saved at some
points.
Retrofit HEX Network Design (R-HEN)
R-HEN for a water-based process considers physical and process constraints to avoid the
position of a non-feasible HEX. It provides a realistic targeting for steam saving based on the
constraints and classification of steam users. The effect of non-isothermal mixing is reduced at
the early stage of analysis and is included in the extracted data for the HEN design. R-HEN
systematically classifies the waste streams to exploit their available heat.
The HEN can be designed with fewer sinks. A systematic algorithm is employed to redesign the
existing network using practical rules. These rules provide direct guidelines to select the
connection between sinks and sources.
The application of this technique to an existing Kraft mill showed a significant steam savings
with a short payback period.

261
Steam and Water Analysis Enhancement and Integration (SWAEI)Methodology
SWAEI methodology combines different techniques to analyze a water-based process and
determine projects to enhance steam and water efficiency. Sequential application of SEWNA,
EPA, and R-HEN results in significantly more steam savings than if the techniques would have
been applied individually. It also leads to complementary projects to maximize steam savings.
Installation of an absorption heat pump (AHP) should be examined carefully due to economic
factors. In general, fossil fuel reduction, cogeneration, and selling steam to a local district are the
most promising ways to use the saved steam.
A strategy offers guidelines to economically prioritize the proposed projects for implementation.
The objectives of the implementation strategy are to eliminate or reduce the fossil fuel
consumption and then sell steam to a local district or generate electricity.
The method has been applied in three Canadian Kraft mills and resulted in significant steam and
water savings.

262
CONCLUSIONS AND RECOMMENDATIONS
The principle objectives of this thesis were divided into two parts. The first main objective was
to develop new process integration (PI) techniques to individually improve the efficiency of
water and steam systems of a water-based process. Based on the results, three conceptual PI
techniques were developed as follows:
1. Simultaneous energy and water networks analysis (SEWNA)
This technique respects process and physical constraints to identify water reutilization projects.
A guideline to extract data for analysis has been provided. Data for analysis include temperature,
contaminant concentration, and flowrate of all sinks and sources. A critical parameter is the
maximum acceptable contaminant concentration to each sink that is systematically determined.
The inevitable effluents are identified and excluded from the pool of sources. New rules have
been established for filtrate reutilization and water utilization. A new Water and Energy Pinch
analysis has been developed that could be performed either in tabular or graphical ways. It helps
to systematically identify water projects with respect to steam savings and a reduction of the
effects of non-isothermal mixing. The saved water is reduced from the water production network
to eliminate steam consumption for warm and hot water production and produce higher
temperature water for the process. Utilization of hotter and warmer water at the process line
leads to steam savings by shifting the heat load from steam to water.
2. Equipment performance analysis (EPA)
EPA systematically analyzes and diagnoses the performance of the equipment and departments
so as to quickly identify the steam and water saving potentials. The key performance indicators
(KPIs) related to energy and water efficiency are used for this reason. The calculated KPIs
indicate preliminary probable causes of inefficiencies. EPA also suggests some probable
remedial projects to correct inefficiencies. It is a starting point for further in-depth and on-site
analysis of the poor performance equipment to improve their efficiency.

263
3. Retrofit HEX network design (R-HEN)
R-HEN improves the heat integration of the existing HEX network. Similar to SEWNA, the
process and physical constraints are respected to avoid non-feasible projects. A new targeting
approach with the least number of data has been developed by classifying steam users to provide
a realistic estimation for final steam savings. Reducing the effects of non-isothermal mixing is
also included in data extraction. New rules to connect the hot and cold streams more
straightforwardly have been established based on the characteristics of the process. A systematic
algorithm has been developed to perform retrofit HEN design using the estimation and correction
approach.
The second objective was to develop a methodology to enhance energy and water efficiency of a
water-based process by combining the process integration techniques. As a result, a steam and
water analysis enhancement and integration (SWAEI) methodology has been developed. It
consists of six successive steps: base case development, pre-benchmarking, identification of
energy and water projects, heat upgrading and conversion, implementation strategy, and post-
benchmarking.
A benchmarking technique has been developed to diagnose water and steam inefficiencies. First
of all, different parts of the process are benchmarked against the current practice from the
standpoint of steam and water consumption. Then, different processes are compared from the
standpoint of steam and water allocation for different usages to indicate inefficiencies. The HEX
and water reutilization networks of different processes are also compared to identify similarities,
differences, and positive and negative characteristics. The advantageous characteristics can be
used to propose steam and water saving measures for another process. New rules of thumb
approaches have been developed to simply calculate the scope of steam and water savings with
the least number of data.
The identification of energy and water projects is the core of SWAEI. Three developed PI
techniques (SEWNA, EPA, and R-HEN) from the first main objective are applied sequentially.
This sequential application leads to significantly more steam savings than if the techniques
would have been applied individually.
264
The proposition of cogeneration and trigeneration has been carefully examined. The absorption
heat pump is not always a promising solution, if the three developed techniques have already
been sequentially applied. Selling electricity to the grid is always a good option while selling
steam to the local district is profitable when the quantity of steam is huge. This sequential
application of SWENA, EPA, R-HEN, and cogeneration leads to complementary projects to
maximize steam savings and net profit. The results are superior to the results of other available
process integration techniques.
The application of SWAEI in three Canadian Kraft mills showed less steam, water, and fossil
fuel consumption. It also has a less negative environmental impact, and leads to green and
sustainable products with a greater net profit. It prepares the mills to be energy optimized
receptors for sustainable biorefinery integration to provide enough steam for the biorefinery side.
The SWAEI methodology is not specific to a certain water-based process. However, each
process has its own specific characteristics that should be taken into account.
Original Contribution
The following contributions are claimed:
Development of a benchmarking technique as a means to identify preliminary water and
steam savings.
o By comparing the steam and water consumption of the cases with reference
values.
o By comparing the allocation of water and steam consumption to different usages.
o By comparing the HEX and water reutilization networks.
Development of simultaneous energy and water networks analysis (SEWNA) technique
to identify water projects with respect to steam reduction.
o Providing new guidelines for data extraction.
o Consideration of process and physical constraints.
o Consideration of non-isothermal mixing (NIM) effects.
o Establishment of new rules for water reutilization.

265
o Development of new Water and Energy Pinch analysis in tabular or graphical
form.
o Providing approach to analyze existing water production networks to produce
hotter and warmer water.
Development of equipment performance analysis (EPA) technique to diagnose
inefficiencies in equipment and departments of the process.
o Identification of key performance indicators related to steam and water
efficiency.
o Identification of probable causes of inefficiencies and probable remedial projects.
o Channeling the efforts towards on-site and in-depth performance analysis.
Development of retrofit HEX network design (R-HEN) technique to improve heat
integration in an existing water-based process.
o Providing a targeting approach with the least number of data.
o Including the reduction of NIM effects in the data extraction step.
o Establishment of new rules for HEX network design.
o Development of a new algorithm to redesign the existing HEX network.
Development of steam and water analysis enhancement and integration (SWAEI)
methodology that combines different process integration techniques to improve water
and thermal energy efficiency.
o Identification of water and steam projects by the sequential application of
SEWNA, EPA, and R-HEN
o Assessment of the possibility for cogeneration, trigeneration, selling electricity to
the grid, and steam to the local district.
Recommendations for Future Research
There are many possible directions for future research.
266
o Benchmarking technique
The total number of case studies could be increased to have a more precise pattern for water and
steam allocation to different usages also the better understanding of similarities and differences
in HEX and water reutilization networks.
o EPA
On-site analysis of the performance of equipment could be conducted to determine the exact
causes of inefficiencies and be able to propose accurate remedial projects.
o SEWNA and R-HEN
The mathematical algorithms of these two techniques can be developed. They also can be
automated.
o SWENA, R-HEN, and SWAEI
For further validation, the techniques (SEWNA and R-HEN) and methodology (SWAEI) can be
applied on other water-based processes considering their constraints and characteristics.
o Application in P&P mills
This method could be applied on the summer condition of the three mills.
o Biorefining
SWAEI methodology can be used for transforming existing Kraft mills to a green integrated
forest biorefinery. In addition, the SWAEI can be applied on the biorefinery side to reduce its
steam demand.

267
REFERENCES
AbitibiBOWATER, C' Recovery boiler overview. abitibibowater.ca.
Afshar, P., Brown, M., Austin, P., Wang, H., Breikin, T., Maciejowski, J., 2012. Sequentialmodelling of thermal energy: New potential for energy optimisation in papermaking. AppliedEnergy 89, 97-105.
Ala-Kaila, K., Poukka, O., 2003. Possibilities of fractional filtrate configurations:: Case:Bleaching of wood pulp fibres. Chemical Engineering Journal 95, 187-197.
Algehed, J., 2002. Energy efficient evaporation in future kraft pulp mills, Department of Heatand Power Technolog. Chalmers University of Technology, Göteborg, Sweden.
Alva-Argaez, A., Savulescu, L., 2009. Water Reuse Project Selection A retrofit path to Waterand energy savings. Chemical Engineering Transactions 18, 403-408.
Alva-Argaez, A., Savulescu, L., Cripps, 2008. Water-based energy assessment. A conceptualapproach to retrofit systems with strong energy-water interactions., PRES’08, 11th Conferenceon Process Integration, Modelling and Optimisation for Energy Saving and Pollution Reduction,Prague.
Alva-Argaez, A., Savulescu, L., Poulin, B., 2007. A process integration-based decision supportsystem for the identification of water and energy efficiency improvements in the pulp and paperindustry. Pulp and Paper Technical Association of Canada p. 23.
AmericanProcess, 2010. Pinch technology: How is Pinch technology different from other energyaudits? American Process, Atlanta, USA.
Axelsson, E., Berntsson, T., 2005. Pinch analysis of a model mill: Economic and environmentalgains from thermal process-integration in a state-of-the-art magazine paper mill. Nordic Pulp andPaper Research Journal 20, 308-315.
Axelsson, E., Olsson, M.R., Berntsson, T., 2006. Heat integration opportunities in averageScandinavian kraft pulp mills: Pinch analyses of model mills. Nordic Pulp and Paper ResearchJournal 21, 466-475.
Axelsson, E., Olsson, M.R., Berntsson, T., 2008. Opportunities for process-integratedevaporation in a hardwood pulp mill and comparison with a softwood model mill study. AppliedThermal Engineering 28, 2100-2107.
Bagajewicz, M., 2000. A review of recent design procedures for water networks in refineries andprocess plants. Computers & Chemical Engineering 24, 2093-2113.
Bagajewicz, M., Rodera, H., Savelski, M., 2002. Energy efficient water utilization systems inprocess plants. Computers & Chemical Engineering 26, 59-79.

268
Bakhtiari, B., Fradette, L., Legros, R., Paris, J., 2010a. Opportunities for the integration ofabsorption heat pumps in the pulp and paper process. Energy 35, 4600-4606.
Bakhtiari, B., Fradette, L., Legros, R., Paris, J., 2010b. Retrofit of absorption heat pumps intomanufacturing processes: Implementation guidelines. The Canadian Journal of ChemicalEngineering 88, 839-848.
Beagle, M., 1962. Recompression evaporation. Chemical Engineering Progress 58, 79-82.
Bengtsson, C., 2004. Novel process integration opportunities in existing kraft pulp mills withlow water consumtion, Department of Heat and Power Technolog. Chalmers University ofTechnology, Götenborg, Sweeden.
Berglin, N., Berntsson, T., 1998. Pulp mill heat integration of black liquor gasifiers, Proceedingof International Chemical Recovery Conference, Tampa, FL., pp. 693-704.
Bhattacharyya, S.C., Thuy Hien, N., 2005. Cogeneration potential in pulp and paper industry ofVietnam. International journal of energy research 29, 345-358.
Bhutani, N., Lindberg, C.F., Starr, K., Horton, R., 2012. Energy assessment of Paper Machines.Energy Procedia 14, 955-963.
Bogataj, M., Bagajewicz, M.J., 2008. Synthesis of non-isothermal heat integrated water networksin chemical processes. Computers & Chemical Engineering 32, 3130-3142.
Bogdanski, B., 2011. Midterm Outlook for Canadian Pulp and Paper Sector: 2011-2020. Naturalresource of Canada.
Boix, M., Pibouleau, L., Montastruc, L., Azzaro-Pantel, C., Domenech, S., 2012. Minimizingwater and energy consumptions in water and heat exchange networks. Applied ThermalEngineering 36, 442-455.
Brännvall, E., 2009. 1. Overview of Pulp and Paper Processes, Pulping Chemistry andTechnology Walter de Gruyter, pp. 1-12.
Brogdon, B., Bell, M., 2004. Optimization of Chlorine Dioxide Bleaching Sequence For KraftPulps Through Improved Oxidative Alkaline Extraction Stage Performance, Tappi FallTechnical Conference, Atlanta, Georgia.
Brown, D., Maréchal, F., Paris, J., 2005. A dual representation for targeting process retrofit,application to a pulp and paper process. Applied Thermal Engineering 25, 1067-1082.
Browne, T., Singbeil, D., Gilsenan, R., Paleologou, M., 2011. Bio-energy and Bio-chemicalsSynthesis Report. FPInnovations, Montreal, Canada.

269
Browne, T.C., 1999. Réduction des coûts énergétiques dans l'indurstrie des pâtes et papiers.PAPRICAN, Montreal, Canada.
Bryant, P.S., Malcolm, E.W., Woitkovich, C.P., 1996. Pulp and paper mill water use in NorthAmerica, TAPPI Environmental Conference Exhibit, Orlando, Florida, USA.
Bryntesson, J., Dahllöf, H., Pettersson, E., Ragnar, M., 2002. New Compact Technology forWashing of Chemical Pulp, African Pulp and Paper Week, Durban, South Africa.
Cakembergh-Mas, A., Paris, J., Trépanier, M., 2010. Strategic simulation of the energymanagement in a Kraft mill. Energy Conversion and Management 51, 988-997.
Carlsson, A., Franck, P.A., Berntsson, T., 1993. Design better heat exchanger network retrofits.Chemical Engineering Progress 89, 87-96.
Castro, J., Doyle, F., 2004. A pulp mill benchmark problem for control: Problem description.Journal of Process Control 14, 17-29.
CETC, 2003. Pinch Analysis: For efficient use of Energy, Water & Hydrogen Natural ResourcesCanada, Montreal, Canada.
Chandra, S., 1997. Effluent minimization: A little water goes a long way. Tappi Journal 80, 37-42.
Chen, H.-W., Hsu, C.-H., Hong, G.-B., 2012. The case study of energy flow analysis andstrategy in pulp and paper industry. Energy Policy 43, 448-455.
Chew, I.M.L., Foo, D.C.Y., Bonhivers, J.-C., Stuart, P., Alva-Argaez, A., Savulescu, L.E., 2013.A model-based approach for simultaneous water and energy reduction in a pulp and paper mill.Applied Thermal Engineering 51, 393-400.
Chiogioji, M., 2008. Industrial Energy Conservation. Marcel Dekker Inc., New York, UnitedState.
CIPEC, 2008. Benchmarking energy use in Canadian P&P mills. NRCan, Montreal, Canada.
Cortés, E., Rivera, W., 2010. Exergetic and exergoeconomic optimization of a cogeneration pulpand paper mill plant including the use of a heat transformer. Energy 35, 1289-1299.
Cortés, M.G., Verelst, H., Pedraja, R.E., González, E., 2011. Simultaneous energy and waterminimization applied to sugar process production. Chem Eng Trans 25, 177-182.
Costa, A., Bakhtiari, B., Schuster, S., Paris, J., 2009. Integration of absorption heat pumps in aKraft pulp process for enhanced energy efficiency. Energy 34, 254-260.
270
Costa, A., Neuhann, V., Vaillancourt, N.J., Paris, J., 2004. Applications of Absorption HeatPumps in the Pulp and Paper Industry for Increased Efficiency and Reduction of Greenhouse GasEmissions, 90th Annual Meeting Preprints B, pp. 191-195.
Crotogino, R., Poirier, N., Trink, D., 1987. The principles of pulp washing. Tappi Journal 70, 95-103.
DellChallenge, 2013. Steam Turbines. The University of Texas at Austin.
Dhole, V.R., 1998. Fluid efficiency, US Patent. Linnhoff March Limited (Northwich, GB2),United States.
Dhole, V.R., Linnhoff, B., 1993. Total site targets for fuel, co-generation, emissions, andcooling. Computers & Chemical Engineering 17, S101-S109.
Dhole, V.R., Ramchandani, N., Tainsh, R.A., Wasilewski, M., 1996. Make your process waterpay for itself. Chemical Engineering 103, 100-103.
Dimian, A., 2003. Integrated design and simulation of chemical processes. Elsevier Science Ltd.
Dong, H.-G., Lin, C.-Y., Chang, C.-T., 2008. Simultaneous optimization approach for integratedwater-allocation and heat-exchange networks. Chemical Engineering Science 63, 3664-3678.
Ek, M., Gellerstedt, G., Henriksson, G., 2009. Pulp and Paper Chemistry and Technology:Pulping Chemistry and Technology. Walter de Gruyter, Berlin, Germany.
El-Halwagi, M., Gabriel, F., Harell, D., 2003. Rigorous graphical targeting for resourceconservation via material recycle/reuse networks. Industrial & engineering chemistry research42, 4319-4328.
El-Halwagi, M.M., 1997. Pollution prevention through process integration Systematic designtools (1st ed.). Academic Press, San Diego, California, USA.
El-Halwagi, M.M., Spriggs, H.D., 1998. Solve design puzzles with mass integration. ChemicalEngineering Progress 94, 25-44.
El Halwagi, M.M., Manousiouthakis, V., 1989. Synthesis of mass exchange networks. AIChEJournal 35, 1233-1244.
EngineeringPage, 2013. Typical overall heat transfer coefficients (U-values). Engineering Page.
EPA, 2010. Available and emerging technologies for reducing greenhouse gas emissions fromthe pulp and paper manufacturing industry, North Carolina.
Feng, X., Li, Y., Shen, R., 2009. A new approach to design energy efficient water allocationnetworks. Applied Thermal Engineering 29, 2302-2307.

271
Feng, X., LI, Y., YU, X., 2008. Improving energy performance of water allocation networksthrough appropriate stream merging. Chinese Journal of Chemical Engineering 16, 480-484.
Fraas, A.P., 1989. Heat exchanger design. John Wiley & Sons.
Francis, B., Towers, M., Browne, T., 2006. Benchmarking energy use in pulp and paperoperations., 92nd PAPTAC Annual Meeting, Montréal,Qc., Canada, pp. A55-A61.
Frederick, J., Porter, J., Tran, H., 2011. Mitigating the risk of smelt-water explosions indissolving tanks, TAPPI Conference, Covington, KY, US, pp. 1241-1249.
Garza Villarreal, H., 2011. Assessment and Enhancement of the Performance of the PulpWashing Operation in Kraft Mills. École Polytechnique de Montréal.
Georgia Tech, I.o.P.S.a.T., 2013. Typical ECF bleaching sequences conditions of softwood kraftpulp. Institute of Paper Scince and Technology.
Hallale, N., 2002. A new graphical targeting method for water minimisation. Advances inEnvironmental Research 6, 377-390.
Han, I.S., Lee, Y.H., Han, C., 2006. Modeling and optimization of the condensing steam turbinenetwork of a chemical plant. Ind. Eng. Chem. Res 45, 670-680.
Hernández-Santoyo, J., Sánchez-Cifuentes, A., 2003. Trigeneration: an alternative for energysavings. Applied Energy 76, 219-227.
Higa, M., Freitas, A., Bannwart, A., Zemp, R., 2009. Thermal integration of multiple effectevaporator in sugar plant. Applied Thermal Engineering 29, 515-522.
Hill, K., Chaloux, J., 2012. Paper Drying Energy Tips. Paper Advance, The source for Canadianpulp, paper and forestry innovation news
Isaksson, J., Åsblad, A., Berntsson, T., 2012. Comparison Between a Detailed Pinch Analysisand the ‘Heat Load Model for Pulp and Paper’–Case Study for a Swedish Thermo-MechanicalPulp and Paper Mill. Chemical Engineering 29, 43-48.
Jacob, J., Kaipe, H., Couderc, F., Paris, J., 2002. Water network analysis in pulp and paperprocesses by pinch and linear programming techniques. Chemical Engineering Communications189, 184-206.
Jansson, J., 2009. Digester modelling for diagnostics and control. School of SustainableDevelopment of Society and Technology, Mälardalen University Akademin för hållbarutveckling, Mälardalens högskola.
272
Johnston, P.A., Stringer, R.L., Santillo, D., Stephenson, A.D., Labounskaia, I.P., McCartney,H.M., 1996. Towards zero-effluent pulp and paper production: the pivotal role of totally chlorinefree bleaching. Amsterdam: Greenpeace International.
Jönsson, J., Ruohonen, P., Michel, G., Berntsson, T., 2010. Increased thermal efficiency inScandinavian integrated TMP and paper mills–analysing the potential for steam savings usingthe heat load model for pulp and paper. Chemical Engineering 21, 535-540.
Jönsson, J., Svensson, I.-L., Berntsson, T., Moshfegh, B., 2008. Excess heat from kraft pulpmills: Trade-offs between internal and external use in the case of Sweden—Part 2: Results forfuture energy market scenarios. Energy Policy 36, 4186-4197.
Kapil, A., Bulatov, I., Smith, R., Kim, J.-K., 2012. Process integration of low grade heat inprocess industry with district heating networks. Energy 44, 11-19.
Kemp, I.C., 2005. Reducing Dryer Energy Use by Process Integration and Pinch Analysis.Drying Technology: An International Journal 23, 2089 - 2104.
Kemp, I.C., 2007. Pinch Analysis and Process Integration: A User Guide on Process Integrationfor the Efficiente Use of Energy (2nd ed.). Elsevier, Oxford, UK.
Keshtkar, M.J., Garza Villarreal, H., Ammara, R., Moshkelani, M., Perrier, M., Paris, J., 2012.Equipment performance analysis to enhance energy and water efficiency of Kraft mills, Pulp andPaper Technical Association of Canada, Montreal.
Keshtkar, M.J., Perrier, M., Paris, J., 2013. Benchmarking as a Means to Identify Potential Waterand Steam Savings – Application to Kraft Mills. ready to be submitted.
Kim, J.-K., Smith, R., 2004. Automated design of discontinuous water systems. Process Safetyand Environmental Protection 82, 238-248.
Kong, L., Liu, H., Li, J., Tao, J., 2011. Waste heat integration of coating paper machine dryingprocess. Drying Technology 29, 442-450.
Koufos, D., Retsina, T., 2001. Practical energy and water management through pinch analysis forthe pulp and paper industry. Water science and technology: a journal of the InternationalAssociation on Water Pollution Research 43, 327-332.
Kumana, J.D., 2002. Pinch Analysis for Process Energy Optimization. Energy Engineering 99,18-41.
Leewongtanawit, B., Kim, J.-K., 2009. Improving energy recovery for water minimisation.Energy 34, 880-893.

273
Leewongtanawit, B., Kim, J.K., 2008. Synthesis and optimisation of heat-integrated multiple-contaminant water systems. Chemical Engineering and Processing: Process Intensification 47,670-694.
Linnhoff, B., Twoneend, D.W., D. Boland, G.F.H., Thomas, B.E.A., Guy, A.R., Marsland, R.H.,1994. A user guide on process integration for the efficient use of energy (2nd ed.). Institution ofChemical Engineers, Rugby, UK.
Linnhoff, B., Witherell, W.D., 1986. Pinch technology guides retrofit. Oil Gas J.;(US) 84.
Luthi, O., 1983. Equivalent displacement ratio–evaluating washer efficiency by comparison.Tappi J 66, 82-84.
Lutz, E., 2008. Identification and analysis of energy saving projects in a Kraft mill. Pulp andPaper Canada 109, 13–17.
Mabee, W., Gregg, D., Saddler, J., 2005. Assessing the emerging biorefinery sector in Canada,Twenty-Sixth Symposium on Biotechnology for Fuels and Chemicals. Springer, pp. 765-778.
Manan, Z.A., Tan, Y.L., Foo, D.C.Y., 2004. Targeting the minimum water flow rate using watercascade analysis technique. AIChE Journal 50, 3169-3183.
Manan, Z.A., Tea, S.Y., Alwi, S.R.W., 2009. A new technique for simultaneous water andenergy minimisation in process plant. Chemical Engineering Research and Design 87, 1509-1519.
Maréchal, F., Kalitventzeff, B., 1996. Targeting the minimum cost of energy requirements: anew graphical technique for evaluating the integration of utility systems. Computers & ChemicalEngineering 20, S225-S230.
Maréchal, F., Kalitventzeff, B., 1997. Identification of the optimal pressure levels in steamnetworks using integrated combined heat and power method. Chemical Engineering Science 52,2977-2989.
Maréchal, F., Kalitventzeff, B., 1998a. Energy integration of industrial sites: tools, methodologyand application. Applied Thermal Engineering 18, 921-933.
Maréchal, F., Kalitventzeff, B., 1998b. Process integration: Selection of the optimal utilitysystem. Computers & Chemical Engineering 22, S149-S156.
Marinova, M., Beaudry, C., Taoussi, A., Trépanier, M., Paris, J., 2008. Economic assessment ofrural district heating by bio-steam supplied by a paper mill in Canada. Bulletin of Science,Technology & Society 28, 159-173.
274
Marinova, M., Mateos-Espejel, E., Bakhtiari, B., Paris, J., 2007. A new methodology for theimplementation of Trigeneration in industry: Application to the Kraft process, First EuropeanConference on Polygeneration: Technologies and Application, Tarragona, Spain, pp. 333 -351.
Marshman, D.J., Chmelyk, T., Sidhu, M.S., Gopaluni, R.B., Dumont, G.A., 2010. Energyoptimization in a pulp and paper mill cogeneration facility. Applied Energy 87, 3514-3525.
Martin, N., Anglani, N., Einstein, D., Khrushch, M., Worrell, E., Price, L., 2000. Opportunitiesto improve energy efficiency and reduce greenhouse gas emissions in the US pulp and paperindustry. Ernest Orlando Lawrence Berkeley National Laboratory, US Department of Energy.
Mateos-Espejel, E., 2009. Development of a strategy for energy efficiency improvement in aKarft process based on system interactions analysis, Department of Chemical Engineering. EcolePolytechnique de Montreal, Montreal, Qc, Canada.
Mateos-Espejel, E., Marinova, M., Bararpour, S., Paris, J., 2010a. Energy Implications of WaterReduction Strategies in Kraft Process. Part I: Methodology. Pulp & Paper Canada May/June 34-37.
Mateos-Espejel, E., Marinova, M., Bararpour, S., Paris, J., 2010b. Energy Implications of WaterReduction Strategies in Kraft Process. Part II: Results. Pulp & Paper Canada May/June 38-41.
Mateos-Espejel, E., Marinova, M., Maréchal, F., Paris, J., 2007. Analyse énergétiqued’évaporateurs para la méthode de la double représentation. VIIIéme CIFQ sur la Thermique desSystèmes, Montréal, Canada, 257–262.
Mateos-Espejel, E., Marinova, M., Schneider, J., Paris, J., 2010c. Simulation of a Kraft Pulp Millfor the Integration of Biorefinery Technologies and Energy Analysis. Pulp & Paper CanadaMay/June 2010, 19-23.
Mateos-Espejel, E., Moshkelani, M., Keshtkar, M.J., Paris, J., 2011a. Sustainability of the greenintegrated forest biorefinery: a question of energy. J-FOR-Journal of Science and Technology forForest Products and Processes 1, 55-61.
Mateos-Espejel, E., Mostajeran-Goortani, B., Paris, J., 2009. Intégration de la cogénerationd'énergie dans une usine de pâte et papier, IX éme Colloque Interuniversitaire Franco-Québecoissur la Thermique des Systèmes, Lille, France, pp. 227-232.
Mateos-Espejel, E., Savulescu, L., Maréchal, F., Paris, J., 2010d. Systems interactions analysisfor the energy efficiency improvement of a Kraft process. Energy 35, 5132-5142.
Mateos-Espejel, E., Savulescu, L., Maréchal, F., Paris, J., 2011b. Base Case ProcessDevelopment for Energy Efficiency Improvement; Application to a Kraft Pulping Mill. Part II:Benchmarking analysis. Chemical Engineering Research and Design 89, 729-741

275
Mateos-Espejel, E., Savulescu, L., Maréchal, F., Paris, J., 2011c. Unified methodology forthermal energy efficiency improvement: Application to Kraft process. Chemical EngineeringScience 66, 135-151.
Mateos-Espejel, E., Savulescu, L., Paris, J., 2011d. Base case process development for energyefficiency improvement, application to a Kraft pulping mill. Part I: Definition andcharacterization. Chemical Engineering Research and Design 89, 742-752.
Metso, 2011. Substantial savings through efficient waste heat utilization at SCA PackagingObbola. www.metso.com.
Meunier, F., 2002. Co-and tri-generation contribution to climate change control. AppliedThermal Engineering 22, 703-718.
Miliander, L., 2009. Pulp washing. Pulp and Paper Chemistry and Technology 2, 484.
Moran, M.J., Shapiro, H.N., 2006. Fundamentals of Engineering Thermodynamics, 5th ed. JohnWiley & Sons, Inc., England.
Mostajeran Goortani, B., Mateos-Espejel, E., Moshkelani, M., Paris, J., 2011. Energy efficiencyimprovement of a Kraft process through practical stack gases heat recovery. Applied ThermalEngineering 31, 4091-4096.
Mostajeran Goortani, B., Mateos-Espejel, E., Paris, J., 2010. Integration of a cogeneration unitinto a kraft pulping process. Applied Thermal Engineering 30, 2724-2729.
Navarri, P., Bédard, S., 2008. Part II: Assessing water and energy consumption and designingstrategies for their reduction (4: Auditing energy and water use in the food industry), in: Klemeš,J., Smith, R., Kim, J.K. (Eds.), Handbook of water and energy management in food processing.Woodhead Publishing Limited, Cambridge, UK.
NCDENR, 2004. Boiler Blowdown. infohouse.p2ric.org.
Noel, G., Boisvert, G., 1998. Project design in energy efficiency using Pinch analysis. Pulp &paper Canada 99, 103-105.
Nordman, R., Berntsson, T., 2006. Design of kraft pulp mill hot and warm water systems--A newmethod that maximizes excess heat. Applied Thermal Engineering 26, 363-373.
Nordman, R., Berntsson, T., 2009a. Use of advanced composite curves for assessing cost-effective HEN retrofit I: theory and concepts. Applied Thermal Engineering 29, 275-281.
Nordman, R., Berntsson, T., 2009b. Use of advanced composite curves for assessing cost-effective HEN retrofit II. Case studies. Applied Thermal Engineering 29, 282-289.

276
Orzechowska, A., 2006. Achieving efficient pulp washing. Pulp & Paper Canada, (February),107.
Paris, J., 2000. A system approach to system closure in integrated newsprint mills. Pulp & PaperCanada 101, 34-42.
Périn-Levasseur, Z., Palese, V., Maréchal, F., 2008. Energy integration study of a multi-effectevaporator, Proceedings of the 11th Conference on Process Integration, Modelling andOptimisation for Energy Saving and Pollution Reduction, Praha, Czech Republic.
Persson, J., Berntsson, T., 2009. Influence of seasonal variations on energy-saving opportunitiesin a pulp mill. Energy 34, 1705-1714.
Peters, M., Timmerhaus, K., West, R., 2002. Plant Design and Economics for ChemicalEngineers (5 edition). McGraw-Hill Science/Engineering/Math, New York, USA.
Pettersson, F., Söderman, J., 2007. Design of robust heat recovery systems in paper machines.Chemical Engineering and Processing: Process Intensification 46, 910-917.
Pharande, V., Asthana, S., Saini, D., Kaul, S., 2011. Energy optimization in integrated pulp andpaper mills with recourse to environmental benefits. Journal of Scientific & Industrial Research70, 1061-1069.
RISI, 2010. Excerpt - World Pulp & Recovered Paper Forecast.
Rouzinou, S., Retsina, T., Cooper, A., 2003. Pinch analysis: A powerful tool for the integrationof new process equipment into existing pulp and paper mills, TAPPI Fall Technical Conference:Engineering, Pulping and PCE and I, Chicago, IL, US, pp. 26-30.
Ruohonen, P., Ahtila, P., 2010. Analysis of a mechanical pulp and paper mill using advancedcomposite curves. Applied Thermal Engineering 30, 649-657.
Ruohonen, P., Hakala, J., Ahtila, P., 2009. Testing of heat load model for pulp and paper in twoTMP cases, 12th International Conference on Process Integration, Modelling and Optimisationfor Energy Saving and Pollution Reduction, Rome, Italy, pp. 433 - 438.
Ruohonen, P., Hakala, J., Ahtila, P., 2010. Analysis of an operating TMP mill using advancedcomposite curves and Heat Load Model for Pulp and Paper, 7th European Congress of ChemicalEngineering ECCE-7, Prague, Czech Republic.
Sanchez, D.R., 2007. Recausticizing-Principles and practice, TAPPI Conference, Jacksonville,FL pp. 21-82.
Sarimveis, H.K., Angelou, A.S., Retsina, T.R., Rutherford, S.R., Bafas, G.V., 2003. Optimalenergy management in pulp and paper mills. Energy Conversion and Management 44, 1707-1718.

277
Savulescu, L., Kim, J.K., 2008. 10: Novel methods for combined energy and water minimisationin the food industry, in: Klemeš, J., Smith, R., Kim, J.K. (Eds.), Handbook of water and energymanagement in food processing. Woodhead Publishing Limited, Cambridge, UK.
Savulescu, L., Kim, J.K., Smith, R., 2005a. Studies on simultaneous energy and waterminimisation--Part I: Systems with no water re-use. Chemical Engineering Science 60, 3279-3290.
Savulescu, L., Kim, J.K., Smith, R., 2005b. Studies on simultaneous energy and waterminimisation--Part II: Systems with maximum re-use of water. Chemical Engineering Science60, 3291-3308.
Savulescu, L., Périn-Levasseur, Z., Benali, M., 2012. Mapping of Thermal Energy IntegrationRetrofit Assessment of Industrial Plants. Chemical Engineering 29, 31-36.
Savulescu, L., Poulin, B., Hammache, A., Bédard, S., Gennaoui, S., 2005c. Water and energysavings at a kraft paperboard mill using process integration. Pulp and Paper Canada 106, 29-31.
Savulescu, L., Sorin, M., Smith, R., 2002. Direct and indirect heat transfer in water networksystems. Applied Thermal Engineering 22, 981-988.
Savulescu, L.E., Alva-Argaez, A., 2008. Direct heat transfer considerations for improving energyefficiency in pulp and paper Kraft mills. Energy 33, 1562-1571.
Seider, W.D., Seader, J.D., Lewin, D.R., Widagdo, S., 2009. Product and Process DesignPrinciples, 3rd ed. John Wiley & Sons, Inc., USA.
Shafiei, S., Davin, A., Stuart, P.R., Paris, J., 2003. From thermal pinch analysis to massexchange networks, Chemical Technology of Wood pulp paper, pp. 121-126.
Shukla, S.K., Kumar, V., Yeom, I., Bansal, M.C., 2012. Recycling of bleach plant effluent of anIndian paper mill using water cascade analysis technique. Clean Technologies andEnvironmental Policy 14, 677-685.
Sivill, L., Ahtila, P., 2009. Energy efficiency improvement of dryer section heat recoverysystems in paper machines–A case study. Applied Thermal Engineering 29, 3663-3668.
Sivill, L., Ahtila, P., Taimisto, M., 2005. Thermodynamic simulation of dryer section heatrecovery in paper machines. Applied Thermal Engineering 25, 1273-1292.
Smith, J., Reddy, M., 2013. Energy Conservation Using Natural Gas High Efficiency Boilers, in:Engineering, D.U.-M. (Ed.), Halifax, NS, p. 11.
Smook, G.A., 2002. Handbook for pulp & paper technologists (3rd Edition ed.). Angus WildPublication Inc., Vancouver, Canada.

278
Söderman, J., Pettersson, F., 2003. Influence of variations in cost factors in structuraloptimisation of heat recovery systems with moist air streams. Applied Thermal Engineering 23,1807-1818.
Sorin, M., Bédard, S., 1999. The global pinch point in water reuse networks. Process Safety andEnvironmental Protection 77, 305-308.
Stromberg, C., 1991. Washing for low bleach chemical consumption. Tappi Journal 74, 113-122.
Tahouni, N., Jabbari, B., Panjeshahi, M.H., 2012. Optimal Design of a Cogeneration System in aKraft Process using Genetic Algorithm. CHEMICAL ENGINEERING 29.
Thorp, B., 2005. Biorefinery offers industry leaders business model for major change. Pulp &Paper 79, 35-39.
ToolBox, T.E., 2013. Heat transfer coefficients in heat exchangers. The Engineering ToolBox.
Tripathi, P., 1996. Pinch technology reduces wastewater. Chemical Engineering 103, 87-90.
Turner, P.A., Browne, T.C., Williamson, P.N., 2001. Water use reduction in the pulp and paperindustry, 2nd edition ed. Canadian Pulp and Paper Association, Montreal, Canada.
US.DOE, 2012. Consider Installing High-Pressure Boilers with Backpressure Turbine-Generators, in: DOE/GO-102012-3394 (Ed.), Steam Tip Sheet #22. U.S. Department of Energy -Energy Efficinecy & Rebewable Energy, Washington, DC.
van Lierop, B., Faubert, M., Jiang, Z., 2008. High-temperature extraction in a bleachingsequence: Comparing single and double pressurized tower configurations. Pulp and paperCanada 109, 28-32.
Wan Alwi, S.R., Ismail, A., Manan, Z.A., Handani, Z.B., 2011. A new graphical approach forsimultaneous mass and energy minimisation. Applied Thermal Engineering 31, 1021-1030.
Wan Alwi, S.R., Manan, Z.A., 2008. Generic graphical technique for simultaneous targeting anddesign of water networks. Industrial & engineering chemistry research 47, 2762-2777.
Wang, Y.P., Smith, R., 1994. Wastewater minimisation. Chemical Engineering Science 49, 981-1006.
Wising, U., Berntsson, T., Stuart, P., 2005. The potential for energy savings when reducing thewater consumption in a Kraft Pulp Mill. Applied Thermal Engineering 25, 1057-1066.
Xiao, F., Smith, R., 2001. Case studies of heat integration of evaporation systems.中国化学工程学报 (英文版 9, 224-227.

279
Zhelev, T., Semkov, K., 2004. Cleaner flue gas and energy recovery through pinch analysis.Journal of Cleaner Production 12, 165-170.

280
APPENDICES
Appendix 1 – Detail of HEX network of Chapter 5 (SEWNA) for mill C
Table 0-1 - Existing Water HEX network – Mill C (for Fig. 5-16)
# Code SourceTin(oC)
Tout(oC)
Q(MW)
A(m2)
Usage in new network
1HEX of cleanflashed Steam -PM
Clean flashed steam – PM 95 932.7 14 Removed
WW12 2 12
2Water economizer#1 of Dryer - PM
Exhaust air of Dryer - PM 75 42.65.6 2621 Same place
WW46 10.5 46
3Water economizer#2 of Dryer - PM
Exhaust air of Dryer - PM 75 42.65.6 2621 Same place
WW46 10.5 46
4Warm water steamheater – Chem.Prep.
MP Steam 192 1850.2 1 Removed
HW55 10.5 55
5Indirect contactcooler – Chem.Prep.
Chemicals – Chem. Prep. 29.7 10.10.6 249 Same place
WW20 2 19.7
6Steam ejectorcondenser – Chem.Prep.
Steam & Chemicals – Chem. Prep. 156.9 2.21.7 36 Same place
WW11 2 10.7
7 Eop ExchangerAlkaline effluent - Eop 67 25.7
5.5 965 Same placeWW35.4 12 35.4
8Surface condenser- Evaporation
Non-clean steam- Evaporation 74.6 61.69.9 79 Enlarged
WW20 2 19.8
9 Wet scrubberStack gas of RB – Wet scrubber 86 29
16.8 12218 Same placeWW50 19.8 50
10Surface condenser- Digesting
Non-clean steam- Digesting 111.4 91.42.2 18 Same place
HW80 2 80
11Non condensablegas surfacecondenser
Non condensable gas - Digesting0.2 Same place
WW47 2 47.2
12Chip bin surfacecondenser
Non condensable gas – Chip bin ofDigesting 0.7 Same placeWW46 2 45.6
13Glycol loop/WaterHEX - PM
Glycol - PM 132.6 1303.8 237 Removed
HW90 48 90

281
Table 0-2 - Final Water HEX network- After Applying SEWNA – Mill C (for Fig. 5-16)
# Code SourceTin(oC)
Tout(oC)
Q(MW)
A(m2)
Usage in currentnetwork
1Water economizer#1 of Dryer - PM
Exhaust air of Dryer - PM 75 47.33.7 2621 Same place
WW50 31.1 49.9
2Water economizer#2 of Dryer - PM
Exhaust air of Dryer - PM 75 47.33.7 2621 Same place
WW50 31.1 49.9
3Indirect contactcooler – Chem.Prep.
Chemicals – Chem. Prep. 29.7 10.10.6 249 Same place
WW20 2 19.7
4Steam ejectorcondenser – Chem.Prep.
Steam & Chemicals – Chem. Prep. 156.9 2.20.3 36 Same place
WW11 2 10.7
5 Eop ExchangerAlkaline effluent - Eop 75 25.3
6.3 965 Same placeWW31 2 31.1
6Surface condenser- Evaporation
Non-clean steam- Evaporation 74.6 63.18.8 79 Enlarged
WW25 2 25
7 Wet scrubberStack gas of RB – Wet scrubber 86 34.4
15.2 12218 Same placeHW57 24.4 57
8Surface condenser- Digesting
Non-clean steam- Digesting 111.4 91.42.2 18 Same placeDemineralized water to condensate
tank2 80
9Non condensablegas surfacecondenser
Non condensable gas - Digesting0.2 Same place
WW47 2 47.2
10Chip bin surfacecondenser
Non condensable gas – Chip bin ofDigesting 0.7 Same placeWW46 2 45.6

282
Appendix 2 – Detail of HEX network of Chapter 7 (R-HEN) for mill C
o HEX network of R-HENTable 0-3 - Existing HEX network – Mill C (for Fig. 7-14 and Fig. 7-15)
# Code SourceTin(oC)
Tout(oC)
Q(MW)
A(m2)
Usage in new network
1Steam -GlycolHEX
MP Steam 192 1855.5 202 Removed
Glycol –PM 130 133.7
2Glycol loop – AirHEX
Glycol –PM 133.7 132.61.7 611 Removed
Air to Dryer50 – PM -10 50
3Air economizer ofDryer
Exhaust air of Dryer – PM 42.6 36.21.8 2042
Same place as 1st Aireco. Of DryerAir to Dryer100 – PM -10 30
4Dryer air steamheater
MP Steam 192 1853.2 290 Same place
Air to Dryer100 – PM 30 100
5 RB air heaterMP steam 192 185
4.9 665 Same placeAir to RB -10 169
6Air economizer ofPB #1
Stack gas-PB # 1 322 128.45.1 1608 Same place
Air to PB #1 &6 55 210
7Air economizer ofPB #2
Stack gas-PB # 2 234 140.91.7 661 Removed
Air to PB #2 55 172
8Air economizer ofPB #3
Stack gas-PB # 3 145 109.20.9 493 Removed
Air to PB #3 55 100
9PB #3 air steamheater
MP steam 192 1851.4 329 Removed
Air to PB #3 100 172
10HEX of cleanflashed Steam -PM
Clean flashed steam – PM 95 932.7 14 Enlarged
WW12 2 12
11Water economizer#1 of Dryer - PM
Exhaust air of Dryer - PM 75 42.65.6 2621 Same place
WW46 10.5 46
12Water economizer#2 of Dryer - PM
Exhaust air of Dryer - PM 75 42.65.6 2621 Same place
WW46 10.5 46
13Warm water steamheater – Chem.Prep.
MP Steam 192 1850.2 1 Removed
HW55 10.5 55
14Indirect contactcooler – Chem.Prep.
Chemicals – Chem. Prep. 29.7 10.10.6 249 Same place
WW20 2 19.7
15Steam ejectorcondenser – Chem.Prep.
Steam & Chemicals – Chem. Prep. 156.9 2.21.7 36 Same place
WW11 2 10.7
16 Eop ExchangerAlkaline effluent - Eop 67 25.7
5.5 965 Same placeWW35.4 12 35.4
17Surface condenser- Evaporation
Non-clean steam- Evaporation 74.6 61.69.9 79 Enlarged
WW20 2 19.8

283
18 Wet scrubberStack gas of RB – Wet scrubber 86 29
16.8 12218 Same placeWW50 19.8 50
19Surface condenser- Digesting
Non-clean steam- Digesting 111.4 91.42.2 18 Same place
HW80 2 80
20Non condensablegas surfacecondenser
Non condensable gas - Digesting0.2 Same place
WW47 2 47.2
21Chip bin surfacecondenser
Non condensable gas – Chip bin ofDigesting 0.7 Same placeWW46 2 45.6
22Glycol loop/WaterHEX - PM
Glycol - PM 132.6 1303.8 237 Removed
HW90 48 90
Table 0-4 - Final HEX network- After Applying R-HEN – Mill C (for Fig. 7-14 and Fig. 7-15)
# Code SourceTin(oC)
Tout(oC)
Q(MW)
A(m2)
Usage in currentnetwork
11st Air eco. ofDryer
Exhaust air of Dryer – PM 75 48.42.5 2042
Same as Aireconomizer of DryerAir to Dryer100 – PM -10 55
22nd Air eco. ofDryer
Exhaust air of Dryer – PM 75 48.40.5 384 NEW
Air to Dryer100 – PM -10 55
3Dryer air steamheater
MP Steam 192 1852.0 290 Same
Air to Dryer100 – PM 55 100
43rd Air eco. ofDryer
Exhaust air of Dryer – PM 75 48.41.8 1441 NEW
Air to Dryer50 – PM -10 55
54th Air eco. ofDryer
Exhaust air of Dryer – PM 75 48.41.8 1442 NEW
Air to RB -10 55
62nd Air eco. of PB#1
Stack gas-PB # 1 165.4 128.41.0 374 NEW
Air to RB 55 90.2
7 RB air heaterMP steam 192 185
2.1 665 SameAir to RB 90.2 169
8 Air eco. of PB #6Stack gas-PB # 1 135 70
1.0 961 NEWAir to PB #1& 6 55 84.6
91st Air eco. of PB#1
Stack gas-PB # 1 322 165.44.2 1608
Same as Aireconomizer of PB#1Air to PB #1& 6 84.6 210
10HEX of cleanflashed Steam –PM
Clean flashed steam – PM 95 932.9 63 Enlarged
HW77 67.8 77
11Surface condenser- Digesting
Non-clean steam- Digesting 111.4 91.42.2 18 Same
HW80 2 80
12Indirect contactcooler – Chem.Prep.
Chemicals – Chem. Prep. 29.7 10.10.6 249 Same
WW20 2 19.7
13Steam ejectorcondenser – Chem.Prep.
Steam & Chemicals – Chem. Prep. 156.9 2.20.3 36 Same
WW10.5 2 10.5

284
14
Non-cleancondensateexchanger-Evaporation
Non-clean condensate- Evaporation 70.4 331.8 356 NEWDemieralized water to condensate
tank2 60
15Blowdownexchanger – RB &PB #1&6
Blowdown-RB & PB #1&6 169.9 122.3 264 NEWDemieralized water to condensate
tank2 95
16Water economizer#1 of Dryer - PM
Exhaust air of Dryer - PM 48.4 364.1 2621 Same
WW34 2 33.8
17Water economizer#2 of Dryer - PM
Exhaust air of Dryer - PM 48.4 364.1 2621 Same
WW34 2 33.8
18 Wet scrubberStack gas of RB – Wet scrubber 86 47.9
11.2 12218 SameHW70 37.3 70
19 Eop ExchangerAlkaline effluent - Eop 67 32
4.7 965 SameHW57 2 57
20White waterexchanger-PM
Overflow – White water tank-PM 60.1 35.616.4 3141 NEW
WW50 2 50
21Surface condenser- Evaporation
Non-clean steam- Evaporation 74.6 61.69.9 141 Enlarged
HW57 2 57
22Non condensablegas surfacecondenser
Non condensable gas - Digesting0.2 Same
WW47 2 47.2
23Chip bin surfacecondenser
Non condensable gas – Chip bin ofDigesting 0.7 SameWW46 2 45.6
24Acidic effluentexchanger of D0
Acidic effluent of D0-bleaching 57.2 28.66.3 1377 NEW
WW47 2 47
Table 0-5 - (a) The new HEXs that should be purchased and (b) theexisting HEXs that should be enlarged –After applying R- HEN - Mill C(for Fig. 7-14 and Fig. 7-15)
# Name of HEXHeat
exchanging(MW)
Area(m2)
Installedcost (M$)
(a) New HEXs1 2nd Air eco. of Dryer 0.5 384 0.422 3rd Air eco. of Dryer 1.8 1441 1.883 4th Air eco. of Dryer 1.8 1442 1.884 2nd Air eco. of PB #1 1.0 374 0.415 Air eco. of PB #6 1.0 961 1.16
6Non-clean condensate exchanger-Evaporation
1.8 356 0.39
7Blowdown exchanger – RB & PB#1&6
2.3 264 0.29
8 White water exchanger-PM 16.4 3141 5.069 Acidic effluent exchanger of D0 6.3 1377 1.78Total for new HEXs 32.8 9740 13.27
(b) The enlarged existing HEXs1 HEX of clean flashed Steam - PM 2.3 49 0.062 Surface condenser - Evaporation 4.4 62 0.07Total for enlarged existing HEXs 6.7 111 0.13TOTAL 39.5 9851 13.40
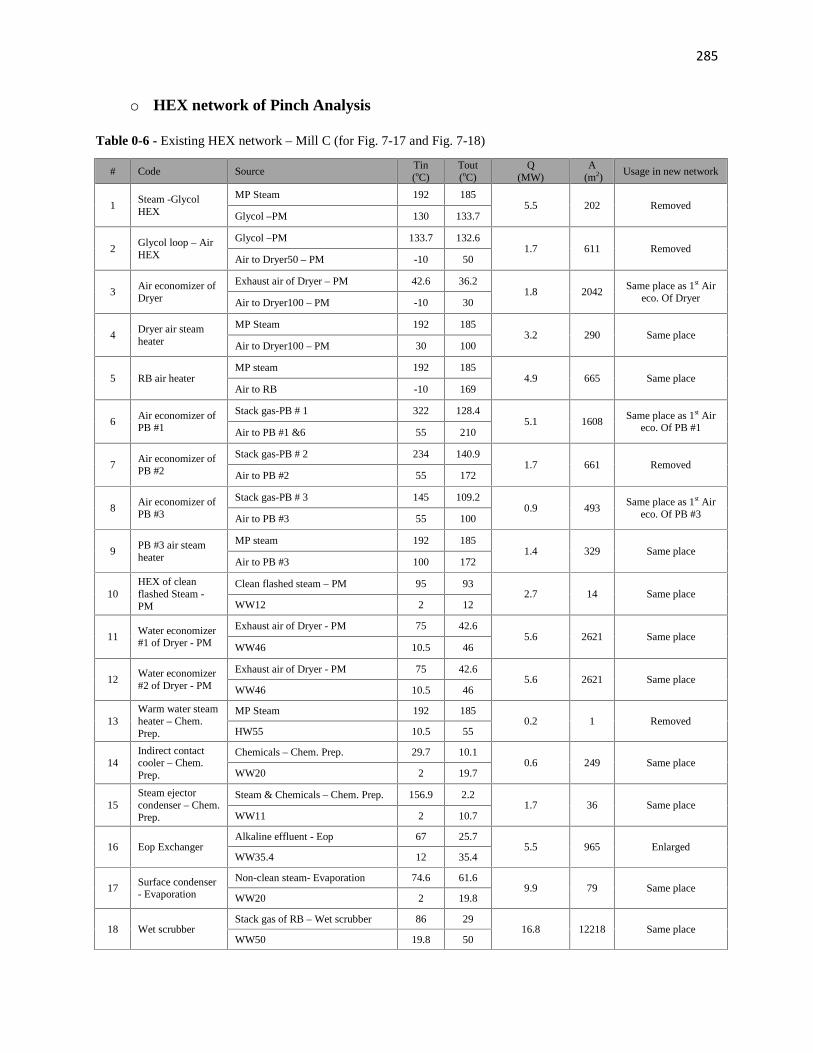
285
o HEX network of Pinch Analysis
Table 0-6 - Existing HEX network – Mill C (for Fig. 7-17 and Fig. 7-18)
# Code SourceTin(oC)
Tout(oC)
Q(MW)
A(m2)
Usage in new network
1Steam -GlycolHEX
MP Steam 192 1855.5 202 Removed
Glycol –PM 130 133.7
2Glycol loop – AirHEX
Glycol –PM 133.7 132.61.7 611 Removed
Air to Dryer50 – PM -10 50
3Air economizer ofDryer
Exhaust air of Dryer – PM 42.6 36.21.8 2042
Same place as 1st Aireco. Of DryerAir to Dryer100 – PM -10 30
4Dryer air steamheater
MP Steam 192 1853.2 290 Same place
Air to Dryer100 – PM 30 100
5 RB air heaterMP steam 192 185
4.9 665 Same placeAir to RB -10 169
6Air economizer ofPB #1
Stack gas-PB # 1 322 128.45.1 1608
Same place as 1st Aireco. Of PB #1Air to PB #1 &6 55 210
7Air economizer ofPB #2
Stack gas-PB # 2 234 140.91.7 661 Removed
Air to PB #2 55 172
8Air economizer ofPB #3
Stack gas-PB # 3 145 109.20.9 493
Same place as 1st Aireco. Of PB #3Air to PB #3 55 100
9PB #3 air steamheater
MP steam 192 1851.4 329 Same place
Air to PB #3 100 172
10HEX of cleanflashed Steam -PM
Clean flashed steam – PM 95 932.7 14 Same place
WW12 2 12
11Water economizer#1 of Dryer - PM
Exhaust air of Dryer - PM 75 42.65.6 2621 Same place
WW46 10.5 46
12Water economizer#2 of Dryer - PM
Exhaust air of Dryer - PM 75 42.65.6 2621 Same place
WW46 10.5 46
13Warm water steamheater – Chem.Prep.
MP Steam 192 1850.2 1 Removed
HW55 10.5 55
14Indirect contactcooler – Chem.Prep.
Chemicals – Chem. Prep. 29.7 10.10.6 249 Same place
WW20 2 19.7
15Steam ejectorcondenser – Chem.Prep.
Steam & Chemicals – Chem. Prep. 156.9 2.21.7 36 Same place
WW11 2 10.7
16 Eop ExchangerAlkaline effluent - Eop 67 25.7
5.5 965 EnlargedWW35.4 12 35.4
17Surface condenser- Evaporation
Non-clean steam- Evaporation 74.6 61.69.9 79 Same place
WW20 2 19.8
18 Wet scrubberStack gas of RB – Wet scrubber 86 29
16.8 12218 Same placeWW50 19.8 50

286
19Surface condenser- Digesting
Non-clean steam- Digesting 111.4 91.42.2 18 Same place
HW80 2 80
20Non condensablegas surfacecondenser
Non condensable gas - Digesting0.2 Same place
WW47 2 47.2
21Chip bin surfacecondenser
Non condensable gas – Chip bin ofDigesting 0.7 Same placeWW46 2 45.6
22Glycol loop/WaterHEX - PM
Glycol - PM 132.6 1303.8 237 Removed
HW90 48 90
Table 0-7 - Final HEX network- After applying Pinch Analysis – Mill C (for Fig. 7-17 and Fig. 7-18)
# Code SourceTin(oC)
Tout(oC)
Q(MW)
A(m2)
Usage in currentnetwork
11st Air eco. ofDryer
Exhaust air of Dryer – PM 75 48.42.5 2042
Same as Aireconomizer of DryerAir to Dryer100 – PM -10 55
22nd Air eco. ofDryer
Exhaust air of Dryer – PM 75 48.40.5 384 NEW
Air to Dryer100 – PM -10 55
3Dryer air steamheater
MP Steam 192 1852.1 290 Same
Air to Dryer100 – PM 55 100
43rd Air eco. ofDryer
Exhaust air of Dryer – PM 75 48.41.8 1441 NEW
Air to Dryer50 – PM -10 55
54th Air eco. ofDryer
Exhaust air of Dryer – PM 75 48.41.8 1442 NEW
Air to RB -10 55
62nd Air eco. of PB#3
Stack gas-PB # 3 109.3 700.6 769 NEW
Air to RB 55 77
72nd Air eco. of PB#1
Stack gas-PB # 1 165.4 128.41.0 537 NEW
Air to RB 77 112.5
8 RB air heaterMP steam 192 185
1.5 665 SameAir to RB 112.5 169
9 Air eco. of PB #6Stack gas-PB # 1 135 70
1.0 961 NEWAir to PB #1& 6 55 84.6
101st Air eco. of PB#1
Stack gas-PB # 1 322 165.44.2 1608
Same as Aireconomizer of PB#1Air to PB #1& 6 84.6 210
111st Air eco. of PB#3
Stack gas-PB # 3 145 109.30.6 493
Same as Aireconomizer of PB#3Air to PB #3 55 100
12PB #3 air steamheater
MP steam 192 1850.9 329 Same
Air to PB #3 100 172
13Surface condenser- Digesting
Non-clean steam- Digesting 111.4 91.42.2 18 Same
HW80 2 80
14Indirect contactcooler – Chem.Prep.
Chemicals – Chem. Prep. 29.7 10.10.6 249 Same
WW20 2 19.7

287
15Steam ejectorcondenser – Chem.Prep.
Steam & Chemicals – Chem. Prep. 156.9 2.21.7 36 Same
WW11 2 11
161st White waterexchanger-PM
Overflow – White water tank-PM 60 51.65.8 1171 NEW
WW46 27.9 46
17Blowdownexchanger – RB &PB #1, 3 &6
Blowdown-RB & PB #1, 3 &6 165.2 492.0 181 NEWDemieralized water to condensate
tank39 54.2
18Water economizer#1 of Dryer - PM
Exhaust air of Dryer - PM 48.4 364.1 2621 Same
WW34 2 33.8
19Water economizer#2 of Dryer - PM
Exhaust air of Dryer - PM 48.4 364.1 2621 Same
WW34 2 33.8
2 Wet scrubberStack gas of RB – Wet scrubber 86 42.8
12.7 12218 SameHW59 35.5 59
21 Eop ExchangerAlkaline effluent - Eop 67 25
5.6 1006 EnlargedWW35.7 11.9 35.7
222nd White waterexchanger-PM
Overflow – White water tank-PM 51.6 39.88.1 1198 NEW
WW35.5 2 35.5
23Surface condenser- Evaporation
Non-clean steam- Evaporation 74.6 61.69.9 93 Enlarged
WW35.5 2 35.5
24Non condensablegas surfacecondenser
Non condensable gas - Digesting0.2 Same
WW47 2 47.2
25Chip bin surfacecondenser
Non condensable gas – Chip bin ofDigesting 0.7 SameWW46 2 45.6
Table 0-8 - (a) The new HEXs that should be purchased and (b) theexisting HEXs that should be enlarged – After applying Pinch Analysis -Mill C (for Fig. 7-17 and Fig. 7-18)
# Name of HEXHeat
exchanging(MW)
Area(m2)
Installedcost (M$)
(a) New HEXs1 2nd Air eco. of Dryer 0.5 384 0.422 3rd Air eco. of Dryer 1.8 1441 1.883 4th Air eco. of Dryer 1.8 1442 1.884 nd Air eco. of PB #3 0.6 769 0.905 2nd Air eco. of PB #1 1.0 538 0.606 Air eco. of PB #6 1.0 961 1.167 1st White water exchanger-PM 5.8 1171 1.46
8Blowdown exchanger – RB & PB #1, 3&6
2.0 181 0.20
9 2nd White water exchanger-PM 8.1 1198 1.50Total for new HEXs 22.6 8085 10.00
(b) The enlarged existing HEXs1 Eop Exchanger 0.2 42 0.062 Surface condenser - Evaporation 1.5 14 0.02Total for enlarged existing HEXs 1.7 56 0.08TOTAL 24.3 8141 10.08

288
Appendix 3 – Detail of Water Analysis of Chapter 8 (SWAEI) for mill C
Data to construct Fig. 8-27 at chapter 8 (SEWNA) is similar as Table 5-10, Table 5-11, and
Table 5-12 from Chapter 5 (SEWNA).
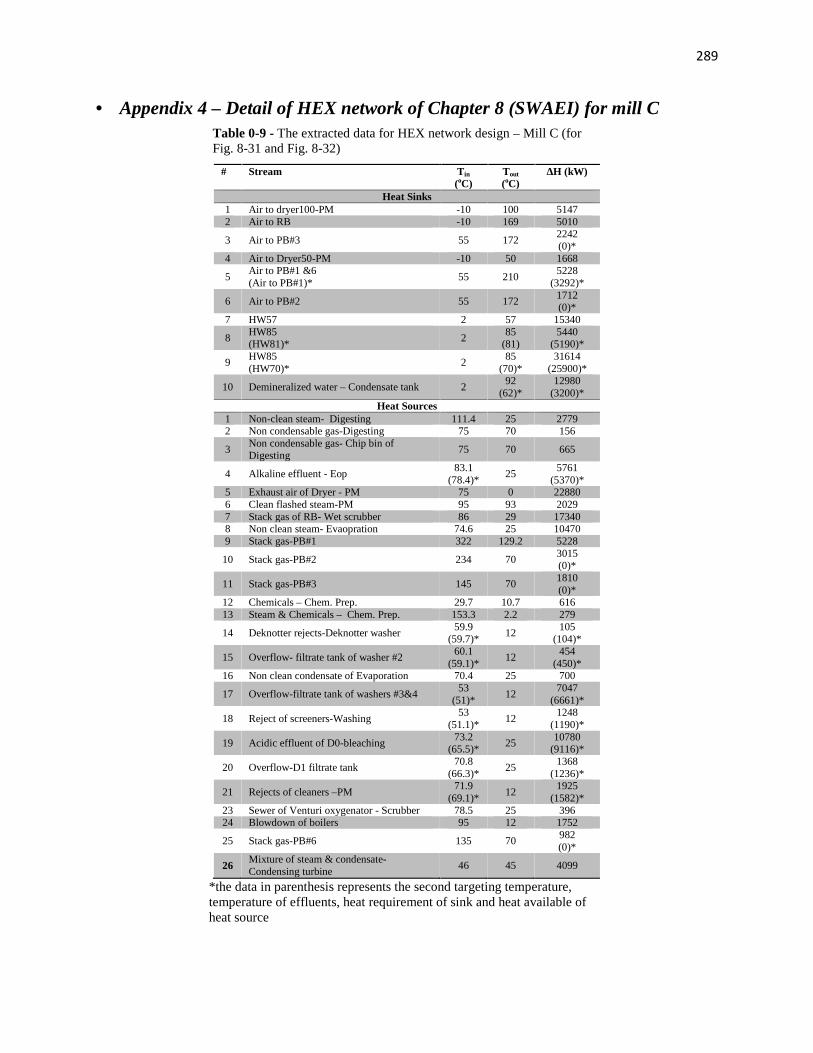
289
Appendix 4 – Detail of HEX network of Chapter 8 (SWAEI) for mill CTable 0-9 - The extracted data for HEX network design – Mill C (forFig. 8-31 and Fig. 8-32)
# Stream Tin
(oC)Tout
(oC)∆H (kW)
Heat Sinks1 Air to dryer100-PM -10 100 51472 Air to RB -10 169 5010
3 Air to PB#3 55 1722242(0)*
4 Air to Dryer50-PM -10 50 1668
5Air to PB#1 &6(Air to PB#1)*
55 2105228
(3292)*
6 Air to PB#2 55 1721712(0)*
7 HW57 2 57 15340
8HW85(HW81)*
285
(81)5440
(5190)*
9HW85(HW70)*
285
(70)*31614
(25900)*
10 Demineralized water – Condensate tank 292
(62)*12980
(3200)*Heat Sources
1 Non-clean steam- Digesting 111.4 25 27792 Non condensable gas-Digesting 75 70 156
3Non condensable gas- Chip bin ofDigesting
75 70 665
4 Alkaline effluent - Eop83.1
(78.4)*25
5761(5370)*
5 Exhaust air of Dryer - PM 75 0 228806 Clean flashed steam-PM 95 93 20297 Stack gas of RB- Wet scrubber 86 29 173408 Non clean steam- Evaopration 74.6 25 104709 Stack gas-PB#1 322 129.2 5228
10 Stack gas-PB#2 234 703015(0)*
11 Stack gas-PB#3 145 701810(0)*
12 Chemicals – Chem. Prep. 29.7 10.7 61613 Steam & Chemicals – Chem. Prep. 153.3 2.2 279
14 Deknotter rejects-Deknotter washer59.9
(59.7)*12
105(104)*
15 Overflow- filtrate tank of washer #260.1
(59.1)*12
454(450)*
16 Non clean condensate of Evaporation 70.4 25 700
17 Overflow-filtrate tank of washers #3&453
(51)*12
7047(6661)*
18 Reject of screeners-Washing53
(51.1)*12
1248(1190)*
19 Acidic effluent of D0-bleaching73.2
(65.5)*25
10780(9116)*
20 Overflow-D1 filtrate tank70.8
(66.3)*25
1368(1236)*
21 Rejects of cleaners –PM71.9
(69.1)*12
1925(1582)*
23 Sewer of Venturi oxygenator - Scrubber 78.5 25 39624 Blowdown of boilers 95 12 1752
25 Stack gas-PB#6 135 70982(0)*
26Mixture of steam & condensate-Condensing turbine
46 45 4099
*the data in parenthesis represents the second targeting temperature,temperature of effluents, heat requirement of sink and heat available ofheat source

290
Table 0-10 - Existing HEX network – Mill C (for Fig. 8-31 and Fig. 8-32)
# Code SourceTin(oC)
Tout(oC)
Q(MW)
A(m2)
Usage in new network
1Steam -GlycolHEX
MP Steam 192 1855.5 202 Removed
Glycol –PM 130 133.7
2Glycol loop – AirHEX
Glycol –PM 133.7 132.61.7 611 Removed
Air to Dryer50 – PM -10 50
3Air economizer ofDryer
Exhaust air of Dryer – PM 42.6 36.21.8 2042
Same place as 1st Aireco. Of DryerAir to Dryer100 – PM -10 30
4Dryer air steamheater
MP Steam 192 1853.2 290
Same place as 1st Aireco. Of DryerAir to Dryer100 – PM 30 100
5 RB air heaterMP steam 192 185
4.9 665 Same placeAir to RB -10 169
6Air economizer ofPB #1
Stack gas-PB # 1 322 128.45.1 1608 Same place
Air to PB #1 &6 55 210
7Air economizer ofPB #2
Stack gas-PB # 2 234 140.91.7 661 Removed
Air to PB #2 55 172
8Air economizer ofPB #3
Stack gas-PB # 3 145 109.20.9 493 Removed
Air to PB #3 55 100
9PB #3 air steamheater
MP steam 192 1851.4 329 Removed
Air to PB #3 100 172
10HEX of cleanflashed Steam -PM
Clean flashed steam – PM 95 932.7 14 Enlarged
WW12 2 12
11Water economizer#1 of Dryer - PM
Exhaust air of Dryer - PM 75 42.65.6 2621 Same place
WW46 10.5 46
12Water economizer#2 of Dryer - PM
Exhaust air of Dryer - PM 75 42.65.6 2621 Same place
WW46 10.5 46
13Warm water steamheater – Chem.Prep.
MP Steam 192 1850.2 1 Removed
HW55 10.5 55
14Indirect contactcooler – Chem.Prep.
Chemicals – Chem. Prep. 29.7 10.10.6 249 Same place
WW20 2 19.7
15Steam ejectorcondenser – Chem.Prep.
Steam & Chemicals – Chem. Prep. 156.9 2.21.7 36 Same place
WW11 2 10.7
16 Eop ExchangerAlkaline effluent - Eop 67 25.7
5.5 965Same place as 1st Eop
ExchangerWW35.4 12 35.4
17Surface condenser- Evaporation
Non-clean steam- Evaporation 74.6 61.69.9 79 Enlarged
WW20 2 19.8
18 Wet scrubberStack gas of RB – Wet scrubber 86 29
16.8 12218 Same placeWW50 19.8 50
19 Surface condenser Non-clean steam- Digesting 111.4 91.4 2.2 18 Same place

291
- Digesting HW80 2 80
20Non condensablegas surfacecondenser
Non condensable gas - Digesting0.2 Same place
WW47 2 47.2
21Chip bin surfacecondenser
Non condensable gas – Chip bin ofDigesting 0.7 Same placeWW46 2 45.6
22Glycol loop/WaterHEX - PM
Glycol - PM 132.6 1303.8 237 Removed
HW90 48 90
23Blowdown HEX –PB #1
Blowdown of PB #1 188.6 140.50.1 19
Relocated asBlowdown HEXsDemieralized water to PB #1 130.5 135.4
24Blowdown HEX –PB #2
Blowdown of PB #2 188.6 140.50.1 18 Removed
Demieralized water to PB #2 130.5 135.4
25Blowdown HEX –PB #3
Blowdown of PB #3 188.6 140.50.2 34
Relocated asBlowdown HEXsDemieralized water to PB #3 130.5 135.4
26Blowdown HEX –PB #6
Blowdown of PB #6 188.6 140.50.2 22
Relocated asBlowdown HEXsDemieralized water to PB #6 130.5 135.4
Table 0-11 - Final HEX network – Mill C (for Fig. 8-31 and Fig. 8-32)
# Code SourceTin(oC)
Tout(oC)
Q(MW)
A(m2)
Usage in currentnetwork
1Air condenser ofcondensing turbine
Mixture of steam & condensate-Condensing turbine
46 454.1 1404 NEW
Air to Dryer100 & 50– PM & to RB -10 30
21st Air eco. ofDryer
Exhaust air of Dryer – PM 75 53.21.6 2042
Same as Aireconomizer of DryerAir to Dryer100 – PM 30 55
3Dryer air steamheater
MP Steam 192 1852.1 290 Same
Air to Dryer100 – PM 55 100
42nd Air eco. ofDryer
Exhaust air of Dryer – PM 75 53.21.0 1357 NEW
Air to Dryer100,50 – PM & to RB 30 55
5 RB air heaterMP steam 192 185
1.3 665 SameAir to RB 122 169
6Air economizer ofPB #1
Stack gas-PB # 1 322 129.24.8 1608 Same
Air to PB #1& RB 55 210
7HEX of cleanflashed Steam -PM
Clean flashed steam – PM 95 932.0 25 Enlarged
HW85 2 85
8Surface condenser- Digesting
Non-clean steam- Digesting 111.4 91.42.0 18 Same
HW85 2 85
9Indirect contactcooler – Chem.Prep.
Chemicals – Chem. Prep. 29.7 10.10.6 249 Same
WW20 2 19.7
10Steam ejectorcondenser – Chem.Prep.
Steam & Chemicals – Chem. Prep. 156.9 2.20.3 36 Same
WW10 2 10
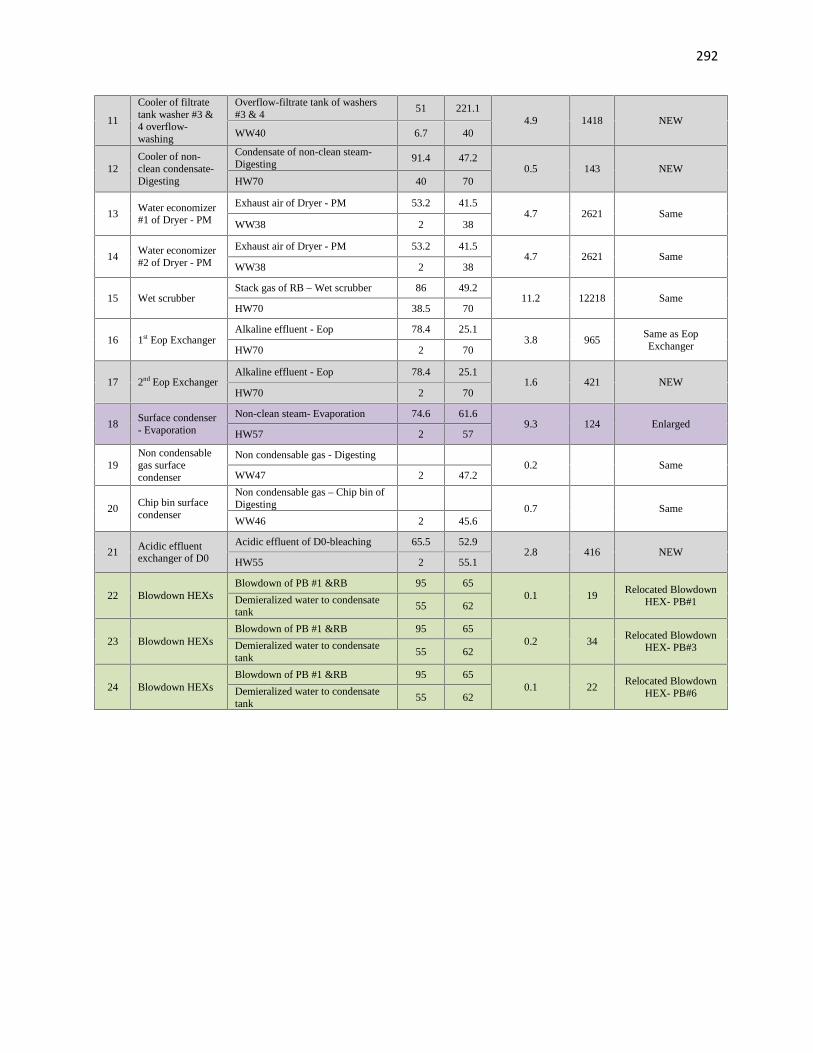
292
11
Cooler of filtratetank washer #3 &4 overflow-washing
Overflow-filtrate tank of washers#3 & 4
51 221.14.9 1418 NEW
WW40 6.7 40
12Cooler of non-clean condensate-Digesting
Condensate of non-clean steam-Digesting
91.4 47.20.5 143 NEW
HW70 40 70
13Water economizer#1 of Dryer - PM
Exhaust air of Dryer - PM 53.2 41.54.7 2621 Same
WW38 2 38
14Water economizer#2 of Dryer - PM
Exhaust air of Dryer - PM 53.2 41.54.7 2621 Same
WW38 2 38
15 Wet scrubberStack gas of RB – Wet scrubber 86 49.2
11.2 12218 SameHW70 38.5 70
16 1st Eop ExchangerAlkaline effluent - Eop 78.4 25.1
3.8 965Same as EopExchangerHW70 2 70
17 2nd Eop ExchangerAlkaline effluent - Eop 78.4 25.1
1.6 421 NEWHW70 2 70
18Surface condenser- Evaporation
Non-clean steam- Evaporation 74.6 61.69.3 124 Enlarged
HW57 2 57
19Non condensablegas surfacecondenser
Non condensable gas - Digesting0.2 Same
WW47 2 47.2
20Chip bin surfacecondenser
Non condensable gas – Chip bin ofDigesting 0.7 SameWW46 2 45.6
21Acidic effluentexchanger of D0
Acidic effluent of D0-bleaching 65.5 52.92.8 416 NEW
HW55 2 55.1
22 Blowdown HEXsBlowdown of PB #1 &RB 95 65
0.1 19Relocated Blowdown
HEX- PB#1Demieralized water to condensatetank
55 62
23 Blowdown HEXsBlowdown of PB #1 &RB 95 65
0.2 34Relocated Blowdown
HEX- PB#3Demieralized water to condensatetank
55 62
24 Blowdown HEXsBlowdown of PB #1 &RB 95 65
0.1 22Relocated Blowdown
HEX- PB#6Demieralized water to condensatetank
55 62

293
Table 0-12 - (a) The new HEXs that should be purchased and (b) theexisting HEXs that should be enlarged – Mill C (for Fig. 8-31 and Fig. 8-32)
# Name of HEXHeat
exchanging(MW)
Area(m2)
Installedcost (M$)
(a) New HEXs1 Air condenser of condensing turbine 4.1 1404 1.822 2nd Air eco. of Dryer 1.0 1357 1.75
3Cooler of filtrate tank washer #3 & 4overflow- washing
4.9 1418 1.84
4Cooler of non-clean condensate-Digesting
0.5 143 0.16
5 2nd Eop Exchanger 1.6 421 0.466 Acidic effluent exchanger of D0 2.8 416 0.46Total for new HEXs 15.0 5159 6.49
(b) The enlarged existing HEXs1 HEX of clean flashed Steam - PM 0.9 11 0.022 Surface condenser - Evaporation 3.4 45 0.05Total for enlarged existing HEXs 4.3 56 0.07TOTAL 19.3 5215 6.56

294
Appendix 5 – Detail of Water Analysis of Chapter 8 (SWAEI) for mill A
Table 0-13 - List of all sinks in ascending order of contaminantconcentration – Mill A (for Fig. 8-4)
SinkFlowrate
(t/h)T
(oC)
Contaminantconcentration
(ppm)Deknotters 226 89 109,226Washers #2-4 2500 82 35,317Washer #1 848 85 27,673D1 1665 75 21,020E2 1313 68 8,567D0 1306 44 7,861Eop 1255 80 6,876
weak wash storage tank-Recausticizing 112 38 5,025D2 1732 72 3,262Screenes-PM 1843 59 317Cleaners-PM 3983 59 308
Pulp machine-PM 813 64 265Screeners-washing 1104 60 197Washer #5 1543 56 184Washer #1 &2- PM 195 63 132Precoat Drive filter-Recausticizing 10 78 110Lime kiln - Recausticizing 100 3 110Lime mud storage - Recausticizing 8 3 110Mix mud tank - Recausticizing 69 80 110Lime mud surge - Recausticizing 11 80 110
Recovery boiler srcubber 4 3 110Black liquor cooler 16 3 12Recaust Scrubber 242 3 12ClO2 Absorption tower – Chem. Prep. 25 3 12Condensate tank 96 30 12
Table 0-14 - List of all sources in ascending order of contaminantconcentration – Mill A (for Fig. 8-4)
SourceFlowrate
(t/h)T(oC)
Contaminantconcentration
(ppm)Washer #1 224 91 116,881Washers #2-4 3026 84 41,076D1 1716 75 23,278E2 1306 69 9,441Eop‡ 1158 80 7,453D0‡ 936 42 6,783D2 1753 75 3,656Washer #1 &2- PM 5136 59 327Pulp machine-PM 1680 61 298Washer #5 2564 60 197Recaust Scrubber 242 3 110
3rd press-PM 39 80 100Black liquor cooler 16 81 12Lime kiln - Recausticizing 100 8 12Evaporation non-clean condensate 236 89 0Clean condensate-soft water production 2 100 0
‡After subtraction from inevitable effluent

295
Table 0-15 - List of all inevitable effluents – Mill A (for Fig. 8-4)
Inevitable effluentFlowrate(m3/h)
T(oC)Contaminantconcentration
(ppm)Deknotter 6 90.5 122,791Screeners-washing 177 60.1 137D0† 383 41.6 6,783Eop* 151 80.2 7,453Sceeners-PM 21 59.1 142Evaporation effluent 72 33.1 12Digesting non-clean condensate 59 74.7 100Total 227
*Alkaline effluent: 18% of filtrate from Eop washer (Keshtkar et al.,2013); currently: 12%; thus, 12% is chosen†Acidic effluent: 29% of filtrate from D0 washer (currently: 44)
(Keshtkar et al., 2013)
Table 0-16 - List of new connections and the capital cost for purchasing, insulation, and installation of new pipes –Mill A (for Fig. 8-5, Fig. 8-6, and Fig. 8-7)
Pr. # Project Name
New stream connection Flowrate(t/h)
Cost(M$)From To
1 Deknotters Filtrate tank – Washers #2-4 Deknotters 23 0.122 Washer #1 Filtrate tank – Washer #5 Washer #1 164 0.233 Washer #1 Filtrate tank – Washer #1&2–PM Washer #1 154 0.224 Washers #2-4 Filtrate tank – Washer #5 Washers #2-4 161 0.225 Washers #2-4 Filtrate tank – Washer #1&2–PM Washers #2-4 12 0.116 Washer #5 Filtrate tank – Washer #1&2–PM Washer #5 185 0.247 D0 Filtrate tank – Washer D1 Before D0 washer 150 0.228 D0 Filtrate tank – Washer D2 Before D0 washer 37 0.139 D0 Hot water 85oC Before D0 washer 144 0.21
10 D0 Filtrate tank – Washer #1&2–PM At D0 washer 15 0.1111 Eop Filtrate tank – Washer #1&2–PM At Eop washer 15 0.1112 D1 Filtrate tank – Washer D2 Before D2 washer 79 0.1613 D1 Filtrate tank – Washer D2 At D2 washer 9 0.1114 D1 Filtrate tank – Washer #1&2–PM At D2 washer 15 0.1115 E1 Hot water 85oC Before E2 washer 50 0.1416 E1 Filtrate tank – Washer D2 At E2 washer 56 0.1417 E1 Filtrate tank – Washer #1&2–PM At E2 washer 15 0.1118 D2 Filtrate tank – Washer #1&2–PM At D2 washer 15 0.1119 Scrubber of Recovery boiler Scrubber – Recausticizing Scrubber of Recovery boiler 4 0.10
20 Lime mud storage –Recaust. Scrubber – Recausticizing Lime mud storage – Recaust. 8 0.10
21 Scrubber – Recausticizing Lime Kiln – Recausticizing Scrubber – Recausticizing 100 0.1822 Lime Kiln cooling – Recaust. Scrubber – Recausticizing Lime Kiln cooling – Recaust. 100 0.18
Total 1511 3.36

296
Appendix 6 – Detail of HEX network of Chapter 8 (SWAEI) for mill A
Table 0-17 – Mixed Cp of 0.163 kg water/ kg dried air humidity of dryer #1 and 0.127 kg water/ kg dried airhumidity of dryer #2 exhaust air of the mill at different temperature intervals – Mill A (for Fig. 8-8 and Fig. 8-9)
T interval(oC)
0-10
10-20
20-30
30-34
34-38
38-42
42-46
46-50
50-54
54-58
58-62
62-66
66-70
70-80
80-90
Mixed Cp-dryer #1
(kJ/kg.oC)0 2.72 4.02 5.36 6.40 7.68 9.29 11.29 13.85 17.77 9.44 1.25 1.25 1.16 0.99
Mixed Cp-dryer #1
(kJ/kg.oC)0 2.65 3.93 5.22 6.24 7.51 9.07 11.03 12.14 8.26 1.17 1.17 1.17 1.04 0.89
Table 0-18 - The extracted data for HEX network design – Mill A (forFig. 8-8 and Fig. 8-9)
# Stream Tin
(oC)Tout
(oC)∆H (kW)
Heat Sinks1 Air to RB -8 158 166402 Air to PB -8 158 122803 Air to Dryer#1-PM -8 82 22744 Air to Dryer#2-PM -8 82 25435 Air to buildings -8 25 132706 Soft water 85 2 85 86417 Demineralized water-condensate tank 2 80 61498 HW73-Washer #5 2 73 199809 HW80-Recausticiizng 2 80 8242
10 HW85 2 85 8405011 Weak BL of washing 91 108 409212 White liquor 81 94 220913 BL 52% 67% of dissolved solid 99 115 2457014 BL 67% dissolved solid to RB 115 121 7443
Heat Sources1 Scrubber water #3 44 23 238502 MP steam condensate of Digesting 168 45 80493 Non-clean steam – Evaporation 61 40 346204 Weak black liquor of digesting 128 90 73785 Exhaust air-Dryer #1-PM 90 2 124006 Exhaust air-Dryer #2-PM 75 2 102507 Stack gas-RB 313 130 283448 Stack gas- PB 262 130 100909 Non-clean condensate-Digesting 75 25 3527
10 Washer #2-4 overflow filtrate 84 13 3201011 Reject of cleaners-washing 81 13 1709012 Washer#5 overflow filtrate 80 13 535013 Acidic effluent-D0 78 13 2852014 Alkaline effluent-Eop 80 13 1077015 Rejects of screeners-PM 78 13 157616 Rejects of cleaners-PM 78 13 145617 Scrubber water #1 35 11 257518 Scrubber water #2 50 35 163619 Non-condensable gas-Digesting 50 13 215820 Non-clean steam-Digesting 95 55 3945021 Flashed steam-PM 117 100 1860
*the data in parenthesis represents the second targeting temperature,temperature of effluents, heat requirement of sink and heat available ofheat source

297
Table 0-19 - Existing HEX network – Mill A (for Fig. 8-8 and Fig. 8-9)
# Code SourceTin(oC)
Tout(oC)
Q(MW)
A(m2)
Usage in newnetwork
1 Air heaterLP steam 160 155
18.3 1332Relocated as 1st con.
of CTAir-To building & Dryers & RB -8 25
2Air economizer ofDryer #1
Exhaust air-Dryer#1-PM 90 66.50.8 569 Same place
Air to Dryer #1-PM 25 55
3Air economizer ofDryer #2
Exhaust air-Dryer#2-PM 75 57.40.8 797 Same place
Air to Dryer #2-PM 25 52
4RB MP steam airheater
MP steam 185 1807.6 891 Same place
Air to RB 25 135
5RB HP steam airheater
HP steam 392 2765.8 398 Same place
Air to RB 135 218
6Air economizerof PB
Stack gas-PB 262 13010.1 2123 Same place
Air to PB -8 128.4
7PB HP steam airheater
HP steam 392 2762.2 127
Relocated andenlarged as 1st HEX
of CFST-PMAir to PB 128.4 158
8 Cascade con.Stack gas- RB 313 156
24.6 814 EnlargedBL 52% 67% dissolved solid 99 115
9 BL heaterLP steam 160 154
7.5 403 Same placeBL 67% Dissolved solid to RB 116 121
10,11
Surface condenser#1 &2
Non-clean Steam - Evaporation 61 4034.6 624 Same place
WW45 2 45
12Blow exchanger-Digesting
Non-clean steam – Digesting 95 5539.5 11892
Same place as 1st
blow exchanger-DigestingHW84 41 84
13 HW steam heaterLP ST-HW85 160 155
0.9 6 RemovedHW85-SH 84 85
14Surface condenser-Digesting
Non-condensable gas-Digesting 50 13.12.2 3068 Same place
WW40 3 40
15 HEX #3 scrubberScrubber water#3 44 23
23.9 8899 Same placeWW34 12.9 34
16
MP steamcondensateexchanger-Digesting
MP ST condensate of Digesting 168 458.0 480 Same place
Soft water 80 2 80
17Soft water steamheater
LP ST-SW60 161 1011.4 5 Removed
SW60-SH 54 60
18 HEX #1 scrubberScrubber water#1 35 11
2.6 958 Same placeDemineralised water - condensatetank
1 24.9
19 HEX #2 scrubberScrubber water#2 50 35
1.6 609 Same placeDemineralised water - condensatetank
24.9 40
20 Water economizer- Exhaust air-Dryer#1-PM 66.5 49.3 5.2 2296 Same place

298
Dryer #1 WW45 3 45
21Black liquor cooler-digesting
Weak BL of Digesting 95.6 901.1 97 Enlarged
HW80 to effluent 3 80
22WBL Digesting-WBL washingexchanger
Weak BL of Digesting 128 106.94.1 859 Same place
Weak BL of Washing 91 108
23WBL digesting-White liquorexchanger
Weak BL of Digesting 106.9 95.62.2 565 Same place
White liquor 79 94
24Cooling coils #2-chemicalpreparation
Chemicals 100 400.1 4 Same place
FW 3 40
25Cooling coils #1-chemicalpreparation
Chemicals 378 400.4 11 Same place
FW 3 40
Table 0-20 - Final HEX network – Mill A (for Fig. 8-8 and Fig. 8-9)
# Code SourceTin(oC)
Tout(oC)
Q(MW)
A(m2)
Usage in currentnetwork
1 1st con. of CT
Mixture of condensate and steamfrom condensing turbine
46 454.3 1332 Relocated air heater
Air-To building -8 25
2 2nd con. of CT
Mixture of condensate and steamfrom condensing turbine
46 459.0 2810 NEW
Air-To building -8 25
3 3rd con. of CT
Mixture of condensate and steamfrom condensing turbine
46 450.5 142 NEW
Air-To dryer #1 -8 25
4Air economizer ofDryer #1
Exhaust air-Dryer#1-PM 90 620.9 569 Same
Air to Dryer #1-PM 10 47
51st HEX of CFST-PM
Flashed steam-PM 117 1000.9 373
Relocated & enlargedPB HP steam air
heaterAir-To dryer #1 47 82
6 4th con. of CT
Mixture of condensate and steamfrom condensing turbine
46 450.6 185 NEW
Air-To dryer #2 -8 25
7Air economizer ofDryer #2
Exhaust air-Dryer#2-PM 75 571.0 797 Same
Air to Dryer #2-PM 13 47
82nd HEX of CFST-PM
Flashed steam-PM 117 1001.0 416 NEW
Air-To dryer #2 47 82
9 5th con. of CT
Mixture of condensate and steamfrom condensing turbine
46 453.3 1032 NEW
Air to RB -8 25
10 Air eco. of RBStack gas- RB 313 287
3.8 421 NEWAir to RB 25 63
11RB MP steam airheater
MP steam 185 1805.4 891 Same
Air to RB 63 135
12RB HP steam airheater
HP steam 392 2764.1 398 Same
Air to RB 135 218

299
13 6th con. of CT
Mixture of condensate and steamfrom condensing turbine
46 452.4 762 NEW
Air to PB -8 25
141st Air economizerof PB
Stack gas-PB 262 1307.61 2123
Same as Aireconomizer
of PBAir to PB -8 161
152nd Aireconomizerof PB
Stack gas-PB 262 1302.5 682 NEW
Air to PB -8 161
16 Cascade con.Stack gas- RB 287 130
24.6 1120 EnlargedBL 52% 67% dissolved solid 99 115
17 BL heaterLP steam 160 154
7.5 403 SameBL 67% Dissolved solid to RB 116 121
18,19
Surface condenser#1 &2
Non-clean Steam - Evaporation 61 4034.6 624 Same
WW45 2 45
201st Blowexchanger-Digesting
Non-clean steam – Digesting 95 6426.4 11892
Same as Blowexchanger-DigestingHW85 57 85
212nd Blowexchanger -Digesting
Non-clean steam – Digesting 95 643.9 1766 NEW
HW85 57 85
22Surface condenser-Digesting
Non-condensable gas-Digesting 50 13.12.2 3068 Same
WW40 3 40
23 HEX #3 scrubberScrubber water#3 44 23
14.0 8899 SameWW34 1 34
24Acidic effluentexchanger of D0
Acidic effluent-D0 78 569.7 2310 NEW
WW57 44 57
25Alkaline effluentexchanger of Eop
Alkaline effluent-Eop 80 563.9 873 NEW
WW57 44 57
26Cooler of overflowof FT-W#5
Washer #5 overflow filtrate 80 563.9 708 NEW
WW57 38 57
27Cooler of overflowof FT-W#2-4
Washer #2-4 overflow filtrate 84 6010.9 2346 NEW
HW73-Washer #5 34 73
28
MP steamcondensateexchanger-Digesting
MP ST condensate of Digesting 168 368.6 586 Enlarged
Soft water 80 2 85
29 HEX #1 scrubberScrubber water#1 35 11
2.6 958 SameDemineralised water - condensatetank
1 24.9
30 HEX #2 scrubberScrubber water#2 50 35
1.6 609 SameDemineralised water - condensatetank
24.9 40
31Water economizer-Dryer #1
Exhaust air-Dryer#1-PM 62 504.8 2296 Same
WW45 3 45
32Cooler of Eff. Cle.-Washing
Rejects of cleaners – washing 81 673.4 717 NEWDemineralised water - condensate
tank40 70
33 Black liquor cooler Weak BL of Digesting 95.6 90 1.1 230 Enlarged

300
-digesting Demineralised water - condensatetank
70 80
34WBL Digesting-WBL washingexchanger
Weak BL of Digesting 128 106.94.1 859 Same place
Weak BL of Washing 91 108
35WBL digesting-White liquorexchanger
Weak BL of Digesting 106.9 95.62.2 565 Same place
White liquor 79 94
36Cooling coils #2-chemicalpreparation
Chemicals 100 400.1 4 Same place
FW 3 40
37Cooling coils #1-chemicalpreparation
Chemicals 378 400.4 11 Same place
FW 3 40
Table 0-21 - (a) The new HEXs that should be purchased and (b) theexisting HEXs that should be enlarged – Mill A (for Fig. 8-8 and Fig. 8-9)
# Name of HEXHeat
exchanging(MW)
Area(m2)
Installedcost (M$)
(a) New HEXs1 2nd con. of CT 9.0 2810 4.372 3rd con. of CT 0.5 142 0.163 4th con. of CT 0.6 185 0.204 2nd HEX of CFST-PM 1.0 416 0.465 5th con. of CT 3.3 1032 1.266 Air eco. Of RB 3.8 421 0.467 6th con. of CT 2.4 762 0.898 2nd air eco. Of PB 2.5 682 0.789 2nd Blow exchanger - Digesting 3.9 1766 2.4210 Acidic effluent exchanger of D0 9.7 2310 3.3911 Alkaline effluent exchanger of Eop 3.9 873 1.0412 Cooler of overflow of FT-W#5 3.9 708 0.8213 Cooler of overflow of FT-W#2-4 10.9 2346 3.4614 Cooler of Eff. Cle. -Washing 3.4 717 0.83Total for new HEXs 58.8 13692 20.83
(b) The enlarged existing HEXs1 1st HEX of CFST-PM 0.6 246 0.272 Cascade con. 6.7 306 0.453 MP steam condensate
exchanger- Digesting1.6 106 0.12
4 Black liquor cooler -digesting 0.6 127 0.27Total for enlarged existing HEXs 9.5 791 0.99TOTAL 68.3 14483 21.82
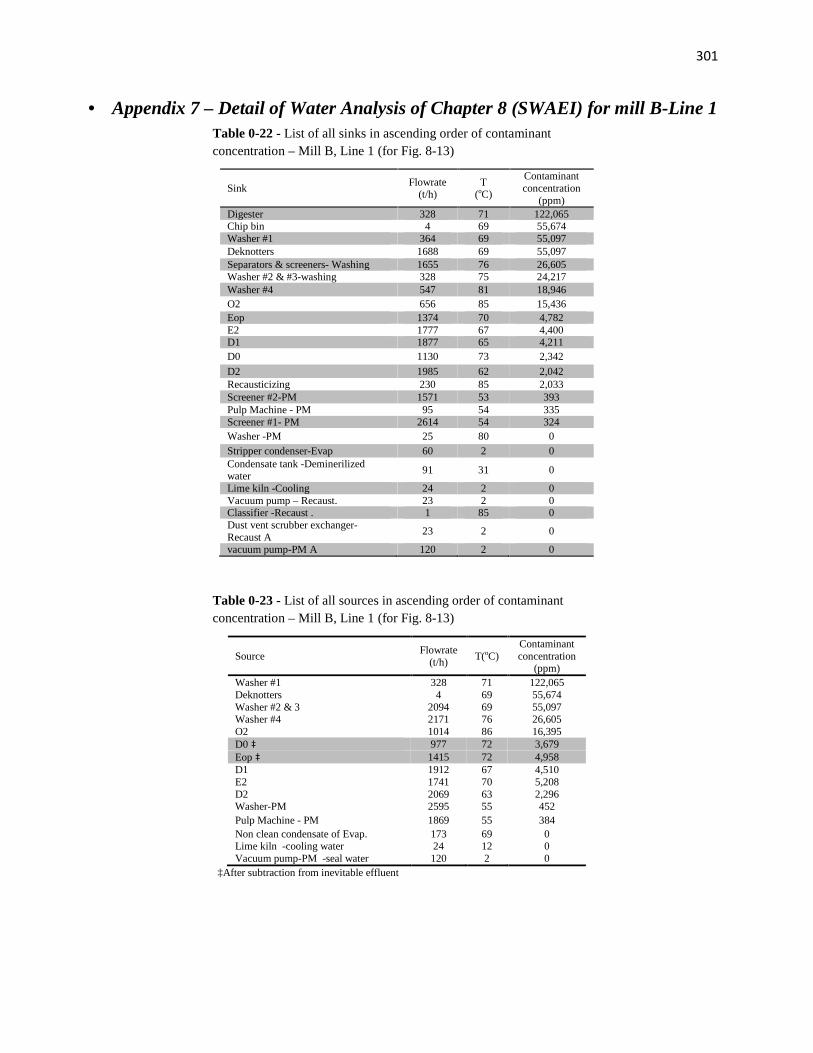
301
Appendix 7 – Detail of Water Analysis of Chapter 8 (SWAEI) for mill B-Line 1Table 0-22 - List of all sinks in ascending order of contaminantconcentration – Mill B, Line 1 (for Fig. 8-13)
SinkFlowrate
(t/h)T
(oC)
Contaminantconcentration
(ppm)Digester 328 71 122,065Chip bin 4 69 55,674Washer #1 364 69 55,097Deknotters 1688 69 55,097Separators & screeners- Washing 1655 76 26,605Washer #2 & #3-washing 328 75 24,217Washer #4 547 81 18,946O2 656 85 15,436Eop 1374 70 4,782E2 1777 67 4,400D1 1877 65 4,211D0 1130 73 2,342
D2 1985 62 2,042Recausticizing 230 85 2,033Screener #2-PM 1571 53 393Pulp Machine - PM 95 54 335Screener #1- PM 2614 54 324Washer -PM 25 80 0Stripper condenser-Evap 60 2 0Condensate tank -Deminerilizedwater
91 31 0
Lime kiln -Cooling 24 2 0Vacuum pump – Recaust. 23 2 0Classifier -Recaust . 1 85 0Dust vent scrubber exchanger-Recaust A
23 2 0
vacuum pump-PM A 120 2 0
Table 0-23 - List of all sources in ascending order of contaminantconcentration – Mill B, Line 1 (for Fig. 8-13)
SourceFlowrate
(t/h)T(oC)
Contaminantconcentration
(ppm)Washer #1 328 71 122,065Deknotters 4 69 55,674Washer #2 & 3 2094 69 55,097Washer #4 2171 76 26,605O2 1014 86 16,395D0 ‡ 977 72 3,679Eop ‡ 1415 72 4,958D1 1912 67 4,510E2 1741 70 5,208D2 2069 63 2,296Washer-PM 2595 55 452Pulp Machine - PM 1869 55 384Non clean condensate of Evap. 173 69 0Lime kiln -cooling water 24 12 0Vacuum pump-PM -seal water 120 2 0
‡After subtraction from inevitable effluent

302
Table 0-24 - List of all inevitable effluents – Mill B, Line 1 (for Fig.8-13)
Inevitable effluentFlowrate
(t/h)T(oC)
Contaminantconcentration
(ppm)Deknotters 5 69 56,815Separators & Screeners-Washing 2 76 26,646D0† 283 72 3,679Eop* 255 72 4,958Screener #1 – PM 21 55 452Cleaners – PM 1 55 12,298Screener #2 – PM 8 53 394Evaporation effluent 50 50Stripper condensate-Evaporation 60 2Blowdown of RB 9 188Rejects of classifier grit 23 53Dust vent scrubber exchanger-Recausticizing
4 98
Total 719*Alkaline effluent: 18% of filtrate from Eop washer (currently: 29%) (Keshtkar etal., 2013)†Acidic effluent: 29% of filtrate from D0 washer (currently: 67%) (Keshtkar et al.,2013)
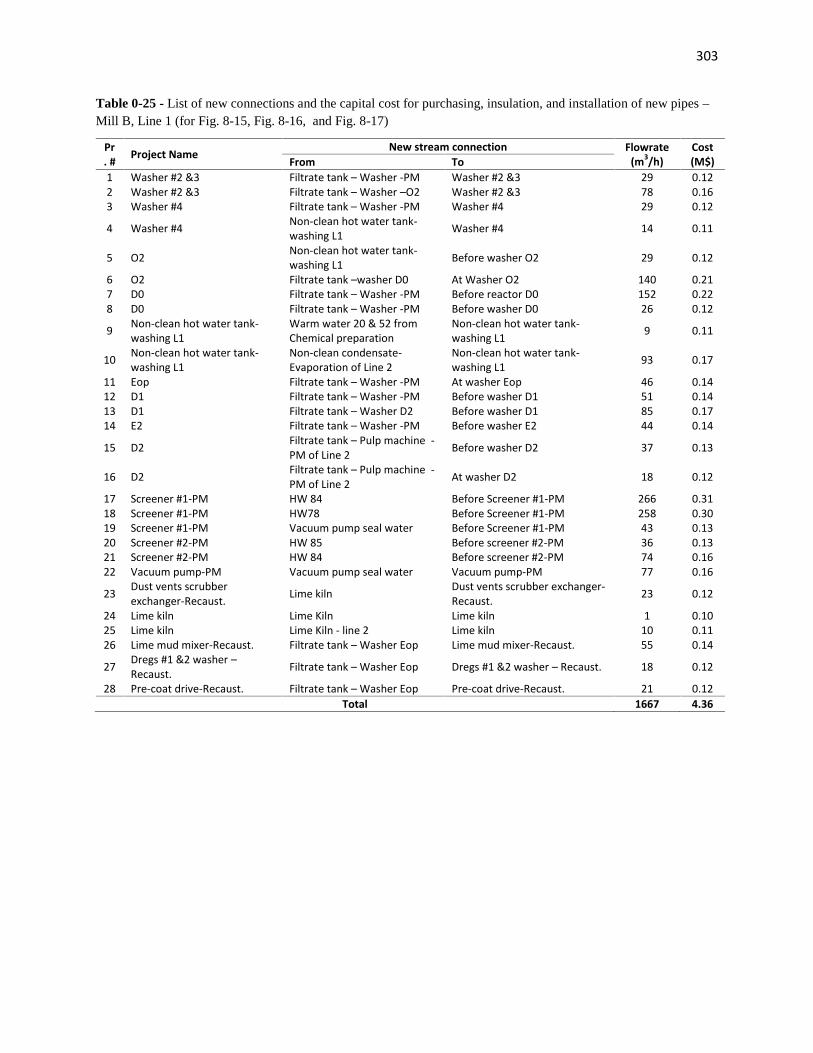
303
Table 0-25 - List of new connections and the capital cost for purchasing, insulation, and installation of new pipes –Mill B, Line 1 (for Fig. 8-15, Fig. 8-16, and Fig. 8-17)
Pr. # Project Name New stream connection Flowrate
(m3/h)Cost(M$)From To
1 Washer #2 &3 Filtrate tank – Washer -PM Washer #2 &3 29 0.122 Washer #2 &3 Filtrate tank – Washer –O2 Washer #2 &3 78 0.163 Washer #4 Filtrate tank – Washer -PM Washer #4 29 0.12
4 Washer #4 Non-clean hot water tank-washing L1 Washer #4 14 0.11
5 O2 Non-clean hot water tank-washing L1 Before washer O2 29 0.12
6 O2 Filtrate tank –washer D0 At Washer O2 140 0.217 D0 Filtrate tank – Washer -PM Before reactor D0 152 0.228 D0 Filtrate tank – Washer -PM Before washer D0 26 0.12
9 Non-clean hot water tank-washing L1
Warm water 20 & 52 fromChemical preparation
Non-clean hot water tank-washing L1 9 0.11
10 Non-clean hot water tank-washing L1
Non-clean condensate-Evaporation of Line 2
Non-clean hot water tank-washing L1 93 0.17
11 Eop Filtrate tank – Washer -PM At washer Eop 46 0.1412 D1 Filtrate tank – Washer -PM Before washer D1 51 0.1413 D1 Filtrate tank – Washer D2 Before washer D1 85 0.1714 E2 Filtrate tank – Washer -PM Before washer E2 44 0.14
15 D2 Filtrate tank – Pulp machine -PM of Line 2 Before washer D2 37 0.13
16 D2 Filtrate tank – Pulp machine -PM of Line 2 At washer D2 18 0.12
17 Screener #1-PM HW 84 Before Screener #1-PM 266 0.3118 Screener #1-PM HW78 Before Screener #1-PM 258 0.3019 Screener #1-PM Vacuum pump seal water Before Screener #1-PM 43 0.1320 Screener #2-PM HW 85 Before screener #2-PM 36 0.1321 Screener #2-PM HW 84 Before screener #2-PM 74 0.1622 Vacuum pump-PM Vacuum pump seal water Vacuum pump-PM 77 0.16
23 Dust vents scrubberexchanger-Recaust. Lime kiln Dust vents scrubber exchanger-
Recaust. 23 0.12
24 Lime kiln Lime Kiln Lime kiln 1 0.1025 Lime kiln Lime Kiln - line 2 Lime kiln 10 0.1126 Lime mud mixer-Recaust. Filtrate tank – Washer Eop Lime mud mixer-Recaust. 55 0.14
27 Dregs #1 &2 washer –Recaust. Filtrate tank – Washer Eop Dregs #1 &2 washer – Recaust. 18 0.12
28 Pre-coat drive-Recaust. Filtrate tank – Washer Eop Pre-coat drive-Recaust. 21 0.12Total 1667 4.36

304
Appendix 8– Detail of Water Analysis of Chapter 8 (SWAEI) for mill B-Line 2Table 0-26 - List of all sinks in ascending order of contaminantconcentration – Mill B, Line 2 (for Fig. 8-14)
SinkFlowrate
(t/h)T
(oC)
Contaminantconcentration
(ppm)Chipbin 1 80 531,597Digester 369 70 86,740Washer #1 &2 414 80 21,956Deknotter 1768 80 21,956Separators & Screeners-washing 512 79 19,223Washer #3 448 74 6,232D1 2520 71 4,874
Washer #4 938 73 4,658Eop 2594 74 4,619E2 2583 71 4,487D0 2781 65 4,376
Dregs washer Tank -Recaust 43 85 2,033Lime Dust Slurry tank-Recaust 0 85 2,033Lime Mud Precoat drive -Recaust 46 85 2,033D2 2774 70 1,915Cleaners-PM 2844 76 738Screeners-PM 1830 77 712Pulp machine-PM 598 75 671Washer -PM 35 65 0Condensate tank B-Deminerilizedwater 188 31 0
Lime kiln -Cooling 21 2 0Vacuum pump-Recaust. 16 2 0Classifier –Recaust. 3 85 0Dust vent scrubber exchanger-Recaust 2 2 0Chemical prep. 136 9 0Vacuum pump-PM 150 2 0
Table 0-27 - List of all sources in ascending order of contaminantconcentration – Mill B, Line 2 (for Fig. 8-14)
SourceFlowrate
(t/h)T(oC)
Contaminantconcentration
(ppm)Deknotter1 1 80 531,597Washer #1&2 414 104 86,740Washer #3 2644 80 22,127Washer #4 1238 74 6,232D1 2564 71 5,099E2 2551 72 4,921D0 ‡ 2348 65 4,834Eop ‡ 2190 75 4,636D2 2765 69 2,170Washer –PM 217 76 745Pulp machine-PM 3569 76 724
Screener-PM 1776 76 712Deknotter2 21 80 0Non clean condensate of Evap. 210 65 0Lime kiln -cooling 21 12 0Vacuum pump -Seal water 16 2 0White liquor cooler - Chem. Prep. 1 20 0Generator Vacuum-Chem Prep. 8 52 0vacuum Pump-PM Seal water 150 2 0
‡After subtraction from inevitable effluent

305
Table 0-28 - List of all inevitable effluents – Mill B, Line 2 (for Fig.8-14)
Inevitable effluentFlowrate
(t/h)T(oC)
Contaminantconcentration
(ppm)Non clean condensate of Surfacecondenser of digesting
10 89 0
Separators &Screeners-washing 23 80 22008Screeners-PM 3 76 757D0† 295 65 4834Eop* 422 75 4636Cleaners-PM 3 76 738Surface condenser non clean condensate-Evap.
64 57
Blowdown-RB 11 254Blowdown-PB 3 255Dregs washer Tank-Recaust. 44 85Dust vent Scrubber B Exchanger -Recaust.
3 91
Barometric condenser - Chemical prep. 5 60Reactor(white liquor scrubber) -Chemicalprep.
2 11
Total 887
*Alkaline effluent: 16% of filtrate from Eop washer (currently: 16%)(Keshtkar et al., 2013)†Acidic effluent: 11% of filtrate from D0 washer (currently: 11%)
(Keshtkar et al., 2013)
Table 0-29 - List of new connections and the capital cost for purchasing, insulation, and installation of new pipes –Mill B, Line 2 (for Fig. 8-18, Fig. 8-19, and Fig. 8-20)
Pr. # Project Name
New stream connection Flowrate(m3/h)
Cost(M$)From To
1 Eop HW 78 Before Eop washer 68 0.152 D1 HW78 Before D1 washer 8 0.103 Pulp machine-PM Vacuum seal water-PM Pulp machine-PM 54 0.144 Vacuum pump-PM Vacuum seal water-PM Vacuum seal water-PM 96 0.96
5 Dust vent scrubberexchanger-Recaust. Lime Kiln Dust vent scrubber
exchanger-Recaust 2 0.10
6 Lime kiln Lime kiln Lime kiln 9 0.117 Lime kiln Vacuum pump-Recaust. Lime kiln 3 0.108 Vacuum pump-Recaust. Vacuum pump-Recaust. Vacuum pump-Recaust. 13 0.119 Dregs washers’ tank-Recaust. Filtrate tank –Eop washer-Line 1 Dregs washers’ tank-Recaust. 18 0.12
10 Pre-coat drive-Recaust. Filtrate tank –Eop washer-Line 1 Pre-coat drive-Recaust. 18 0.12Total 289 0.98

306
Appendix 9 – Detail of HEX network of Chapter 8 (SWAEI) for mill B
Table 0-30 – Mixed Cp of 0.333 kg water/ kg dried air humidity of dryer exhaust air of the Line 1 of mill B atdifferent temperature intervals (for Fig. 8-21, Fig. 8-22, and Fig. 8-23)
T interval(oC)
0-10
10-20
20-30
30-34
34-38
38-42
42-46
46-50
50-54
54-58
58-62
62-66
66-70
70-80
80-132
Mixed Cp(kJ/kg.oC)
0 2.72 4.03 5.37 6.41 7.70 9.31 11.32 13.89 17.2 17.4 17.6 17.8 18 1.1
Table 0-31 – Mixed Cp of 0.358 kg water/ kg dried air humidity of dryer exhaust air of the Line 2 of mill B atdifferent temperature intervals (for Fig. 8-21, Fig. 8-22, and Fig. 8-23)
T interval(oC)
0-10
10-20
20-30
30-34
34-38
38-42
42-46
46-50
50-54
54-58
58-62
62-66
66-70
70-80
80-131
Mixed Cp(kJ/kg.oC)
0 2.72 4.03 5.37 6.41 7.7 9.31 13.2 13.89 17.5 18 18.5 19 19.5 1.1
Table 0-32 - The extracted data for HEX network design – Whole Mill B(for Fig. 8-21, Fig. 8-22, and Fig. 8-23)
# Stream Tin
(oC)Tout
(oC)∆H (kW)
Heat Sinks1 Air to dryer-PM L1 -8 90 32512 Air to dryer-PM L2 -8 90 3251
3 Air to RB L1 45200(80)
11310(2553)
4 Air to RB L2 35200(80)
13030(3553)
5 Air to PB L2 35200(80)
5229(1426)
6 Air to space -8 25 136207 Glycol – PM L1 61 70 1085
8 Glycol – PM L2 6675
(71)1085(597)
9 BL 52% 67% of dissolved solid – L1 92 123 1496010 Non-clean hot water-Recaust. L1 74 85 1642
11 Non-clean hot water- Washing L1 6885
(68)5319(0)
12 Demineralized water-condensate tank L1 3192
(70)6931
(4431)
13 Demineralized water-condensate tank L2 3195
(73)15650
(10270)
14 Vacuum seal water- PM L1 285
(60)4149
(2899)
15 White water – PM L283.8
(81.8)85
(82.4)5201
(3849)
16HW85 – Evap. L1(HW84)
285
(84)47360
(46790)
17HW85 – Evap. L2(HW78)
285
(78)77070
(70570)18 HW85 2 85 24360
19HW85(HW72)
285
(72)13550
(11448)Heat Sources
1 Glycol – PM L1 70 61 10852 Glycol – PM L2 75 66 10853 Exhaust air of dryer – PM L1 132 2 353804 Exhaust air of dryer – PM L1 131 2 372105 Stack gas – RB L1 164 134 149606 Stack gas – RB L2 217 130 117507 Stack gas – PB L2 150 130 9668 Non-clean steam #1– Evaporation L1 61 25 335509 Non-clean steam #2– Evaporation L1 79 25 5453
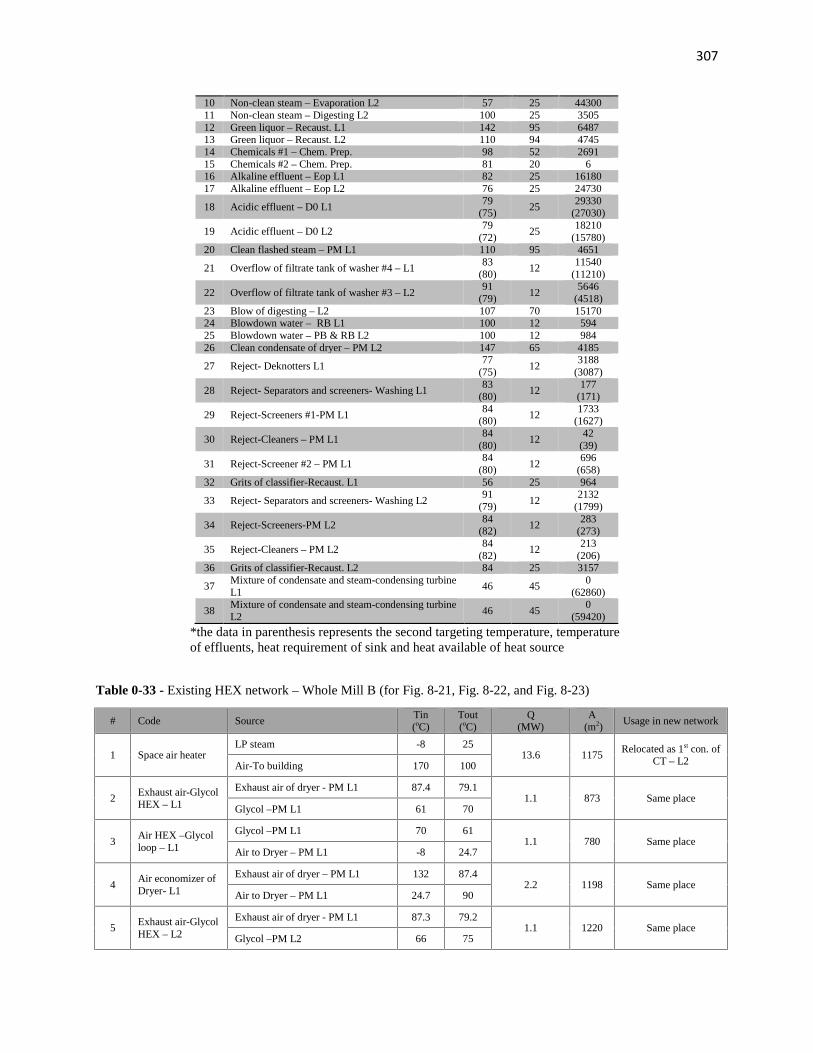
307
10 Non-clean steam – Evaporation L2 57 25 4430011 Non-clean steam – Digesting L2 100 25 350512 Green liquor – Recaust. L1 142 95 648713 Green liquor – Recaust. L2 110 94 474514 Chemicals #1 – Chem. Prep. 98 52 269115 Chemicals #2 – Chem. Prep. 81 20 616 Alkaline effluent – Eop L1 82 25 1618017 Alkaline effluent – Eop L2 76 25 24730
18 Acidic effluent – D0 L179
(75)25
29330(27030)
19 Acidic effluent – D0 L279
(72)25
18210(15780)
20 Clean flashed steam – PM L1 110 95 4651
21 Overflow of filtrate tank of washer #4 – L183
(80)12
11540(11210)
22 Overflow of filtrate tank of washer #3 – L291
(79)12
5646(4518)
23 Blow of digesting – L2 107 70 1517024 Blowdown water – RB L1 100 12 59425 Blowdown water – PB & RB L2 100 12 98426 Clean condensate of dryer – PM L2 147 65 4185
27 Reject- Deknotters L177
(75)12
3188(3087)
28 Reject- Separators and screeners- Washing L183
(80)12
177(171)
29 Reject-Screeners #1-PM L184
(80)12
1733(1627)
30 Reject-Cleaners – PM L184
(80)12
42(39)
31 Reject-Screener #2 – PM L184
(80)12
696(658)
32 Grits of classifier-Recaust. L1 56 25 964
33 Reject- Separators and screeners- Washing L291
(79)12
2132(1799)
34 Reject-Screeners-PM L284
(82)12
283(273)
35 Reject-Cleaners – PM L284
(82)12
213(206)
36 Grits of classifier-Recaust. L2 84 25 3157
37Mixture of condensate and steam-condensing turbineL1
46 450
(62860)
38Mixture of condensate and steam-condensing turbineL2
46 450
(59420)
*the data in parenthesis represents the second targeting temperature, temperatureof effluents, heat requirement of sink and heat available of heat source
Table 0-33 - Existing HEX network – Whole Mill B (for Fig. 8-21, Fig. 8-22, and Fig. 8-23)
# Code SourceTin(oC)
Tout(oC)
Q(MW)
A(m2)
Usage in new network
1 Space air heaterLP steam -8 25
13.6 1175Relocated as 1st con. of
CT – L2Air-To building 170 100
2Exhaust air-GlycolHEX – L1
Exhaust air of dryer - PM L1 87.4 79.11.1 873 Same place
Glycol –PM L1 61 70
3Air HEX –Glycolloop – L1
Glycol –PM L1 70 611.1 780 Same place
Air to Dryer – PM L1 -8 24.7
4Air economizer ofDryer- L1
Exhaust air of dryer – PM L1 132 87.42.2 1198 Same place
Air to Dryer – PM L1 24.7 90
5Exhaust air-GlycolHEX – L2
Exhaust air of dryer - PM L1 87.3 79.21.1 1220 Same place
Glycol –PM L2 66 75

308
6Air HEX –Glycolloop – L2
Glycol –PM L2 75 661.1 715 Same place
Air to Dryer – PM L2 -8 24.7
7Air economizer ofDryer- L2
Exhaust air of dryer – PM L2 131 87.32.2 1213
Same place 2nd air eco.Of dryer – L2Air to Dryer – PM L2 24.7 90
8Air heater of RBL1
LP steam 170 1432.6 301
Relocated andenlarged as 1st air eco.
Of dryer – L2Air to RB L1 45 80
9Air heater of RB &PB L2
LP steam 170 1435.0 559
Relocated as 1st con. ofCT – L1Air to RB & PB L2 35 80
10 SC #1 – Evap. L1Non-clean steam#1-Evaporation L1 61 50
32.1 931 Same placeHW 67 2 57
11 SC #2 – Evap. L1Non-clean steam#2-Evaporation L1 79 76
5.0 156 Same placeHW 67 57 67
12Water heater #1 –L1
LP steam 170 14713.2 69
Relocated as cooler ofclean flashed steam –
PM L1HW80 60 80
13Water heater #2 –L1
LP steam 170 1475.6 29
Relocated andenlarged as Cooler ofnon-clean steam of
Digesting L2HW80 60 80
14GL cooler –Recaust. L1
Green liquor –Recaust. L1 142 956.5 318
Enlarged as 2nd GLcooler – Recaust. L1HW 80 2 80
15Contaminatedwater heater
LP steam 170 1204.0 29
Relocated as 1st coolerof RB & PB
blowdown water–L2Non-clean hot water-Recaust. L1 74 85
16Water economizer–Dryer L1
Exhaust air of dryer – PM L1 79.1 78.50.5 128
Same place as 1st
water eco. Dryer L1WW40 2 40
17GL cooler –Recaust. L2
Green liquor –Recaust. L2 110 944.7 419 Enlarged
HW 95 2 95
18Blow cooler –Digesting L2
Blow of digesting – L2 104 7014.0 952
Enlarged as 2nd blowcooler – Digesting L2HW60 2 60
19 SC of Evap. L2Non-clean steam-Evaporation L2 57 52
42.3 781 Same placeWW47 2 47
20Cooler of non-clean steam ofDigesting L2
Non-clean steam-Digesting L2 100 890.6 4 Removed
WW55 2 55
21Condensate cooler– PM L2
Clean condensate of dryer – PM L2 147 651.6 18
Enlarged as cooler ofcondensate - PM L2
(for white waterheating)
HW65 50 65
22 Water heater – L2LP steam 170 147
2.8 14
Relocated andenlarged as 2nd cooler
of RB & PBblowdown water–L2
HW65 60 65
23SC of Chemicalpreparation
Chemicals #2 – Chem. Prep. 81 200.01 1 Same place
FW 2 50
24Indirect contactcooler- Chemicalpreparation
Chemicals #1 – Chem. Prep. 98 522.7 206 Same place
FW 2 50

309
Table 0-34 - Final HEX network – Whole Mill B (for Fig. 8-21, Fig. 8-22, and Fig. 8-23)
# Code SourceTin(oC)
Tout(oC)
Q(MW)
A(m2)
Usage in currentnetwork
1 1st con. of CT – L1
Mixture of condensate and steam –Condensing turbine L1
46 451.8 559
Relocated Air heaterof RB & PB L2
Air to space -8 25
22nd con. of CT –L1
Mixture of condensate and steam –Condensing turbine L1
46 455.0 1566 NEW
Air to space -8 25
3 1st con. of CT – L2
Mixture of condensate and steam –Condensing turbine L2
46 453.8 1175 Space air heater
Air to space -8 25
42nd con. of CT –L2
Mixture of condensate and steam –Condensing turbine L2
46 453.0 950 NEW
Air to space -8 25
5Exhaust air-GlycolHEX – L1
Exhaust air of dryer - PM L1 87.4 79.11.1 873 Same
Glycol –PM L1 61 70
6Air HEX –Glycolloop – L1
Glycol –PM L1 70 611.1 780 Same
Air to Dryer – PM L1 -8 24.7
7Air economizer ofDryer- L1
Exhaust air of dryer – PM L1 132 87.42.2 1198 Same
Air to Dryer – PM L1 24.7 90
8Exhaust air-GlycolHEX – L2
Exhaust air of dryer - PM L2 80 790.6 1220 Same
Glycol –PM L2 66 71
91st air eco. OfDryer – L2
Exhaust air of dryer - PM L2 79 781.1 454
Relocated andenlarged Air heater
of RB L1Air to dryer – PM L2 -8 25
10Air HEX –Glycolloop – L1
Glycol –PM L2 71 660.6 715 Same
Air to Dryer – PM L2 25 43
112nd air eco. OfDryer – L2
Exhaust air of dryer - PM L2 110 801.2 1213 Same
Air to dryer – PM L2 43 90
123rd air eco. OfDryer – L2
Exhaust air of dryer - PM L2 110 800.4 401 NEW
Air to dryer – PM L2 43 90
13Air eco. of RB –L2
Stack gas – RB L2 217 1617.6 1663 NEW
Air to RB L1, PB L2, & RB L2 39 80
14 SC #1 – Evap. L1Non-clean steam#1-Evaporation L1 61 50
32.1 931 SameHW 67 2 57
15 SC #2 – Evap. L1Non-clean steam#2-Evaporation L1 79 76
5.0 156 SameHW 67 57 67
162nd GL cooler –Recaust. L1
Green liquor –Recaust. L1 130 954.8 500
Enlarged GL cooler –Recaust. L1HW 84 67 84
17GL cooler –Recaust. L2
Green liquor –Recaust. L2 110 944.7 670 Enlarged
HW 84 67 84
18Cooler of Alkalineeffluent L1
Alkaline effluent – Eop L1 82 2516.2 3892 NEW
HW72 2 72

310
19Cooler of Acidiceffluent L1
Acidic effluent – D0 L1 75 5311.8 1760 NEW
HW65 2 65
20Cooler of cleanflashed steam –PM L1
Clean flashed steam – PM L1 110 954.7 69
Relocated Waterheater #1 – L1HW85 67 85
211st GL cooler –Recaust L1
Green liquor –Recaust. L1 142 1301.6 113 NEW
Non-clean hot water- Recaust. L1 74 85
221st Watereconomizer –DryerL1
Exhaust air of dryer – PM L1 79.1 750.4 128
Same Watereconomizer –Dryer
L1Vacuum seal water – Pm L1 2 60
232nd Watereconomizer –DryerL1
Exhaust air of dryer – PM L1 79.1 752.5 899 NEW
Vacuum seal water – Pm L1 2 60
24Cooler of overflowof FT-W#4 – L1
Overflow of filtrate tank of washer#4 – L1
80 534.4 1088 NEW
Demineralized water- Condensatetank L1
31 70
25 SC of Evap. L2Non-clean steam-Evaporation L2 57 52
42.3 781 SameWW47 2 47
26Cooler of overflowof FT-W#3 - L2
Overflow of filtrate tank of washer#3 – L2
79 571.5 562 NEW
HW69 47 69
27Cooler of Alkalineeffluent – L2
Alkaline effluent – Eop L2 76 569.6 3787 NEW
HW66 47 66
281st cooler of Acidiceffluent L2
Acidic effluent – D0 L2 72 613.7 1013 NEW
HW58 47 58
292nd Blow cooler –Digesting L2
Blow of digesting – L2 78 703.3 1078
Enlarged Blowcooler – Digesting L2HW67 58 67
301st Blow cooler –Digesting L2
Blow of digesting – L2 104 7810.6 2254 NEW
HW78 67 78
31Cooler of non-clean steam ofDigesting L2
Non-clean steam-Digesting L2 100 893.1 35
Relocated andenlarged Waterheater #2 – L1HW85 2 85
322nd cooler of acidiceffluent L2
Acidic effluent – D0 L2 61 474.6 1308 NEWDemineralized water- Condensate
tank L231 50
331st cooler of RB &PB blowdownwater – L2
Blowdown – PB & RB L2 100 600.19 29
RelocatedContaminated water
heaterDemineralized water- Condensatetank L2
50 52
342nd cooler of RB& PB blowdownwater – L2
Blowdown – PB & RB L2 100 600.26 40
Relocated andenlarged Water
heater – L2Demineralized water- Condensatetank L2
50 52
35Water economizerof PB L2
Stack gas – PB L2 150 1301.0 161 NEWDemineralized water- Condensate
tank L252 56
36Water economizerof RB L2
Stack gas – RB L2 161 1304.2 744 NEWDemineralized water- Condensate
tank L256 73
37White watereconomizer –Dryer L2
Exhaust air of dryer – PM L2 131 1101.0 395 NEW
White water – PM L2 81.8 82
38 Cooler of Clean condensate of dryer – PM L2 147 92 2.8 44 Enlarged Condensate

311
condensate ofdryer – PM L2
White water – PM L2 82 82.4cooler – PM L2
39SC of Chemicalpreparation
Chemicals #2 – Chem. Prep. 81 200.01 1 Same
FW 2 50
40Indirect contactcooler- Chemicalpreparation
Chemicals #1 – Chem. Prep. 98 522.7 206 Same
FW 2 50
Table 0-35 - (a) The new HEXs that should be purchased and (b) theexisting HEXs that should be enlarged – Whole Mill B (for Fig. 8-21,Fig. 8-22, and Fig. 8-23)
# Name of HEXHeat
exchanging(MW)
Area(m2)
Installedcost (M$)
(a) New HEXs1 2nd con. of CT – L1 5.0 1566 2.032 2nd con. of CT – L2 3.0 950 1.113 3rd air eco. Of Dryer – L2 0.4 401 0.434 Air eco. of RB – L2 7.6 1663 2.185 Cooler of Alkaline effluent L1 16.2 3892 6.566 Cooler of Acidic effluent L1 11.8 1760 2.347 1st GL cooler – Recaust L1 1.6 113 0.138 2nd Water economizer –Dryer L1 2.5 899 1.049 Cooler of overflow of FT-W#4 – L1 4.4 1088 1.3010 Cooler of overflow of FT-W#3 - L2 1.5 562 0.6111 Cooler of Alkaline effluent – L2 9.6 3787 6.3212 1st cooler of Acidic effluent L2 3.7 1013 1.2013 1st Blow cooler – Digesting L2 10.6 2254 3.2014 2nd cooler of acidic effluent L2 4.6 1308 1.6315 Water economizer of PB L2 1.0 161 0.1716 Water economizer of RB L2 4.2 744 0.8417 White water economizer – Dryer L2 1.0 395 0.42Total for new HEXs 88.8 22556 33.23
(b) The enlarged existing HEXs1 1st air eco. Of Dryer – L2 0.4 153 0.202 2nd GL cooler – Recaust. L1 1.8 182 0.203 GL cooler – Recaust. L2 1.8 251 0.284 2nd Blow cooler – Digesting L2 0.4 126 0.165 Cooler of non-clean steam of Digesting
L20.5 6 0.01
6 2nd cooler of RB & PB blowdownwater – L2
0.3 26 0.04
7 Cooler of condensate of dryer – PM L2 1.7 26 0.04Total for enlarged existing HEXs 6.8 770 0.92TOTAL 95.6 23326 34.15

312
Appendix 10–Specification of Turbine in Three Mills of Chapter 8
Table 0-36 - Thermal and mechanical efficiencies of turbines in three mills (for Fig. 8-10, Fig. 8-24, and Fig. 8-33)
MP back pressure turbine LP back pressure turbine Condensing turbineThermal
efficiency (%)Mechanical
efficiency (%)Thermal
efficiency (%)Mechanical
efficiency (%)Thermal
efficiency (%)Mechanical
efficiency (%)Mill A 69 96 70 98 70 98Mill B- Line 1 67 94 67 95 70 98Mill B- Line 2 70 93 70 94 70 98Mill C 70 98 70 98 70 98