stepped spillway performance: study of the pressure and...
TRANSCRIPT
Journal of Water Sciences Research,
ISSN: 2251-7405 eISSN: 2251-7413
Vol.8, No. 1, Spring 2016, 63-77, JWSR
* Corresponding author email: ([email protected])
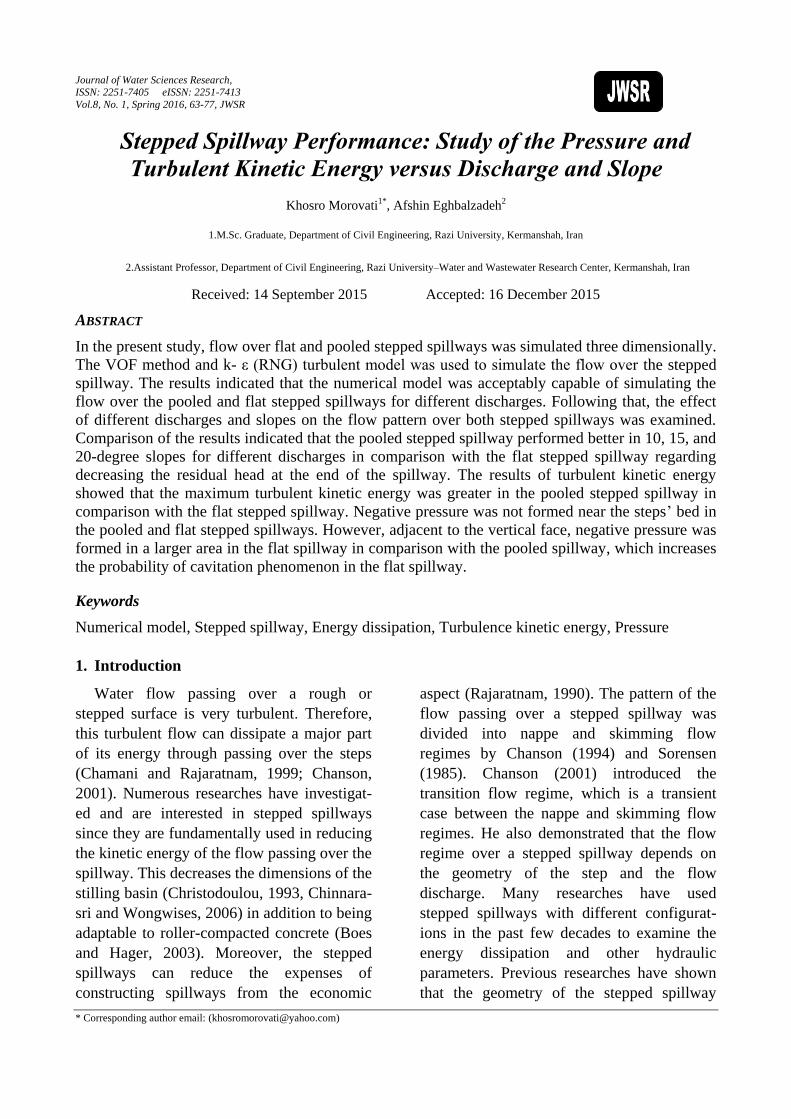
Stepped Spillway Performance: Study of the Pressure and
Turbulent Kinetic Energy versus Discharge and Slope
Khosro Morovati1*, Afshin Eghbalzadeh2
1.M.Sc. Graduate, Department of Civil Engineering, Razi University, Kermanshah, Iran
2.Assistant Professor, Department of Civil Engineering, Razi University–Water and Wastewater Research Center, Kermanshah, Iran
Received: 14 September 2015 Accepted: 16 December 2015
ABSTRACT
In the present study, flow over flat and pooled stepped spillways was simulated three dimensionally.
The VOF method and k- ε (RNG) turbulent model was used to simulate the flow over the stepped
spillway. The results indicated that the numerical model was acceptably capable of simulating the
flow over the pooled and flat stepped spillways for different discharges. Following that, the effect
of different discharges and slopes on the flow pattern over both stepped spillways was examined.
Comparison of the results indicated that the pooled stepped spillway performed better in 10, 15, and
20-degree slopes for different discharges in comparison with the flat stepped spillway regarding
decreasing the residual head at the end of the spillway. The results of turbulent kinetic energy
showed that the maximum turbulent kinetic energy was greater in the pooled stepped spillway in
comparison with the flat stepped spillway. Negative pressure was not formed near the steps’ bed in
the pooled and flat stepped spillways. However, adjacent to the vertical face, negative pressure was
formed in a larger area in the flat spillway in comparison with the pooled spillway, which increases
the probability of cavitation phenomenon in the flat spillway.
Keywords
Numerical model, Stepped spillway, Energy dissipation, Turbulence kinetic energy, Pressure
1. Introduction
Water flow passing over a rough or
stepped surface is very turbulent. Therefore,
this turbulent flow can dissipate a major part
of its energy through passing over the steps
(Chamani and Rajaratnam, 1999; Chanson,
2001). Numerous researches have investigat-
ed and are interested in stepped spillways
since they are fundamentally used in reducing
the kinetic energy of the flow passing over the
spillway. This decreases the dimensions of the
stilling basin (Christodoulou, 1993, Chinnara-
sri and Wongwises, 2006) in addition to being
adaptable to roller-compacted concrete (Boes
and Hager, 2003). Moreover, the stepped
spillways can reduce the expenses of
constructing spillways from the economic
aspect (Rajaratnam, 1990). The pattern of the
flow passing over a stepped spillway was
divided into nappe and skimming flow
regimes by Chanson (1994) and Sorensen
(1985). Chanson (2001) introduced the
transition flow regime, which is a transient
case between the nappe and skimming flow
regimes. He also demonstrated that the flow
regime over a stepped spillway depends on
the geometry of the step and the flow
discharge. Many researches have used
stepped spillways with different configurat-
ions in the past few decades to examine the
energy dissipation and other hydraulic
parameters. Previous researches have shown
that the geometry of the stepped spillway
Stepped spillway performance: study of the pressure…, Morovati et al.
64
seems to have an essential role in the energy
dissipation. Chinnarasri and Wongwises
(2006) examined the stepped spillways
considering flat, pooled and inclined steps
with 30, 45, and 60-degree slopes. Their
results showed that the relative energy
dissipation was affected by the geometry of
the steps. In addition to that, for a specific
discharge with a constant step height, relative
energy dissipation increased by the number of
steps. Felder and Chanson (2011) examined
energy dissipation on the stepped spillways
considering 5 types of configurations with
uniform and non-uniform step heights along
the spillway with a constant slope (θ= 26.6°).
The results indicated that the energy
dissipation of 5 different cases were slightly
different. Felder et al. (2012 B) examined the
flat and pooled stepped spillways with
different discharges and a constant 8.9-degree
slope. Their results showed that the relative
energy dissipation in the stepped spillway,
which was a combination of the flat and
pooled steps, was greater in comparison with
the pooled and flat stepped spillways. Felder
and Chanson (2013) compared the flat and
pooled stepped spillways with two slopes of
8.9 and 26.6 degrees. The results indicated
that the maximum relative energy dissipation
occurred in the pooled stepped spillway with
8.9-degree slope. Guenther et al. (2013)
studied a stepped spillway with 4 types of
configuration and a slope of 26.6-degree.
Their results indicated that the residual head
in the pooled and flat stepped spillway was
smaller in comparison with the pooled
stepped spillway with staggered configuration
of the flat and pooled steps and the pooled
stepped spillway with in-line configuration of
the flat and pooled steps. Other researches
studied stepped spillways with different
slopes including Kökpinar (2004) (30-degree
slope), Gonzalez (2005) (15.94 and 21.8-
degree slopes) and Thorwarth (2008) (14.6-
degree slope).
With regard to the fact that numerical
models accurately simulate the flow pattern
over different hydraulic structures, they have
turned into an efficient method in hydraulic
engineering. Using numerical models will
significantly reduce the expenses in
comparison to the experimental models. In
addition, more data could be obtained from
different parameters. There are different
methods in numerical simulation that can be
used for simulating the flow patterns and the
flow turbulence. Cheng et al. (2006)
examined the k-ε (RNG) turbulence model
and the mixture method for the numerical
simulation of a two-phase flow over a stepped
spillway. They presented the vortex flow
formed on the steps, the velocity, and pressure
in their results. Dong and Hun-wei (2006)
used the VOF method to simulate the
skimming flow over a stepped spillway with a
10-degree slope. The presults included
velocity, air concentration and pressure. Their
results showed that the VOF model can
precisely simulate the flow pattern over the
stepped spillway. Qian et al. (2009) examined
the accuracy of modeling the flow over a
stepped spillway through examining different
turbulence models. They came to the
conclusion that the result of the k-ε (RNG)
turbulence model was more accurate than
other turbulence models. Bombardelli et al.
(2011) used the VOF method and k- ε (RNG)
turbulence model to simulate the flow over a
stepped spillway with a 53-degree slope. They
examined the results of the turbulent kinetic
energy, velocity, and flow pattern. Zhenwei et
al. (2012) obtained the hydraulic parameters
of the flow including water surface profile,
pressure, and velocity through 3D simulation
of the flow over the stepped spillway. Their
results were based on the VOF method and
were fairly consistent with the experimental
data. Nikseresht et al. (2013) simulated a two-
phase flow over a stepped spillway with 18.8
and 28-degree slopes. They examined stepped
Journal of Water Sciences Research, Vol. 8, No. 1, Spring 2016, 63-77
65
spillways with flat and inclined steps in their
research. Attarian et al. (2014) simulated a
stepped spillway with a 14.036-degree slope
using the k-ε turbulence model and examined
the effect of the step height. Their simulation
was verified by comparing the velocity,
energy dissipation, and the aeration starting
point results. Effects of the pool configuration
of the pooled stepped spillway with a slope of
2.6-degree were presented by Morovati et al.
(2015). They presented the effects of the
pools on the vortex flows, standing sidewall-
waves, transverse free surface profile and
velocity counters in transverse direction by
using k- ε (RNG) turbulence model and VOF
method. Other numerical researches were
conducted on the stepped spillways including
Tabbara et al. (2005) and Sarfaraz and Attari
(2011).
The mentioned experimental researches
indicate that the spillway geometry and the
discharge passing over a stepped spillway
have a significant effect on the hydraulic
parameters. In addition, the previously-
mentioned numerical models showed that
numerical models simulate the flow pattern
over the stepped spillway precisely. The
effect of different slopes and discharges was
not examined in the previous studies. Since
the spillway slope is amongst the crucial
geometrical parameters on the energy
dissipation and other hydraulic properties of
the flow, the present research studied the flow
characteristics over the flat and pooled
stepped spillways with different slopes
through using a commercial software.
Following that, the effect of discharge was
studied.
2. Materials and Methods
The numerical results were verified based
on Felder (2012A) experimental data. The
pooled and flat stepped spillway used in the
experimental model was made of 10 steps and
the height (h) and length (l) of each step was
10 and 20 cm, respectively. The height of the
step pool (w) was 3.1 cm in all steps of the
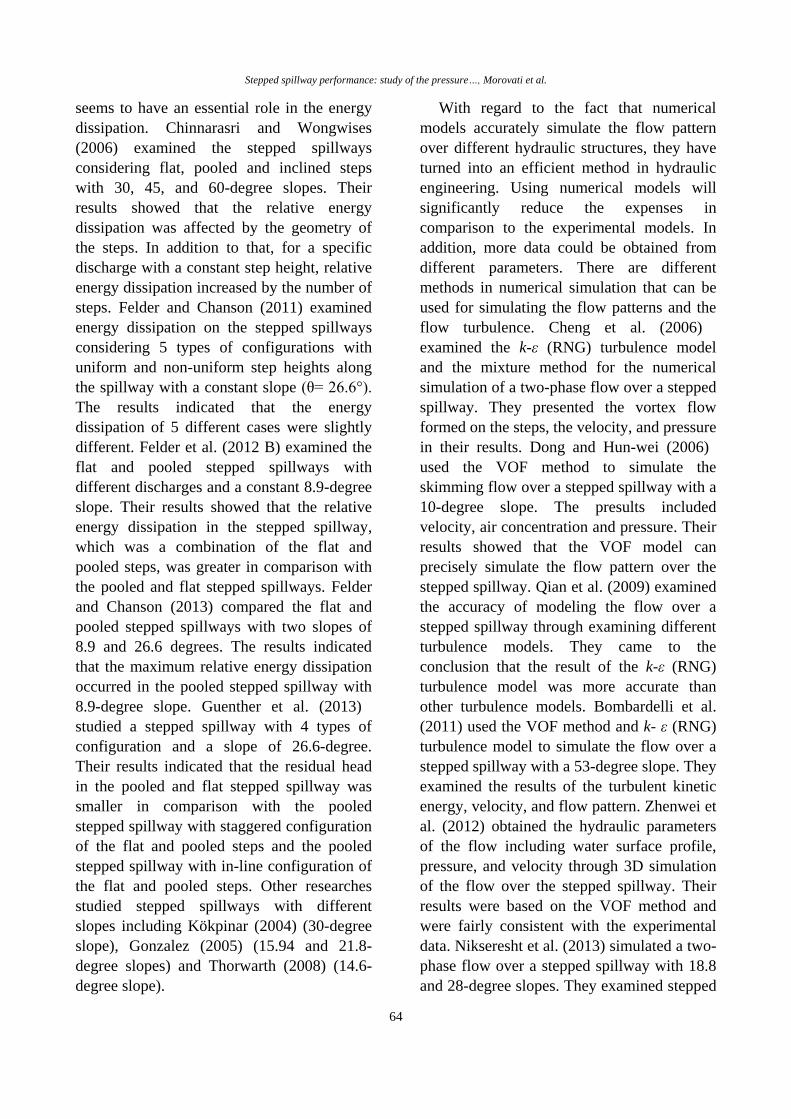
pooled stepped spillway. Other geometrical
properties of the pooled stepped spillway are
shown in Fig 1.
2.1. Meshing and Boundary Conditions
Meshing the pooled and flat stepped
spillways was in accordance with Fig. 2 using
non-uniform sized cells. Smaller grid cells
were used near the surface of all the steps.
Meshing continued 170 cm along the
downstream at the spillway in order to
prevent the output boundary numerical results
around the spillway. The meshing was
considered 50 cm higher than the spillway
crest in the vertical direction as well.
Fig. 1. Schematic view of the pooled and flat stepped spillways

Stepped spillway performance: study of the pressure…, Morovati et al.
66
Fig. 2. Meshing pattern of the a) flat and b) pooled stepped spillways
Table 1. Number of cells in longitudinal direction
35 30 26.6 20 15 10 Spillway slope (degree)
360 381 406 456 520 664 Cell number
According to the fact that the length of the
spillways with different slopes were different,
the number of cells in the longitudinal
direction was not the same. Table 1 shows the
number of cells along the longitudinal
direction, X, for different slopes. Dimensions
of the spillways were the same in the vertical,
Y, and the spanwise, Z, directions and the
numbers of cells were 121 and 42,
respectively.
In the experimental research, specific
discharge (Q) was defined for the input
boundary and thus, it was used in the present
paper. Furthermore, the experimental results
had just been presented above steps and we
couldn’t choose other boundary conditions
including specific pressure or specific
velocity for the output. Hence, outflow
boundary condition was used at the output.
Wall boundary condition was used for the
channel bed and walls and the symmetry
boundary condition was used at the upper
boundary. All the results were presented after
reaching to the final steady condition of the
flow.
2.2. Governing Equations
In the present study, 3D simulation over
the flat and pooled stepped spillway with
different slopes and discharges was done by
using FLOW-3D numerical code. The
governing equations were discretized by the
Finite-volume method on a Cartesian grid
system. The continuity and Navier-Stokes
equations were applied to simulate
incompressible flow over the stepped
spillway. The continuity equation defined as
below:
SORzyxF
RwA
zvA
yuA
xtV
)( (1)
xxzyx
F
fGx
p
z
uwA
y
uvA
x
uuA
Vt
u
11
(2)
yyzyx
F
fGy
p
z
vwA
y
vvA
x
vuA
Vt
v
11
(3)

Journal of Water Sciences Research, Vol. 8, No. 1, Spring 2016, 63-77
67
zzzyx
F
fGz
p
z
wwA
y
wvA
x
wuA
Vt
w
11
(4)
where FV is volume ratio of the flow,
and RSOR are fluid density and flow resource,
respectively. In addition, u, v, w are the flow
velocity components in x, y, z directions,
respectively. Gx, Gy, GZ are body acceleration
and fx, fy, fZ are the accelerations caused by
viscosity in x, y, z directions, respectively.
VOF method introduced by (Hirt and
Nichols, 1981) was used in the simulation. In
this method, the advection equation of fluid
fraction is as below:
0.01
zyx
F
FwAz
FvAy
FuAxVt
F
(5)
where F is the volume occupied by air in
each computational cell and changes in the
range of 0 to 1. If F is zero, there is only
water in that cell. In addition, in the cells that
are only occupied by the air, F is 1. When F
changes between 0 and 1, part of the
computational cell is filled with air and
another part is filled with water.
3. Results and Discussion
The discharges presented in Table 2 were
used to verify the numerical model. In this
table, dc is the critical depth and h is the step
height.
Velocity distribution was presented in this
research in terms of the dimensionless
functions V/Vc and (y+w)/dc. For the pooled
stepped spillway and V/Vc and y/dc for the flat
stepped spillway. w is the step pool height
which is equal to 3.1 cm in the pooled stepped
spillway and is equal to zero in the flat
stepped spillway. In addition, y is the flow
depth from the step pool to the flow surface in
the vertical direction to the spillway slope. V
is the velocity and Vc is the critical velocity of
the flow, which is obtained as follows (Felder
et al. 2012 A).
2/1dcgVc (6)
Figures 3 and 4 show a comparison of the
velocity over the flat and pooled stepped
spillways between the numerical and
experimental models for 0.09 m3/s discharge.
It could be seen in these figures that the
numerical results were fairly consistent with
the experimental data. The greatest
consistency can be seen near the middle of the
flow depth in the flat stepped spillway.
However, the greatest consistency was
obtained in the flow surface in the pooled
stepped spillway.
Table 2. Experimental discharges used for the numerical model verification (Felder et al. ( 2012A))
dc /h Q )/( 3 sm Configuration
1.29 0.075 Pooled stepped spillway
1.45 0.09 And
1.7 0.113 Flat stepped spillway

Stepped spillway performance: study of the pressure…, Morovati et al.
68
Fig. 3. Velocity distribution on steps 7, 8, 9, and 10 for Q= 0.09 m3/s in the flat stepped spillway
Fig. 4. Velocity distribution on steps 7, 8, 9, and 10 for Q= 0.09 m3/s in the pooled stepped spillway
Table 3 shows the mean relative error
percentage in both velocity and residual head
for different discharges in the flat and pooled
stepped spillways. The values presented in
this table indicate that the numerical results
were fairly consistent with the experimental
results. In addition, the numerical model was
able to simulate the flow patterns with
different discharges with an acceptable level
of accuracy.
With regard to the previously mentioned
issues, it can be seen that the numerical model
desirably simulated the flow pattern over the
flat and pooled stepped spillways. Therefore,
the performance of the flat and pooled
stepped spillways with different slopes and
discharges will be examined here after. The
slopes used for the flat and pooled stepped
spillways were the same. Figure 5 shows the
schematic view of the pooled stepped
spillway. The step pool height, the width, and
the height of the steps were remained the
same in all the cases.

Journal of Water Sciences Research, Vol. 8, No. 1, Spring 2016, 63-77
69
Table 3. Mean relative error percentage of the flat stepped spillway and the pooled stepped spillway with different
discharges
Spillway type Q )/( 3 sm
dc/h STEP
6
STEP
7
STEP
8
STEP
9
STEP
10 Residual head errors
pooled 0.075 1.29 - 6.7 7.16 11.87 10.4 4.89
stepped 0.09 1.45 - 5.66 6.38 8.4 9.37 5.09
spillway 0.113 1.7 - - 8.18 9.16 9.38 6.36
Flat 0.075 1.29 6.38 6.31 7.09 7.59 7.7 7.86
stepped 0.09 1.45 - 6.38 5.2 6.62 4.33 7.54
spillway 0.113 1.7 - - 6.2 5.01 7.83 8.06
Fig. 5. Schematic view of the pooled stepped spillways with different slopes
Fig. 6. Velocity distribution for different discharges in the flat stepped spillway
Stepped spillway performance: study of the pressure…, Morovati et al.
70
3.1. Flow velocity
Velocity distribution along the slope on the
flat stepped spillway for different discharges
is shown in Fig. 6. For all three discharges, it
can be seen that the minimum and maximum
velocities at the flow surface are obtained for
the stepped spillways with 10 and a 35-degree
slopes, respectively. In addition, near the step
bed, the minimum velocity for 0.075 m3/s
discharge was obtained in the stepped
spillway with a 26.6-degree slope and for 0.09
m3/s and 0.113 m
3/s discharges, it was
obtained in the stepped spillway with a 35-
degree slope.
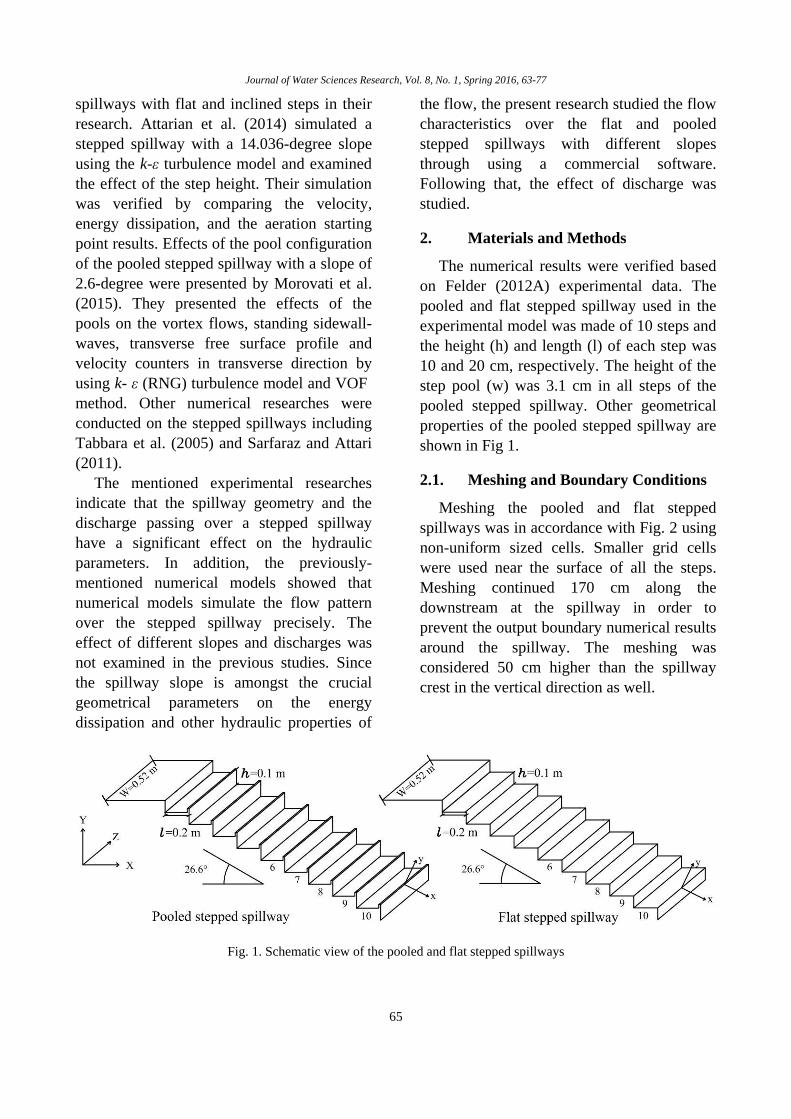
Figure 7 shows the velocity distribution for
different discharges on the pooled stepped
spillway. It can be seen from this figure that
the minimum velocity was obtained in many
points of the flow depth in the pooled stepped
spillway with a 10-degree slope. For the
0.075 m3/s discharge, the maximum velocity
occurred near the flow surface on the stepped
spillway with a 35-degree slope and the
minimum velocity occurred near the step bed
on the stepped spillway with a 20-degree
slope. For the 0.09 m3/s discharge, the
maximum velocity obtained near the flow
surface on the stepped spillway with a 30-
degree slope and the minimum velocity
obtained near the step bed in the stepped
spillway with a 20-degree slope. For the
0.113 m3/s discharge, in the pooled stepped
spillway with a 35-degree slope, the
maximum and minimum velocities occurred
at the flow surface and at the step bed,
respectively.
Fig. 7. Velocity distribution for different discharges on the pooled stepped spillway

Journal of Water Sciences Research, Vol. 8, No. 1, Spring 2016, 63-77
71
3.2. Residual head at the end of the
spillways
Figure 8 shows the residual head at the end
of the spillway. By comparing the results of
the residual head on the last step of the pooled
and flat stepped spillways it can be concluded
that the residual head reduced more in the
pooled stepped spillway in comparison with
the flat stepped spillway for all the three
discharges and 10, 15, and 20-degree slopes.
The change trends were, however, different
for 26.6, 30, and 35-degree slopes.
The residual head reduced more in the flat
stepped spillway with a 26.6-degree slope, in
comparison with the pooled stepped spillway
under all three discharges. For the 0.075 m3/s
and 0.09 m3/s discharges, the flat stepped
spillway with a 30-degree slope reduced the
residual head more in comparison with the
pooled stepped spillway and the results were
very close to each other for 0.113 m3/s
discharge. In the 35-degree slope for 0.075
m3/s discharge, the residual head was less in
the flat stepped spillway and they were almost
equal for the other discharges.
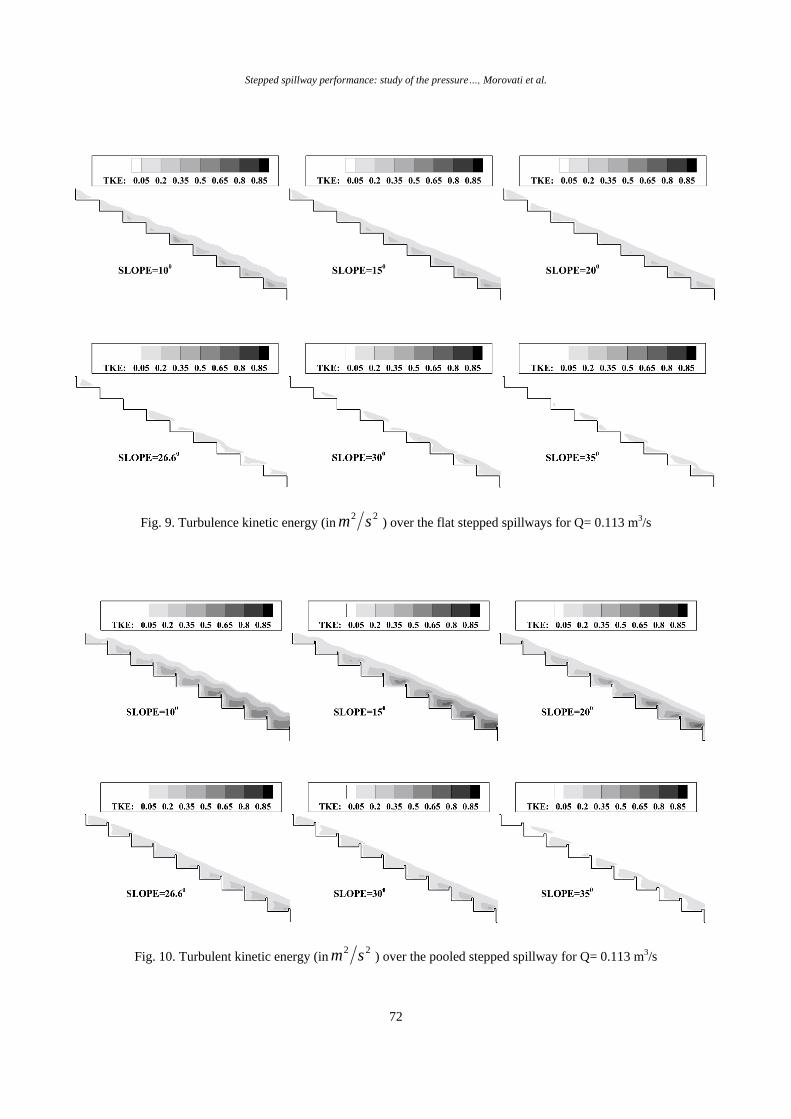
3.3. Turbulence kinetic energy
Velocity gradients on the steps of the
stepped spillways create turbulence kinetic
energy (Bombardelli et al., 2011). The
turbulence kinetic energy over the flat stepped
spillway is shown in Fig. 9. According to the
fact that the kinetic energy changing trend is
similar in all the three discharges, only the
figures related to 0.0113 m3/s discharge is
displayed in Fig. 9. It can be seen from this
figure that as the spillway slope increased up
to 26.6-degree, the turbulence kinetic energy
decreased over the spillway. However, the
turbulence kinetic energy slightly increased
for larger slopes in comparison to the 26.6-
degree slope. The maximum turbulence
kinetic energy on each step almost occurred in
its middle.
Fig. 8. Residual head at the end of the spillway with different discharges and slopes in the flat and pooled stepped
spillways
Stepped spillway performance: study of the pressure…, Morovati et al.
72
Fig. 9. Turbulence kinetic energy (in22 sm ) over the flat stepped spillways for Q= 0.113 m3/s
Fig. 10. Turbulent kinetic energy (in22 sm ) over the pooled stepped spillway for Q= 0.113 m3/s
Journal of Water Sciences Research, Vol. 8, No. 1, Spring 2016, 63-77
73
The turbulence kinetic energy of the
pooled stepped spillway for 0.113 m3/s
discharge is shown in Fig. 10. For the slopes
greater than 15-degree, the turbulence kinetic
energy decreased by the slope. In contrast to
the flat case, the maximum turbulence kinetic
energy occurred near the step pool.
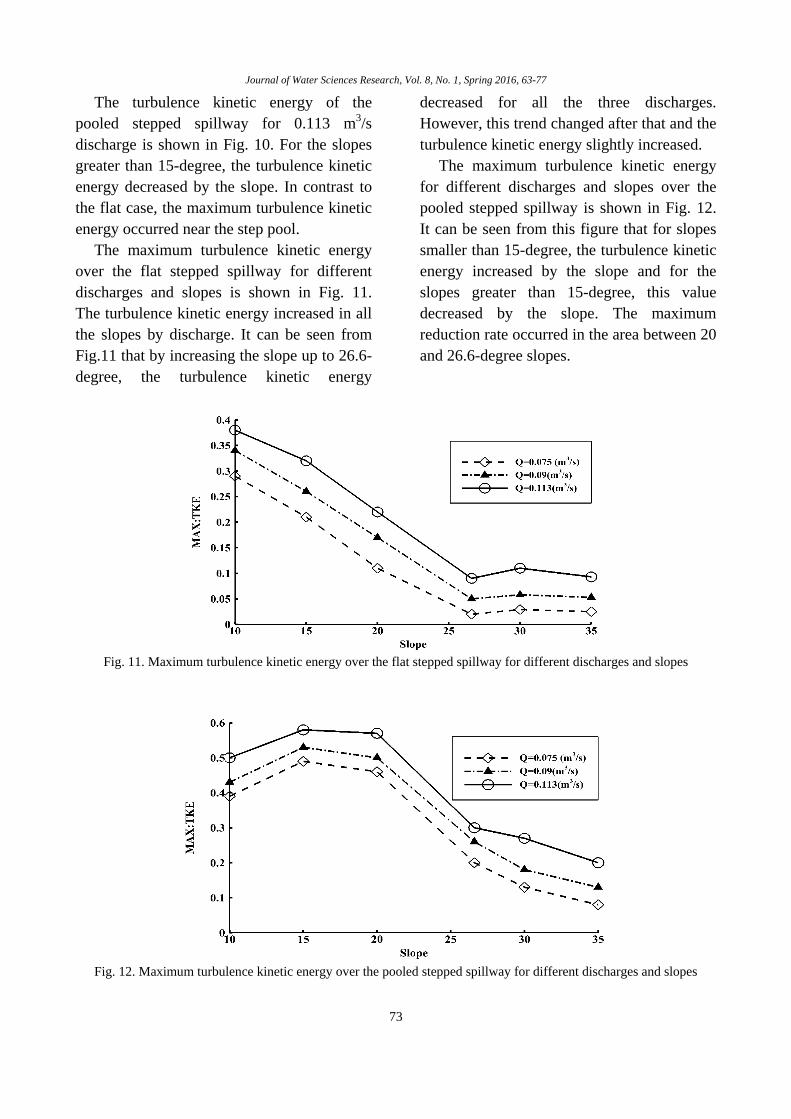
The maximum turbulence kinetic energy
over the flat stepped spillway for different
discharges and slopes is shown in Fig. 11.
The turbulence kinetic energy increased in all
the slopes by discharge. It can be seen from
Fig.11 that by increasing the slope up to 26.6-
degree, the turbulence kinetic energy
decreased for all the three discharges.
However, this trend changed after that and the
turbulence kinetic energy slightly increased.
The maximum turbulence kinetic energy
for different discharges and slopes over the
pooled stepped spillway is shown in Fig. 12.
It can be seen from this figure that for slopes
smaller than 15-degree, the turbulence kinetic
energy increased by the slope and for the
slopes greater than 15-degree, this value
decreased by the slope. The maximum
reduction rate occurred in the area between 20
and 26.6-degree slopes.
Fig. 11. Maximum turbulence kinetic energy over the flat stepped spillway for different discharges and slopes
Fig. 12. Maximum turbulence kinetic energy over the pooled stepped spillway for different discharges and slopes
Stepped spillway performance: study of the pressure…, Morovati et al.
74
By comparing the obtained values for the
maximum turbulence kinetic energy in the flat
and pooled stepped spillways, it can be stated
that the value and also the location of the
maximum turbulence kinetic energy on each
steps was different in both types of the
spillways. The obtained values indicated that
the higher velocity gradients occurred in the
most parts of the pooled stepped spillway. In
addition, the maximum turbulence kinetic
energy occurred on the last step in most cases.
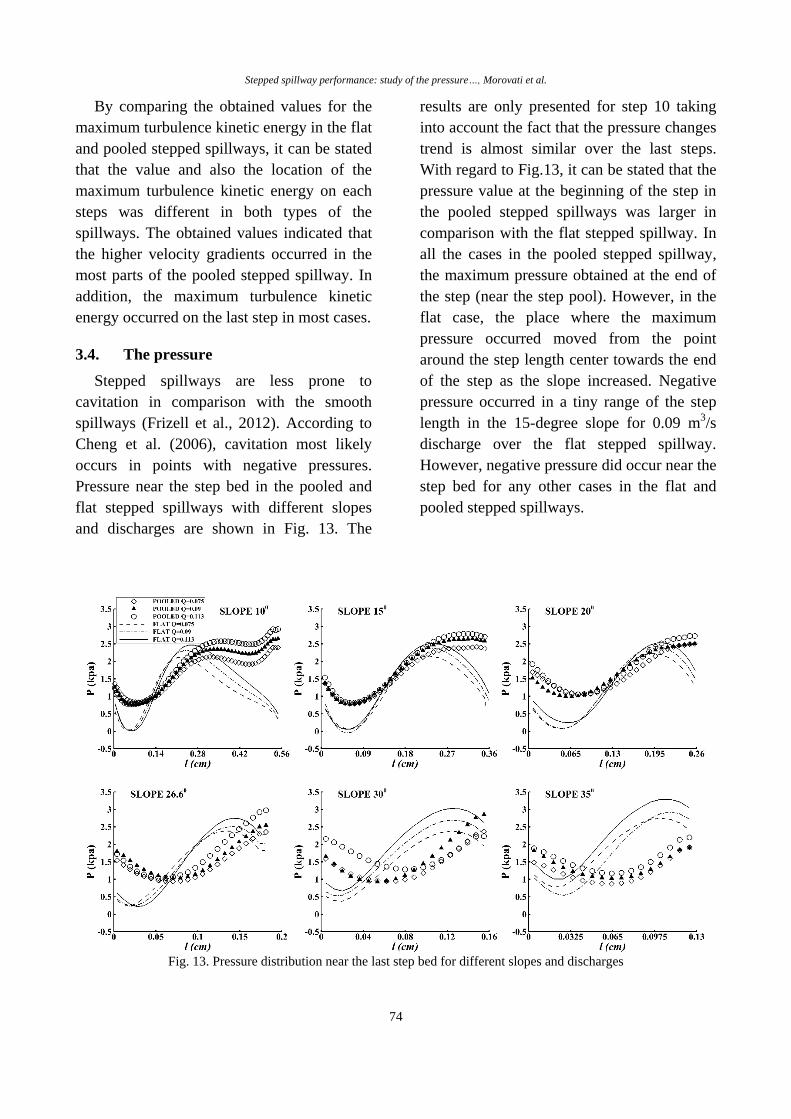
3.4. The pressure
Stepped spillways are less prone to
cavitation in comparison with the smooth
spillways (Frizell et al., 2012). According to
Cheng et al. (2006), cavitation most likely
occurs in points with negative pressures.
Pressure near the step bed in the pooled and
flat stepped spillways with different slopes
and discharges are shown in Fig. 13. The
results are only presented for step 10 taking
into account the fact that the pressure changes
trend is almost similar over the last steps.
With regard to Fig.13, it can be stated that the
pressure value at the beginning of the step in
the pooled stepped spillways was larger in
comparison with the flat stepped spillway. In
all the cases in the pooled stepped spillway,
the maximum pressure obtained at the end of
the step (near the step pool). However, in the
flat case, the place where the maximum
pressure occurred moved from the point
around the step length center towards the end
of the step as the slope increased. Negative
pressure occurred in a tiny range of the step
length in the 15-degree slope for 0.09 m3/s
discharge over the flat stepped spillway.
However, negative pressure did occur near the
step bed for any other cases in the flat and
pooled stepped spillways.
Fig. 13. Pressure distribution near the last step bed for different slopes and discharges
Journal of Water Sciences Research, Vol. 8, No. 1, Spring 2016, 63-77
75
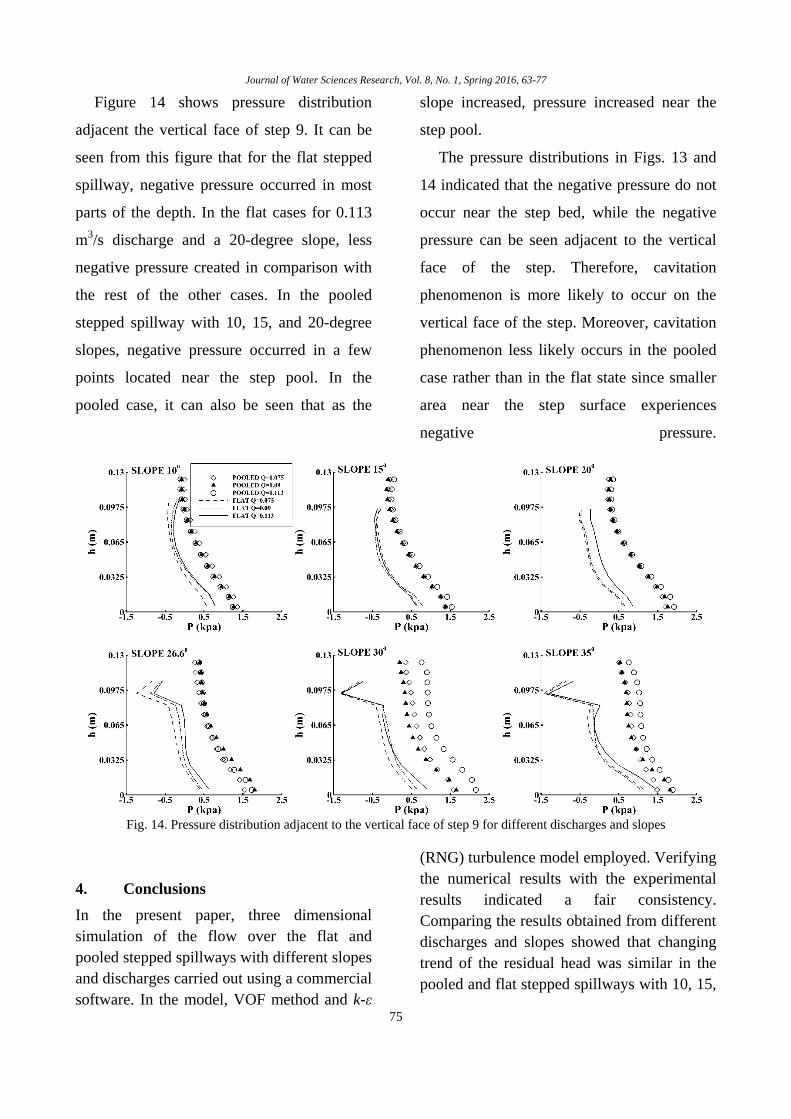
Figure 14 shows pressure distribution
adjacent the vertical face of step 9. It can be
seen from this figure that for the flat stepped
spillway, negative pressure occurred in most
parts of the depth. In the flat cases for 0.113
m3/s discharge and a 20-degree slope, less
negative pressure created in comparison with
the rest of the other cases. In the pooled
stepped spillway with 10, 15, and 20-degree
slopes, negative pressure occurred in a few
points located near the step pool. In the
pooled case, it can also be seen that as the
slope increased, pressure increased near the
step pool.
The pressure distributions in Figs. 13 and
14 indicated that the negative pressure do not
occur near the step bed, while the negative
pressure can be seen adjacent to the vertical
face of the step. Therefore, cavitation
phenomenon is more likely to occur on the
vertical face of the step. Moreover, cavitation
phenomenon less likely occurs in the pooled
case rather than in the flat state since smaller
area near the step surface experiences
negative pressure.
Fig. 14. Pressure distribution adjacent to the vertical face of step 9 for different discharges and slopes
4. Conclusions
In the present paper, three dimensional
simulation of the flow over the flat and
pooled stepped spillways with different slopes
and discharges carried out using a commercial
software. In the model, VOF method and k-ε
(RNG) turbulence model employed. Verifying
the numerical results with the experimental
results indicated a fair consistency.
Comparing the results obtained from different
discharges and slopes showed that changing
trend of the residual head was similar in the
pooled and flat stepped spillways with 10, 15,

Stepped spillway performance: study of the pressure…, Morovati et al.
76
and 20-degree slopes. The difference was that
the pooled stepped spillway resulted a lower
head in a similar discharge in comparison
with the flat case. Turbulence kinetic energy
in the pooled case was more than in the flat
case for all the slopes and discharges. The
maximum turbulence kinetic energy on each
step occurred near the step pool in the pooled
stepped spillway and almost in the middle of
the step in the flat stepped spillway. Overall,
the maximum turbulence kinetic energy in the
entire length occurred at the end of the
spillway. The pressure results near the bed of
the step at the end of the spillway indicated
that the negative pressure did not occur in the
flat and pooled cases. Negative pressure near
the vertical face occurred in most parts of the
depth in the flat stepped spillway in
comparison with the pooled case. In addition,
the negative pressure in the pooled case
eliminated for larger slopes. With regard to
the fact that the negative pressure occurred in
a larger area adjacent to the vertical face of
the steps in the flat stepped spillways, it is
more likely that the cavitation occur in this
spillway rather than the pooled stepped
spillway.
References
Attarian, A., Hosseini, K., Abdi, H., & Hosseini,
M. (2014). The Effect of the Step Height
on Energy Dissipation in Stepped
Spillways Using Numerical Simulation.
Arabian Journal for Science and
Engineering, 39(4), 2587-2594.
Boes, R. M., & Hager, W. H. (2003). Hydraulic
design of stepped spillways. Journal of
Hydraulic Engineering, 129(9), 671-679.
Bombardelli, F. A., Meireles, I., & Matos, J.
(2011). Laboratory measurements and
multi-block numerical simulations of the
mean flow and turbulence in the non-
aerated skimming flow region of steep
stepped spillways. Environmental fluid
mechanics, 11(3), 263-288.
Chamani, M., & Rajaratnam, N. (1999).
Characteristics of skimming flow over
stepped spillways. Journal of Hydraulic
Engineering, 125(4), 361-368.
Chanson, H. (1994). Aeration and deaeration at
bottom aeration devices on spillways.
Canadian Journal of Civil Engineering,
21(3), 404-409.
Chanson, H. (2001). Hydraulic design of stepped
spillways and downstream energy
dissipators. Dam Engineering, 11(4), 205-
242.
Cheng, X., Chen, Y., & Luo, L. (2006).
Numerical simulation of air-water two-
phase flow over stepped spillways.
Science in China Series E: Technological
Sciences, 49(6), 674-684.
Chinnarasri, C., & Wongwises, S. (2006). Flow
patterns and energy dissipation over
various stepped chutes. Journal of
irrigation and drainage engineering,
132(1), 70-76.
Christodoulou, G. C. (1993). Energy dissipation
on stepped spillways. Journal of
Hydraulic Engineering, 119(5), 644-650.
Dong, Z.-y, LEE Joseph Hun-wei. (2006).
Numerical simulation of skimming flow
over mild stepped channel*. Journal of
Hydrodynamics, Ser. B, 18(3), 367-371.
Felder, S., & Chanson, H. (2013). Aeration, flow
instabilities, and residual energy on
pooled stepped spillways of embankment
dams. Journal of irrigation and drainage
engineering, 139(10), 880-887.
Felder, S., & Chanson, H. (Eds.). (2011). Energy
Dissipation down a Stepped Spillway
with Non-Uniform Step Heights (Vol.
137). ASCE.
Felder, S., Fromm, C., & Chanson, H. (2012B).
Air entrainment and energy dissipation on
a 8.9° slope stepped spillway with flat and
pooled steps: School of Civil
Engineering.
Felder, S., Guenther, P., & Chanson, H. (2012A).
Air-water flow properties and energy
dissipation on stepped spillways: a
physical study of several pooled stepped
configurations: School of Civil
Engineering, The University of
Queensland.
Frizell, K. W., Renna, F. M., & Matos, J. (2012).
Cavitation potential of flow on stepped
spillways. Journal of Hydraulic
Engineering, 139(6), 630-636.
Journal of Water Sciences Research, Vol. 8, No. 1, Spring 2016, 63-77
77
Gonzalez, C. A. (2005). An experimental study of
free-surface aeration on embankment
stepped chutes. Ph.D. thesis, Department
of Civil Engineering, The University of
Queensland, Brisbane, Australia, 240
pages.
Guenther, P., Felder, S., & Chanson, H. (2013).
Flow aeration, cavity processes and
energy dissipation on flat and pooled
stepped spillways for embankments.
Environmental fluid mechanics, 13(5),
503-525.
Hirt, C. W., & Nichols, B. D. (1981). Volume of
fluid (VOF) method for the dynamics of
free boundaries. Journal of computational
physics, 39(1), 201-225.
Kökpinar, M. A. (2004). Flow over a stepped
chute with and without macro-roughness
elements. Canadian Journal of Civil
Engineering, 31(5), 880-891.
Morovati KH, Eghbalzadeh A, Javan M (2015)
Numerical investigation of the
configuration of the pools on the flow
pattern passing over pooled stepped
spillway in skimming flow regime. Acta
Mech, DOI 10.1007/s00707-015-1444-x.
Nikseresht, A., Talebbeydokhti, N., & Rezaei, M.
(2013). Numerical simulation of two-
phase flow on step-pool spillways.
Scientia Iranica, 20(2), 222-230.
Qian, Z., Hu, X., Huai, W., & Amador, A. (2009).
Numerical simulation and analysis of
water flow over stepped spillways.
Science in China Series E: Technological
Sciences, 52(7), 1958-1965.
Rajaratnam, N. (1990). Skimming flow in stepped
spillways. Journal of Hydraulic
Engineering, 116(4), 587-591.
Sarfaraz, M., & Attari, J. (2011). Selection of
Empirical Formulae for Design of
Stepped Spillways on RCC Dams. Paper
presented at the World Environmental and
Water Resources Congress, ASCE.
Sorensen, R. M. (1985). Stepped spillway
hydraulic model investigation. Journal of
Hydraulic Engineering, 111(12), 1461-
1472.
Tabbara, M., Chatila, J., & Awwad, R. (2005).
Computational simulation of flow over
stepped spillways. Computers &
structures, 83(27), 2215-2224.
Thorwarth, J. (2008). Hydraulisches Verhalten
von Treppengerinnen mit eingetieften
Stufen: selbstinduzierte
Abflussinstationaritäten und
Energiedissipation [Hydraulics of pooled
stepped spillways— Self-induced
unsteady flow and energy dissipation]. (
Ph.D. thesis), University of Aachen,
Germany (in German).
Zhenwei, M., Zhiyan, Z., & Tao, Z. (2012).
Numerical Simulation of 3-D Flow Field
of Spillway based on VOF Method.
Procedia Engineering, 28, 808-812.