stereotype threat reinterpreted as a regulatory...
TRANSCRIPT

Stereotype Threat Reinterpreted as a Regulatory Mismatch
Lisa R. Grimm, Arthur B. Markman, W. Todd Maddox, and Grant C. BaldwinUniversity of Texas at Austin
This research documents performance decrements resulting from the activation of a negative task-relevant stereotype. The authors combine a number of strands of work to identify causes of stereotypethreat in a way that allows them to reverse the effects and improve the performance of individuals withnegative task-relevant stereotypes. The authors draw on prior work suggesting that negative stereotypesinduce a prevention focus and on other research suggesting that people exhibit greater flexibility whentheir regulatory focus matches the reward structure of the task. This work suggests that stereotype threateffects emerge from a prevention focus combined with tasks that have an explicit or implicit gainsreward structure. The authors find flexible performance can be induced in individuals who have anegative task-relevant stereotype by use of a losses reward structure. The authors demonstrate theinteraction of stereotypes and the reward structure of the task with chronic stereotypes and GraduateRecord Examination math problems (Experiment 1), and with primed stereotypes and a categorylearning task (Experiments 2A and 2B). The authors discuss implications of this research for otherwork on stereotype threat.
Keywords: regulatory fit, stereotype threat, motivation, category learning, math
Stereotypes are a pervasive part of human psychological expe-rience. Starting with Steele and Aronson (1995), research docu-mented the performance decrements resulting from the activationof a negative task-relevant stereotype. These decrements occur ina range of domains from the academic sector to athletic perfor-mance and are known as stereotype threat effects (Aronson, Lus-tina, Good, Keough, & Steele, 1999; Stone, Lynch, Sjomeling, &Darley, 1999). Not confined to laboratory settings, stereotypethreat effects can be found in real-world contexts. Steele, James,and Barnett (2002) demonstrated that women in male-dominatedfields, such as math and engineering, are more likely than are thosein female-dominated fields to think about changing their major.Steele et al. proposed that this difference suggests that women areavoiding the possibility of confirming a negative stereotype abouttheir group by switching into fields like the social sciences that donot have negative stereotypes for women.
Because stereotypes are ubiquitous, it is imperative that re-searchers determine how to mitigate the negative effects of ste-reotype on performance. We present data in support of one such
method. Using regulatory focus theory (Higgins, 1987, 1997), wesuggest that stereotype threat effects are the result of a regulatorymismatch between the motivational state of the individual and thereward structure of the task. This explanation allows us to suggesta straightforward method to reverse stereotype threat effects. Sim-ply, we demonstrate that negative stereotypes can produce betterperformance than do positive ones, given a matching task rewardstructure. We call the beneficial pairing of stereotype and taskreward structure a stereotype fit. This result has profound practicalimplications because in real-world contexts it may be possible tochange the reward structure of a task without changing any otherfundamental task characteristics or underlying group stereotypes,thereby improving performance by negatively stereotyped groups.
In this article, we begin with an overview of stereotype threateffects (Steele & Aronson, 1995) and a brief review of regulatoryfocus theory (Higgins, 1987, 1997). We review and elaborate onthe concept of regulatory fit (Higgins, 1997, 2000; Higgins, Idson,Freitas, Spiegel, & Molden, 2003; Maddox, Baldwin, & Markman,2006). Finally, we present our experiments that test the interactionof stereotypes and task reward structure with Graduate RecordExamination (GRE) math problems and a classification task thatrequires flexible processing, and we discuss the implications of ourresults. We find that the impact of negative or positive stereotypesdepends directly on the nature of the task environment. For highperformance domains, like academic testing situations, the taskenvironment is very important and can be manipulated easily. Thisprovides one method for eradicating the performance decrementsdocumented when individuals encounter a negative stereotype.
Stereotype Threat
Starting with Steele and Aronson (1995), laboratory researchdocumented that the activation of a negative task-relevant ste-reotype has an adverse effect on participants’ performance on
Lisa R. Grimm, Arthur B. Markman, W. Todd Maddox, and Grant C.Baldwin, Department of Psychology, University of Texas at Austin.
This research was supported by Air Force Office of Scientific Re-search Award FA9550-06-1-0204 to Arthur B. Markman and W. ToddMaddox and by National Institutes of Health Grant R01 MH077708 toW. Todd Maddox and Arthur B. Markman. We thank Leland Lockhartfor help with data collection and Robert Josephs, Jennifer Beer, BrianGlass, Darrell Worthy, Jonathan Rein, Jeff Laux, Tram Dinh, andFrancesca Fraga for useful comments.
Correspondence concerning this article should be addressed to Lisa R.Grimm, Department of Psychology, University of Texas, 1 UniversityStation A8000, Austin, TX 78712. E-mail: [email protected]
Journal of Personality and Social Psychology © 2009 American Psychological Association2009, Vol. 96, No. 2, 288–304 0022-3514/09/$12.00 DOI: 10.1037/a0013463
288

tasks. In Steele and Aronson’s studies, Black participants un-derperformed White participants on tests of intellectual abilitywhen the test was framed as diagnostic of their ability. Thisframing activates the cultural stereotype that Black participantsshould underperform, relative to White participants, on tests ofintelligence.
This paradigm can be applied generally when groups havetask-relevant negative stereotypes, even when the groups are nottypically disadvantaged. Aronson, Lustina, Good, Keough, andSteele (1999) found that White men who were told that the purposeof the experiment was to study the superiority of Asian people onmathematics tests scored worse on a math test than did men in thecontrol group. In a different domain, Stone et al. (1999) demon-strated that Black participants performed worse than the controlcondition when a golf task was framed as diagnostic of sportsintelligence, but performed better than the control condition whenthe task was framed as diagnostic of natural athletic ability. Incontrast, White participants performed worse than the controlcondition when the task was framed as diagnostic of naturalathletic ability.
Researchers have manipulated stereotype threat in a number ofways. In the most subtle manipulation, participants are merelyasked to note their race on a test form or as part of a demographicquestionnaire prior to the test (Steele & Aronson, 1995). Otherresearchers rely on framing the test as diagnostic of ability, whenthe ability is thought to be a negative stereotype for a particulargroup. The strongest manipulation of stereotype threat involvestelling participants that another group, specifically the participants’outgroup, outperforms the participants’ ingroup.
Research on this phenomenon has led to a number of theoriesthat are aimed at explaining stereotype threat. For stereotype threatto occur, researchers argued that the psychological environmentneeds to afford stereotype consistent behavior. That is, the acti-vated stereotype needs to be self-relevant (Cadinu, Maass, Frige-rio, Impagliazzo, & Latinotti, 2003; Davies, Spencer, Quinn, &Gerhardstein, 2002) and the environment needs to allow for ste-reotype confirmation, in that the stereotype should be applicable(Ben-Zeev, Fein, & Inzlicht, 2005; Spencer, Steele, & Quinn,1999). For example, Inzlicht and Ben-Zeev (2003) argued thatwomen in mixed-gender environments are more likely to exhibitbehaviors consistent with stereotype-threat than are women insame-gender settings.
A number of social–cognitive explanations for stereotype threathave been put forward, such as participants putting forward toomuch effort or too little effort, self-handicapping, anxiety, and lowperformance confidence (Cadinu et al., 2003; Smith, 2004). Stud-ies also suggest a connection between the represented stereotypeand the corresponding stereotypic behavior (Bargh, Chen, & Bur-rows, 1996; Wheeler & Petty, 2001). For example, Cadinu et al.(2003) argued that stereotype threat effects occur because of lowerperformance expectancies, and Schmader, Johns, and Barquissau(2004) provided behavioral data differentiating individuals on thebasis of stereotype endorsement. Stereotype endorsement led todecreased confidence in learning new material, lower domainself-esteem, less desire to continue in related careers, and poorerperformance on a math test. Brown and Josephs (1999) demon-strate that math performance differences can be attributed to task-specific concerns.
In addition, some work has related stereotype threat to workingmemory (Beilock, Jellison, Rydell, McConnell, & Carr, 2006;Schmader & Johns, 2003; Schmader, Johns, & Forbes, 2008).Schmader and Johns (2003) argued that stereotype threat effectsare mediated by working memory capacity. Beilock, Jellison,Rydell, McConnell, and Carr (2006) extended this idea and dem-onstrated that the working memory impairment is caused by ex-plicit monitoring of performance for tasks that have been proce-duralized (also see Cadinu et al., 2003, for an earlier discussion ofthe role of divided attention). This claim is supported by demon-strations of the role of negative thinking under stereotype threat(Cadinu, Maass, Rosabianca, & Kiesner, 2005).
An important part of our research is that stereotype threatinfluences a person’s motivational state. At present, there are a fewmotivational accounts of stereotype threat. Stereotype threat hasbeen conceptualized as activation and inhibition of specific ste-reotypes based on active goals (Fein, von Hippel, & Spencer,1999; Sinclair & Kunda, 1999). It has also been suggested thatstereotype threat produces an increase in system arousal (seeBrehm & Self, 1989, for a general discussion on the role ofarousal) that affects performance on difficult tasks but not on easyones (Ben-Zeev et al., 2005; O’Brien & Crandall, 2003).
Most relevant to our Experiments, Seibt and Forster (2004)argued that activating stereotypes induces regulatory foci, which inturn influence performance. Seibt and Forster demonstrated that anegative stereotype induces a prevention focus, whereas a positivestereotype induces a promotion focus. To evaluate this claim, weprovide an overview of regulatory focus theory.
Regulatory Focus Theory
Regulatory focus is a motivational mechanism that influencespeople’s sensitivity to potential gains and losses in their environ-ment (Higgins, 1987, 1997). The motivation literature has longmade a distinction between approach states (those that are desir-able) and avoidance states (those that are undesirable; see Carver& Scheier, 1990; Markman & Brendl, 2000; and Miller, 1959, forfurther discussion). Orthogonal to this distinction, Higgins (1987,1997) argued that individuals may differ in their relative attentionto gains or losses in the environment. A focus on the presence orabsence of gains is called a promotion focus, and a focus on thepresence or absence of losses is called a prevention focus. Peoplediffer in the chronic accessibility of these foci, but often situationsthat have salient potential gains or losses may induce a regulatoryfocus that overcomes a person’s chronic focus (Shah, Higgins, &Friedman, 1998).
Using this framework, Seibt and Forster (2004) advanced aninsightful proposal that differences in regulatory focus cause ste-reotype threat effects. In a series of experiments, they demon-strated that priming individuals with a negative stereotype inducesa prevention focus, whereas priming individuals with a positivestereotype induces a promotion focus. On this view, decrements inperformance on difficult cognitive tasks arise because the cogni-tive processes associated with a promotion focus are better suitedto performance on these tasks than are the cognitive processesassociated with a prevention focus.
There are several reasons to believe that stereotype threat effectsand regulatory focus are related phenomena. In other work, re-
289STEREOTYPE THREAT AS REGULATORY MISMATCH

searchers have explicitly linked stereotype threat effects with reg-ulatory focus (Forster, Higgins, & Strack, 2000; Keller & Dauen-heimer, 2003), by examining the role of regulatory focus in theprocessing of stereotypic information (Forster et al., 2000) and bystudying the mediation of stereotype threat by emotions inducedby regulatory focus states (Keller & Dauenheimer, 2003). Further,in a study of regulatory focus (Keller & Bless, 2006) and in a studyexamining stereotype threat (Brown & Josephs, 1999), the samemanipulation was used. Brown and Josephs (1999) manipulatedstereotype threat by framing a test as diagnostic of weak or strongability. They argued that the weak ability condition corresponds to thenegative stereotype women desire to avoid confirming and that thestrong ability condition corresponds to the positive stereotype thatmen desire to confirm. Keller and Bless (2006) manipulated situ-ational focus using the same test framing. However, they arguedthat the weak ability condition primed a situational-preventionfocus and the strong ability condition primed a situational-promotion focus.
More recent work on regulatory focus demonstrates that aperson’s regulatory focus typically interacts with salient aspects ofthe task to determine cognitive and evaluative processes that arebrought to bear on performance. For example, Higgins and col-leagues (Forster, Higgins, & Idson, 1998; Higgins, 2000; Shah etal., 1998) found that the value people give to items in the envi-ronment depends on the fit between a person’s regulatory focusand aspects of the items being evaluated. Higgins argued that aregulatory fit enhances task engagement, which increases the per-ceived value of the task (Higgins, 2000). On this view, matchstates feel better than mismatch states (Aaker & Lee, 2006; Cesa-rio, Grant, & Higgins, 2004; Kruglanski, 2006; Sassenberg, Jonas,Shah, & Brazy, 2007).
Another form of fit between regulatory focus and tasks canoccur when a person’s regulatory focus matches the reward struc-ture of the task that they are performing (Keller & Bless, 2006;Maddox et al., 2006; Shah et al., 1998). A promotion focusincreases people’s sensitivity to gains and nongains, so there is aregulatory fit between individuals with a promotion focus andtasks in which people gain rewards (e.g., points in a task), but thereis a regulatory mismatch for those participants when they mustavoid punishments (e.g., losing points). In contrast, a preventionfocus increases people’s sensitivity to losses, so there is a regula-tory fit between individuals with a prevention focus and tasks forwhich they must avoid losses and a regulatory mismatch for thoseparticipants for tasks for which they must achieve gains. Some ofthese studies use chronic regulatory focus, whereas others inducea situational focus by having people try to achieve or try to avoidlosing a raffle ticket to win money. The reward structure of the taskis manipulated to either match or mismatch the regulatory focus,presenting participants with opportunities to gain or lose points foreach response.
Stereotype Fit
Table 1 summarizes the interaction between regulatory focusand task reward structure. Our argument is that in previous dem-onstrations of stereotype threat, the left-hand column of this tablewas assessed. Typical cognitive tasks involve an explicit or im-plicit gain structure. Participants are trying to achieve correct
answers to questions, and participants are typically rewarded forbeing correct. Participants who have a negative task-relevant ste-reotype have a prevention focus and, thus, are in a regulatorymismatch. Because the tasks are difficult, this mismatch leads topoorer performance than is observed in participants who do nothave a negative task-relevant stereotype. This latter group either hasa positive task-relevant stereotype, in which case they likely have apromotion focus, or else they have no task-relevant stereotype, inwhich case their performance will be driven in part by theirchronically accessible regulatory focus.
These predictions are also supported by some prior work onpositive stereotypes (Quinn & Spencer, 2001; Shih, Pittinsky, &Ambady, 1999; Walton & Cohen, 2003; Wraga, Helt, Duncan, &Jacobs, 2006). First, Wraga et al. (2006), Walton and Cohen(2003), and Shih et al. (1999) present evidence for improvedperformance by groups with positive stereotypes. Walton andCohen label this phenomena stereotype lift. In a meta-analyticreview of 43 studies, they found improved performance by thenonnegatively stereotyped group in the stereotype-relevant condi-tion, compared to the stereotype-irrelevant or control condition. Inour Table 1, this effect is located in the leftmost column of Table1. That is, individuals with positive stereotypes are expected to dowell in gains tasks.
Much of the work on stereotype threat has been completed withverbal and math tests and a gains context. Unintentionally creatinga gains context, Steele and Aronson (1995) told participants thatthey should not expect to get many questions correct in all exper-imental conditions. Merely mentioning correct responding may beenough to frame a test as a gains environment. Therefore, Steeleand Aronson created a regulatory mismatch when Black partici-pants were told the test was diagnostic of their ability or when theyhad their race highlighted. These Black participants were preven-tion focused in a gains environment. Likewise, Keller and Dauen-heimer (2003) created a gains environment by emphasizing tostudents that they needed to solve as many problems as possibleand demonstrated the classic stereotype threat effect with womenand math.
Similarly, Spencer et al. (1999) asked participants to take theGRE (see also Quinn & Spencer, 2001). As part of the testinstructions, participants read the standard GRE scoring from1999: Correct items get 1 point, blank items get no deductions, andincorrect items get a deduction to correct for guessing. Technicallyspeaking, this point structure is a mixed structure composed ofboth gains and losses. However, the correct and blank items’scoring matches a gains environment and the incorrect scoring is asmall loss that may not be well understood by participants. Assuch, this test context is more of a gains environment than a lossesenvironment. Thus, we suggest that the female participants in thisstudy had a situational prevention focus because of the negative
Table 1Schematic Representation of Regulatory Fit and Mismatches
Stereotype Gains Losses
Positive (promotion) Fit MismatchNegative (prevention) Mismatch Fit
290 GRIMM, MARKMAN, MADDOX, AND BALDWIN

stereotype. In contrast, men have a positive self-relevant stereo-type (or perhaps no active self-stereotype), so they are likely tohave a promotion focus. Because this was gains environment,women were likely to be in a regulatory mismatch, and men werelikely to be in a regulatory fit, so women should (and did) performworse than men on this task.
Our analysis suggests that if we assessed the performance ofparticipants in a loss condition (the rightmost column of Table 1),then the effects of having a negative task-relevant stereotypeshould reverse. That is, participants with a negative task-relevantstereotype should actually do better when there is a loss rewardstructure than should those participants with a positive task-relevant stereotype because individuals with a negative stereotypeare experiencing stereotype fit.
We test our predictions in two experiments. Experiment 1 usesproblems from the quantitative GRE. We replicate the methodused by Spencer et al. (1999) to create a situation in whichstereotypes would be active, thereby inducing regulatory foci.Students were told that they were going to take a math test givento a large group of students. Relying on the stereotype threatliterature, we assume that women have a negative math stereotype,whereas men do not. We manipulated the task reward structure ina manner consistent with prior work on regulatory fit (Maddox etal., 2006). Half the students gained more points for correct re-sponses than for incorrect responses (i.e., the gains version),whereas half lost fewer points for correct responses than forincorrect responses (i.e., the losses version). We predicted thatwomen would perform better in the losses version of the GRE testthan in the gains version, whereas men would show the oppositepattern of data. It is important to note that this result would showthat it is possible to improve the performance of women on astandardized test by altering the reward framing of the test whileleaving the actual test unchanged.
In Experiments 2A and 2B, we further investigated our predic-tions and a possible mechanism for our effects. We transfer ourresults to a new domain: classification learning. We picked thisdomain because work in classification learning suggests that flex-ibility (defined as the degree to which people test many rules tocorrectly solve the task) may be a possible mechanism to explainthe interaction of regulatory focus and reward structure (Grimm,Markman, Maddox, & Baldwin, 2008; Maddox et al., 2006). Wediscuss this mechanism in more detail in the introduction toExperiment 2. Furthermore, we have models from the classifica-tion literature that we can use to analyze participant responses(Ashby & Maddox, 1993; Maddox & Ashby, 1993). These modelsallow a more detailed understanding of how participants com-pleted the classification task.
Experiment 1
In this experiment, we examine performance on quantitativeGRE problems. Previous research suggests that women have anegative math stereotype, whereas men do not. We manipulatedthe reward structure of the task, so that half the participants gainpoints for each response but get more points for correct responsesthan for incorrect responses, and half the participants lose pointsbut lose fewer points for correct responses than for incorrectresponses. We predicted that women would experience stereotype
fit and perform better in the losses version of the GRE test than inthe gains, whereas men would perform better in the gains versionrelative to the losses version. Furthermore, we predicted that wewould replicate the stereotype threat literature, as we interpret it,and find that men perform better than do women in the gainsversion of the GRE test.
Method
Participants and design. Seventy-nine undergraduate students(37 men and 42 women) at the University of Texas at Austinparticipated for course credit. Half the women and 20 men wererandomly assigned to the gains reward structure. The remainingparticipants were assigned to the losses reward structure. ThisExperiment had a 2 (gender: male, female) � 2 (reward structure:gains, losses) design. Reward structure was manipulated betweenparticipants.
Materials and procedure. Participants were tested in individ-ual cubicles in a room containing approximately equal numbers ofmen and women. Participants first completed the Regulatory FocusQuestionnaire (RFQ: Higgins et al., 2001), and the Beck AnxietyInventory (BAI: Beck, Epstein, Brown, & Steer, 1988) and thePenn State Worry Questionnaire (PSWQ: Meyer, Miller, &Metzger, 1990), which measure two constructs, anxiety and worry,respectively, which have been linked to a prevention focus (Hig-gins, 1997). We used the RFQ as a measure of chronic promotionand chronic prevention focus. On this questionnaire, participantsare asked to rate the frequency of specific events in their lives. ThePSWQ requires the participants to rate how true displayed itemsare of them, and the BAI requires participants to report how muchthey have been bothered by a range of symptoms in the last week,such as “terrified,” “nervous,” and “faint.” We used all of thesequestionnaires to determine whether there were any group differ-ences prior to telling participants about the purpose of study.
Next, from a slightly altered stereotype manipulation fromSpencer et al. (1999), participants were told, “We are developingsome new tests, and we are evaluating across a large group ofUniversity of Texas students. Today, you will be taking a mathtest. This test is designed to be diagnostic of your math ability.”Participants in the gains condition were told that they would earn2 points for each correct answer, that they would earn 0 points foreach incorrect answer, and that their goal was to get 36 points (e.g.,90% correct). Participants in the losses condition were told theywould lose 1 point for each correct response, that they would lose 3points for each incorrect response, and that their goal was to lose nomore than 24 points (e.g., 90% correct).1 To continue to the nextscreen, participants were told to press F if they were female and topress M if they were male.
Directly after reading about the math test, we asked participantsto rate the following: “How well do you think you will perform inthis task, on a scale of 1 to 9, where 1 � very bad and 9 � verygood?” “How much do you like the task? (1 � not at all, 9 � verymuch)?” and “How motivated are you to do well on the task (1 �not at all and 9 � very motivated )?” Next, the participants took the
1 Maddox et al. (2006) demonstrated that a gains structure with 2 pointsfor a correct response and 0 points for an incorrect response produces thesame pattern of results as a gains structure with 3 points for a correctresponse and 1 point for an incorrect response.
291STEREOTYPE THREAT AS REGULATORY MISMATCH
Positive and Negative Affect Schedule (PANAS: Watson, Clark,& Tellegen, 1988), which is a 20 adjective checklist that asksparticipants to report current emotional states. The PANAS givesus a measure of the positive and negative affect prior to completingthe problems.
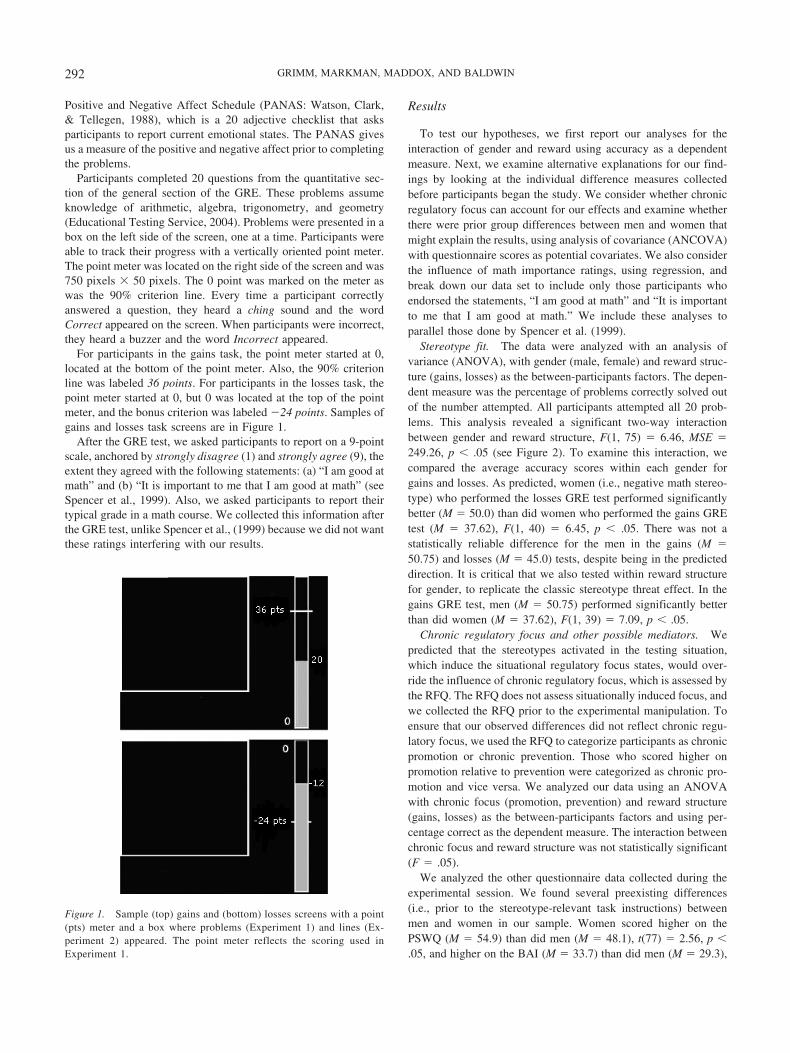
Participants completed 20 questions from the quantitative sec-tion of the general section of the GRE. These problems assumeknowledge of arithmetic, algebra, trigonometry, and geometry(Educational Testing Service, 2004). Problems were presented in abox on the left side of the screen, one at a time. Participants wereable to track their progress with a vertically oriented point meter.The point meter was located on the right side of the screen and was750 pixels � 50 pixels. The 0 point was marked on the meter aswas the 90% criterion line. Every time a participant correctlyanswered a question, they heard a ching sound and the wordCorrect appeared on the screen. When participants were incorrect,they heard a buzzer and the word Incorrect appeared.
For participants in the gains task, the point meter started at 0,located at the bottom of the point meter. Also, the 90% criterionline was labeled 36 points. For participants in the losses task, thepoint meter started at 0, but 0 was located at the top of the pointmeter, and the bonus criterion was labeled �24 points. Samples ofgains and losses task screens are in Figure 1.
After the GRE test, we asked participants to report on a 9-pointscale, anchored by strongly disagree (1) and strongly agree (9), theextent they agreed with the following statements: (a) “I am good atmath” and (b) “It is important to me that I am good at math” (seeSpencer et al., 1999). Also, we asked participants to report theirtypical grade in a math course. We collected this information afterthe GRE test, unlike Spencer et al., (1999) because we did not wantthese ratings interfering with our results.
Results
To test our hypotheses, we first report our analyses for theinteraction of gender and reward using accuracy as a dependentmeasure. Next, we examine alternative explanations for our find-ings by looking at the individual difference measures collectedbefore participants began the study. We consider whether chronicregulatory focus can account for our effects and examine whetherthere were prior group differences between men and women thatmight explain the results, using analysis of covariance (ANCOVA)with questionnaire scores as potential covariates. We also considerthe influence of math importance ratings, using regression, andbreak down our data set to include only those participants whoendorsed the statements, “I am good at math” and “It is importantto me that I am good at math.” We include these analyses toparallel those done by Spencer et al. (1999).
Stereotype fit. The data were analyzed with an analysis ofvariance (ANOVA), with gender (male, female) and reward struc-ture (gains, losses) as the between-participants factors. The depen-dent measure was the percentage of problems correctly solved outof the number attempted. All participants attempted all 20 prob-lems. This analysis revealed a significant two-way interactionbetween gender and reward structure, F(1, 75) � 6.46, MSE �249.26, p � .05 (see Figure 2). To examine this interaction, wecompared the average accuracy scores within each gender forgains and losses. As predicted, women (i.e., negative math stereo-type) who performed the losses GRE test performed significantlybetter (M � 50.0) than did women who performed the gains GREtest (M � 37.62), F(1, 40) � 6.45, p � .05. There was not astatistically reliable difference for the men in the gains (M �50.75) and losses (M � 45.0) tests, despite being in the predicteddirection. It is critical that we also tested within reward structurefor gender, to replicate the classic stereotype threat effect. In thegains GRE test, men (M � 50.75) performed significantly betterthan did women (M � 37.62), F(1, 39) � 7.09, p � .05.
Chronic regulatory focus and other possible mediators. Wepredicted that the stereotypes activated in the testing situation,which induce the situational regulatory focus states, would over-ride the influence of chronic regulatory focus, which is assessed bythe RFQ. The RFQ does not assess situationally induced focus, andwe collected the RFQ prior to the experimental manipulation. Toensure that our observed differences did not reflect chronic regu-latory focus, we used the RFQ to categorize participants as chronicpromotion or chronic prevention. Those who scored higher onpromotion relative to prevention were categorized as chronic pro-motion and vice versa. We analyzed our data using an ANOVAwith chronic focus (promotion, prevention) and reward structure(gains, losses) as the between-participants factors and using per-centage correct as the dependent measure. The interaction betweenchronic focus and reward structure was not statistically significant(F � .05).
We analyzed the other questionnaire data collected during theexperimental session. We found several preexisting differences(i.e., prior to the stereotype-relevant task instructions) betweenmen and women in our sample. Women scored higher on thePSWQ (M � 54.9) than did men (M � 48.1), t(77) � 2.56, p �.05, and higher on the BAI (M � 33.7) than did men (M � 29.3),
Figure 1. Sample (top) gains and (bottom) losses screens with a point(pts) meter and a box where problems (Experiment 1) and lines (Ex-periment 2) appeared. The point meter reflects the scoring used inExperiment 1.
292 GRIMM, MARKMAN, MADDOX, AND BALDWIN

t(77) � 2.83, p � .05. After the description of the math test,women reported that they expected to like the task less (M � 6.3)than did men (M � 7.0), t(77) � 1.97, p � .053.
Although we find these differences interesting (and poten-tially important) we do not try to explain them here. Instead, weuse ANCOVA to determine whether the significant gendereffects found in the questionnaire data could account for ourinteraction effect of interest. To this end, we completedANCOVAs with gender and reward, with each of the question-naire scores above as continuous predictors (i.e., covariates) oftask performance. We included the interaction between covari-ate and reward in our model to ensure that our interactionbetween gender and reward was estimated without bias (seeYzerbyt, Muller, & Judd, 2004, for a detailed discussion). Whenthe PSWQ scores were used in an ANCOVA, there was aninteraction of gender and reward, F(1, 73) � 9.48, MSE �231.66, p � .05, an interaction of reward and PSWQ, F(1,73) � 4.86, MSE � 231.66, p � .05, and a main effect ofreward, F(1, 73) � 5.41, MSE � 231.66, p � .05. The inclusionof BAI scores in an ANCOVA resulted only in an interaction ofgender and reward, F(1, 73) � 7.27, MSE � 252.79, p � .05.Lastly, when the liking scores were used in an ANCOVA, therewas an interaction of gender and reward, F(1, 73) � 6.67MSE � 235.84, p � .05, and a main effect of liking, F(1, 73) �4.36, MSE � 235.84, p � .05. These analyses demonstrate thatour Gender � Reward Structure interaction is robust, even aftercontrolling for differences between men and women. In addi-tion, performance expectations did not drive our effects.Women expected to perform worse but, in fact, performed justas well as men in the losses version of the task. Likewise,positive or negative affect did not influence our effects.
To align our theoretical perspective with previous work onstereotype threat, we examined the relationship between mathimportance and our effects. Math importance is positively cor-related (r � .4) with accuracy. To examine this relationship, weran a multiple regression using math importance (centered) as acontinuous predictor and using gender, reward, and the inter-action of gender and reward as categorical predictors of per-
centage correct. The regression was significant, F(4, 74) �5.71, MSE � 216.53, p � .05, R2 � .24. Both math importance(B � 2.59) and the interaction component (B � �3.79)were significant predictors ( p � .05), ts(77) � 3.5 and �2.26,respectively.
Next, we performed a median split and selected participants whomore strongly endorsed the claims “I am good at math” and “It isimportant to me that I am good at math.” We had 18 women (8 ingains and 10 in losses) and 20 men (10 in both gains and losses)in this sample. The data were analyzed with an ANOVA withgender (male, female) and reward structure (gains, losses) as thebetween-participants factors and percentage correct as the depen-dent measure. This analysis revealed a significant main effect ofgender, F(1, 34) � 4.71, MSE � 189.92, p � .05, qualified by atwo-way interaction between gender and reward structure, F(1,34) � 6.84, MSE � 189.92, p � .05. Men (M � 56.5) performedsignificantly better than did women (M � 46.75). To examine theinteraction, we compared the average percentage correct withineach gender for gains and losses. As predicted, women in thelosses GRE test performed significantly better (M � 53.5) than didwomen in the gains GRE test (M � 40.0), F(1, 34) � 4.26, p �.05. There was not a statistically reliable difference for the men inthe gains and losses tests ( p � .11). Men in the gains task (M �61.5) performed better than did men in the losses GRE test (M �51.5). Furthermore, analyzing the data in a manner consistent withstereotype threat, men performed significantly better than didwomen in the gains GRE test, F(1, 16) � 10.82, p � .05.
Discussion
Men and women completed problems from the quantitativesection of the general GRE. Half the men and half the womencompleted a gains version of the GRE test, whereas the remaindercompleted a losses version. We theorized that work done onstereotype threat has typically used a gains-type environment andthat individuals with negative stereotypes underperform becausethey are experiencing a regulatory mismatch. Therefore, we pre-dicted that we would replicate stereotype threat effects, withmen performing better than women did in the gains version ofour GRE test because men would be experiencing stereotype fit.However, we also predicted that women would experiencestereotype fit in the losses GRE test and perform better than inthe gains GRE test.
We found support for our interpretation of the stereotype threatliterature and stereotype fit. In the gains version of the GRE test,men performed better than women did, as predicted. It is moreimportant to note that women in the losses version performed12.38% better than did women in the gains version. This is ameaningful performance improvement. Moreover, women in thelosses GRE test (M � 50.0) performed just as well as men in thegains GRE test (M � 50.75). This result suggests that our methodcan eliminate the classic stereotype threat effect by changing thetask environment to produce a stereotype fit for those with nega-tive task-relevant stereotypes.
We did not find a full crossover interaction. Men in the gainsGRE test did better than did those in the losses GRE test, but notstatistically better. We believe that the negative math stereotypefor women is stronger than the positive math stereotype for men.As such, the positive stereotype may not have influenced the
0
10
20
30
40
50
60
70
80
Women Men
Gender
GainsLosses
*
Perc
enta
ge C
orre
ct
Figure 2. Percentage correct for men and women in the gains and lossestasks in Experiment 1. Error bars represent one standard error. Asteriskindicates that women in the losses task performed significantly better thanwomen in the gains task.
293STEREOTYPE THREAT AS REGULATORY MISMATCH
behavior of men to the same degree. We do not believe stereo-type fit effects to be unique to women and explore this issue inExperiment 2.
To align our study with previous work on stereotype threat andmath importance, we also focused our analyses on participantswho endorsed statements about math importance and math ability.First, we found that both math importance and the interaction ofgender and reward were significant predictors of our effects.Second, using a subset of our data in secondary analyses, whichhad less power because they included, approximately, only 10participants per group, we still find an interaction of gender andreward for these participants and a significant effect for womenwho do better in losses than in gains. We do find a 10% advantagefor men in the gains GRE test over men in the losses GRE test, butbecause of the small number of participants included in thisanalysis, the difference is not statistically reliable.
This study demonstrates a stereotype threat effect with a preex-isting stereotype and a task that people often perform outside of thelab. This study also connects directly to previous research that hasused a similar paradigm. However, it is difficult to use this task toprovide support for the claim that the root of this effect lies in thedegree of flexibility engendered by the interaction of a motiva-tional state created by a negative self-relevant stereotype and thereward structure of the task. To explore this issue more directly,we turn to an experimental setting that permits us to describechanges in people’s behavior in a more fine-grained way.
For this purpose, we use a classification task in which partici-pants learn to classify lines that vary in length, orientation, andposition on the screen. We chose this domain because it is wellunderstood and because there are data analytic models that providea means to analyze the strategies participants use to solve the task.These qualities allow us a greater chance to uncover possiblemechanisms behind our effects than was possible with the GREproblems used in Experiment 1.
Because there are no preexisting stereotypes related to percep-tual classification, we were able to create arbitrary stereotypes forparticipants. In Experiments 2A and 2B, we use gender stereo-types, but across studies, we vary the stereotype given. In Exper-iment 2A, participants are told that women are better at theclassification task than are men, whereas in Experiment 2B, par-ticipants are told that men are better at the classification task thanare women. Like Experiment 1, half of the participants gain pointsand half lose points. We predicted that our effects would be truenot only for chronic stereotypes but for primed stereotypes as wellbecause both activate regulatory focus states. Therefore, we pre-dicted that the two-way interaction between gender and rewardobserved in Experiment 1 would go in different directions inExperiments 2A and 2B, leading to a 3-way interaction.
We use a classification task from Maddox et al. (2006). InMaddox et al. (2006), participants were given a perceptual classi-fication task in which they had to learn to classify lines that variedin their length, position, and orientation. The task required learninga subtle classification rule involving the length and orientation ofthe lines. A simple rule involving only the highly salient positiondimension would yield a good performance, but not a sufficientlygood performance to achieve the performance criterion. Thus, thistask requires the flexibility to stop using an obvious but suboptimalrule and to try less obvious but more effective strategies forclassifying the items. Simply, participants need to continue to
search the rule space until they find the correct rule to use toclassify the items. Flexibly in trying rules leads to better perfor-mance because the participants must try and abandon a number ofincorrect rules prior to discovering the correct one.
Maddox et al. (2006) gave participants either a situational pro-motion focus by giving them the opportunity to obtain a raffleticket for a drawing to win $50 if their performance exceeded acriterion or a situational prevention focus by giving them a raffleticket for this drawing and telling them that they could keep theticket as long as their performance exceeded the criterion, other-wise, they would lose it. The reward structure of the classificationtask was manipulated between participants as well. Participantsgiven a gains reward structure received points for every response,but got more points for correct responses than for incorrect re-sponses. Participants given a losses reward structure lost points forevery response, but lost fewer points for correct responses than forincorrect responses. Participants with a regulatory fit (i.e., a pro-motion focus with gains, or a prevention focus with losses) per-formed better and were more likely to achieve the performancecriterion than were participants with a regulatory mismatch (i.e., aprevention focus with gains or a promotion focus with losses).
An important reason for the use of this classification task is thatit allows researchers to fit mathematical models to the data todescribe the strategies used by individual participants on a block-by-block basis. Maddox et al. (2006) found that early in learning,participants’ performance was best characterized as using a simplerule along one dimension. Later, participants learned to classify onthe basis of the correct, two-dimensional rule. Participants with aregulatory fit found the correct two-dimensional rule earlier in thetask than did those with a regulatory mismatch. That is, theyengaged in more flexible processing.
The study just described is one in a series of experimentsdemonstrating that regulatory fit leads to flexibility and explora-tion in a variety of settings including classification, decision mak-ing, and foraging (Grimm et al., 2008; Maddox et al., 2006; Maddox,Markman, & Baldwin, 2007; Markman, Baldwin, & Maddox, 2005;Markman, Maddox, & Baldwin, 2005; Markman, Maddox, &Worthy, 2006; Markman, Maddox, Worthy, & Baldwin, 2007;Worthy, Maddox, & Markman, 2007). Across these studies, theeffects of regulatory fit are nearly identical for participants with apromotion focus and a gains reward structure and for participantswith a prevention focus and a losses reward structure.
These regulatory fit findings are consistent with those from theliterature on chronic regulatory focus and on stereotype threat, ifwe apply our interpretation of the literatures. For example, if weassume that studies of chronic focus (i.e., promotion versus pre-vention) typically involved gains tasks, then promotion partici-pants experiencing fit were being compared to prevention partic-ipants experiencing mismatch. Forster and Higgins (2005) arguedthat a promotion focus supports more global processing, whereasa prevention focus supports more local processing. Evidence forthis claim comes from embedded figures tests (Forster & Higgins,2005), tests of creative performance (Friedman & Forster, 2001),preferences for stability and change (Liberman, Idson, Camacho,& Higgins, 1999), hypothesis generation (Liberman, Molden, Id-son, & Higgins, 2001), and probability estimates for conjunctiveand disjunctive events (Brockner, Paruchuri, Idson, & Higgins,2002). For example, Friedman and Forster (2001) motivated theprediction that a promotion focus leads to greater creativity by
294 GRIMM, MARKMAN, MADDOX, AND BALDWIN
assuming that security related concerns associated with a preven-tion focus historically required the individual to focus more onspecific aspects of their local surroundings. A promotion focusdoes not require this attention to detail. They suggest that thisfundamental difference evolved into different processing stylesinduced by regulatory foci. Being in a particular focus promotes ascanning of the environment to find things that are consistent withgoal strivings to increase the likelihood of goal attainment. Aprevention focus supports attention to more concrete details,whereas a promotion focus supports attention to more ideal andmore abstract elements.
Applying our regulatory fit framework, if most tasks are implicitor explicit gains environments, then the evidence found in favor ofa promotion focus supporting more elaborative, flexible, and cre-ative processing is in fact evidence for flexible processing inregulatory fit. It is critical to note that flexible abstract processingis a hallmark of a regulatory fit, not of a promotion focus, just asdetailed local processing is a hallmark of a regulatory mismatch,not of a prevention focus.
In the stereotype threat literature, many of the tasks used requireflexible and elaborative processing, such as the verbal GRE (Steele& Aronson, 1995) and the quantitative GRE (Spencer et al., 1999).Most closely related to the present study, findings by Quinn andSpencer (2001) showed reduced strategy use given stereotypethreat. In that study, women and men completed a series of mathproblems from the SAT while verbalizing their thought processes.Quinn and Spencer coded the number of problem solving strate-gies used by participants. They found that women in the stereotypethreat condition failed to find any strategy 14% of the time,compared with 2% in the control condition. This finding mapsdirectly on to our claim that participants in a regulatory mismatch(i.e., negative stereotype in a gains task) will display less flexibleprocessing or rule testing than will participants in a regulatorymatch or stereotype fit (i.e., positive or neutral stereotype in agains task).
To analyze our data from the classification task and test forevidence that flexibility is the mechanism responsible for oureffects, we turn to decision-bound modeling (Ashby & Maddox,1993) to uncover the strategies used by participants to classifylines. We use models to determine whether more participants in astereotype fit than participants in a stereotype mismatch find anduse the correct rule to classify the stimuli. Finding this correct rulerequires participants to test and discard simpler rules and to thenexpand their problem space to test rules that use two dimensions.There is an established literature suggesting that people start withsimple unidimensional rules and change to more complex rules inmost classification tasks (Bruner, Goodnow, & Austin, 1956).Following Maddox et al. (2006), we hypothesize that participantsstart with simple unidimensional rules to classify the stimuli andthen switch to the more complex conjunctive rule on length andorientation that can provide a means to exceed the 90% accuracycriterion. We believe that participants experiencing a stereotype fitwill be more likely to abandon the simple rules in favor of themore complex conjunctive rule.
Experiments 2A and 2B
To summarize our design and predictions, in this study we toldparticipants about gender stereotypes that relate to their perfor-
mance in a perceptual classification task. In Experiment 2A, wetold male and female participants that this classification task is onefor which women have previously been demonstrated to do betterthan do men. In Experiment 2B, we presented participants with theopposite story, so participants were told that men perform betterthan do women at this classification task. In both studies, thenegative task-relevant stereotype was expected to create a preven-tion focus and the positive task-relevant stereotype was expectedto create a promotion focus.
Participants were then given the classification task with a gainsor a losses reward structure. Thus, we predicted that participantswith a negative task-relevant stereotype would have a stereotypefit when the task has a losses reward structure, so they shouldperform better and be more likely to find and use the correctclassification rule than when the task has a gains reward structureand the participants have a mismatch. In contrast, we predicted thatparticipants with a positive task-relevant stereotype would have astereotype fit for the gains reward structure and, thus, shouldperform better and be more likely to find and use the correctclassification rule than when they perform the task with a lossesreward structure and when they have a regulatory mismatch.
Method
Participants and design. Eighty undergraduate students (40men and 40 women) at the University of Texas at Austin weregiven $8 for their participation in Experiment 2A, and anothergroup of 80 students (40 men and 40 women) at the University ofTexas at Austin were given $8 for participating in Experiment 2B.Half the men and half the women were randomly assigned to thegains and losses reward structures. Each Experiment had a 2(gender: male, female) � 2 (reward structure: gains, losses) de-sign. Reward structure was manipulated between participants.
Stimuli and stimulus presentation. Participants viewed stimulion a computer screen and were asked to classify a set of items intoone of two categories. The stimuli to be categorized were lines thatvaried across items in their length, orientation, and position withina box on the screen. The stimulus structure is shown in Figures 3and 4. For Category A, there were 24 stimuli sampled from eachof 12 bivariate normal distributions on length and orientation,resulting in 288 stimuli. For Category B, there were 72 stimulisampled from 4 bivariate normal distributions on length and ori-entation, resulting in 288 stimuli. The position dimension wassampled independently of length and orientation for each category:Category A had a univariate normal distribution, with a mean of253 pixels and a standard deviation of 75, and Category B had aunivariate normal distribution, with a mean of 397 pixels and astandard deviation of 75.2 The lines were presented inside a black650 pixel � 650 pixel box, centered vertically, and were randomlyordered for each participant in each block. There were 48 trials ineach block, and there were 12 blocks.
The stimuli were generated such that use of the position on thescreen, the orientation of the line, or the length of the line toclassify the stimuli results in 83% accuracy for a block of trials.
2 By independently sampling position, we were able to make positionespecially salient to ensure that our participants would start with a simple,unidimensional rule.
295STEREOTYPE THREAT AS REGULATORY MISMATCH

For example, Figure 3 shows the stimulus space and the set ofitems. Each of the three possible dimensions (length, orientation,and position) is represented; each point is a specific line stimulus.This stimulus space is divided by a plane representing a decisioncriterion set by position. A participant using this decision boundwould classify all stimuli falling above the bound in Category Aand all stimuli falling below the bound in Category B. Theseunidimensional rules are fairly easy to verbalize and are salient toparticipants (Maddox et al., 2006). However, in this example, theuse of a position decision criterion only allows for 83% correctclassification.
There is an optimal decision bound for this task that, if used,yields 100% accuracy on the task. This decision criterion requiresa rule that takes into account both length and orientation. This ruleis as follows: If the length is long and the orientation is steep, thenrespond Category A; otherwise, respond Category B (please seeFigure 4 for a graphical representation of this rule). For partici-pants to perform well in the task, they need to abandon the use ofeasier unidimensional rules in favor of the more complex conjunc-tive one. This switch requires cognitive flexibility.3
Materials and procedure. As for Experiment 1, participantswere tested in individual cubicles in a room with approximatelythe same number of men and women. Participants first completedthe RFQ, the PSWQ, and the BAI. At the beginning of theclassification task, participants were told that their job was to learnto classify items into two categories. Following the questionnaires,to induce a stereotype, we had our participants in Experiment 2Aread, “This is an experiment testing sex differences in spatialabilities. Previous research has shown that women perform betterthan men on tests of spatial ability.” Thus, women in this task havea positive task-relevant stereotype and men have a negative task-relevant stereotype.
In Experiment 2B, all participants read, “This is an experimenttesting sex differences in spatial abilities. Previous research hasshown that men perform better than women on tests of spatialability.” This primes men with a positive task-relevant stereotypeand women with a negative task-relevant stereotype. Participantsin both experiments read text on the screen requiring them to note
their gender by pressing F for female and M for male to advancein the computer task.
In the gains version of each experiment, participants were toldthat the group assigned the positive stereotype tended to earn morethan 86 points per block, which is equivalent to the 90% correctcriterion (correct on 43 of 48 trials) and that the other group tendedto earn fewer. In the losses version, participants were told that thegroup assigned the positive stereotype tended to lose less than 58points per block, which is again equivalent to the 90% criterion(correct on 43 of 48 trials) and that the other group tended to losemore. Next, we asked participants to rate the following: “How welldo you think you will perform in this task on a scale of 1 to 9,where 1 � very bad and 9 � very good?” “How much do you likethe task? (1 � not at all, 9 � very much)?” and “How motivatedare you to do well on the task (1 � not at all and 9 � verymotivated)?” Then, participants took the PANAS to get a measureof their positive and negative affect prior to completing the clas-sification task.
We used the same progress meter and stimulus presentation boxfrom Experiment 1. Because a different number of points wereavailable, in the gains condition the 90% criterion line was labeled86 points. For participants in the losses task, the bonus criterionwas labeled �58 points.
Each participant completed 12 blocks of trials with 48 trials. Foreach trial, the stimulus was displayed until the participant re-sponded “A” or “B.” Following feedback, the stimulus displaydisappeared for 250 ms for the intertrial-interval. The point meteralways remained visible.
After the classification task, participants completed a final set ofquestionnaires. Participants completed the PANAS for a measureof positive and negative affect after the classification task. Partic-ipants were also asked to rate how well they believed they per-
3 It is important to note that it is possible to use a conjunctive rule onlength and orientation and not have perfect task performance. Participantsmay set a rule using both dimensions but will not do so with a high levelof precision. This form of the rule is known as a suboptimal rule on lengthand orientation.
Figure 3. Stimulus space used in Experiments 2A and 2B, with a unidi-mensional rule on position represented. If using this rule, a participantwould classify all stimuli above the plane in Category A and all stimulibelow the plane in Category B. However, this would give only 83%accuracy. Circles represent Category A items, and plus signs representCategory B items.
Figure 4. Stimulus space with correct conjunctive rule on length andorientation dimensions represented. Circles represent Category A items,and plus signs represent Category B items.
296 GRIMM, MARKMAN, MADDOX, AND BALDWIN
formed overall, how well they performed relative to men, and howwell they performed relative to women.
Results
To test our hypotheses, we performed two different sets ofanalyses. First, we analyzed the accuracy data to determine howthe interaction of reward structure and gender influenced a basicperformance metric. We computed the first block that each par-ticipant met or exceeded the criterion (90% correct) and theaverage accuracy for each participant in each block of trials.Second, we used quantitative models to examine the strategiesused by participants to learn the task. By identifying the strategieslikely to be implemented by participants, we are able to makeclaims about the processes used during the perceptual classifica-tion learning task and the possible mechanisms of stereotype fit.Third, we consider the influence of chronic regulatory focus andother possible mediators.
Behavioral data and stereotype fit. To test the interaction ofgender and reward structure across experiments, we analyzed thefirst block participants reached or exceeded the criterion with anANOVA, using experiment (2A, 2B), gender (male, female), andreward structure (gains, losses) as the between-participants factors.Any participant who failed to meet the criterion during the exper-iment was coded as a 13. This was done because this wasthe minimum value possible for a participant who had not met thecriterion during the course of the 12 block experiment. Thisanalysis revealed a significant three-way interaction among exper-iment, gender, and reward structure, F(1, 152) � 7.39, MSE �12.3, p � .05. To examine this three-way interaction, we lookedfor our predicted two-way interaction between gender and rewardstructure within each experiment. For Experiment 2A, an ANOVAwith gender (male, female) and reward structure (Gains, Losses)revealed the predicted interaction, F(1, 152) � 4.56, MSE � 12.3,p � .05. For Experiment 2B, an ANOVA with gender (male,female) and reward structure (gains, losses) revealed the predictedinteraction, F(1, 152) � 2.98, MSE � 12.3, p � .08, �p
2 � .03.Within each of these interactions, we examined group differ-
ences, using independent samples t tests. For Experiment 2A, menin the losses condition exceeded the criterion sooner (after 3.65blocks on average) than did men in the gains condition (after 5.2blocks on average). This difference is nonsignificant, t(38) � 1.51,p � .07, d � .49. Women in the gains condition exceeded thecriterion sooner (after 4.9 blocks on average) than did women inthe losses condition (after 6.85 blocks on average), t(38) � 1.92,p � .05 (one tailed). For Experiment 2B, men in the gainscondition exceeded the criterion sooner (after 4.8 blocks on aver-age) than did men in the losses condition (after 7.15 blocks onaverage), t(38) � 1.91, p � .05 (one tailed). Women in the lossescondition exceeded the criterion sooner (after 6.25 blocks onaverage) than did women in the gains condition (after 6.8 blockson average), but this difference is not statistically reliable.
Next, although the preceding analyses focus on a global perfor-mance metric, this metric does not allow us to take advantage ofthe correlations that exist in our accuracy data over time. Eachparticipant has a score for each of the 12 blocks of trials. To takeadvantage of these correlations across time, we performed a dis-criminant function analysis. This analysis creates a linear discrimi-nant function that distinguishes the groups on the basis of their
data over time. That is, a function was generated with the accuracydata from the 12 blocks as continuous predictor variables, onevariable representing each block of trials. Next, we used Bayes’srule and the discriminant function to predict to which experimentalgroup each participant belonged. We then tested to see whether thepredictions were significantly better than chance assignment ofparticipants to groups. If the predictions are above chance, then ourgroups differed significantly when the pattern of their accuracydata over the course of the experiment is taken into account.
First, we modeled the performance of participants in a stereo-type fit and those in a mismatch. The model correctly classified70% of the participants into these two groups in Experiment 2Aand correctly classified 67.5% of the participants in Experiment2B; both classifications are significantly greater than chance ( p �.05; chance classification is .5 because there are two groups).4
Looking within gender for each experiment, we tested whether themodel could correctly classify gains and losses participants betterthan chance. In Experiment 2A, the model correctly classified menand women into gains and losses tasks 75% and 70% of the time,respectively, both significantly greater than chance ( p � .05). InExperiment 2B, the model correctly classified men and womeninto gains and losses tasks 85% and 67.5% of the time, respec-tively, both significantly greater than chance ( p � .05).
The reason for the good performance of the models is obviouswhen the overall patterns in the data are considered (see Figure 5).As predicted, for Experiment 2A, men in the losses task performedbetter than did men in the gains task and, in fact, were moreaccurate in all 12 experimental blocks, and women in the gainstask outperformed women in the losses task and were more accu-rate on 10 of the 12 blocks (both significant by binomial sign tests,p � .05). Similarly, as predicted, for the gains task, womenoutperformed men on 9 of the 12 blocks of trials and performedequally well on one block, and for the losses task, men outper-formed women on every block (both significant for binomial signtests, p � .05).
For Experiment 2B, the pattern reverses. As predicted, menin the gains task performed better than did men in the lossestask in 11 of the 12 experimental blocks, and women in thelosses task outperformed women in the gains task and obtainedhigher accuracy on 8 of the 12 blocks (male data significantwith a binomial sign test, p � .05; female data pattern criticalto modeling is obvious in the first four blocks). Again aspredicted, for the gains task, men performed better than womenon all 12 blocks of trials, and for the losses task, womenperformed better than men on all 12 blocks of trials (bothsignificant for binomial sign tests, p � .05).
Strategy use and stereotype fit. To test for specific strategy useby participants, we fit a series of decision-bound models to the datafrom each participant for each block (Ashby & Maddox, 1993;
4 If we use all four groups of participants in each experiment in the samediscriminant function analysis, the model correctly classified 56.3% and45% of the participants in Experiments 2A and 2B, respectively, bothsignificantly greater than chance ( p � .05).
297STEREOTYPE THREAT AS REGULATORY MISMATCH

Maddox & Ashby, 1993).5 The models used provided a goodaccount of our data.6 The model parameters were estimated withmaximum likelihood (Ashby, 1992). We found the best fittingmodel with Akaike information criterion � 2r � 2lnL (Akaike,1974; Takane & Shibayama, 1992), where r is the number ofparameters in the model and lnL is the log likelihood of the modelgiven the data. This criterion allows us to assess the goodness-of-fit of models that differ in the number of free parameters and selectthe model that provides the most parsimonious account of the data(i.e., the model with the smallest Akaike information criterionvalue).
For Experiment 2A, Figure 6 (Panel A) displays the proportionof data sets best fit by a conjunctive rule model for men in thegains and losses classification tasks separately by block. Becausemen in the losses task are in a stereotype fit relative to men in thegains task, we predict that a larger proportion of data sets of menin the losses task will be best fit by a conjunctive rule model. Thispattern held in 10 of the 12 blocks of trials (significant based on asign test) and was significant (based on binomial tests) in Blocks7, 8, 9, 10, and 11 ( p � .05). The opposite pattern was predictedfor women. Specifically, women in the gains task are in a stereo-type fit and should be more likely to use a conjunctive rule then arewomen in the losses task who are in a regulatory mismatch. Thispattern held in 10 of the 12 blocks of trials (significant based on asign test) and was significant (based on binomial tests) in Blocks2, 3, 4, 5, 6, 7, 8, 9, 10, and 11 ( p � .05; see Figure 6, Panel B).
5 The unidimensional model on position assumes that the participantused a criterion on position and put all of the lines to the left in onecategory and all of the lines to the right in the other category. Theunidimensional model on orientation assumes that the participant’s crite-rion involved one response for shallow lines and another response for steeplines. The unidimensional model on length assumes one response for shortlines and another response for long lines. Each of these unidimensionalmodels contains two free parameters: one decision criterion and one noiseparameter. The conjunctive model assumes that the participant used lengthand orientation. We fit two different conjunctive models. First, we fit anoptimal model that assumes the participant used the optimal criterion onboth length and orientation. This model only has one free noise parameter.Second, we fit a suboptimal model that assumes that the participant usedcriteria on both length and orientation, but these criteria were not optimal.Therefore, this model has three free parameters: one for the length crite-rion, one for the orientation criterion, and one for the noise parameter.
6 The suboptimal conjunctive model accounted for 91% and 89% of thetotal category responses in Experiments 2A and 2B, respectively. For bothexperiments, the unidimensional rules on length and orientation were rarelyused by participants. Based on Akaike information criterion, the unidimen-sional length and orientation models best fit the data 5% and 17% of thetime, respectively. In contrast, the unidimensional position rule best fit the data30% or more overall for each of the experimental groups. The conjunctivemodel fit over 60% of the data in the final block of trials for all groups inExperiment 2A and over 45% of the data in Experiment 2B. The remainingmodel discussions focus on the conjunctive model fits.
Figure 5. Proportion correct across blocks for men and women in the gains and losses tasks in Experiments2A (A and B, respectively) and 2B (C and D, respectively).
298 GRIMM, MARKMAN, MADDOX, AND BALDWIN
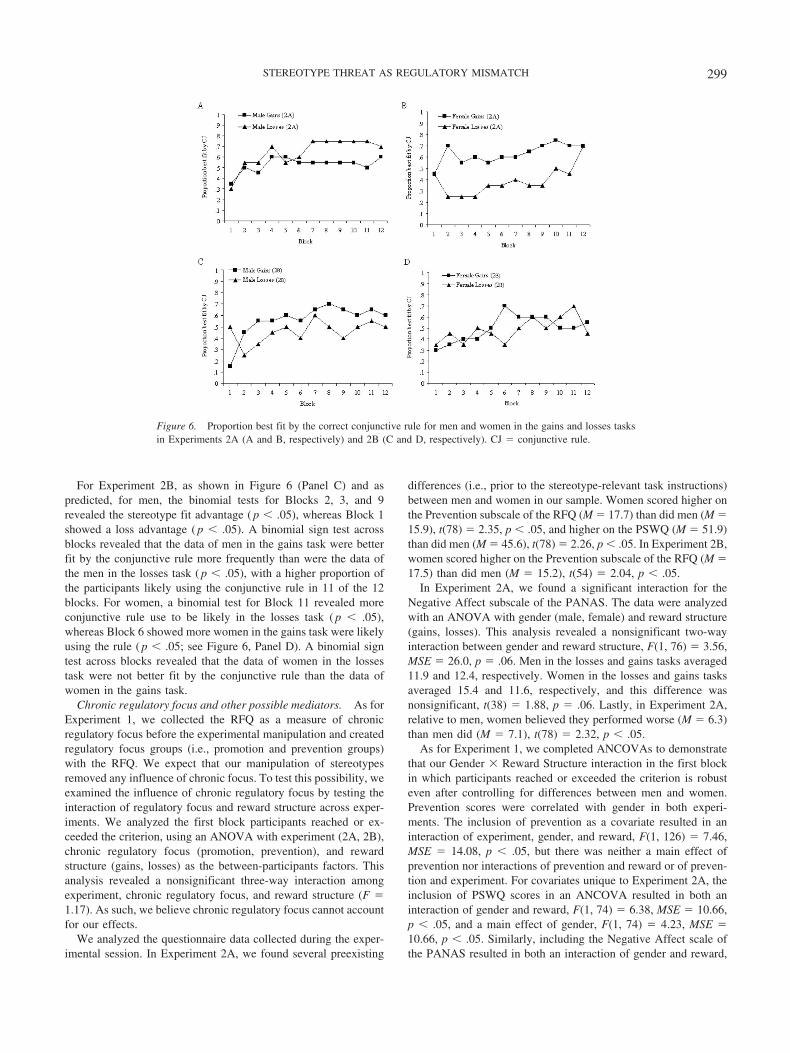
For Experiment 2B, as shown in Figure 6 (Panel C) and aspredicted, for men, the binomial tests for Blocks 2, 3, and 9revealed the stereotype fit advantage ( p � .05), whereas Block 1showed a loss advantage ( p � .05). A binomial sign test acrossblocks revealed that the data of men in the gains task were betterfit by the conjunctive rule more frequently than were the data ofthe men in the losses task ( p � .05), with a higher proportion ofthe participants likely using the conjunctive rule in 11 of the 12blocks. For women, a binomial test for Block 11 revealed moreconjunctive rule use to be likely in the losses task ( p � .05),whereas Block 6 showed more women in the gains task were likelyusing the rule ( p � .05; see Figure 6, Panel D). A binomial signtest across blocks revealed that the data of women in the lossestask were not better fit by the conjunctive rule than the data ofwomen in the gains task.
Chronic regulatory focus and other possible mediators. As forExperiment 1, we collected the RFQ as a measure of chronicregulatory focus before the experimental manipulation and createdregulatory focus groups (i.e., promotion and prevention groups)with the RFQ. We expect that our manipulation of stereotypesremoved any influence of chronic focus. To test this possibility, weexamined the influence of chronic regulatory focus by testing theinteraction of regulatory focus and reward structure across exper-iments. We analyzed the first block participants reached or ex-ceeded the criterion, using an ANOVA with experiment (2A, 2B),chronic regulatory focus (promotion, prevention), and rewardstructure (gains, losses) as the between-participants factors. Thisanalysis revealed a nonsignificant three-way interaction amongexperiment, chronic regulatory focus, and reward structure (F �1.17). As such, we believe chronic regulatory focus cannot accountfor our effects.
We analyzed the questionnaire data collected during the exper-imental session. In Experiment 2A, we found several preexisting
differences (i.e., prior to the stereotype-relevant task instructions)between men and women in our sample. Women scored higher onthe Prevention subscale of the RFQ (M � 17.7) than did men (M �15.9), t(78) � 2.35, p � .05, and higher on the PSWQ (M � 51.9)than did men (M � 45.6), t(78) � 2.26, p � .05. In Experiment 2B,women scored higher on the Prevention subscale of the RFQ (M �17.5) than did men (M � 15.2), t(54) � 2.04, p � .05.
In Experiment 2A, we found a significant interaction for theNegative Affect subscale of the PANAS. The data were analyzedwith an ANOVA with gender (male, female) and reward structure(gains, losses). This analysis revealed a nonsignificant two-wayinteraction between gender and reward structure, F(1, 76) � 3.56,MSE � 26.0, p � .06. Men in the losses and gains tasks averaged11.9 and 12.4, respectively. Women in the losses and gains tasksaveraged 15.4 and 11.6, respectively, and this difference wasnonsignificant, t(38) � 1.88, p � .06. Lastly, in Experiment 2A,relative to men, women believed they performed worse (M � 6.3)than men did (M � 7.1), t(78) � 2.32, p � .05.
As for Experiment 1, we completed ANCOVAs to demonstratethat our Gender � Reward Structure interaction in the first blockin which participants reached or exceeded the criterion is robusteven after controlling for differences between men and women.Prevention scores were correlated with gender in both experi-ments. The inclusion of prevention as a covariate resulted in aninteraction of experiment, gender, and reward, F(1, 126) � 7.46,MSE � 14.08, p � .05, but there was neither a main effect ofprevention nor interactions of prevention and reward or of preven-tion and experiment. For covariates unique to Experiment 2A, theinclusion of PSWQ scores in an ANCOVA resulted in both aninteraction of gender and reward, F(1, 74) � 6.38, MSE � 10.66,p � .05, and a main effect of gender, F(1, 74) � 4.23, MSE �10.66, p � .05. Similarly, including the Negative Affect scale ofthe PANAS resulted in both an interaction of gender and reward,
Figure 6. Proportion best fit by the correct conjunctive rule for men and women in the gains and losses tasksin Experiments 2A (A and B, respectively) and 2B (C and D, respectively). CJ � conjunctive rule.
299STEREOTYPE THREAT AS REGULATORY MISMATCH

F(1, 74) � 6.34, MSE � 10.64, p � .05, and a main effect ofgender, F(1, 74) � 3.91, MSE � 10.64, p � .05. Lastly, whenperformance expectation scores were used in an ANCOVA, therewas interaction of gender and reward, F(1, 74) � 4.27, MSE �10.12, p � .05. There were no covariates unique to Experiment 2B.
These analyses demonstrate that our Gender � Reward Struc-ture interaction is robust, even after controlling for preexistingdifferences between men and women. Likewise, positive affect didnot influence our effects. Furthermore, as for Experiment 1, per-formance expectations did not drive our effects. Women expectedto perform equally well in both Experiment 2A (M � 6.2) and 2B(M � 6.3), as did men (M � 6.7 and M � 6.5, respectively),despite performance differences. As such, our stereotype manipu-lation was not just influencing performance expectations, whichthen produced our effects.
Discussion
Using a primed stereotype, we found that women and menresponded differently to the gains and losses reward structures ina classification task, using task accuracy and proportion of partic-ipants reaching the task criterion. In this set of experiments, weexpected to replicate our results from Experiment 1 in a differentdomain, using primed stereotypes instead of chronic stereotypes.We also predicted stereotype threat-consistent effects for the gainsstructure. We found results consistent with our interpretation of thestereotype threat literature and stereotype fit.
We found the predicted three-way interaction among experi-ment, gender, and reward structure for the first block participantsreached the accuracy criterion. Furthermore, using discriminantfunction analysis, we showed that participants’ accuracy profileover blocks predicted their group membership. This analysis re-vealed that our groups differed significantly across time. In Ex-periment 2A, women (given a positive stereotype) outperformedmen (given a negative stereotype) in the gains version of the task.In Experiment 2B, we reversed this pattern of data in all 12experimental blocks by switching the gender stereotype. Theopposite is true for the losses reward structure. In Experiment2A, as predicted, men outperformed women on all 12 blocks oftrials. Men have a stereotype fit in the losses task. In Experi-ment 2B, again when we switched the stereotype, we com-pletely reversed the effect. Women performed better than mendid on all 12 blocks of trials. Lastly, our data analytic modelsdemonstrate that the better task performance corresponded tomore flexible strategy use.
General Discussion
In two experiments, we found results consistent with our inter-pretation of the stereotype threat literature and our concept ofstereotype fit. On the basis of the prior work by Maddox et al.(2006), we predicted that individuals experiencing a regulatory fitwould perform better in the tasks than would participants in aregulatory mismatch. Like Seibt and Forster (2004), we argue thatpriming a negative stereotype induces a prevention focus, whereaspriming a positive stereotype induces a promotion focus. Partici-pants completed GRE math problems in Experiment 1 and arule-based perceptual classification task in Experiments 2A and2B. Further, our participants completed a gains version of each
task, on which they gained points for correct responses, or a lossesversion of each task, on which they lost points for correct re-sponses. For the gains version of the task, we predicted thatparticipants with a positive stereotype would be experiencing astereotype fit, whereas participants with a negative stereotypewould be experiencing a regulatory mismatch. We predicted theopposite would be true for the losses version of the task.
We suggest that most experimental tasks are gains environments(either implicitly or explicitly). As such, we expected to replicatestereotype threat effects in the gains versions of our tasks. UsingGRE math problems (Experiment 1) and a classification task(Experiment 2A and 2B), we find the classic stereotype threateffect in the gains task. Women performed worse than did men onGRE math problems in Experiment 1. In Experiment 2, whenwomen were primed with a task-relevant positive stereotype andmen were primed with a task-relevant negative stereotype, womenoutperformed men in 9 of the 12 blocks (Experiment 2A). How-ever, when we switched the valence of the stereotypes applied togender, we got the predicted performance reversal: Men outper-formed women in all 12 blocks of trials (Experiment 2B).
We have further evidence for stereotype fit with the data fromthe losses versions of our tasks. Now, unlike the gains versions,participants with negative task-relevant stereotypes are experienc-ing a stereotype fit. In Experiment 1, women in the losses GRE testperformed better than did women in the gains GRE test, whichcoincidentally completely removed the performance differencebetween women and men in the gains GRE test. In Experiment 2,men in Experiment 2A and women in Experiment 2B experienceda stereotype fit in the losses task. In Experiment 2A, men outper-formed women in all 12 blocks in the losses task, and in Experi-ment 2B, women outperformed men in all 12 blocks of trials in thelosses task.
Across these two experiments, we have replicated our findingsusing different domains, math and classification learning, andobtained the same results with chronic and primed stereotypes. Ourother goal was to uncover a possible mechanism behind ourstereotype fit effects. One possibility is the ability to think moreflexibly when in a stereotype fit.
In Experiment 1, our participants completed math problemsfrom the GRE. One could argue that participants need to be ableto think flexibly in order to solve these difficult problems.Although this intuitively sounds correct, like many tasks used inpsychology, this is a very complicated task that is not very wellunderstood. It is not clear exactly what processes individuals use tosolve problems and whether there is a consistent way these prob-lems are approached across people.
To test our flexibility hypothesis, in Experiment 2, participantscompleted a classification task in which they learned to classifylines that varied in their length, orientation, and position. Partici-pants could achieve perfect task performance if they learned toclassify the lines with a conjunctive rule on both length andorientation dimensions. To meet the learning criterion, participantsneeded to switch from using the easier and more obvious unidi-mensional rules to the more complex conjunctive rule. This ruleswitching requires the participant to flexibly work in the rulespace.
The modeling results support the flexibility hypothesis. In Ex-periment 2A, the female data in the gains task are more consistentwith the use of conjunctive rules than are the data in the losses
300 GRIMM, MARKMAN, MADDOX, AND BALDWIN

task. The reverse was true for men: The data in the losses task weremore consistent with conjunctive rule use than were the data in thegains task. As predicted, in Experiment 2B, the male data for thegains task were more consistent with conjunctive rule use thanwere the data for the losses task. For women, the modeling did notreveal likely differences in conjunctive rule application duringclassification learning. Although not ideal, we believe this resultshould be considered in the context of the rest of our strong resultsin support of stereotype fit.
We are excited about this line of work and hope that otherresearchers will join us to start investigating different possiblemechanisms for stereotype fit. We present the flexibility hypoth-esis as one possibility. This hypothesis is consistent with otherwork on regulatory focus (Friedman and Forster, 2001; Forster andHiggins, 2005) and regulatory fit (Grimm et al., 2008; Maddox etal., 2006). Furthermore, in the regulatory fit literature, we haveevidence that effects reverse when we use an information-integration category structure. Learning this type of category struc-ture is hindered by flexible processing (Grimm et al., 2008).
On the basis of our questionnaire data, we believe that positiveor negative affect, worry, anxiety, chronic regulatory focus, orperformance ratings cannot account for our effects. Althoughchronic focus may be important, in our studies, the situationalcontext (e.g., the math test in Experiment 1 and the overt primes inExperiment 2) overrides the chronic focus state. Similarly, onemight argue that our manipulation of stereotype threat in Experi-ment 2 created more performance expectancies than stereotypethreat and that these expectancies are creating our effects. How-ever, in Experiments 1 and 2, participants expected to performequally well but performed better or worse than expected based ontheir experimental condition.
We realize our findings go against most of the literature onpositive affect. Positive affect has been linked both with a promo-tion focus (Higgins, 1997) and with creativity (Isen, Johnson,Mertz, & Robinson, 1985). A promotion focus induces an attemptto approach positive end states. If an end state is achieved, theindividual will feel happiness, whereas failure will lead to sadness.As above, we argue positive affect may be a hallmark of aregulatory fit and not a promotion focus. This claim is supportedby work demonstrating that people feel better when they are in aregulatory fit (Camacho, Higgins, & Luger, 2003; Higgins, 2000)and by research demonstrating similar neural mechanisms forpositive affect, creativity (Ashby, Isen, & Turken, 1999), andflexibility in our category learning task (Maddox & Ashby, 2004).Furthermore, directly examining the connection between regula-tory fit and creativity, Markman et al. (2007) manipulated regula-tory focus and tested participants using the Remote AssociatesTest, which is the measure of creativity used in the positive affectstudy by Ashby et al. (1999). Markman et al. (2007) found fitparticipants solved more problems than did mismatch participants.We believe more work needs to be done to assess the exactrelationship between regulatory fit and positive affect.
Theoretical Implications
Our results have theoretical, methodological, and practical im-plications for the study of stereotype threat and cognition moregenerally. Theoretically, we hope cross-disciplinary work like thiswill lead to further research on the influence of motivation on
cognitive processing. For example, one such variable, self-construal, has been linked to regulatory focus (Lee, Aaker, &Gardner, 2000) and to stereotype threat (Marx, Stapel, & Muller,2005). By studying the relationships between these and otherindividual differences, researchers may be able to posit similarmechanisms. Of particular interest to us at present is the relation-ship that testosterone may play, given work by Josephs and col-leagues (Josephs, Newman, Brown, & Beer, 2003) demonstratingthe moderating influence of testosterone in stereotype threat andthe intersection between our work and work by Beilock and hercolleagues (Beilock & Carr, 2005; Beilock et al., 2006; Beilock,Kulp, Holt, & Carr, 2004). Beilock’s research demonstrates therole of working memory in producing stereotype threat effects forproceduralized tasks. In tasks that are well learned, Beilock et al.(2004) argued that stereotype threat and situational pressure situ-ations use similar mechanisms to produce performance decre-ments. Like choking under pressure, stereotype threat inducesexplicit monitoring of performance that hurts tasks that are autom-atized. We are investigating whether a working memory accountcan explain our regulatory fit effects. That is, whether workingmemory constraints are different for regulatory matches and mis-matches.
Furthermore, the relationship between positive affect and regu-latory fit suggests that it will be important to assess the influenceof stereotype fit on creativity. Our research suggests that placingindividuals with negative stereotypes in a losses task will producemore creative performance than placing those individuals in agains task. As in the regulatory fit literature, these individualsshould feel better in a fit and feel like they can process informationmore fluently (Lee & Aaker, 2004).
Methodological Implications
Methodologically, there are a host of individual difference vari-ables that could benefit from the use of well understood tasks fromcognitive psychology (Narvaez & Markman, 2006). For example,self-construal has been studied in the domain of casual induction(Kim, Grimm, & Markman, 2007). This is a domain with arigorous mathematical definition for what it might mean to besensitive to the presence or absence of causes. In our task, we usedmathematical models to characterize performance. These modelsallow us to be more confident about what participants are actuallydoing in the service of completing our task.
Practical Implications
Practically, our work suggests a way around stereotype threat.We suggest that there are two ways to influence stereotype fit toimprove performance: changing the regulatory focus induced andchanging the reward structure of the task. Some manipulations ofstereotype threat, like same-gender versus mixed-gender testingsituations (Inzlicht & Ben-Zeev, 2003), may be inducing regula-tory focus states by highlighting stereotype relevance in the mixedenvironment. We join a group of researchers already working onways to eradicate stereotype threat by providing obvious situa-tional attributions for performance decrements (Brown & Josephs,1999; Johns, Schmader, & Martens, 2005) or by reducing anxiety(Cohen, Garcia, Apfel, & Master, 2006). For example, Brown andJosephs (1999) examined the influence of providing an external
301STEREOTYPE THREAT AS REGULATORY MISMATCH

handicap. In Study 2, half of the participants were told that theycould not complete practice math problems prior to a test becauseof computer failure. Women in this condition performed betterthan did control women. Using a more direct manipulation, Johnset al. (2005) taught a group of women about stereotype threat andfound that math performance increased for this group. In a similarstudy, Cohen et al. (2006) improved performance by Black stu-dents by reducing stress with self-affirmation techniques.
We do want to be very clear about the implications for changingthe reward structure of testing situations for stigmatized individ-uals. We are not advocating punishment of stigmatized populationsto improve performance. Clearly, like the classic Yerkes–Dodsonarousal function, there are extreme implementations of our ap-proach that would surely hurt performance. A serious losses situ-ation, like a threat of punishment, would be expected to impactcognitive processing and swamp any effects of regulatory fit. Webelieve that our effects appear because the reward is directly linkedto task performance and is relatively mild. These mild losses (andmild gains) allow for the expression of regulatory fit in a way thateither extreme may not.
Conclusions
By elaborating on the observation by Seibt and Forster (2004),we demonstrate that it is possible to change relatively minoraspects of the task environment to get large differences in perfor-mance. This suggests that it is possible to reverse the negativeeffects of negative stereotypes by changing small task character-istics. Performing well in a domain typically associated with anegative stereotype for one’s group may be an excellent first stepin curbing performance decrements caused by negative stereotypeencounters.
References
Aaker, J. L., & Lee, A. Y. (2006). Understanding regulatory fit. Journal ofMarketing Research, 43, 15–19.
Akaike, H. (1974). A new look at the statistical model identification.Transactions on Automatic Control, 19, 716–723.
Aronson, J., Lustina, M. J., Good, C., Keough, K., & Steele, C. M. (1999).When White men can’t do math: Necessary and sufficient factors instereotype threat. Journal of Experimental Social Psychology, 35,29–46.
Ashby, F. G. (Ed.), (1992). Multidimensional models of categorization.Hillsdale, NJ: Erlbaum.
Ashby, F. G., Isen, A. M., & Turken, U. (1999). A neuropsychologicaltheory of positive affect and its influence on cognition. PsychologicalReview, 106, 529–550.
Ashby, F. G., & Maddox, W. T. (1993). Relations between prototype,exemplar, and decision bound models of categorization. Journal ofMathematical Psychology, 37, 372–400.
Bargh, J. A., Chen, M., & Burrows, L. (1996). Automaticity of socialbehavior: Direct effects of trait construct and stereotype activation onaction. Journal of Personality and Social Psychology, 71, 230–244.
Beck, A. T., Epstein, N., Brown, G., & Steer, R. A. (1988). An inventoryfor measuring clinical anxiety: Psychometric properties. Journal ofConsulting and Clinical Psychology, 56, 893–897.
Beilock, S. L., & Carr, T. H. (2005). When high-powered people fail:Working memory and “choking under pressure” in math. PsychologicalScience, 16, 101–105.
Beilock, S. L., Jellison, W. A., Rydell, R. J., McConnell, A. R., & Carr,
T. H. (2006). On the causal mechanisms of stereotype threat: Can skillsthat don’t rely heavily on working memory still be threatened? Person-ality and Social Psychology Bulletin, 32, 1059–1071.
Beilock, S. L., Kulp, C. A., Holt, L. E., & Carr, T. H. (2004). More on thefragility of performance: Choking under pressure in mathematical prob-lem solving. Journal of Experimental Psychology: General, 133, 584–600.
Ben-Zeev, T., Fein, S., & Inzlicht, M. (2005). Arousal and stereotypethreat. Journal of Experimental Social Psychology, 41(2), 174–181.
Brehm, J. W., & Self, E. A. (1989). The intensity of motivation. AnnualReview of Psychology, 40, 109–131.
Brockner, J., Paruchuri, S., Idson, L. C., & Higgins, E. T. (2002). Regu-latory focus and the probability estimates of conjunctive and disjunctiveevents. Organizational Behavior and Human Decision Processes, 87,5–24.
Brown, R. P., & Josephs, R. A. (1999). A burden of proof: Stereotyperelevance and gender differences in math performance. Journal of Per-sonality and Social Psychology, 76, 246–257.
Bruner, J. S., Goodnow, J., & Austin, G. (1956). A study of thinking. NewYork: Wiley.
Cadinu, M., Maass, A., Frigerio, S., Impagliazzo, L., & Latinotti, S. (2003).Stereotype threat: The effect of expectancy on performance. EuropeanJournal of Social Psychology, 33, 267–285.
Cadinu, M., Maass, A., Rosabianca, A., & Kiesner, J. (2005). Why dowomen underperform under stereotype threat? Evidence for the role ofnegative thinking. Psychological Science, 16, 572–578.
Camacho, C. J., Higgins, E. T., & Luger, L. (2003). Moral value transferfrom regulatory fit: What feels right is right and what feels wrong iswrong. Journal of Personality and Social Psychology, 84, 498–510.
Carver, C. S., & Scheier, M. F. (1990). Origins and functions of positiveand negative affect: A control-process view. Psychological Review, 97,19–35.
Cesario, J., Grant, H., & Higgins, E. T. (2004). Regulatory fit and persua-sion: Transfer from “feeling right.” Journal of Personality and SocialPsychology, 86, 388–404.
Cohen, G. L., Garcia, J., Apfel, N., & Master, A. (2006, September 1).Reducing the racial achievement gap: A social-psychological interven-tion. Science, 313, 1307–1310.
Davies, P. G., Spencer, S. J., Quinn, D. M., & Gerhardstein, R. (2002).Consuming images: How television commercials that elicit stereotypethreat can restrain women academically and professionally. Personalityand Social Psychology Bulletin, 28, 1615–1628.
Educational Testing Service. (2004). GRE General Test practice book.Princeton, NJ: Author.
Fein, S., von Hippel, W., & Spencer, S. J. (1999). To stereotype or not tostereotype: Motivation and stereotype activation, application, and inhi-bition. Psychological Inquiry, 10, 49–54.
Forster, J., & Higgins, E. T. (2005). How global versus local perception fitsregulatory focus. Psychological Science, 16, 631–636.
Forster, J., Higgins, E. T., & Idson, L. C. (1998). Approach and avoidancestrength during goal attainment: Regulatory focus and the “goal loomslarger” effect. Journal of Personality and Social Psychology, 75, 1115–1131.
Forster, J., Higgins, E. T., & Strack, F. (2000). When stereotype discon-firmation is a personal threat: How prejudice and prevention focusmoderate incongruency effects. Social Cognition, 18, 178–197.
Friedman, R. S., & Forster, J. (2001). The effects of promotion andprevention cues on creativity. Journal of Personality and Social Psy-chology, 81, 1001–1013.
Grimm, L. R., Markman, A. B., Maddox, W. T., & Baldwin, G. C. (2008).Differential effects of regulatory fit on category learning. Journal ofExperimental Social Psychology, 44, 920–927.
Higgins, E. T. (1987). Self-discrepancy: A theory relating self and affect.Psychological Review, 94, 319–340.
302 GRIMM, MARKMAN, MADDOX, AND BALDWIN

Higgins, E. T. (1997). Beyond pleasure and pain. American Psychologist,52, 1280–1300.
Higgins, E. T. (2000). Making a good decision: Value from fit. AmericanPsychologist, 55, 1217–1230.
Higgins, E. T., Friedman, R. S., Harlow, R. E., Idson, L. C., Ayduk, O. N.,& Taylor, A. (2001). Achievement orientations from subjective historiesof success: Promotion pride versus prevention pride. European Journalof Social Psychology, 31, 3–23.
Higgins, E. T., Idson, L. C., Freitas, A. L., Spiegel, S., & Molden, D. C.(2003). Transfer of value from fit. Journal of Personality and SocialPsychology, 84, 1140–1153.
Inzlicht, M., & Ben-Zeev, T. (2003). Do high-achieving female studentsunderperform in private? The implications of threatening environmentson intellectual processing. Journal of Educational Psychology, 95, 796–805.
Isen, A. M., Johnson, M. M. S., Mertz, E., & Robinson, G. F. (1985). Theinfluence of positive affect on the unusualness of word-associations.Journal of Personality and Social Psychology, 48, 1413–1426.
Johns, M., Schmader, T., & Martens, A. (2005). Knowing is half the battle:Teaching stereotype threat as a means of improving women’s mathperformance. Psychological Science, 16, 175–179.
Josephs, R. A., Newman, M. L., Brown, R. P., & Beer, J. M. (2003). Status,testosterone, and human intellectual performance: Stereotype threat asstatus concern. Psychological Science, 14, 158–163.
Keller, J., & Bless, H. (2006). Regulatory fit and cognitive performance:The interactive effect of chronic and situationally induced self-regulatory mechanisms on test performance. European Journal of SocialPsychology, 36, 393–405.
Keller, J., & Dauenheimer, D. (2003). Stereotype threat in the classroom:Dejection mediates the disrupting threat effect on women’s math per-formance. Personality and Social Psychology Bulletin, 29, 371–381.
Kim, K., Grimm, L. R., & Markman, A. B. (2007). Self-construal and theprocessing of covariation information in causal reasoning. Memory andCognition, 35, 1337–1343.
Kruglanski, A. W. (2006). The nature of fit and the origins of “feelingright”: A goal-systemic perspective. Journal of Marketing Research, 43,11–14.
Lee, A. Y., & Aaker, J. L. (2004). Bringing the frame into focus: Theinfluence of regulatory fit on processing fluency and persuasion. Journalof Personality and Social Psychology, 86, 205–218.
Lee, A. Y., Aaker, J. L., & Gardner, W. L. (2000). The pleasures and painsof distinct self-construals: The role of interdependence in regulatoryfocus. Journal of Personality and Social Psychology, 78, 1122–1134.
Liberman, N., Idson, L. C., Camacho, C. J., & Higgins, E. T. (1999).Promotion and prevention choices between stability and change. Journalof Personality and Social Psychology, 77, 1135–1145.
Liberman, N., Molden, D. C., Idson, L. C., & Higgins, E. T. (2001).Promotion and prevention focus on alternative hypotheses: Implicationsfor attributional functions. Journal of Personality and Social Psychol-ogy, 80, 5–18.
Maddox, W. T., & Ashby, F. G. (1993). Comparing decision bound andexemplar models of categorization. Perception & Psychophysics, 53,49–70.
Maddox, W. T., & Ashby, F. G. (2004). Dissociating explicit andprocedural-learning based systems of perceptual category learning. Be-havioural Processes, 66, 309–332.
Maddox, W. T., Baldwin, G. C., & Markman, A. B. (2006). A test of theregulatory fit hypothesis in perceptual classification learning. Memoryand Cognition, 34, 1377–1397.
Maddox, W. T., Markman, A. B., & Baldwin, G. C. (2007). Using clas-sification to understand the motivation-learning interface. Psychology ofLearning and Motivation, 47, 213–249.
Markman, A. B., Baldwin, G. C., & Maddox, W. (2005). The interaction
of payoff structure and regulatory focus in classification. PsychologicalScience, 16, 852–855.
Markman, A. B., & Brendl, C. M. (2000). The influence of goals on valueand choice. In D. L. Medin (Ed.), The psychology of learning andmotivation (Vol. 39, pp. 97–129) San Diego, CA: Academic Press.
Markman, A. B., Maddox, W. T., & Baldwin, G. C. (2005). The implica-tions of advances in research on motivation for cognitive models. Jour-nal of Experimental and Theoretical Artificial Intelligence, 17, 371–384.
Markman, A. B., Maddox, W. T., & Worthy, D. A. (2006). Choking andexcelling under pressure. Psychological Science, 17, 944–948.
Markman, A. B., Maddox, W. T., Worthy, D. A., & Baldwin, G. C. (2007).Using regulatory focus to explore implicit and explicit processing inconcept learning. Journal of Consciousness Studies, 14, 132–155.
Marx, D. M., Stapel, D. A., & Muller, D. (2005). We can do it: Theinterplay of construal orientation and social comparisons under threat.Journal of Personality and Social Psychology, 88, 432–446.
Meyer, T. J., Miller, M. L., & Metzger, R. L. (1990). Development andvalidation of the Penn State Worry Questionnaire. Behaviour Researchand Therapy, 28, 487–495.
Miller, N. E. (1959). Liberalization of basic S-R concepts: Extensions toconflict behavior, motivation, and social learning. In S. Koch (Ed.),Psychology: A study of a science. General and systematic formulations,learning, and special processes (pp. 196–292). New York: McGrawHill.
Narvaez, L. R., & Markman, A. B. (2006, November). Individual differ-ences lead to increased context sensitivity in causal induction. Postersession presented at the 47th Annual Meeting of the PsychonomicSociety, Houston, TX.
O’Brien, L. T., & Crandall, C. S. (2003). Stereotype threat and arousal:Effects on women’s math performance. Personality and Social Psychol-ogy Bulletin, 29, 782–789.
Quinn, D. M., & Spencer, S. J. (2001). The interference of stereotype threatwith women’s generation of mathematical problem-solving strategies.Journal of Social Issues, 57, 55–71.
Sassenberg, K., Jonas, K. J., Shah, J. Y., & Brazy, P. C. (2007). Why somegroups just feel better: The regulatory fit of group power. Journal ofPersonality and Social Psychology, 92, 249–267.
Schmader, T., & Johns, M. (2003). Converging evidence that stereotypethreat reduces working memory capacity. Journal of Personality andSocial Psychology, 85, 440–452.
Schmader, T., Johns, M., & Barquissau, M. (2004). The costs of acceptinggender differences: The role of stereotype endorsement in women’sexperience in the math domain. Sex Roles, 50, 835–850.
Schmader, T., Johns, M., & Forbes, C. (2008). An integrated process modelof stereotype threat effects on performance. Psychological Review, 115,336–356.
Seibt, B., & Forster, J. (2004). Stereotype threat and performance: Howself-stereotypes influence processing by inducing regulatory foci. Jour-nal of Personality and Social Psychology, 87, 38–56.
Shah, J., Higgins, E. T., & Friedman, R. S. (1998). Performance incentivesand means: How regulatory focus influences goal attainment. Journal ofPersonality and Social Psychology, 74, 285–293.
Shih, M., Pittinsky, T. L., & Ambady, N. (1999). Stereotype susceptibility:Identity salience and shifts in quantitative performance. PsychologicalScience, 10, 80–83.
Sinclair, L., & Kunda, Z. (1999). Reactions to a black professional:Motivated inhibition and activation of conflicting stereotypes. Journal ofPersonality and Social Psychology, 77, 885–904.
Smith, J. L. (2004). Understanding the process of stereotype threat: Areview of mediational variables and new performance goal directions.Educational Psychology Review, 16, 177–206.
Spencer, S. J., Steele, C. M., & Quinn, D. M. (1999). Stereotype threat andwomen’s math performance. Journal of Experimental Social Psychol-ogy, 35, 4–28.
303STEREOTYPE THREAT AS REGULATORY MISMATCH

Steele, C. M., & Aronson, J. (1995). Stereotype threat and the intellectualtest-performance of African-Americans. Journal of Personality and So-cial Psychology, 69, 797–811.
Steele, J., James, J. B., & Barnett, R. C. (2002). Learning in a man’s world:Examining the perceptions of undergraduate women in male-dominatedacademic areas. Psychology of Women Quarterly, 26, 46–50.
Stone, J., Lynch, C. I., Sjomeling, M., & Darley, J. M. (1999). Stereotypethreat effects on Black and White athletic performance. Journal ofPersonality and Social Psychology, 77, 1213–1227.
Takane, Y., & Shibayama, T. (1992). Structure in stimulus identificationdata. Hillsdale, NJ: Erlbaum.
Walton, G. M., & Cohen, G. L. (2003). Stereotype lift. Journal of Exper-imental Social Psychology, 39, 456–467.
Watson, D., Clark, L. A., & Tellegen, A. (1988). Development and vali-dation of belief measures of positive and negative affect: The PANASscales. Journal of Personality and Social Psychology, 54, 1063–1070.
Wheeler, S. C., & Petty, R. E. (2001). The effects of stereotype activation
on behavior: A review of possible mechanisms. Psychological Bulletin,127, 797–826.
Worthy, D. A., Maddox, W. T., & Markman, A. B. (2007). Regulatoryfit effects in a choice task. Psychonomic Bulletin & Review, 14,1125–1132.
Wraga, M., Helt, M., Duncan, L. E., & Jacobs, E. C. (2006, November).Altering test instructions to improve women’s spatial cognition perfor-mance. Poster session presented at the 47th Annual Meeting of thePsychonomic Society, Houston, TX.
Yzerbyt, V. Y., Muller, D., & Judd, C. M. (2004). Adjusting researchers’approach to adjustment: On the use of covariates when testing interac-tions. Journal of Experimental Social Psychology, 40, 424–431.
Received March 19, 2007Revision received July 4, 2008
Accepted July 8, 2008 �
304 GRIMM, MARKMAN, MADDOX, AND BALDWIN