stock guide autumn 2015 - marketsmithstock guide autumn 2015 it has been a tough and volatile market...
TRANSCRIPT

Quarterly Stock GuideAutumn 2015
GAIN BETTER FIELD POSITION WITH THESE THREE SCREENS

Check out our upcoming webinars and our library of archived webinars. Visit Marketsmith.com/webinar
Are you getting all that MarketSmith offers?
Our MarketSmith product coaches host weekly webinars to help you become a more successful and confident investor. From current market analysis to identifying chart patterns, they cover topics relevant for today’s market. Now you can also watch the LIVE webinars from your iPad on-the-go! Simply download the GoToMeeting app from the Apple App Store and enter the webinar ID provided to you after you register for a LIVE webinar on our site.

Stock GuideAutumn 2015
It has been a tough and volatile market over the past couple months. Year-to-date, the Nasdaq is up less than 1% after being up as much as 10% in mid-July. Since then, global economic fears and a potential Fed rate hike contributed to the selloff that caused the Nasdaq to drop 18% from its high on August 24, 2015. Over the last several weeks, the Nasdaq has rallied back up to its 50-day moving average line where it found significant resistance. Leading stocks have followed suit. Now is the time to remain patient and disciplined as investors search for new, emerging leadership amidst a global correction.
In this Autumn Stock Guide, we will highlight the importance of maintaining a routine that can find the leading stocks going forward. Market corrections are constructive. As the market rallies, new leadership emerges and recognizable chart patterns form. Lastly, we will analyze the mechanics of a follow-through day—a key indicator of a potential shift in the market.
The screens in this Autumn Stock Guide sift through the MarketSmith database to find potential future leaders. As the market corrects, it’s important to look for stocks that are outperforming the general market and building sound bases.
Best returns,
Your MarketSmith Team
Don’t miss our webinar series Stay in Step With the Market for insight into current market activity at marketsmith.com/webinar

Stock Guide Chart Legend
1. 5-Year Earnings Growth Rate Over 20% Per Year
2. Company Name
3. Industry Group Classification
4. Datablock Containing the Following Information:
a. Short Interest Value and Percent Change
b. Options Availability and Exchange
c. 50-Day Ratio of Daily Up Volume to Daily Down Volume
d. Ex-Dividend Date
e. Current Yield
5. Ticker or Trading Symbol
6. Top 5 Stocks in Group
7. Primary Exchange
8. Industry Group Relative Strength Rating
9. Common Shares Outstanding (in Millions)
10. Web Address
11. Active stock (NASDAQ only)
12. Floating Supply (in Millions)
13. Datablock Containing the Following Information:
a. 5-Year Earnings Growth Rate
b. Best RS Line & Rating Factor
c. Earnings Per Share Rank (EPS Rank)
d. Current Price/Earnings (P/E) Ratio
e. High and Low Price/Earnings (P/E) Ratios
14. Datablock Containing the Following Information:
a. Debt Percentage
b. New CEO in Last 2 Years
c. Timeliness Rating
d. Accumulation/Distribution Rating
e. SMR Rating
15. Average Daily Volume Over Last 50 Trading Days
16. Datablock Containing the Following Information:
a. Stock Price Relative to Book Value
b. Inventory Turnover
c. Research and Development % of Total Sales
d. Return on Equity Percentage
e. Cash Flow Per Share From Operations
17. Convertible Issues
18. Warrants Outstanding
19. Closing Price
20. % Off High
21. Datablock Containing the Following Information
a. Mutual Fund Sponsorship
b. Bank Sponsorship
c. Management Ownership
d. Alpha
e. Beta
22. Composite Rating
23. Arithmetic Price Scale
24. Key High and Low Price Points
25. 50-Day Moving Average Price Line
26. 200-Day Moving Average Price Line
27. Relative Strength Rating
28. Relative Strength Compared to S&P 500
29. Article in Major Publication
30. *Indicates 2nd Highest Weekly Volume in Last 12 Months
31. *Indicates Highest Weekly Volume in Last Year or Volume 100% or More Above ADV
32. Volume Scale
33. Earnings % Change
34. Qtrly EPS Compared to EPS Same Qtr Last Year (<> denotes pretax, non-recurring items included)
35. Insider Buying/Selling
36. Qtrly Sales Compared to Sales Same Qtr Last Year
37. 50-Day Average Daily Volume
38. High and Low P/E Ratio for the Quarter
39. Dividend Change
40. Security Announcement
41. Cash Dividend for the Quarter
42. *Indicates Earnings Expected to Report Within 4 Weeks
43. *Indicates Earnings Were Reported in Last 2 Weeks
44. Volume Peaks (in Hundreds)
45. Stock Dividend or Split
46. Daily High, Low, and Closing Prices
47. Line Indicates Beginning of Calendar Quarter
48. Indicator for Canadian Dollars
49. Datablock Containing the Following Information:
a. Fiscal Year End
b. Annual Operating Earnings (<> denotes pretax, non-recurring items included)
c. Calendar Year High/Low Prices
d. Earnings Per Share Estimates
e. EPS Estimates % Change
f. Estimate Revision
50. Business Summary
EARNINGS $SALES MIL. $DIVIDEND-PE
17 31AUG
14 28SEP
11 25OCT 9 23
NOV 6 20
DEC 4 18
QTR 1
JAN 10 1 15 29
FEB12 26
MAR12 26
QTR 2
APR 9 23
MAY 7 21
JUN 4 18
QTR 3
JUL 2
XYZ CORP (XYZ) NASDAQ*BLDG-A/C & HEATING PRDS aaon.com
17.1 SHRS / 12.2 FLT / AVG VOL 85,500 $24.13(OH ) -4%
MANUFACTURES HEATING, VENTILATION AND AIR CONDITION EQUIP- MENT FOR THE INDUSTRIAL/CONSTRUCTION/COMMERCIAL MARKETS.
5/10 TO REPURCHASE 5% OF COMMON STOCK OUTSTANDING.
SHORT INT 24.3 DAYS -3%OPTIONS ONUP/DOWN 1.0
CBOE
EX-DIV 6/ 8YIELD 1.5%
GROWTH RATE +31%EARNINGS STAB 13EPS RANK 63PE 16 ( 1.0XS&P)5 YR PE 9- 31
DEBT 0%NEW CEOTIMELINESS B
7/10
ACC/DIST DSMR RATING B
3.50 X BK VALUEINVENTORY TO. 7.5XR&D 13.6%RET ON EQUITY 26%CASH FLOW $2
FUNDS 40%BANKS 8%MGMT 29%ALPHA 0.03BETA 0.98
COMPOSITE RATINGIPO 7/7/07 $ 5.00 (C) (W) 82
EPS DUE 8/10
PRICESCALE
GROUP REL STR 82 RS EPSSmithAO AOS 81 95Watsco WSO 76 82Lennox LII 75 85
EARNINGS HI LO(DEC)$ $04 0.39 14 9
05 0.60 13 906 0.90 19 1107 1.22 23 1608 1.60 23 1209 1.62 22 1410 1.38 EST -15%11 1.62 EST +17%
«
QUARTER ENDED JUN 30, 09 0.43 VS 0.43 0% 68.6 VS 74.8 -8%$ 0.18 13X -- 9X
QUARTER ENDED SEP 30, 09 0.45 VS 0.47 -4% 58.5 VS 79.3 -26% N/A 13X -- 11X
QUARTER ENDED DEC 31, 09 0.36 VS 0.35 +3% 54.2 VS 60.2 -10%$ 0.18 12X -- 11X
QUARTER ENDED MAR 31, 10 0.30 VS 0.39 -23% 49.3 VS 64.0 -23% N/A 14X -- 12X
16
18
20
22
24
400 600 1000
VOLUME(00)
22.32
18.00
20.63
18.49 18.64
22.00
20.72
25.11
21.50
22.41
17704 5376
84
R S LINEVS SP500
CANADIANQTR 4
FORBES06/04/10DIV
INCPSO
2/1
* *
* *
ACTIVE
1 2 3 5 6 8 119 10 13 1514 16 17 18 19 20
21
4 7 12
23
24
25
26
27
28293031
32
33
35 3439 363840 3741
44
42
43
46
47
48
49
50
22
45

Table of ContentsStock Guide Legend . . . . . . . . . . . . . . . . . . . . . . . . . . . . . . . . . . . . . . . . . . . . . . . . . . . . . . . . 2
Market Charts . . . . . . . . . . . . . . . . . . . . . . . . . . . . . . . . . . . . . . . . . . . . . . . . . . . . . . . . . . . . 4
How to Handle Market Corrections . . . . . . . . . . . . . . . . . . . . . . . . . . . . . . . . . . . . . . . . . . . . 5
Autumn 2015 Screens*
RS Line New High 13
Jetblue Airways Corp . . . . . . . . . . . . . . . . . . . . . . . . . . JBLU . . . . . . . . . . . . . . . . . . . . . . . . . . . . . . . 14
Activision Blizzard Inc . . . . . . . . . . . . . . . . . . . . . . . . . .ATVI . . . . . . . . . . . . . . . . . . . . . . . . . . . . . . . 14
Manhattan Associates Inc. . . . . . . . . . . . . . . . . . . . . . . .MANH . . . . . . . . . . . . . . . . . . . . . . . . . . . . . 15
O Reilly Automotive Inc . . . . . . . . . . . . . . . . . . . . . . . .ORLY . . . . . . . . . . . . . . . . . . . . . . . . . . . . . . 15
Cal-Maine Foods Inc . . . . . . . . . . . . . . . . . . . . . . . . . . .CALM . . . . . . . . . . . . . . . . . . . . . . . . . . . . . 16
Total Systems Services . . . . . . . . . . . . . . . . . . . . . . . . . .TSS . . . . . . . . . . . . . . . . . . . . . . . . . . . . . . . . 16
Top EPS Rated Stocks 17
Tesoro Corp . . . . . . . . . . . . . . . . . . . . . . . . . . . . . . . . .TSO . . . . . . . . . . . . . . . . . . . . . . . . . . . . . . . 18
Palo Alto Networks . . . . . . . . . . . . . . . . . . . . . . . . . . . . PANW . . . . . . . . . . . . . . . . . . . . . . . . . . . . . 18
Facebook Inc Cl A . . . . . . . . . . . . . . . . . . . . . . . . . . . . . FB . . . . . . . . . . . . . . . . . . . . . . . . . . . . . . . . . 19
ICON plc. . . . . . . . . . . . . . . . . . . . . . . . . . . . . . . . . . . . ICLR . . . . . . . . . . . . . . . . . . . . . . . . . . . . . . 19
Norwegian Cruise Lne Hld . . . . . . . . . . . . . . . . . . . . . .NCLH . . . . . . . . . . . . . . . . . . . . . . . . . . . . . 20
Alaska Air Group Inc . . . . . . . . . . . . . . . . . . . . . . . . . .ALK . . . . . . . . . . . . . . . . . . . . . . . . . . . . . . . 20
Fastest Growing Companies 21
A M N Healthcare Svcs . . . . . . . . . . . . . . . . . . . . . . . . .AHS . . . . . . . . . . . . . . . . . . . . . . . . . . . . . . . 22
C D W Corp . . . . . . . . . . . . . . . . . . . . . . . . . . . . . . . . .CDW . . . . . . . . . . . . . . . . . . . . . . . . . . . . . . 22
Blackhawk Network Inc . . . . . . . . . . . . . . . . . . . . . . . .HAWK . . . . . . . . . . . . . . . . . . . . . . . . . . . . . 23
Chipotle Mexican Grill . . . . . . . . . . . . . . . . . . . . . . . . .CMG . . . . . . . . . . . . . . . . . . . . . . . . . . . . . . 23
Palo Alto Networks . . . . . . . . . . . . . . . . . . . . . . . . . . . . PANW . . . . . . . . . . . . . . . . . . . . . . . . . . . . . 24
Norwegian Cruise Lne Hld . . . . . . . . . . . . . . . . . . . . . .NCLH . . . . . . . . . . . . . . . . . . . . . . . . . . . . . 24
*All screen results are computer-generated and were run on September 25, 2015.

Autumn 2015marketsmith.com
4 Market Charts
S & P 500 INDEXCLOSE 1931.34
2093.55
2119.59 2125.922134.72 2129.87 2132.82
1820.66
1972.561980.90
2039.69
2067.93
2044.02
1867.01
50 DAY MOVING AVERAGE
200 DAY MOVING AVERAGE
1820
1870
1920
1970
2020
2070
2120
2170
2220
DAILY VOLUME AND 50-DAY AVERAGE DAILY VOLUME LINE
300 M
650 M
1.1 B
1.8 B
251128143117319522824102713271330162195217241026
SEPAUGJULJUNMAYAPRMARFEBJAN 2015DECNOVOCT
NASDAQ COMPOSITECLOSE 4686.50
4810.86 4814.95
5042.14
5119.835164.36
5231.94
4116.60
4547.31 4563.10
4825.93
4888.17 4901.51
4292.15
50 DAY MOVING AVERAGE
200 DAY MOVING AVERAGE
4050
4150
4250
4350
4450
4550
4650
4750
4850
4950
5050
5150
5250
5350
DAILY VOLUME AND 50-DAY AVERAGE DAILY VOLUME LINE
750 M
1.1 B
1.7 B
2.5 B
251128143117319522824102713271330162195217241026
SEPAUGJULJUNMAYAPRMARFEBJAN 2015DECNOVOCT

5
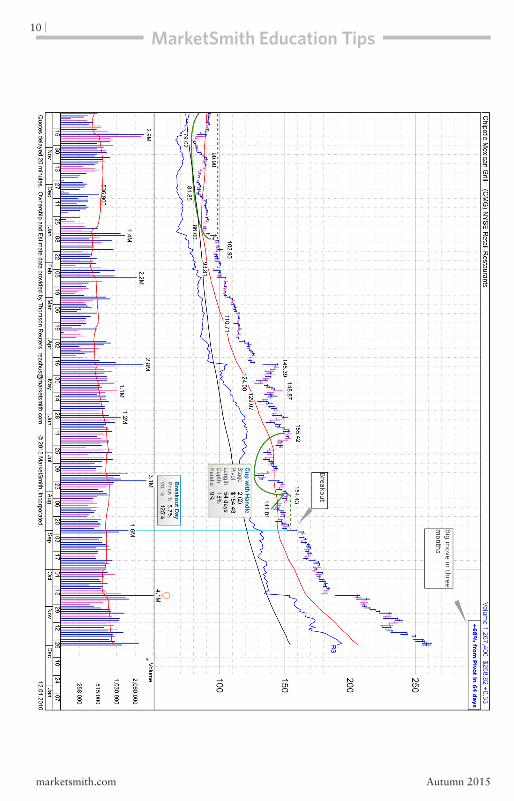
During market corrections, it is easy to tune out and grow disillusioned with the market. However, a market correction is an opportunity to regroup and find the next cycle’s leaders. The big question is how long you should remain on the sidelines during a market correction. If you jump back in too soon, the rally may fade and you’ll lose money. If you hesitate at the beginning of a new bull cycle, opportunities may pass you by. The best method of determining a market shift is by waiting for a confirmation day of institutional participation, a follow-through day (FTD).
After the market has been hitting lows, it will eventually begin to rally. As it rallies, you will want to look for a bullish signal that will alert you that institutions are participating in the current rally. A FTD occurs on Day 4 or later of a rally attempt. The price must be up at least 1.25% on volume that is heavier than the prior day. In addition, there should be leading stocks breaking out of recognizable bases on heavy volume. Remember, a FTD does not mean you should buy just any stock. It gives you the go-ahead to buy high-quality stocks with strong earnings and sales breaking out of sound bases. Some of the best stocks throughout history have had breakouts that coincided with a FTD, so you should be building watch lists of potential leaders during market corrections. That way you’ll be ready when the next bull market arrives.
How to Handle Market Corrections
MarketSmith Education Tips
Autumn 2015 marketsmith.com

Autumn 2015marketsmith.com
MarketSmith Education Tips6

Autumn 2015 marketsmith.com
7MarketSmith Education Tips

Autumn 2015marketsmith.com
8MarketSmith Education Tips

Autumn 2015 marketsmith.com
9MarketSmith Education Tips
Autumn 2015marketsmith.com
MarketSmith Education Tips10

Autumn 2015 marketsmith.com
11
Finding the Next Cycle’s LeadersAs the market corrects, it is common for growth stocks to fall 2 1/2 times the index. Former leading stocks will fall and break through long-term support levels, like the 50- and 200-day moving average lines. Some of them may never rebound and will continue to lag the indices in the future. Determining the future leading stocks requires watching the market action on a daily or weekly basis to find which stocks are handling the correction better than others. Two easy ways are the Relative Strength line and the Relative Strength rating. These two indicators measure the stock’s relative performance versus the general market and the other stocks in the database.
MarketSmith Education Tips

Autumn 2015marketsmith.com
12MarketSmith Education Tips
However, it is not only about relative price strength. Fundamentals may be an indicator of stock price appreciation as well, so investors should focus on companies with strong earnings and sales growth. An easy way to identify companies with strong earnings is the proprietary EPS Rating that measures earnings growth using the two most recent quarters of earnings growth and the company’s five year growth rate.

Autumn 2015 marketsmith.com
13
Visit marketsmith.com/learn/stockguide to load the criteria for this and other Stock Guide screens directly into your MarketSmith screener.
All screen results are computer-generated and were run on September 25, 2015. This screen can also be found in the community section of marketsmith.com.
RS Line New High
Key divergences are a crucial part of relative strength, especially with abnormal strength on a weak market day.
This screen identifies stocks whose RS Lines are reaching
new highs over the last 52-weeks and is designed to be run
during general market weakness. Stocks that are bucking
the downward pressure may be primed to move significantly
higher once the market pressure alleviates.
Company Name (Symbol) Industry Group RS Rating Page
Jetblue Airways Corp (JBLU) Transportation-Airline 98 14
Activision Blizzard Inc (ATVI) Computer Sftwr-Gaming 97 14
Manhattan Associates Inc (MANH) Computer Sftwr-Enterprse 97 15
O Reilly Automotive Inc (ORLY) Retail/Whlsle-Auto Parts 95 15
Cal-Maine Foods Inc (CALM) Food-Meat Products 95 16
Total Systems Services (TSS) Finance-CrdtCard/PmtPr 95 16

Autumn 2015marketsmith.com
14
*JETBLUE AIRWAYS CORP(JBLU) NASDAQ 314.8 SHRS / 308.5 FLT / AVG VOL7.83MIL $26.66(OH -2%)TRANSPORTATION-AIRLINE jetblue.comPROVIDES POINT-TO-POINT PASSENGER AIRLINE SERVICE TO 87 CITIES IN 27 STATES, PUERTO RICO, VIRGIN ISLANDS
9/14 NAMED PRES ROBIN HAYES TO THE ADDL POST OF CEO, EFFECTIVE 2/16/2015, REPLACING DAVID BARGER WHO WILL RESIGN.
SHORT INT 3.8 DAYS +12%OPTIONS ON AM/MSUP/DOWN 1.3EX-DIVYIELD
GROWTH RATE +30%EARNINGS STAB 26EPS RANK 98PE 20 (1.2XS&P)5 YR PE 10 - 43
DEBT 78%NEW CEO 2/15TIMELINESS AACC/DIST CSMR RATING C
3.17 X BK VALUEINVENTORY TO.123.8XR&D N/ARET ON EQUITY 10%CASH FLOW $1.8
FUNDS 44%BANKS 0%MGMT 1%ALPHA 0.39BETA 1.17
22.40
24.19
9.38
14.13
18.33
16.26 99
QTR 3QTR 2
QTR 1
QTR 4
-O-O-O-O-O-O-O-O-O-O-O-O-O-O-O-O5
10
15
20
25
PRICE SCALE
97COMPOSITE RATING(W)(C)09$ 0.21 $ 7 210 0.31 7 411 0.29 7 312 0.40 6 413 0.52 9 514 0.70 16 715 1.89EST+170% ↑16 2.18EST +15% ↑
EARNINGS (DEC) HI LOAllegiant ALGT 97 98AlaskaAir ALK 97 98Volaris Av VLRS 97 77Skywst SKYW 96 77HawHldgs HA 93 93
GROUP REL STR 99 RS EPS
2511281431173195228241027132713301621952172410SEPAUGJULJUNMAYAPRMARFEBJAN 15DECNOVOCT
EARNINGS $SALES MIL. $DIVIDEND-PE
0.24 VS 0.21 +14%1529 VS 1442 +6%N/A 24X-- 18X
0.26 VS 0.14 +86%1446 VS 1365 +6%N/A 27X-- 17X
0.40 VS 0.02 +19001523 VS 1349 +13%N/A 28X-- 21X
0.44 VS 0.19 +132%1612 VS 1493 +8%N/A 29X-- 17X
EPS DUE*10/23 QUARTER ENDED SEP 30,14 QUARTER ENDED DEC 31,14 QUARTER ENDED MAR 31,15 QUARTER ENDED JUN 30,15
R S LINE VS SP500 VOLUME
4M
7.5M
14.5M
ACTIVISION BLIZZARD INC(ATVI) NASDAQ 729.0 SHRS / 539.5 FLT / AVG VOL10.14MIL $32.06(OH -1%)COMPUTER SFTWR-GAMING activisionblizzard.comPUBLISHES INTERACTIVE ENTERTAINMENT SOFTWARE AND PERIPHERAL PRODUCTS FOR CONSOLES, HAND-HELD DEVICES, AND PCS.
8/15 EXPECTS Q3 2015 EARNINGS OF $0.14 PER DILUTED SHARE ON REVENUES OF $875 MIL.
SHORT INT 6 DAYS +13%OPTIONS ON AM/MSUP/DOWN 2.7EX-DIV 3/26YIELD 0.7%
GROWTH RATE +14%EARNINGS STAB 8EPS RANK 82PE 22 (1.3XS&P)5 YR PE 10 - 22
DEBT 60%NEW CEOTIMELINESS AACC/DIST BSMR RATING A
3.16 X BK VALUEINVENTORY TO. 30.0XR&D 12.9%RET ON EQUITY 15%CASH FLOW $1.94
FUNDS 37%BANKS 1%MGMT 1%ALPHA 0.18BETA 1.09
21.98
23.65 23.69
26.09
17.7318.43
22.28
24.15
25.33
24.04 98
QTR 3QTR 2
QTR 1
QTR 4
-O-O
DIVINC
-O15
20
25
30
35
PRICE SCALE
96COMPOSITE RATING09$ 0.69 $ 13 810 0.79 12 911 0.93 14 1012 1.18 13 1013 0.94 18 1014 1.42 24 1615 1.33EST -6% ↑16 1.56EST +17% ↑
EARNINGS (DEC) HI LOElecArts EA 96 57Nintendo C NTDOY 95 64TakeTwoIS TTWO 90 77NetEase NTES 79 94ShndaG GAME 79 23
GROUP REL STR 92 RS EPS
2511281431173195228241027132713301621952172410SEPAUGJULJUNMAYAPRMARFEBJAN 15DECNOVOCT
EARNINGS $SALES MIL. $DIVIDEND-PE
0.23 VS 0.08 +188%753.0 VS 691.0 +9%N/A 22X-- 18X
0.94 VS 0.79 +19%1575 VS 1518 +4%N/A 19X-- 15X
0.16 VS 0.19 -16%1278 VS 1111 +15%$0.23 17X-- 14X
0.13 VS 0.06 +117%1044 VS 970.0 +8%N/A 19X-- 16X
EPS DUE 11/4 QUARTER ENDED SEP 30,14 QUARTER ENDED DEC 31,14 QUARTER ENDED MAR 31,15 QUARTER ENDED JUN 30,15
R S LINE VS SP500
VOLUME
2.5M
8M
27.5M
RS Line New High

Autumn 2015 marketsmith.com
15
*MANHATTAN ASSOCIATES INC(MANH) NASDAQ 73.4 SHRS / 71.9 FLT / AVG VOL513292 $64.04(OH -8%)COMPUTER SFTWR-ENTERPRSE manh.comDEVELOPS SUPPLY CHAIN MANAGEMENT SOFTWARE FOR MANUFACTURERS, DISTRIBUTORS, RETAILERS AND TRANSPORTATION PROVIDERS.
7/15 RAISED 2015 ADJUSTED EARNINGS GUIDANCE TO $1.40 TO $1.42 PER DILUTED SHARE AND REVS OF $553 MIL TO $558 MIL.
SHORT INT 5.5 DAYS +10%OPTIONS ON AM/PHUP/DOWN 1.0EX-DIVYIELD
GROWTH RATE +29%EARNINGS STAB 4EPS RANK 97PE 48 (2.9XS&P)5 YR PE 15 - 49
DEBT 0%NEW CEOTIMELINESS AACC/DIST DSMR RATING A
24.86 X BK VALUEINVENTORY TO.R&D 9.9%RET ON EQUITY 49%CASH FLOW $1.27
FUNDS 55%BANKS 0%MGMT 1%ALPHA 0.27BETA 1.18
41.3243.20
52.18
55.38
59.98
69.8167.94
31.53
36.75 37.81
42.14
47.18
57.58
50.42
97
QTR 3QTR 2
QTR 1
QTR 4
-O-O-O-O-O-O20
30
40
50
60
70
PRICE SCALE
98COMPOSITE RATING09$ 0.24 $ 6 310 0.40 8 511 0.58 11 712 0.71 16 913 0.92 31 1414 1.16 43 2815 1.41EST +22% ↑16 1.63EST +16% ↑
EARNINGS (DEC) HI LODealerTrac TRAK 96 53Paycm Sftw PAYC 95 99Fleetmatic FLTX 95 99Cvent CVT 95 48Ebix EBIX 94 87
GROUP REL STR 91 RS EPS
2511281431173195228241027132713301621952172410SEPAUGJULJUNMAYAPRMARFEBJAN 15DECNOVOCT
EARNINGS $SALES MIL. $DIVIDEND-PE
0.32 VS 0.26 +23%125.6 VS 107.8 +17%N/A 36X-- 27X
0.30 VS 0.24 +25%130.4 VS 107.6 +21%N/A 39X-- 30X
0.34 VS 0.26 +31%133.5 VS 113.6 +18%N/A 47X-- 34X
0.37 VS 0.29 +28%139.1 VS 122.5 +14%N/A 49X-- 41X
EPS DUE*10/21 QUARTER ENDED SEP 30,14 QUARTER ENDED DEC 31,14 QUARTER ENDED MAR 31,15 QUARTER ENDED JUN 30,15
R S LINE VS SP500
VOLUME
250K
800K
2.5M
*O REILLY AUTOMOTIVE INC(ORLY) NASDAQ 99.4 SHRS / 95.4 FLT / AVG VOL732942 $252.22(OH -2%)RETAIL/WHLSLE-AUTO PARTS oreillyauto.comOPERATES 4,366 AUTOMOTIVE PARTS STORES IN 43 STATES WITH PLANS TO OPEN 205 MORE (5%) IN 2015.
7/15 EXPECTS 2015 CAPITAL EXPENDITURES OF $400 MIL TO $430 MIL.
SHORT INT 8.9 DAYS -1%OPTIONS ON AM/NYUP/DOWN 1.1EX-DIVYIELD
GROWTH RATE +25%EARNINGS STAB 1EPS RANK 96PE 31 (1.9XS&P)5 YR PE 17 - 30
DEBT 69%NEW CEOTIMELINESS AACC/DIST CSMR RATING A
12.11 X BK VALUEINVENTORY TO. 2.9XR&D N/ARET ON EQUITY 39%CASH FLOW $9.59
FUNDS 49%BANKS 1%MGMT 4%ALPHA 0.21BETA 0.99
196.80
214.15
230.77
258.15
146.22
179.00
202.44
226.05
95
QTR 3QTR 2
QTR 1
QTR 4
-O+O
-O-O-O-O-O-O-O-O-O-O-O-O-O120
140
160
180
200
220
240
260
PRICE SCALE
98COMPOSITE RATING09$ 2.23 $ 42 2610 3.05 63 3711 3.81 82 5312 4.75 107 7513 6.03 135 8714 7.34 196 12815 8.91EST +21% ↑16 10.10EST +13% ↓
EARNINGS (DEC) HI LOAutozone AZO 94 89Pep Boys PBY 93 77AdvAutoPrt AAP 92 81MonrMu MNRO 91 70LKQ LKQ 82 85
GROUP REL STR 94 RS EPS
2511281431173195228241027132713301621952172410SEPAUGJULJUNMAYAPRMARFEBJAN 15DECNOVOCT
EARNINGS $SALES MIL. $DIVIDEND-PE
2.06 VS 1.69 +22%1876 VS 1728 +9%N/A 25X-- 22X
1.76 VS 1.40 +26%1764 VS 1621 +9%N/A 28X-- 22X
2.06 VS 1.61 +28%1901 VS 1727 +10%N/A 30X-- 26X
2.29 VS 1.91 +20%2035 VS 1847 +10%N/A 30X-- 27X
EPS DUE*10/22 QUARTER ENDED SEP 30,14 QUARTER ENDED DEC 31,14 QUARTER ENDED MAR 31,15 QUARTER ENDED JUN 30,15
R S LINE VS SP500
VOLUME
300K
650K
1.4M
RS Line New High

Autumn 2015marketsmith.com
16
CAL-MAINE FOODS INC(CALM) NASDAQ 43.7 SHRS / 31.9 FLT / AVG VOL713780 $57.64(OH -5%)FOOD-MEAT PRODUCTS calmainefoods.comPRODUCES SHELL EGGS THAT ARE DISTRIBUTED IN THE SOUTHWEST, SOUTHEAST, MIDWEST AND MID-ATLANTIC REGIONS OF THE U.S.
9/14 CO'S JOINT VENTURE SOUTHWEST SPECIALTY EGGS ACQUIRED EGG-LAND’S BEST, FRANCHISE FOR SOUTHERN CA/NEVADA MARKETS.
SHORT INT 14.4 DAYS +10%OPTIONS ON AM/MSUP/DOWN 1.5EX-DIV 7/30YIELD 2.5%
GROWTH RATE +18%EARNINGS STAB 22EPS RANK 91PE 17 (0.6XS&P)5 YR PE 8 - 22
DEBT 6%NEW CEOTIMELINESS AACC/DIST CSMR RATING A
3.49 X BK VALUEINVENTORY TO. 10.8XR&D N/ARET ON EQUITY 25%CASH FLOW $4.16
FUNDS 40%BANKS 1%MGMT 27%ALPHA 0.15BETA 1.14
48.31
44.46
60.72
57.94
39.50 39.83
34.03
35.75
47.62
44.1393
QTR 3QTR 2
QTR 1
QTR 4
DIVDCR
-O+O
DIVINC
30
40
50
60
PRICE SCALE
99COMPOSITE RATING09$ 1.67 $ 17 810 1.42 19 1311 1.15 18 1312 1.31 23 1713 1.40 30 1914 2.26 48 2415 3.3316 11.83EST+255% ↑
EARNINGS (MAY) HI LOIndst Bach IBA 93 94HormelFds HRL 91 85TysonFds TSN 86 80MarineHrvs MHG 72 18SandrFarms SAFM 38 82
GROUP REL STR 81 RS EPS
2511281431173195228241027132713301621952172410SEPAUGJULJUNMAYAPRMARFEBJAN 15DECNOVOCT
EARNINGS $SALES MIL. $DIVIDEND-PE
0.57 VS 0.18 +217%356.9 VS 319.5 +12%$0.43 21X-- 15X
0.76 VS 0.54 +41%378.6 VS 354.3 +7%$0.38 20X-- 15X
1.05 VS 0.89 +18%437.6 VS 395.5 +11%$0.25 17X-- 12X
0.95 VS 0.65 +46%403.0 VS 371.6 +8%$0.35 20X-- 12X
*EPS DUE 12/23 QUARTER ENDED AUG 31,14 QUARTER ENDED NOV 30,14 QUARTER ENDED FEB 28,15 QUARTER ENDED MAY 31,15
R S LINE VS SP500
VOLUME
250K
600K
1.4M
TOTAL SYSTEM SERVICES(TSS) NYSE 183.9 SHRS / 161.9 FLT / AVG VOL1.32MIL $46.52(OH -4%)FINANCE-CRDTCARD/PMTPR tsys.comPROVIDES ELECTRONIC PAYMENT PROCESSING AND RELATED SERVICES TO FINANCIAL AND NONFINANCIAL INSTITUTIONS
9/15 RECEIVED A CONTRACT FROM METRO BANK TO PROVIDE CREDIT AND DEBIT CARD PORTFOLIOS ON CO'S TS2 PROCESSING PLATFORM.
SHORT INT 3 DAYS +16%OPTIONS ON AM/NYUP/DOWN 1.2EX-DIV 9/15YIELD 0.9%
GROWTH RATE +20%EARNINGS STAB 5EPS RANK 96PE 21 (1.2XS&P)5 YR PE 13 - 21
DEBT 83%NEW CEO 7/14TIMELINESS AACC/DIST CSMR RATING A
4.87 X BK VALUEINVENTORY TO.R&D N/ARET ON EQUITY 22%CASH FLOW $2.8
FUNDS 38%BANKS 9%MGMT 4%ALPHA 0.17BETA 1.07
34.07
39.25
42.1643.00
48.67
28.54
32.06 32.06
41.4242.54
95
QTR 3QTR 2
QTR 1
QTR 4
-O-O-O-O-O-O25
30
35
40
45
50
PRICE SCALE
99COMPOSITE RATING09$ 1.12 $ 17 1110 0.90 17 1311 1.15 20 1512 1.46 25 1913 1.73 33 2114 1.96 34 2715 2.29EST +17% ↑16 2.54EST +11% ↑
EARNINGS (DEC) HI LOPlanetPay PLPM 97 75VantivA VNTV 96 90GlobalPaym GPN 96 86Euronet EEFT 95 94HeartlandP HPY 95 91
GROUP REL STR 88 RS EPS
2511281431173195228241027132713301621952172410SEPAUGJULJUNMAYAPRMARFEBJAN 15DECNOVOCT
EARNINGS $SALES MIL. $DIVIDEND-PE
0.56 VS 0.49 +14%616.9 VS 570.6 +8%$0.10 19X-- 17X
0.58 VS 0.48 +21%635.1 VS 583.1 +9%$0.10 18X-- 16X
0.54 VS 0.38 +42%662.2 VS 592.9 +12%$0.10 20X-- 17X
0.58 VS 0.45 +29%692.7 VS 602.0 +15%$0.10 20X-- 18X
EPS DUE 10/28 QUARTER ENDED SEP 30,14 QUARTER ENDED DEC 31,14 QUARTER ENDED MAR 31,15 QUARTER ENDED JUN 30,15
R S LINE VS SP500
VOLUME
300K
800K
2M
RS Line New High
Autumn 2015 marketsmith.com
17
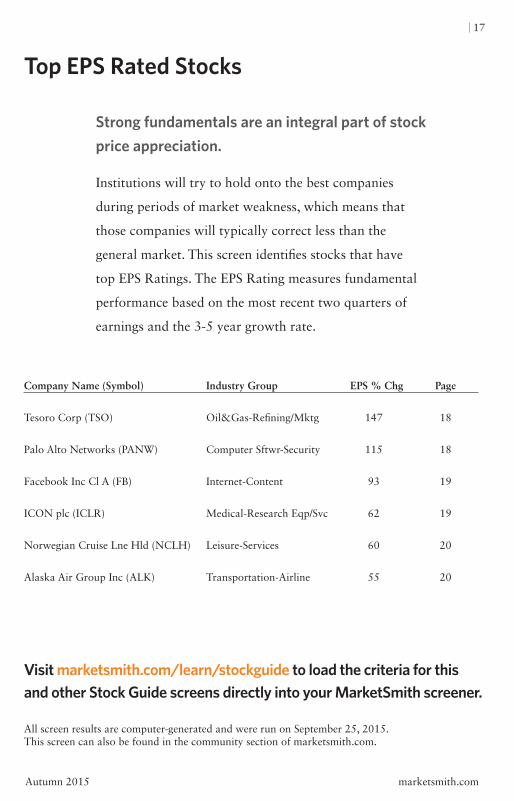
Visit marketsmith.com/learn/stockguide to load the criteria for this and other Stock Guide screens directly into your MarketSmith screener.
All screen results are computer-generated and were run on September 25, 2015. This screen can also be found in the community section of marketsmith.com.
Top EPS Rated Stocks
Strong fundamentals are an integral part of stock price appreciation.
Institutions will try to hold onto the best companies
during periods of market weakness, which means that
those companies will typically correct less than the
general market. This screen identifies stocks that have
top EPS Ratings. The EPS Rating measures fundamental
performance based on the most recent two quarters of
earnings and the 3-5 year growth rate.
Company Name (Symbol) Industry Group EPS % Chg Page
Tesoro Corp (TSO) Oil&Gas-Refining/Mktg 147 18
Palo Alto Networks (PANW) Computer Sftwr-Security 115 18
Facebook Inc Cl A (FB) Internet-Content 93 19
ICON plc (ICLR) Medical-Research Eqp/Svc 62 19
Norwegian Cruise Lne Hld (NCLH) Leisure-Services 60 20
Alaska Air Group Inc (ALK) Transportation-Airline 55 20

Autumn 2015marketsmith.com
18
*TESORO CORP(TSO) NYSE 123.1 SHRS / 121.9 FLT / AVG VOL2.62MIL $101.53(OH -8%)OIL&GAS-REFINING/MKTG tsocorp.comENGAGED IN THE REFINING AND MARKETING OF PETROLEUM PRODUCTS IN WESTERN UNITED STATES.
8/15 UNIT RCVD A CONTRACT FROM CLEARSIGN COMBUSTION CORP TO EVALUATE THE PERFORMANCE OF ITS LOW EMISSIONS DUPLEX TECH.
SHORT INT 3.5 DAYS +28%OPTIONS ON AM/MSUP/DOWN 0.9EX-DIV 8/26YIELD 2.0%
GROWTH RATE +21%EARNINGS STAB 46EPS RANK 94PE 10 (0.6XS&P)5 YR PE 5 - 24
DEBT 96%NEW CEOTIMELINESS AACC/DIST DSMR RATING D
2.72 X BK VALUEINVENTORY TO. 16.2XR&D N/ARET ON EQUITY 21%CASH FLOW $11.86
FUNDS 38%BANKS 1%MGMT 1%ALPHA 0.22BETA 1.02
79.49
94.83 94.71 93.14
104.44
110.74
55.59
69.05
64.16
84.2281.77 82.82
86.32
96
QTR 3QTR 2
QTR 1
QTR 4
-O
DIVINC
-O
DIVINC
40
50
60
70
80
90
100
110
PRICE SCALE
83COMPOSITE RATING(W)09$ -0.70∆ $ 19 1010 -0.28∆ 18 1011 3.97∆ 29 1712 6.51∆ 45 2013 2.80∆ 65 3914 6.92∆ 79 4615 12.84EST +86% ↑16 8.24EST -36% ↑
EARNINGS (DEC) HI LOAlnUSA ALDW 98 51HollyFrnti HFC 94 95AlonUSA ALJ 92 77ValeroEngy VLO 89 97NorthernTi NTI 88 81
GROUP REL STR 57 RS EPS
2511281431173195228241027132713301621952172410SEPAUGJULJUNMAYAPRMARFEBJAN 15DECNOVOCT
EARNINGS $SALES MIL. $DIVIDEND-PE
3.06∆ VS 0.44∆ +595%11151 VS 11241 -1%$0.30 23X-- 20X
1.46∆ VS 0.04∆ +35508445 VS 10116 -17%$0.30 24X-- 12X
0.98∆ VS 0.72∆ +36%6463 VS 9933 -35%$0.43 16X-- 11X
4.62∆ VS 1.70∆ +172%8232 VS 11104 -26%$0.43 13X-- 12X
EPS DUE 10/30 QUARTER ENDED SEP 30,14 QUARTER ENDED DEC 31,14 QUARTER ENDED MAR 31,15 QUARTER ENDED JUN 30,15
R S LINE VS SP500 VOLUME
1M
2M
4.5M
*PALO ALTO NETWORKS(PANW) NYSE 85.0 SHRS / 70.6 FLT / AVG VOL1.63MIL $180.81(OH -9%)COMPUTER SFTWR-SECURITY paloaltonetworks.comPROVIDES NETWORK SECURITY INFRASTRUCTURE PRODUCTS FOR ENTERPRISES, SERVICE PROVIDERS AND GOVERNMENT ENTITIES.
9/15 EXPECTS Q1 FY16 NON-GAAP EARNINGS OF $0.31 TO $0.32 PER DILUTED SHARE ON REVENUES OF $280 MIL TO $284 MIL.
SHORT INT 2.2 DAYS -10%OPTIONS ONUP/DOWN 1.0EX-DIVYIELD
GROWTH RATE +71%EARNINGS STAB 15EPS RANK 99PE 213 (12.9XS&P)5 YR PE 168 - 726
DEBT 0%NEW CEOTIMELINESS AACC/DIST DSMR RATING B
30.61 X BK VALUEINVENTORY TO.R&D 20.0%RET ON EQUITY 16%CASH FLOW $1.44
FUNDS 39%BANKS 1%MGMT 8%ALPHA 0.26BETA 1
149.35 150.44
158.24
185.00
200.55
87.83
134.07
167.82
140.39
96
QTR 3QTR 2
QTR 1
QTR 4
-O-O-O-O-O-O-O-O-O-O-O-O-O-O-O-O-O-O-O-O-O-O-O-O-O-O60
80
100
120
140
160
180
200
PRICE SCALE
99COMPOSITE RATING$42.00IPO 7/20/1209$ -0.28 $10 -0.3111 -0.1912 0.22 72 4713 0.24 62 3914 0.40 128 5415 0.8616 1.70EST +98% ↓
EARNINGS (JUL) HI LOImperva IMPV 98 46Fortinet FTNT 97 50Proofpoint PFPT 92 19Digimrc DMRC 92 5Verisign VRSN 91 89
GROUP REL STR 84 RS EPS
2511281431173195228241027132713301621952172410SEPAUGJULJUNMAYAPRMARFEBJAN 15DECNOVOCT
EARNINGS $SALES MIL. $DIVIDEND-PE
0.15 VS 0.08 +87%192.4 VS 128.2 +50%N/A 271X-- 214X
0.19 VS 0.10 +90%217.7 VS 141.1 +54%N/A 280X-- 235X
0.23 VS 0.11 +109%234.2 VS 150.7 +55%N/A 311X-- 239X
0.28 VS 0.11 +155%283.9 VS 178.2 +59%N/A 295X-- 236X
EPS DUE 11/24 QUARTER ENDED OCT 31,14 QUARTER ENDED JAN 31,15 QUARTER ENDED APR 30,15 QUARTER ENDED JUL 31,15
R S LINE VS SP500 VOLUME
500K
1.3M
3.5M
Top EPS Rated Stocks

Autumn 2015 marketsmith.com
19
*FACEBOOK INC CL A(FB ) NASDAQ 2,259.7 SHRS / 2,169.3 FLT / AVG VOL34.73MIL $92.77(OH -6%)INTERNET-CONTENT facebook.comPROVIDES A SOCIAL NETWORKING PLATFORM ENABLING MEMBERS TO STAY CONNECTED WITH FRIENDS AND FAMILY VIA FACEBOOK.COM.
2/15 ACQUIRED 21-BUILDING, 56-ACRE INDUSTRIAL PARK FROM PROLOGIS.
SHORT INT 1.1 DAYS +37%OPTIONS ONUP/DOWN 1.3EX-DIVYIELD
GROWTH RATE +56%EARNINGS STAB 19EPS RANK 94PE 49 (3.0XS&P)5 YR PE 34 - 91
DEBT 0%NEW CEOTIMELINESS AACC/DIST CSMR RATING A
6.96 X BK VALUEINVENTORY TO.R&D 21.4%RET ON EQUITY 18%CASH FLOW $2.03
FUNDS 35%BANKS 1%MGMT 4%ALPHA 0.08BETA 1.06
81.1682.17
86.07 85.59
99.24
70.32
72.5173.54 73.45
76.79
72.00
88
QTR 3QTR 2
QTR 1
QTR 4
-O-O-O-O-O-O-O-O-O-O-O-O-O-O-O-O
FORTUNE 6/3/15
-O-O-O-O-O-O-O-O-O-O-O-O-O-O-O-O-O-O-O-O-O-O-O-O60
70
80
90
100
PRICE SCALE
99COMPOSITE RATING$38.00IPO 5/18/1209$ 0.11 $10 0.2811 0.5012 0.53 45 1713 0.91 58 2214 1.76 82 5115 2.07EST +18% ↑16 2.75EST +33% ↑
EARNINGS (DEC) HI LOAutobytl ABTL 96 94Zillow C Z 94 2Google A GOOGL 92 85Google C GOOG 90 85Monster MWW 89 55
GROUP REL STR 92 RS EPS
2511281431173195228241027132713301621952172410SEPAUGJULJUNMAYAPRMARFEBJAN 15DECNOVOCT
EARNINGS $SALES MIL. $DIVIDEND-PE
0.43 VS 0.27 +59%3203 VS 2016 +59%N/A 62X-- 51X
0.54 VS 0.32 +69%3851 VS 2585 +49%N/A 59X-- 47X
0.42 VS 0.35 +20%3544 VS 2502 +42%N/A 52X-- 42X
0.50 VS 0.43 +16%4042 VS 2910 +39%N/A 49X-- 42X
EPS DUE 10/28 QUARTER ENDED SEP 30,14 QUARTER ENDED DEC 31,14 QUARTER ENDED MAR 31,15 QUARTER ENDED JUN 30,15
R S LINE VS SP500
VOLUME
10M
25M
*ICON PLC(ICLR) NASDAQ 59.9 SHRS / 56.9 FLT / AVG VOL642160 $74.19(OH -11%)MEDICAL-RESEARCH EQP/SVC iconus.comIRISH PROVIDER OF CONTRACT CLINICAL RESEARCH SERVICES TO THE PHARMACEUTICAL, BIOTECHNOLOGY AND MEDICAL DEVICE INDUSTRIES
7/15 RAISED 2015 EARNINGS GUIDANCE TO $3.90 TO $4 PER SHARE AND LOWERED REVS GUIDANCE TO $1,570 MIL TO $1,600 MIL.
SHORT INT 4.6 DAYS +4%OPTIONS ONUP/DOWN 0.8EX-DIVYIELD
GROWTH RATE +27%EARNINGS STAB 60EPS RANK 95PE 21 (1.2XS&P)5 YR PE 13 - 56
DEBT 0%NEW CEOTIMELINESS AACC/DIST CSMR RATING A
4.35 X BK VALUEINVENTORY TO.R&D N/ARET ON EQUITY 19%CASH FLOW $3.89
FUNDS 43%BANKS 1%MGMT 5%ALPHA 0.13BETA 0.84
59.81
56.17
72.4071.19
69.4171.80
84.14
50.62 49.75
66.21
62.3664.27
71.08
91
QTR 3QTR 2
QTR 1
QTR 4
40
50
60
70
80
PRICE SCALE
90COMPOSITE RATING09$ 1.53 $ 26 1210 1.44 30 1811 0.52 26 1512 1.00 28 1613 1.77 44 2614 2.87 59 3515 3.93EST +37% ↑16 4.69EST +19% ↓
EARNINGS (DEC) HI LOPraHealth PRAH 98 80INC Resrch INCR 97 84NanoStrgTe NSTG 94 7WuXiPharm WX 91 70QuintilsTr Q 90 88
GROUP REL STR 52 RS EPS
2511281431173195228241027132713301621952172410SEPAUGJULJUNMAYAPRMARFEBJAN 15DECNOVOCT
EARNINGS $SALES MIL. $DIVIDEND-PE
0.79 VS 0.45 +76%387.6 VS 339.8 +14%N/A 26X-- 23X
0.87 VS 0.53 +64%390.1 VS 345.2 +13%N/A 27X-- 20X
0.86 VS 0.57 +51%388.2 VS 349.6 +11%N/A 25X-- 20X
0.95 VS 0.64 +48%388.7 VS 376.0 +3%N/A 25X-- 20X
EPS DUE*10/22 QUARTER ENDED SEP 30,14 QUARTER ENDED DEC 31,14 QUARTER ENDED MAR 31,15 QUARTER ENDED JUN 30,15
R S LINE VS SP500
VOLUME
188K
450K
1.1M
Top EPS Rated Stocks

Autumn 2015marketsmith.com
20
*NORWEGIAN CRUISE LNE HLD(NCLH) NASDAQ 229.1 SHRS / 176.4 FLT / AVG VOL1.47MIL $60.68(OH -4%)LEISURE-SERVICES ncl.comOPERATES A CRUISE LINE SERVICING NORTH AMERICA, EUROPE, CENTRAL AND SOUTH AMERICA AND THE CARIBBEAN.
3/15 NAMED WALTER L. REVELL CHRMN, EFFECTIVE IMMEDIATELY.
SHORT INT 3.1 DAYS +11%OPTIONS ONUP/DOWN 0.7EX-DIVYIELD
GROWTH RATE +82%EARNINGS STAB 38EPS RANK 95PE 24 (1.4XS&P)5 YR PE 16 - 37
DEBT 159%NEW CEO 1/15TIMELINESS AACC/DIST DSMR RATING A
3.74 X BK VALUEINVENTORY TO. 62.3XR&D N/ARET ON EQUITY 16%CASH FLOW $3.44
FUNDS 33%BANKS 1%MGMT 1%ALPHA 0.21BETA 1.03
48.16
55.3857.55
63.22
30.44
42.54
48.03
53.68 54.48
50.00
94
QTR 3QTR 2
QTR 1
QTR 4
-OSO
PSO
-OSO
PSO
-OSO
PSO
-O20
30
40
50
60
PRICE SCALE
98COMPOSITE RATING$19.00IPO 1/18/1309$ 0.33 $10 0.1111 0.6212 0.8413 1.41 35 2414 2.26 48 2915 2.88EST +27% ↑16 3.88EST +35% ↑
EARNINGS (DEC) HI LOSteinerLei STNR 96 77PlanetFitn PLNT 94 70RoyalCarib RCL 93 76VailResort MTN 89 81CarnivalPl CUK 89 70
GROUP REL STR 71 RS EPS
2511281431173195228241027132713301621952172410SEPAUGJULJUNMAYAPRMARFEBJAN 15DECNOVOCT
EARNINGS $SALES MIL. $DIVIDEND-PE
1.10 VS 0.86 +28%907.0 VS 797.9 +14%N/A 21X-- 17X
0.36 VS 0.19 +89%788.9 VS 600.4 +31%N/A 23X-- 16X
0.27 VS 0.23 +17%938.2 VS 664.0 +41%N/A 24X-- 19X
0.75 VS 0.58 +29%1085 VS 765.9 +42%N/A 25X-- 21X
EPS DUE 10/29 QUARTER ENDED SEP 30,14 QUARTER ENDED DEC 31,14 QUARTER ENDED MAR 31,15 QUARTER ENDED JUN 30,15
R S LINE VS SP500
VOLUME
300K
800K
2.5M
*ALASKA AIR GROUP INC(ALK) NYSE 127.3 SHRS / 126.0 FLT / AVG VOL1.36MIL $80.70(OH -2%)TRANSPORTATION-AIRLINE alaskaair.comPROVIDES AIRLINE PASSENGER TRANSPORTATION VIA ITS ALASKA AIRLINES AND HORIZON AIR SUBSIDIARIES.
8/15 TO REPURCHASE UP TO $1 BIL WORTH OF COMMON STOCK OUTSTANDING.
SHORT INT 7.3 DAYS +6%OPTIONS ON AM/MSUP/DOWN 1.0EX-DIV 8/14YIELD 1.0%
GROWTH RATE +25%EARNINGS STAB 10EPS RANK 98PE 15 (0.9XS&P)5 YR PE 7 - 18
DEBT 32%NEW CEOTIMELINESS AACC/DIST CSMR RATING B
4.68 X BK VALUEINVENTORY TO. 91.0XR&D N/ARET ON EQUITY 27%CASH FLOW $6.58
FUNDS 45%BANKS 0%MGMT 1%ALPHA 0.25BETA 0.95
59.97
71.4069.42 68.68 68.27
82.15 82.78
40.69
54.54
61.35 61.54
58.15 58.92
97
QTR 3QTR 2
QTR 1
QTR 4
-O-O-O-O-O-O-O-O-O-O-O-O-O-O-O
DIVINC
-O-O-O-O30
40
50
60
70
80
90
PRICE SCALE
98COMPOSITE RATING09$ 0.62 $ 9 310 1.79 14 711 1.96 19 1212 2.37 22 1513 2.70 39 2114 4.18 60 3615 6.36EST +52% ↑16 6.89EST +8% ↑
EARNINGS (DEC) HI LOJetblue JBLU 99 98Allegiant ALGT 97 98Volaris Av VLRS 97 77Skywst SKYW 96 77HawHldgs HA 93 93
GROUP REL STR 99 RS EPS
2511281431173195228241027132713301621952172410SEPAUGJULJUNMAYAPRMARFEBJAN 15DECNOVOCT
EARNINGS $SALES MIL. $DIVIDEND-PE
1.47 VS 1.11 +32%1465 VS 1557 -6%$0.13 16X-- 12X
0.94 VS 0.55 +71%1306 VS 1210 +8%$0.13 16X-- 12X
1.12 VS 0.64 +75%1269 VS 1222 +4%$0.20 17X-- 15X
1.76 VS 1.13 +56%1437 VS 1375 +5%$0.20 16X-- 12X
EPS DUE*10/23 QUARTER ENDED SEP 30,14 QUARTER ENDED DEC 31,14 QUARTER ENDED MAR 31,15 QUARTER ENDED JUN 30,15
R S LINE VS SP500 VOLUME
600K
1.1M
2M
Top EPS Rated Stocks

Autumn 2015 marketsmith.com
21
Visit marketsmith.com/learn/stockguide to load the criteria for this and other Stock Guide screens directly into your MarketSmith screener.
All screen results are computer-generated and were run on September 25, 2015. This screen can also be found in the community section of marketsmith.com.
Fastest Growing Companies
The best stock ideas are those have been increasing earnings over a period of time and are projecting to increase their earnings into the future as well.
At this point, the general market is the only factor
preventing the stocks from breaking out and appreciating
in price. This screen looks for solid earnings performance
over the last year and a half, while ensuring future growth.
These stocks have the potential to be leaders if and when
the market stops correcting.
Composite Company Name (Symbol) Industry Group Rating Page
A M N Healthcare Svcs (AHS) Comml Svcs-Staffing 99 22
C D W Corp (CDW) Computer-Tech Services 99 22
Blackhawk Network Inc (HAWK) Finance-CrdtCard/PmtPr 98 23
Chipotle Mexican Grill (CMG) Retail-Restaurants 98 23
Palo Alto Networks (PANW) Computer Sftwr-Security 115 24
Norwegian Cruise Lne Hld (NCLH) Leisure-Services 60 24

Autumn 2015marketsmith.com
22
*A M N HEALTHCARE SVCS(AHS) NYSE 47.7 SHRS / 45.7 FLT / AVG VOL742166 $35.92(OH -4%)COMML SVCS-STAFFING amnhealthcare.comOFFERS PERMANENT AND TEMPORARY STAFFING OF PHYSICIANS AND NURSES TO HEALTHCARE FACILITIES IN THE U.S.
9/15 ACQUIRED THE FIRST STRING HEALTHCARE, PROVIDES INTERIM STAFFING/PLACEMENT OF NURSE LEADERS, FOR $6.5 MIL IN CASH.
SHORT INT 2.6 DAYS +25%OPTIONS ON AM/NYUP/DOWN 1.1EX-DIVYIELD
GROWTH RATE +127%EARNINGS STAB 85EPS RANK 99PE 33 (1.8XS&P)5 YR PE 15 - 887
DEBT 53%NEW CEOTIMELINESS AACC/DIST ESMR RATING B
5.85 X BK VALUEINVENTORY TO.R&D N/ARET ON EQUITY 16%CASH FLOW $1.16
FUNDS 54%BANKS 0%MGMT 3%ALPHA 0.34BETA 0.9
17.98
20.33
23.23
32.53
37.25
15.62
17.92
22.65
28.52 28.3929.20
98
QTR 3QTR 2
QTR 1
QTR 4
-O-O-O-O-O-O-O-O-O-O-O-O-O-O-O-O10
20
30
40
PRICE SCALE
98COMPOSITE RATING(C)09$ 0.31 $ 11 410 0.01 10 411 0.16∆ 9 312 0.45 12 313 0.70 16 1014 0.80 20 1015 1.23EST +54% ↓16 1.45EST +18% ↓
EARNINGS (DEC) HI LOCrossCntry CCRN 96 77Kforce KFRC 93 94KornFerry KFY 89 83OnAssgnmt ASGN 89 81BarrettBus BBSI 85 79
GROUP REL STR 54 RS EPS
2511281431173195228241027132713301621952172410SEPAUGJULJUNMAYAPRMARFEBJAN 15DECNOVOCT
EARNINGS $SALES MIL. $DIVIDEND-PE
0.18 VS 0.18 0%264.6 VS 257.1 +3%N/A 22X-- 17X
0.23 VS 0.17 +35%279.7 VS 248.7 +12%N/A 27X-- 20X
0.30 VS 0.18 +67%327.5 VS 240.9 +36%N/A 30X-- 24X
0.38 VS 0.21 +81%350.1 VS 250.9 +40%N/A 35X-- 25X
EPS DUE 10/30 QUARTER ENDED SEP 30,14 QUARTER ENDED DEC 31,14 QUARTER ENDED MAR 31,15 QUARTER ENDED JUN 30,15
R S LINE VS SP500
VOLUME
148K
400K
1.1M
*C D W CORP(CDW) NASDAQ 170.2 SHRS / 115.7 FLT / AVG VOL1.18MIL $40.78(OH -2%)COMPUTER-TECH SERVICES cdw.comPROVIDES INFORMATION TECHNOLOGY HARDWARE AND SOFTWARE PRODUCTS TO CUSTOMERS IN THE U.S. AND CANADA.
11/14 TO OFFER $575 MIL OF 5.50% SENIOR NOTES DUE 2024.
SHORT INT 1.7 DAYS -8%OPTIONS ONUP/DOWN 1.3EX-DIV 8/21YIELD 0.7%
GROWTH RATE +152%EARNINGS STAB 99EPS RANK 93PE 16 (0.9XS&P)5 YR PE 12 - 17
DEBT 339%NEW CEOTIMELINESS AACC/DIST BSMR RATING B
7.15 X BK VALUEINVENTORY TO. 33.6XR&D N/ARET ON EQUITY 50%CASH FLOW $2.69
FUNDS 35%BANKS 0%MGMT 2%ALPHA 0.12BETA 0.88
35.56
36.92
38.4439.32
37.51
40.01
27.59
32.5733.21
35.15
33.01
35.62
92
QTR 3QTR 2
QTR 1
QTR 4
-OPSO
SO
SO
PSO
+O+O-OPSO
SO
25
30
35
40
PRICE SCALE
99COMPOSITE RATING(C)$17.00IPO 6/27/1309$10 -0.17 $11 0.1012 1.4413 1.83 24 1714 2.37 36 2215 2.90EST +22% ↑16 3.24EST +12% ↑
EARNINGS (DEC) HI LOGlobant GLOB 99 73Hackett HCKT 98 95Sapiens SPNS 97 87NCIA NCIT 97 58TylerTech TYL 96 97
GROUP REL STR 91 RS EPS
2511281431173195228241027132713301621952172410SEPAUGJULJUNMAYAPRMARFEBJAN 15DECNOVOCT
EARNINGS $SALES MIL. $DIVIDEND-PE
0.64 VS 0.50 +28%3266 VS 2864 +14%$0.04 17X-- 14X
0.59 VS 0.54 +9%3050 VS 2713 +12%$0.07 16X-- 13X
0.56 VS 0.47 +19%2755 VS 2652 +4%$0.07 16X-- 14X
0.81 VS 0.67 +21%3314 VS 3106 +7%$0.07 17X-- 14X
EPS DUE 11/6 QUARTER ENDED SEP 30,14 QUARTER ENDED DEC 31,14 QUARTER ENDED MAR 31,15 QUARTER ENDED JUN 30,15
R S LINE VS SP500
VOLUME
250K
650K
1.7M
Fastest Growing Companies

Autumn 2015 marketsmith.com
23Fastest Growing Companies*BLACKHAWK NETWORK INC(HAWK) NASDAQ 54.6 SHRS / 53.5 FLT / AVG VOL518384 $42.41(OH -8%)FINANCE-CRDTCARD/PMTPR blackhawknetwork.comOPERATES A PAYMENT NETWORK IN THE U.S. AND 21 OTHER COUNTRIES TO OFFER GIFT CARDS AND OTHER PREPAID PRODUCTS
6/15 ACQUIRED ACHIEVERS CORP, A PROVIDER OF EMPLOYEE RECOGNITION AND REWARDS SOLUTIONS, FOR $110 MIL.
SHORT INT 2.6 DAYS +12%OPTIONS ONUP/DOWN 0.9EX-DIVYIELD
GROWTH RATE +44%EARNINGS STAB 23EPS RANK 98PE 22 (1.3XS&P)5 YR PE 18 - 31
DEBT 129%NEW CEOTIMELINESS AACC/DIST CSMR RATING A
7.99 X BK VALUEINVENTORY TO.R&D N/ARET ON EQUITY 35%CASH FLOW $2.65
FUNDS 34%BANKS 0%MGMT 1%ALPHA 0.15BETA 0.99
35.54
40.51 40.57
38.70
46.13
34.43
33.00 32.98
34.87
33.58 33.5990
QTR 3QTR 2
QTR 1
QTR 4
-O-O25
30
35
40
45
PRICE SCALE
98COMPOSITE RATING$23.00IPO 4/19/1309$ 0.52 $10 0.3711 0.7012 0.9813 1.13 27 2014 1.63 40 2115 2.27EST +39% ↑16 2.61EST +15% ↑
EARNINGS (DEC) HI LOPlanetPay PLPM 97 75VantivA VNTV 96 90GlobalPaym GPN 96 86TotalSys TSS 95 96Euronet EEFT 95 94
GROUP REL STR 88 RS EPS
2511281431173195228241027132713301621952172410SEPAUGJULJUNMAYAPRMARFEBJAN 15DECNOVOCT
EARNINGS $SALES MIL. $DIVIDEND-PE
0.09 VS 0.08 +12%269.0 VS 206.0 +31%N/A 26X-- 20X
1.16 VS 0.83 +40%658.9 VS 521.2 +26%N/A 31X-- 24X
0.34 VS 0.10 +240%319.7 VS 233.1 +37%N/A 31X-- 20X
0.38 VS 0.28 +36%372.3 VS 283.9 +31%N/A 23X-- 18X
EPS DUE*10/8 QUARTER ENDED SEP 30,14 QUARTER ENDED DEC 31,14 QUARTER ENDED MAR 31,15 QUARTER ENDED JUN 30,15
R S LINE VS SP500 VOLUME
90K
250K
650K
*CHIPOTLE MEXICAN GRILL(CMG) NYSE 31.1 SHRS / 29.9 FLT / AVG VOL527046 $730.28(OH -3%)RETAIL-RESTAURANTS chipotle.comOPERATES 1,831 FAST CASUAL MEXICAN FOOD RESTAURANTS IN THE U.S., CANADA, FRANCE, GERMANY AND U.K.
1/14 TO LAUNCH FARMED AND DANGEROUS, A CHIPOTLE ORIGINAL COMEDY SERIES.
SHORT INT 2.6 DAYS -5%OPTIONS ON AM/MSUP/DOWN 1.3EX-DIVYIELD
GROWTH RATE +26%EARNINGS STAB 4EPS RANK 98PE 45 (2.7XS&P)5 YR PE 27 - 65
DEBT 0%NEW CEOTIMELINESS AACC/DIST BSMR RATING A
10.96 X BK VALUEINVENTORY TO.289.6XR&D N/ARET ON EQUITY 25%CASH FLOW $18.07
FUNDS 51%BANKS 2%MGMT 4%ALPHA 0.05BETA 0.61
681.80675.24
727.97
692.43699.03
758.61
607.55
632.43
647.28
597.33
685.0091
QTR 3QTR 2
QTR 1
QTR 4
-O-O-O-O
BARRONS 7/3/15
-O-O-O-O-O-O-O560
580
600
620
640
660
680
700
720
740
760
780
PRICE SCALE
98COMPOSITE RATING$22.00IPO 1/26/0609$ 3.95 $ 98 4610 5.64 262 8611 6.81 347 21312 8.75 442 23313 10.39 550 26614 14.13 697 47215 17.35EST +23% ↓16 20.66EST +19% ↓
EARNINGS (DEC) HI LODave&Buste PLAY 98 99CarrolsR TAST 98 62Starbucks SBUX 95 93BffWldWg BWLD 94 72PapaJohns PZZA 93 92
GROUP REL STR 85 RS EPS
2511281431173195228241027132713301621952172410SEPAUGJULJUNMAYAPRMARFEBJAN 15DECNOVOCT
EARNINGS $SALES MIL. $DIVIDEND-PE
4.15 VS 2.66 +56%1084 VS 826.9 +31%N/A 62X-- 51X
3.84 VS 2.53 +52%1069 VS 844.2 +27%N/A 60X-- 47X
3.88 VS 2.64 +47%1089 VS 904.2 +20%N/A 57X-- 46X
4.45 VS 3.50 +27%1197 VS 1050 +14%N/A 49X-- 39X
EPS DUE*10/20 QUARTER ENDED SEP 30,14 QUARTER ENDED DEC 31,14 QUARTER ENDED MAR 31,15 QUARTER ENDED JUN 30,15
R S LINE VS SP500
VOLUME
182K
500K
1.3M

Autumn 2015marketsmith.com
24
*PALO ALTO NETWORKS(PANW) NYSE 85.0 SHRS / 70.6 FLT / AVG VOL1.63MIL $180.81(OH -9%)COMPUTER SFTWR-SECURITY paloaltonetworks.comPROVIDES NETWORK SECURITY INFRASTRUCTURE PRODUCTS FOR ENTERPRISES, SERVICE PROVIDERS AND GOVERNMENT ENTITIES.
9/15 EXPECTS Q1 FY16 NON-GAAP EARNINGS OF $0.31 TO $0.32 PER DILUTED SHARE ON REVENUES OF $280 MIL TO $284 MIL.
SHORT INT 2.2 DAYS -10%OPTIONS ONUP/DOWN 1.0EX-DIVYIELD
GROWTH RATE +71%EARNINGS STAB 15EPS RANK 99PE 213 (12.9XS&P)5 YR PE 168 - 726
DEBT 0%NEW CEOTIMELINESS AACC/DIST DSMR RATING B
30.61 X BK VALUEINVENTORY TO.R&D 20.0%RET ON EQUITY 16%CASH FLOW $1.44
FUNDS 39%BANKS 1%MGMT 8%ALPHA 0.26BETA 1
149.35 150.44
158.24
185.00
200.55
87.83
134.07
167.82
140.39
96
QTR 3QTR 2
QTR 1
QTR 4
-O-O-O-O-O-O-O-O-O-O-O-O-O-O-O-O-O-O-O-O-O-O-O-O-O-O60
80
100
120
140
160
180
200
PRICE SCALE
99COMPOSITE RATING$42.00IPO 7/20/1209$ -0.28 $10 -0.3111 -0.1912 0.22 72 4713 0.24 62 3914 0.40 128 5415 0.8616 1.70EST +98% ↓
EARNINGS (JUL) HI LOImperva IMPV 98 46Fortinet FTNT 97 50Proofpoint PFPT 92 19Digimrc DMRC 92 5Verisign VRSN 91 89
GROUP REL STR 84 RS EPS
2511281431173195228241027132713301621952172410SEPAUGJULJUNMAYAPRMARFEBJAN 15DECNOVOCT
EARNINGS $SALES MIL. $DIVIDEND-PE
0.15 VS 0.08 +87%192.4 VS 128.2 +50%N/A 271X-- 214X
0.19 VS 0.10 +90%217.7 VS 141.1 +54%N/A 280X-- 235X
0.23 VS 0.11 +109%234.2 VS 150.7 +55%N/A 311X-- 239X
0.28 VS 0.11 +155%283.9 VS 178.2 +59%N/A 295X-- 236X
EPS DUE 11/24 QUARTER ENDED OCT 31,14 QUARTER ENDED JAN 31,15 QUARTER ENDED APR 30,15 QUARTER ENDED JUL 31,15
R S LINE VS SP500 VOLUME
500K
1.3M
3.5M
*NORWEGIAN CRUISE LNE HLD(NCLH) NASDAQ 229.1 SHRS / 176.4 FLT / AVG VOL1.47MIL $60.68(OH -4%)LEISURE-SERVICES ncl.comOPERATES A CRUISE LINE SERVICING NORTH AMERICA, EUROPE, CENTRAL AND SOUTH AMERICA AND THE CARIBBEAN.
3/15 NAMED WALTER L. REVELL CHRMN, EFFECTIVE IMMEDIATELY.
SHORT INT 3.1 DAYS +11%OPTIONS ONUP/DOWN 0.7EX-DIVYIELD
GROWTH RATE +82%EARNINGS STAB 38EPS RANK 95PE 24 (1.4XS&P)5 YR PE 16 - 37
DEBT 159%NEW CEO 1/15TIMELINESS AACC/DIST DSMR RATING A
3.74 X BK VALUEINVENTORY TO. 62.3XR&D N/ARET ON EQUITY 16%CASH FLOW $3.44
FUNDS 33%BANKS 1%MGMT 1%ALPHA 0.21BETA 1.03
48.16
55.3857.55
63.22
30.44
42.54
48.03
53.68 54.48
50.00
94
QTR 3QTR 2
QTR 1
QTR 4
-OSO
PSO
-OSO
PSO
-OSO
PSO
-O20
30
40
50
60
PRICE SCALE
98COMPOSITE RATING$19.00IPO 1/18/1309$ 0.33 $10 0.1111 0.6212 0.8413 1.41 35 2414 2.26 48 2915 2.88EST +27% ↑16 3.88EST +35% ↑
EARNINGS (DEC) HI LOSteinerLei STNR 96 77PlanetFitn PLNT 94 70RoyalCarib RCL 93 76VailResort MTN 89 81CarnivalPl CUK 89 70
GROUP REL STR 71 RS EPS
2511281431173195228241027132713301621952172410SEPAUGJULJUNMAYAPRMARFEBJAN 15DECNOVOCT
EARNINGS $SALES MIL. $DIVIDEND-PE
1.10 VS 0.86 +28%907.0 VS 797.9 +14%N/A 21X-- 17X
0.36 VS 0.19 +89%788.9 VS 600.4 +31%N/A 23X-- 16X
0.27 VS 0.23 +17%938.2 VS 664.0 +41%N/A 24X-- 19X
0.75 VS 0.58 +29%1085 VS 765.9 +42%N/A 25X-- 21X
EPS DUE 10/29 QUARTER ENDED SEP 30,14 QUARTER ENDED DEC 31,14 QUARTER ENDED MAR 31,15 QUARTER ENDED JUN 30,15
R S LINE VS SP500
VOLUME
300K
800K
2.5M
Fastest Growing Companies

Sharpen Your Market SkillsFrom fundamental analysis to technical chart reading, our MarketSmith webinars are designed to take your investment research skills to the next level. Hosted weekly by MarketSmith Product Coaches, you can watch them live or view the recorded version at marketsmith.com/webinar.
Recent Topics Include:
» Relative Strength to Identify the Next Leaders
» Alternative Buy Points
» Interpreting Pullbacks
Stay in Step with the MarketJoin this special webinar series, hosted monthly by our senior product coaches, for a discussion about the current market, the behavior of leading stocks, and strategies for staying on the right side of the action.
THE MATERIAL CONTAINED HEREIN IS NOT TO BE COPIED OR REDISTRIBUTED WITHOUT PRIOR WRITTEN CONSENT OF MARKETSMITH, INCORPORATED.
The data, facts, and statements presented here have been obtained or derived from original or from recognized statistical and/or trade sources. There is no guarantee as to the accuracy of this information and it may possibly be incomplete and/or condensed. This is not a prospectus or an offer with respect to the sale or purchase of any securities. This information is compiled to assist you in your study of the various securities; however, the information contained herein should neither be considered investment advice of any kind nor construed as a recommendation to buy, sell, or hold any securities.
Attention is called to the fact that the officers, directors, employees, and/or stockholders of MarketSmith, Incorporated and its affiliates may own securities, or purchase or sell securities in the companies that are referenced in this publication or those not so mentioned.
Copyright © 2015 MarketSmith, Incorporated. All rights reserved, including the right to reproduce this document or any part thereof in any form. Printed in the USA.
All data contained herein are provided by William O’Neil + Co. Incorporated. MarketSmith is a registered trademark of MarketSmith, Incorporated.
Standard & Poor’s US Index Data
Copyright © 2015, Standard & Poor’s Financial Services LLC (“S&P”). Reproduction of S&P US Index Data in any form is prohibited except with the prior written permission of S&P. Because of the possibility of human or mechanical error by S&P’s sources, S&P or others, S&P does not guarantee the accuracy, adequacy, completeness, timeliness or availability of any information and is not responsible for any errors or omissions or for the results obtained from the use of such information. S&P GIVES NO EXPRESS OR IMPLIED WARRANTIES, INCLUDING, BUT NOT LIMITED TO, ANY WARRANTIES OF MERCHANTABILITY OR FITNESS FOR A PARTICULAR PURPOSE OR USE. In no event shall S&P or its affiliates be liable for any indirect, special or consequential damages in connection with subscriber’s or others’ use of S&P US Index Data. (2012)

1265
5 Be
atric
e St
reet
Los
Ang
eles
, CA
900
66
Qua
rter
ly S
tock
Gui
de
Aut
umn
2015
800.
424.
9033
m
arke
tsm
ith.c
om