stormlamp omae2019 finalpaper v23
TRANSCRIPT
1 Copyright © 2019 by ASME
Proceedings of the ASME 2019 38th International
Conference on Ocean, Offshore and Arctic Engineering OMAE2019
June 9-14, 2019, Glasgow, Scotland
OMAE2019-96262
EFFICACY OF ANALYSIS TECHNIQUES IN ASSESSING BROKEN WAVE LOADING ON A CYLINDER UPON A SHOAL
Darshana T. Dassanayake1 University of Plymouth, Plymouth, UK
Alessandro Antonini2
Delft University of Technology, Delft, The Netherlands
Alison Raby 3 University of Plymouth, Plymouth, UK
ABSTRACT Estimation of impulsive wave loading on a cylinder upon a
shoal, such as an offshore rock lighthouse constructed on a partially emerged offshore rock with a steep foreshore, poses a unique challenge to marine structural engineers. Large and small scale experimental investigations are the most feasible methods to study this phenomena. However, any experimental investigation with impulsive loading faces challenges in the data analysis, when it is necessary to separate the total impact forces from the force response time series, and to separate the impulsive and quasi-static force components of the total force measurements. This paper is an attempt to re-visit several data analysis techniques with a unique experimental data set to study the advantages and limitations of those techniques, and also to learn how different techniques can be combined into a data analysis methodology to harness maximum information.
Keywords: Lighthouse, Impulsive wave force, Physical
modelling, wave loading,
NOMENCLATURE DFR Dynamic Force Response EMD Empirical Model Decomposition EEMD Ensemble Empirical Mode
Decomposition FFT Fast Fourier Transform FRF Frequency Response Function HHT Hilbert-Huang Transform HSA Hilbert Spectral Analysis FHammer Hammer Test Impact Force IMF Intrinsic Mode Functions
1 Contact author: [email protected] 2 [email protected] 3 [email protected]
IRF Impulse Response Function LOESS Locally Estimated Scatterplot
Smoothing STORMLAMP STructural behaviour Of Rock
Mounted Lighthouses At the Mercy of imPulsive waves
RHammer Hammer Test Response Force TF Total Force TFR Total Force Response
INTRODUCTION Experimental investigations to determine impulsive wave loads on offshore cylindrical structures have a history stretching back several decades. Seminal force models have been developed by Goda et al. (1966), Campbell and Weynberg (1980), Cointe and Armand (1987), Wienke and Oumeraci (2004), Burmester et al. (2017), Tu et al. (2018a & 2018b), Khansari and Oumeraci (2018), and Khansari (2018). Experimental investigations on rapidly-varying (impulsive) wave forces typically measure the dynamic responses of the test rig under load rather than the actual wave forces, hence careful data processing is required.
Whilst there have been several wave force measurement studies during the last two decades which have used state-of-the-art processing methods, there have been very few comparative studies of the techniques. This paper is an attempt to fill this knowledge gap, by comparing different data processing techniques in force measurements as applied on a new data set from an on-going research project: STORMLAMP – STructural behaviour Of Rock Mounted Lighthouses At the Mercy of imPulsive waves. This will provide an essential guideline for future researchers on data processing technique selection.
2 Copyright © 2019 by ASME
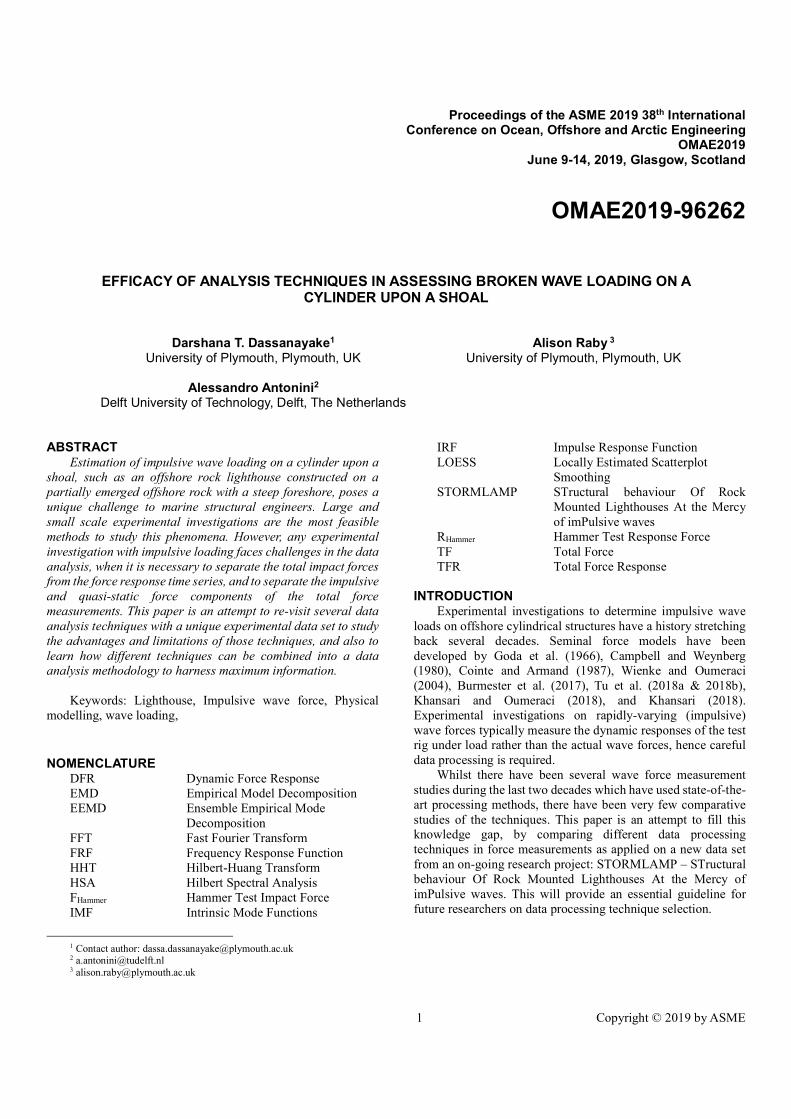
BACKGROUND A comprehensive literature review has identified several
data processing techniques used to separate quasi-static and dynamic components from a Total Force Response (TFR) time series.
Two of the most commonly used methods are frequency domain filtering and Empirical Model Decomposition (EMD) (Huang et al, 1998). Tu et al. (2018a) reported that both these methods underestimate the Dynamic Force Response (DFR) component while overestimating the quasi-static force response components of the TFR signal. Due to this limitation, Tu et al (2018) adopted the Locally Estimated Scatterplot Smoothing (LOESS) technique to estimate the quasi-static component and then subtracted the quasi-static components from the total force signal to obtain the DFR time series. Khansari (2018) separated the DFR from the TFR time series by using a simple band pass filter and then extracted dynamic force time series by applying Frequency Response Functions (FRFs) developed from impact hammer test results in the frequency domain. Both Tu et al. (2018) and Khansari and Oumeraci (2017) used the same data with similar objectives but followed different data-processing techniques. The current paper therefore discusses different data-processing techniques, including those by Tu et al. (2018) and Khasari and Oumeraci (2017), but also presents a new methodology based on a combination of different tools from structural dynamic and earthquake engineering. Figure 1 summarises the available data analysis approaches.
Figure 1: A SUMMARY OF COMMON DATA ANALYSIS METHODOLOGIES FOR DEVELOP FORCE MODELS USING PHYSICAL MODELLING DATA
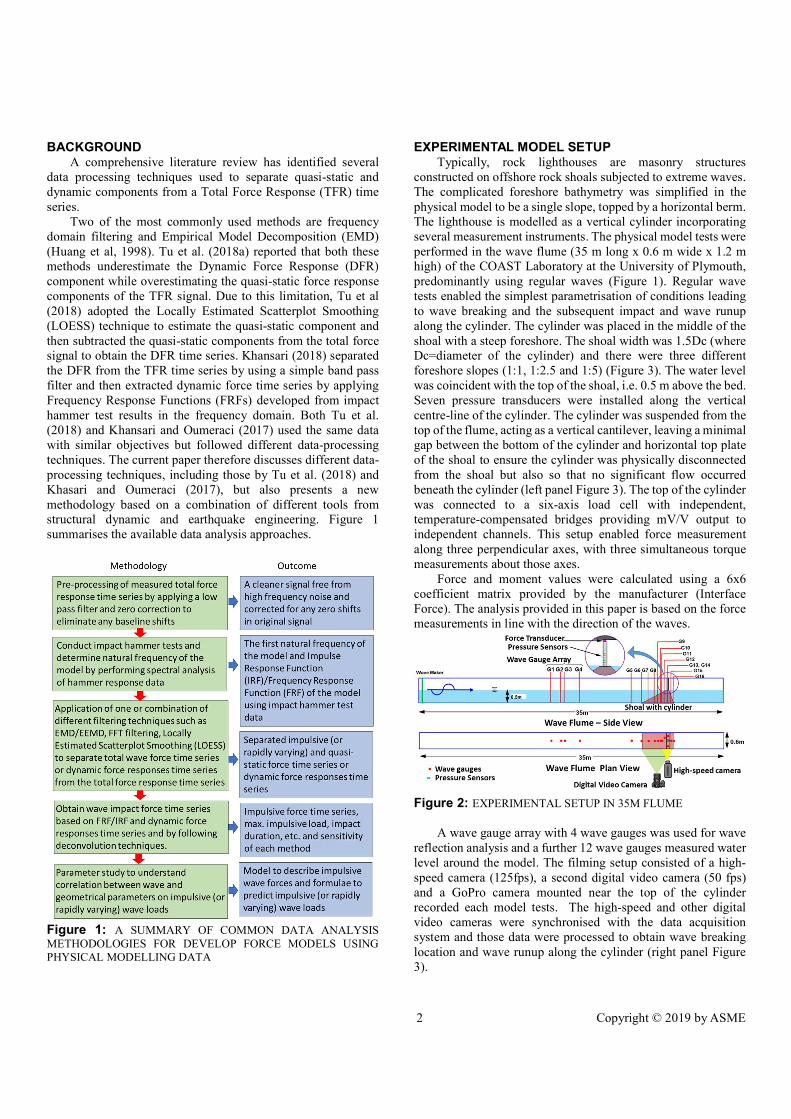
EXPERIMENTAL MODEL SETUP Typically, rock lighthouses are masonry structures
constructed on offshore rock shoals subjected to extreme waves. The complicated foreshore bathymetry was simplified in the physical model to be a single slope, topped by a horizontal berm. The lighthouse is modelled as a vertical cylinder incorporating several measurement instruments. The physical model tests were performed in the wave flume (35 m long x 0.6 m wide x 1.2 m high) of the COAST Laboratory at the University of Plymouth, predominantly using regular waves (Figure 1). Regular wave tests enabled the simplest parametrisation of conditions leading to wave breaking and the subsequent impact and wave runup along the cylinder. The cylinder was placed in the middle of the shoal with a steep foreshore. The shoal width was 1.5Dc (where Dc=diameter of the cylinder) and there were three different foreshore slopes (1:1, 1:2.5 and 1:5) (Figure 3). The water level was coincident with the top of the shoal, i.e. 0.5 m above the bed. Seven pressure transducers were installed along the vertical centre-line of the cylinder. The cylinder was suspended from the top of the flume, acting as a vertical cantilever, leaving a minimal gap between the bottom of the cylinder and horizontal top plate of the shoal to ensure the cylinder was physically disconnected from the shoal but also so that no significant flow occurred beneath the cylinder (left panel Figure 3). The top of the cylinder was connected to a six-axis load cell with independent, temperature-compensated bridges providing mV/V output to independent channels. This setup enabled force measurement along three perpendicular axes, with three simultaneous torque measurements about those axes.
Force and moment values were calculated using a 6x6 coefficient matrix provided by the manufacturer (Interface Force). The analysis provided in this paper is based on the force measurements in line with the direction of the waves.
Figure 2: EXPERIMENTAL SETUP IN 35M FLUME
A wave gauge array with 4 wave gauges was used for wave
reflection analysis and a further 12 wave gauges measured water level around the model. The filming setup consisted of a high-speed camera (125fps), a second digital video camera (50 fps) and a GoPro camera mounted near the top of the cylinder recorded each model tests. The high-speed and other digital video cameras were synchronised with the data acquisition system and those data were processed to obtain wave breaking location and wave runup along the cylinder (right panel Figure 3).
3 Copyright © 2019 by ASME
Figure 3: WAVE FLUME INSTRUMENTATION
DATA ANALYSIS
Data Analysis Approaches
There is a significant difference between most of the previous studies on impulsive wave loads on offshore structures and the current study. In the current study, waves are not slamming into the cylinder with a near vertical face, rather waves were either breaking into the base of the cylinder (for most of the 1:1 slope and some of 1:2.5 slope tests) or bores generated from broken waves were hitting the structure. Therefore, it is not straightforward to separate the impulsive force and quasi-static forces using a simple low pass filtering in the frequency domain or band pass filtering as adopted by Irschik & Oumeraci (2004), and Khansari (2018). The analysis method therefore, focuses on obtaining the total force time series from the total force response time series and then to separate quasi-static and impulsive force components. Furthermore, the impact duration from the current experiments is relatively large compared to that of slamming wave cases in deep water. Therefore, a novel force model is required to estimate the wave loading on lighthouses on rocky shoals.
After considering the advantages and limitations of different analysis techniques, two methods as illustrated in Figure 4 were adopted for this comparative study.
Figure 4: DATA ANALYSIS METHODS ADOPTED FOR THIS STUDY
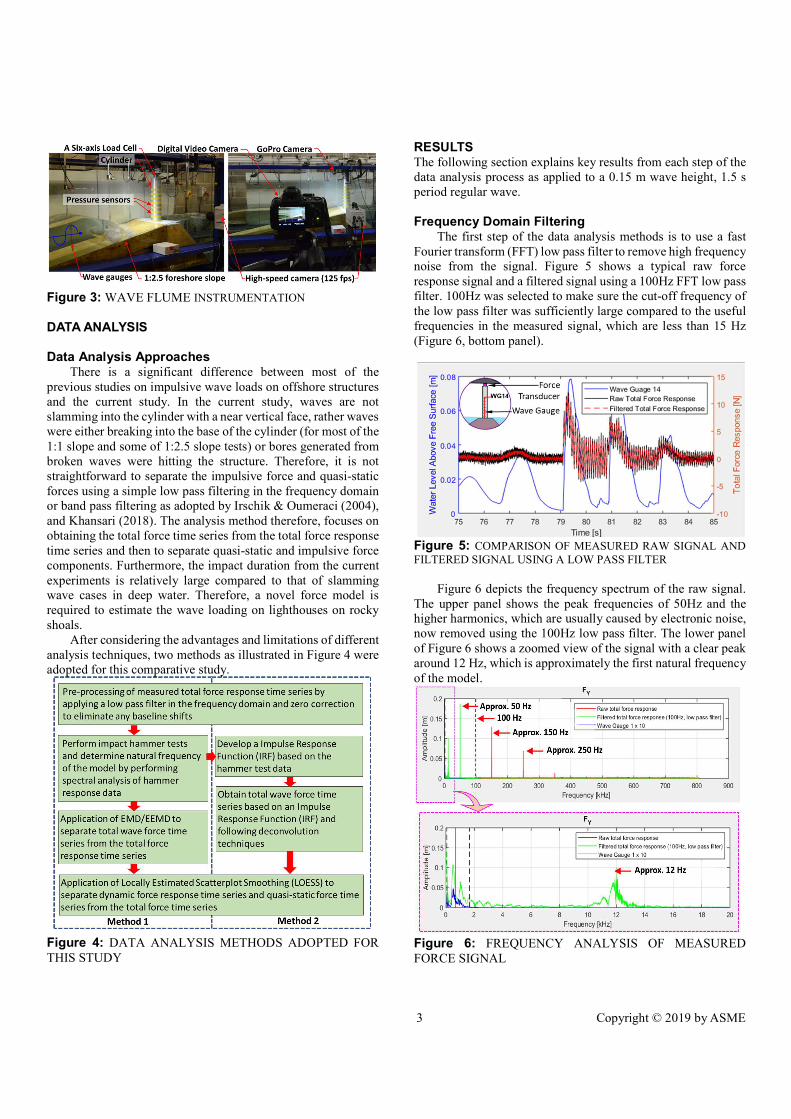
RESULTS The following section explains key results from each step of the data analysis process as applied to a 0.15 m wave height, 1.5 s period regular wave. Frequency Domain Filtering
The first step of the data analysis methods is to use a fast Fourier transform (FFT) low pass filter to remove high frequency noise from the signal. Figure 5 shows a typical raw force response signal and a filtered signal using a 100Hz FFT low pass filter. 100Hz was selected to make sure the cut-off frequency of the low pass filter was sufficiently large compared to the useful frequencies in the measured signal, which are less than 15 Hz (Figure 6, bottom panel).
Figure 5: COMPARISON OF MEASURED RAW SIGNAL AND FILTERED SIGNAL USING A LOW PASS FILTER
Figure 6 depicts the frequency spectrum of the raw signal.
The upper panel shows the peak frequencies of 50Hz and the higher harmonics, which are usually caused by electronic noise, now removed using the 100Hz low pass filter. The lower panel of Figure 6 shows a zoomed view of the signal with a clear peak around 12 Hz, which is approximately the first natural frequency of the model.
Figure 6: FREQUENCY ANALYSIS OF MEASURED FORCE SIGNAL
4 Copyright © 2019 by ASME
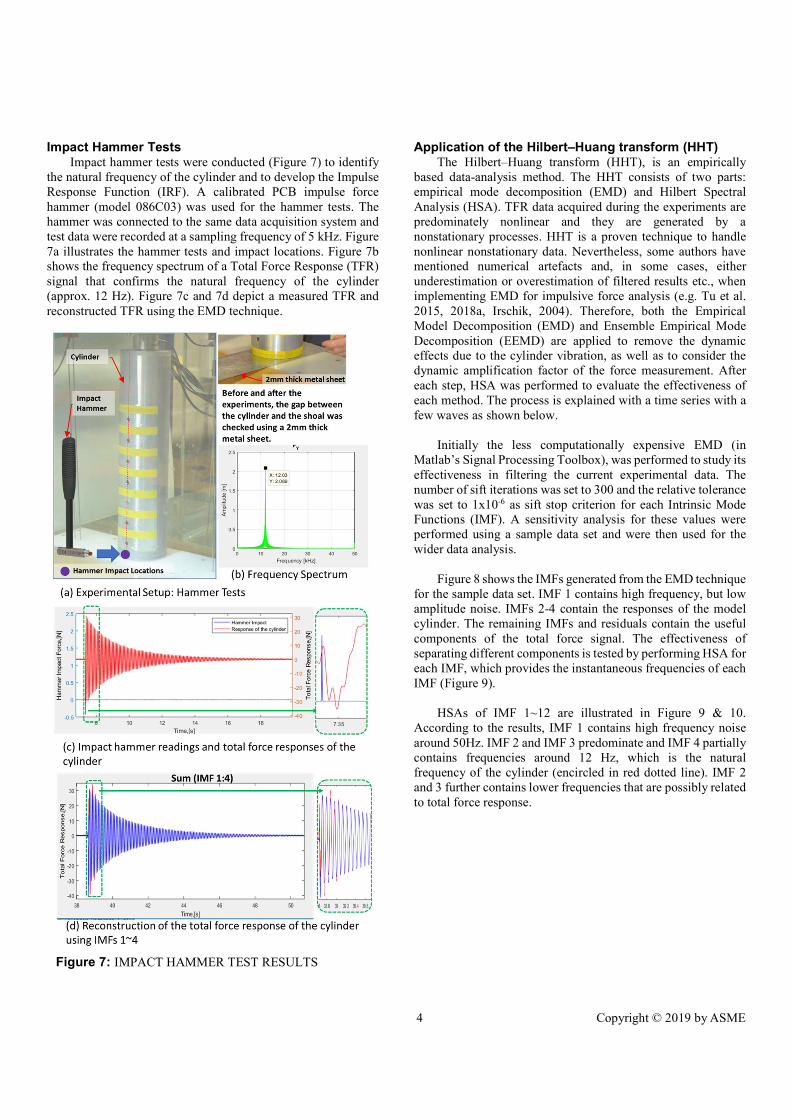
Impact Hammer Tests Impact hammer tests were conducted (Figure 7) to identify
the natural frequency of the cylinder and to develop the Impulse Response Function (IRF). A calibrated PCB impulse force hammer (model 086C03) was used for the hammer tests. The hammer was connected to the same data acquisition system and test data were recorded at a sampling frequency of 5 kHz. Figure 7a illustrates the hammer tests and impact locations. Figure 7b shows the frequency spectrum of a Total Force Response (TFR) signal that confirms the natural frequency of the cylinder (approx. 12 Hz). Figure 7c and 7d depict a measured TFR and reconstructed TFR using the EMD technique.
Figure 7: IMPACT HAMMER TEST RESULTS
Application of the Hilbert–Huang transform (HHT) The Hilbert–Huang transform (HHT), is an empirically
based data-analysis method. The HHT consists of two parts: empirical mode decomposition (EMD) and Hilbert Spectral Analysis (HSA). TFR data acquired during the experiments are predominately nonlinear and they are generated by a nonstationary processes. HHT is a proven technique to handle nonlinear nonstationary data. Nevertheless, some authors have mentioned numerical artefacts and, in some cases, either underestimation or overestimation of filtered results etc., when implementing EMD for impulsive force analysis (e.g. Tu et al. 2015, 2018a, Irschik, 2004). Therefore, both the Empirical Model Decomposition (EMD) and Ensemble Empirical Mode Decomposition (EEMD) are applied to remove the dynamic effects due to the cylinder vibration, as well as to consider the dynamic amplification factor of the force measurement. After each step, HSA was performed to evaluate the effectiveness of each method. The process is explained with a time series with a few waves as shown below.
Initially the less computationally expensive EMD (in
Matlab’s Signal Processing Toolbox), was performed to study its effectiveness in filtering the current experimental data. The number of sift iterations was set to 300 and the relative tolerance was set to 1x10⁻⁶ as sift stop criterion for each Intrinsic Mode Functions (IMF). A sensitivity analysis for these values were performed using a sample data set and were then used for the wider data analysis.
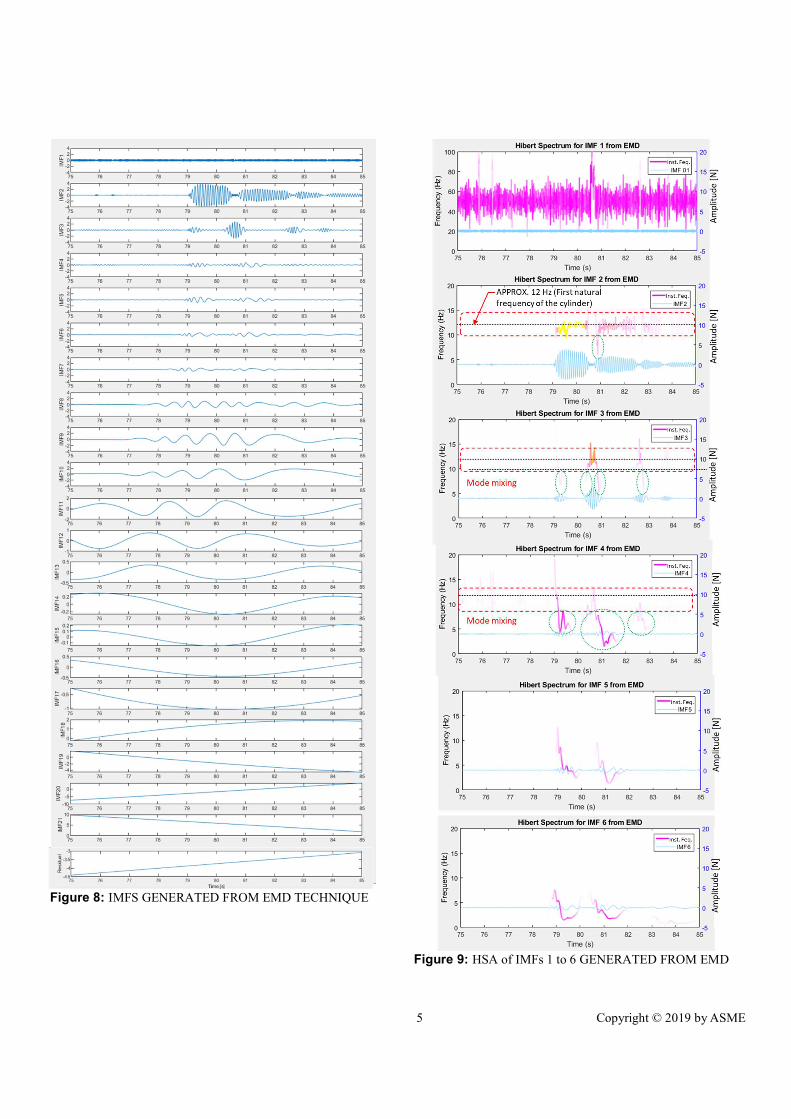
Figure 8 shows the IMFs generated from the EMD technique
for the sample data set. IMF 1 contains high frequency, but low amplitude noise. IMFs 2-4 contain the responses of the model cylinder. The remaining IMFs and residuals contain the useful components of the total force signal. The effectiveness of separating different components is tested by performing HSA for each IMF, which provides the instantaneous frequencies of each IMF (Figure 9).
HSAs of IMF 1~12 are illustrated in Figure 9 & 10.
According to the results, IMF 1 contains high frequency noise around 50Hz. IMF 2 and IMF 3 predominate and IMF 4 partially contains frequencies around 12 Hz, which is the natural frequency of the cylinder (encircled in red dotted line). IMF 2 and 3 further contains lower frequencies that are possibly related to total force response.
5 Copyright © 2019 by ASME
Figure 8: IMFS GENERATED FROM EMD TECHNIQUE
Figure 9: HSA of IMFs 1 to 6 GENERATED FROM EMD
6 Copyright © 2019 by ASME
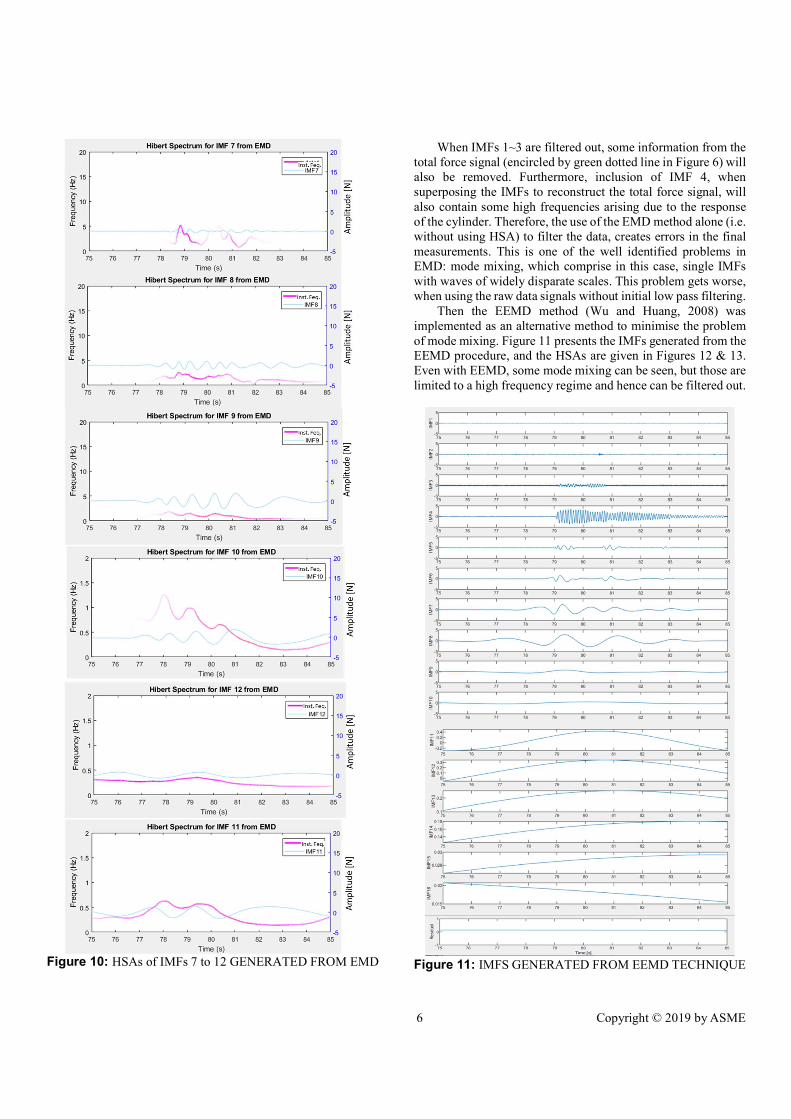
Figure 10: HSAs of IMFs 7 to 12 GENERATED FROM EMD
When IMFs 1~3 are filtered out, some information from the total force signal (encircled by green dotted line in Figure 6) will also be removed. Furthermore, inclusion of IMF 4, when superposing the IMFs to reconstruct the total force signal, will also contain some high frequencies arising due to the response of the cylinder. Therefore, the use of the EMD method alone (i.e. without using HSA) to filter the data, creates errors in the final measurements. This is one of the well identified problems in EMD: mode mixing, which comprise in this case, single IMFs with waves of widely disparate scales. This problem gets worse, when using the raw data signals without initial low pass filtering.
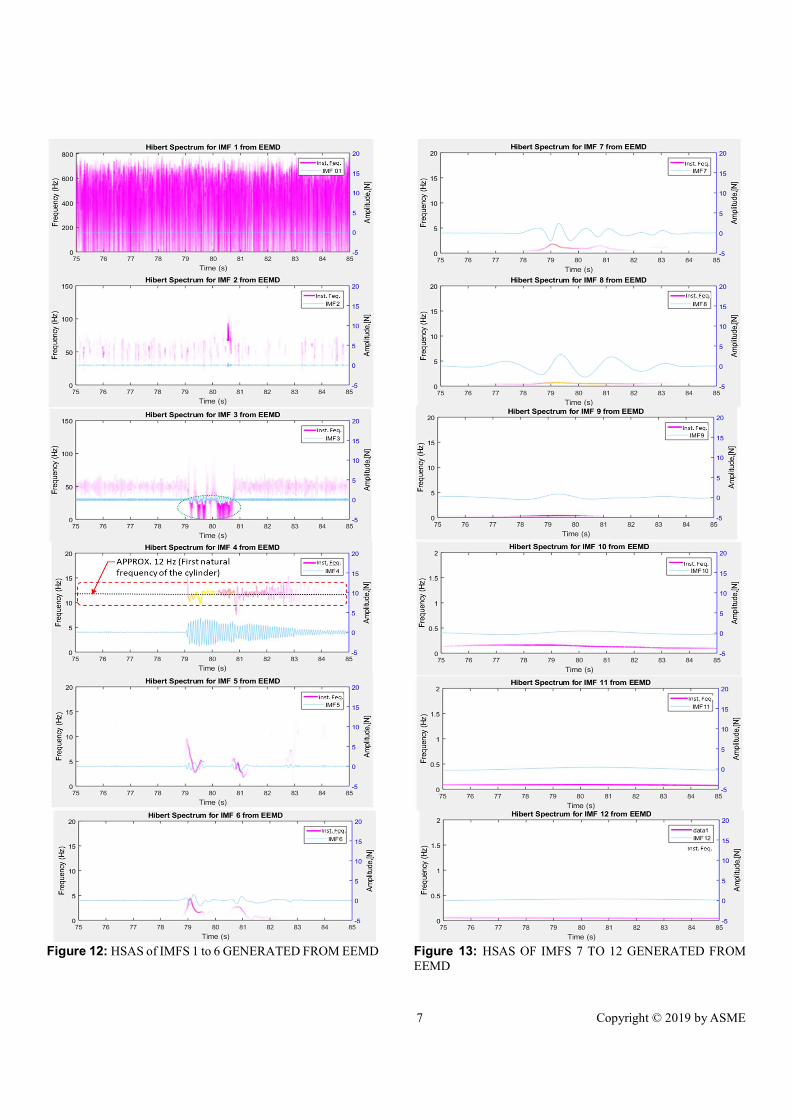
Then the EEMD method (Wu and Huang, 2008) was implemented as an alternative method to minimise the problem of mode mixing. Figure 11 presents the IMFs generated from the EEMD procedure, and the HSAs are given in Figures 12 & 13. Even with EEMD, some mode mixing can be seen, but those are limited to a high frequency regime and hence can be filtered out.
Figure 11: IMFS GENERATED FROM EEMD TECHNIQUE
7 Copyright © 2019 by ASME
Figure 12: HSAS of IMFS 1 to 6 GENERATED FROM EEMD
Figure 13: HSAS OF IMFS 7 TO 12 GENERATED FROM EEMD
8 Copyright © 2019 by ASME
IMFs 1~3 clearly contain high frequency noise and IMF 4 contains the response of the cylinder. Therefore, the total force signal can be separated by superposing the remaining IMFs and the residual. Figure 14 and 15 shows the superposed signals from IMFs1~4 (upper panel) and IMFs 5~16 and the residual (lower panel).
Figure 14: SEPARATION OF TOTAL FORCE RESPONSES FROM DYNAMIC RESPONSES OF THE MODEL CYLINDER
Figure 15: COMPARISON OF EMD AND EEMD RESULTS OF EXAMPLE TIME SERIES
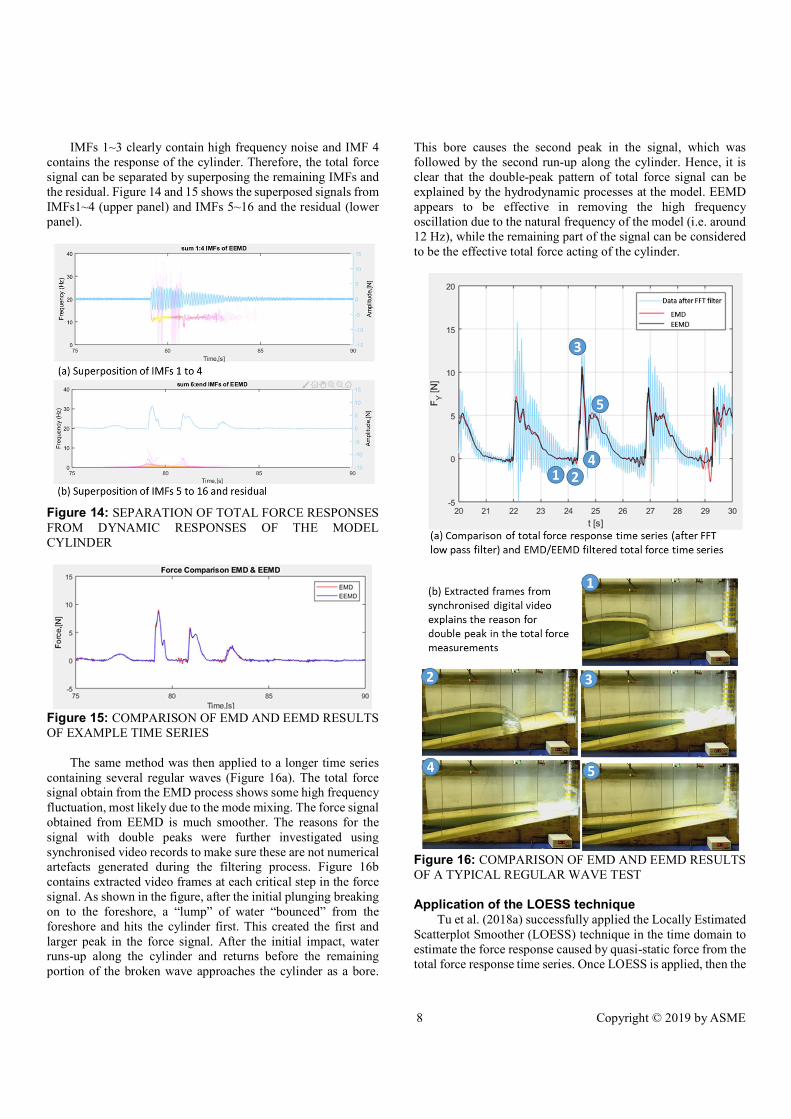
The same method was then applied to a longer time series
containing several regular waves (Figure 16a). The total force signal obtain from the EMD process shows some high frequency fluctuation, most likely due to the mode mixing. The force signal obtained from EEMD is much smoother. The reasons for the signal with double peaks were further investigated using synchronised video records to make sure these are not numerical artefacts generated during the filtering process. Figure 16b contains extracted video frames at each critical step in the force signal. As shown in the figure, after the initial plunging breaking on to the foreshore, a “lump” of water “bounced” from the foreshore and hits the cylinder first. This created the first and larger peak in the force signal. After the initial impact, water runs-up along the cylinder and returns before the remaining portion of the broken wave approaches the cylinder as a bore.
This bore causes the second peak in the signal, which was followed by the second run-up along the cylinder. Hence, it is clear that the double-peak pattern of total force signal can be explained by the hydrodynamic processes at the model. EEMD appears to be effective in removing the high frequency oscillation due to the natural frequency of the model (i.e. around 12 Hz), while the remaining part of the signal can be considered to be the effective total force acting of the cylinder.
Figure 16: COMPARISON OF EMD AND EEMD RESULTS OF A TYPICAL REGULAR WAVE TEST
Application of the LOESS technique
Tu et al. (2018a) successfully applied the Locally Estimated Scatterplot Smoother (LOESS) technique in the time domain to estimate the force response caused by quasi-static force from the total force response time series. Once LOESS is applied, then the
9 Copyright © 2019 by ASME
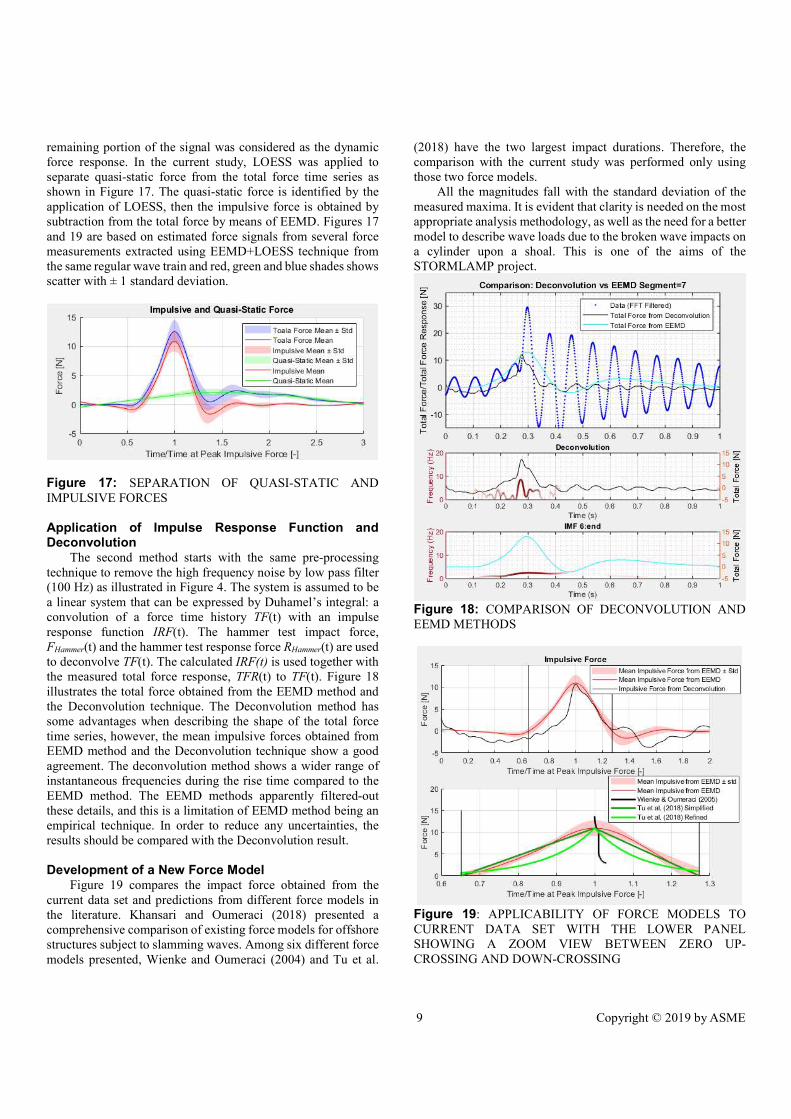
remaining portion of the signal was considered as the dynamic force response. In the current study, LOESS was applied to separate quasi-static force from the total force time series as shown in Figure 17. The quasi-static force is identified by the application of LOESS, then the impulsive force is obtained by subtraction from the total force by means of EEMD. Figures 17 and 19 are based on estimated force signals from several force measurements extracted using EEMD+LOESS technique from the same regular wave train and red, green and blue shades shows scatter with ± 1 standard deviation.
Figure 17: SEPARATION OF QUASI-STATIC AND IMPULSIVE FORCES
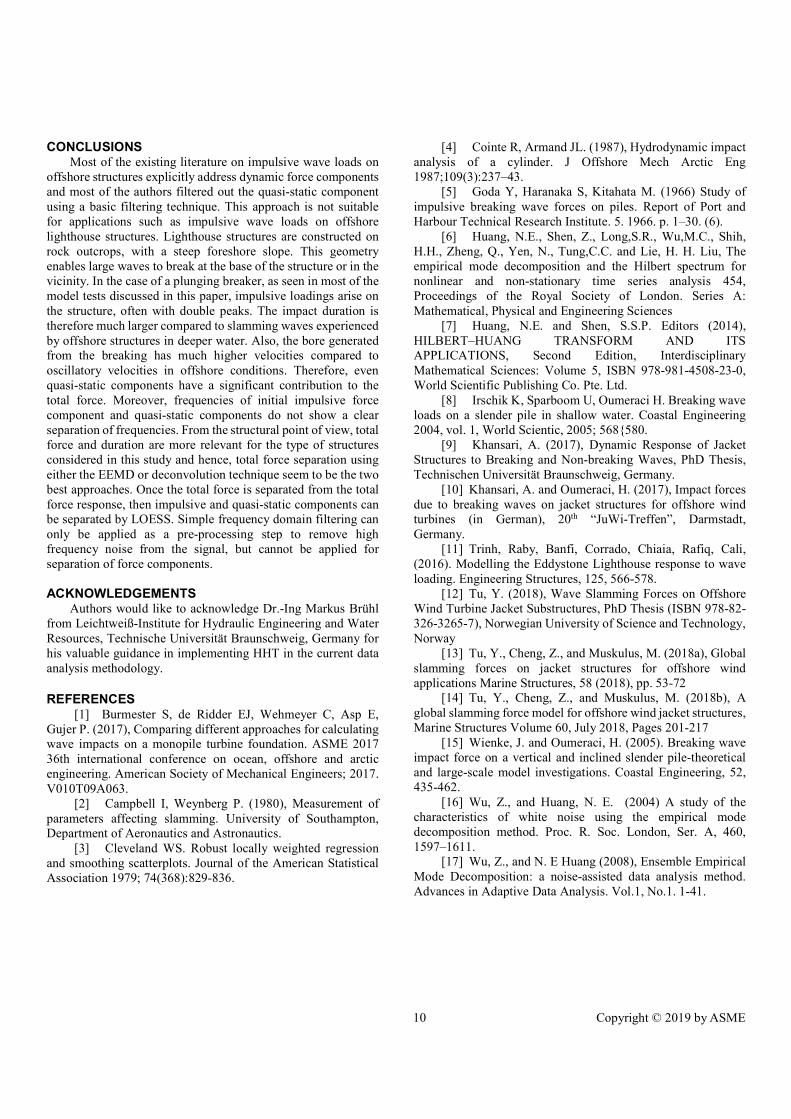
Application of Impulse Response Function and Deconvolution
The second method starts with the same pre-processing technique to remove the high frequency noise by low pass filter (100 Hz) as illustrated in Figure 4. The system is assumed to be a linear system that can be expressed by Duhamel’s integral: a convolution of a force time history TF(t) with an impulse response function IRF(t). The hammer test impact force, FHammer(t) and the hammer test response force RHammer(t) are used to deconvolve TF(t). The calculated IRF(t) is used together with the measured total force response, TFR(t) to TF(t). Figure 18 illustrates the total force obtained from the EEMD method and the Deconvolution technique. The Deconvolution method has some advantages when describing the shape of the total force time series, however, the mean impulsive forces obtained from EEMD method and the Deconvolution technique show a good agreement. The deconvolution method shows a wider range of instantaneous frequencies during the rise time compared to the EEMD method. The EEMD methods apparently filtered-out these details, and this is a limitation of EEMD method being an empirical technique. In order to reduce any uncertainties, the results should be compared with the Deconvolution result.
Development of a New Force Model
Figure 19 compares the impact force obtained from the current data set and predictions from different force models in the literature. Khansari and Oumeraci (2018) presented a comprehensive comparison of existing force models for offshore structures subject to slamming waves. Among six different force models presented, Wienke and Oumeraci (2004) and Tu et al.
(2018) have the two largest impact durations. Therefore, the comparison with the current study was performed only using those two force models.
All the magnitudes fall with the standard deviation of the measured maxima. It is evident that clarity is needed on the most appropriate analysis methodology, as well as the need for a better model to describe wave loads due to the broken wave impacts on a cylinder upon a shoal. This is one of the aims of the STORMLAMP project.
Figure 18: COMPARISON OF DECONVOLUTION AND EEMD METHODS
Figure 19: APPLICABILITY OF FORCE MODELS TO CURRENT DATA SET WITH THE LOWER PANEL SHOWING A ZOOM VIEW BETWEEN ZERO UP-CROSSING AND DOWN-CROSSING
10 Copyright © 2019 by ASME
CONCLUSIONS Most of the existing literature on impulsive wave loads on
offshore structures explicitly address dynamic force components and most of the authors filtered out the quasi-static component using a basic filtering technique. This approach is not suitable for applications such as impulsive wave loads on offshore lighthouse structures. Lighthouse structures are constructed on rock outcrops, with a steep foreshore slope. This geometry enables large waves to break at the base of the structure or in the vicinity. In the case of a plunging breaker, as seen in most of the model tests discussed in this paper, impulsive loadings arise on the structure, often with double peaks. The impact duration is therefore much larger compared to slamming waves experienced by offshore structures in deeper water. Also, the bore generated from the breaking has much higher velocities compared to oscillatory velocities in offshore conditions. Therefore, even quasi-static components have a significant contribution to the total force. Moreover, frequencies of initial impulsive force component and quasi-static components do not show a clear separation of frequencies. From the structural point of view, total force and duration are more relevant for the type of structures considered in this study and hence, total force separation using either the EEMD or deconvolution technique seem to be the two best approaches. Once the total force is separated from the total force response, then impulsive and quasi-static components can be separated by LOESS. Simple frequency domain filtering can only be applied as a pre-processing step to remove high frequency noise from the signal, but cannot be applied for separation of force components. ACKNOWLEDGEMENTS
Authors would like to acknowledge Dr.-Ing Markus Brühl from Leichtweiß-Institute for Hydraulic Engineering and Water Resources, Technische Universität Braunschweig, Germany for his valuable guidance in implementing HHT in the current data analysis methodology. REFERENCES
[1] Burmester S, de Ridder EJ, Wehmeyer C, Asp E, Gujer P. (2017), Comparing different approaches for calculating wave impacts on a monopile turbine foundation. ASME 2017 36th international conference on ocean, offshore and arctic engineering. American Society of Mechanical Engineers; 2017. V010T09A063.
[2] Campbell I, Weynberg P. (1980), Measurement of parameters affecting slamming. University of Southampton, Department of Aeronautics and Astronautics.
[3] Cleveland WS. Robust locally weighted regression and smoothing scatterplots. Journal of the American Statistical Association 1979; 74(368):829-836.
[4] Cointe R, Armand JL. (1987), Hydrodynamic impact analysis of a cylinder. J Offshore Mech Arctic Eng 1987;109(3):237–43.
[5] Goda Y, Haranaka S, Kitahata M. (1966) Study of impulsive breaking wave forces on piles. Report of Port and Harbour Technical Research Institute. 5. 1966. p. 1–30. (6).
[6] Huang, N.E., Shen, Z., Long,S.R., Wu,M.C., Shih, H.H., Zheng, Q., Yen, N., Tung,C.C. and Lie, H. H. Liu, The empirical mode decomposition and the Hilbert spectrum for nonlinear and non-stationary time series analysis 454, Proceedings of the Royal Society of London. Series A: Mathematical, Physical and Engineering Sciences
[7] Huang, N.E. and Shen, S.S.P. Editors (2014), HILBERT–HUANG TRANSFORM AND ITS APPLICATIONS, Second Edition, Interdisciplinary Mathematical Sciences: Volume 5, ISBN 978-981-4508-23-0, World Scientific Publishing Co. Pte. Ltd.
[8] Irschik K, Sparboom U, Oumeraci H. Breaking wave loads on a slender pile in shallow water. Coastal Engineering 2004, vol. 1, World Scientic, 2005; 568{580.
[9] Khansari, A. (2017), Dynamic Response of Jacket Structures to Breaking and Non-breaking Waves, PhD Thesis, Technischen Universität Braunschweig, Germany.
[10] Khansari, A. and Oumeraci, H. (2017), Impact forces due to breaking waves on jacket structures for offshore wind turbines (in German), 20th “JuWi-Treffen”, Darmstadt, Germany.
[11] Trinh, Raby, Banfi, Corrado, Chiaia, Rafiq, Cali, (2016). Modelling the Eddystone Lighthouse response to wave loading. Engineering Structures, 125, 566-578.
[12] Tu, Y. (2018), Wave Slamming Forces on Offshore Wind Turbine Jacket Substructures, PhD Thesis (ISBN 978-82-326-3265-7), Norwegian University of Science and Technology, Norway
[13] Tu, Y., Cheng, Z., and Muskulus, M. (2018a), Global slamming forces on jacket structures for offshore wind applications Marine Structures, 58 (2018), pp. 53-72
[14] Tu, Y., Cheng, Z., and Muskulus, M. (2018b), A global slamming force model for offshore wind jacket structures, Marine Structures Volume 60, July 2018, Pages 201-217
[15] Wienke, J. and Oumeraci, H. (2005). Breaking wave impact force on a vertical and inclined slender pile-theoretical and large-scale model investigations. Coastal Engineering, 52, 435-462.
[16] Wu, Z., and Huang, N. E. (2004) A study of the characteristics of white noise using the empirical mode decomposition method. Proc. R. Soc. London, Ser. A, 460, 1597–1611.
[17] Wu, Z., and N. E Huang (2008), Ensemble Empirical Mode Decomposition: a noise-assisted data analysis method. Advances in Adaptive Data Analysis. Vol.1, No.1. 1-41.