stormwater as a resource in the urban water cycle: a case ... · stormwater as a resource in the...
TRANSCRIPT

Stormwater as a Resource in the Urban
Water Cycle: A Case Study in the
SWITCH Demonstration City of
Birmingham, UK.
J Bryan Ellis, Lian Lundy and D Michael Revitt
Urban Pollution Research Centre
Middlesex University, The Burroughs, Hendon.
NW4 4B. London, UK.
SWITCH Conference. The Future of Urban Water Solutions for
Livable and Resilient Cities. UNESCO, Paris. 24-26 January

IUWCM
Minimal
Receiving
Waterbody
Impacts
ENVIRONMENT
Costs/Benefits
and economic
efficiency
Water and
Wastewater
Infrastructure
provision
Public
health and
safety
Lifestyle
quality and
environmental
stewardship
Rainwater
harvesting
and re-use
Flows,
flooding
and
pollution
risk
Resources
and
Organisational
base
Ecology,
Recreation
and
Amenity
Integrated Urban Water Cycle Management (IUWCM)
URBAN
STORMWATER

Stormwater Management and the Urban Water Cycle

An urban water cycle (UWC) study can be regarded as being:
• a methodological approach for determining what water resource
infrastructure is required, as well as where and when it will be
needed,
• a risk-based approach ensuring that the planning process makes
best use of environmental capacity and is adapted to environmental,
technical, costing and other major local/regional constraints
• a structural framework for stakeholder engagement and
collaboration,
• a process procedure whereby diverse and disparate knowledge and
information is brought together to make better and more integrated
risk-based decisions on the urban water environment,
• a basis for developing stormwater management plans (SWMPs)
and preliminary strategic flood and pollution risk assessments
(SRAs) as well as ensuring compliance with other regulatory
requirements such as required under the EU Water Framework
Directive (WFD) and with local/regional development planning
policies and regulations.

EVIDENCE
Catchment Management
Plans (CMPs)
Strategic Flood &
Pollution Risk
Assessment (SRA)
Flo
od
/Po
llutio
n R
isk
STRATEGY
Surface Water
Management
Plan (SWMP)
DELIVERY
Design and location of new
development and urban
fabric
Emergency planning
and preparation
Infrastructure
investment and future
O&M
Outline Phase 1
Urban Water Cycle
(UWC) Study
Detailed Phase 2
Urban Water
Cycle (UWC)
Study
Urb
an
Gro
wth
Infrastructure Investment
Implementation
Urban Land Use Planning
and “green” Infrastructure
Wastewater & Water
Company Plans
Regional/Local
Government
Development Plans
Stormwater BMP
drainage
SWMPs and Urban Water Cycle Studies

National Planning
Policies
Regional Spatial
Strategies
Regional
Spatial Plans
Local
Development
Frameworks
(LDF)
Planning
Applications
Regional Flood Risk
Appraisal
Planning
Decisions
Strategic Flood
Risk Assessment
(SFRA)
Development Flood
Risk Assessment
Catchment Management
Plans (CMP)
Water Quality
Plans
Urban Water
Cycle (UWC)
StudySurface Water
Management Plans
(SWMP)
NATIONAL REGIONAL LOCAL
AUTHORITY
DEVELOPER
ENVIRONMENT
AGENCY
Planning and Flood Risk Strategy Statutory
Documents
at National, Regional and Local Levels.

INITIAL SCOPING BRIEF
(Provided by Local Authority/municipality or other
Steering Group which sets out the need for and
scope of the outline Level 1 study)
REGIONAL/STATE OR OTHER SUB-
REGIONAL GOVERNMENT SPATIAL
DEVELOPMENT STRATEGY
OUTLINE LEVEL 1 STUDY
Environmental constraints analysis.
Infrastructure constraints analysis.
Sustainability assessment.
OUTLINE URBAN WATER CYCLE
STRATEGY
LOCAL DEVELOPMENT
PLANS.
Sustainability of the Core
Strategy
Provides evidence base for
Core Strategy and
Sustainability Appraisal
DETAILED LEVEL 2 STUDY
Identifies infrastructure needed.
Where and when it is needed.
Assesses if the strategy is
sustainable.
Implementation and funding
DETAILED URBAN WATER
CYCLE STRATEGY
DEVELOPMENT PLAN
DOCUMENTS (DPDs) & SITE
SPECIFIC PROPOSALS
Evidence base and potential site
allocation for DPD; sustainable
construction DPDs; Area action plans
STRATEGY IMPLEMENTATION
Monitoring compliance with
strategy.
Managing changes/revisions to
strategy.
PLANNING APPLICATIONS
& APPROVALS
Strategy implementation;
monitoring planning applications
against strategy; periodic review
and revisions to strategy
Strategic Flood &
Pollution Risk
Assessment (SRAs)
Stages in an Urban Water Cycle (UWC) Study.

The brief for a water cycle study strategy study should
contain the following elements:
• the background and context to the reasons why a water cycle
strategy is required together with the prevailing legal and planning
framework.
• the scope of the strategy and the key outputs and deliverables
required of the water cycle strategy study.
• suggested information and data sources as well as skills required to
undertake the UWC study should be stated. Lead and key partners
to the study should also be identified together with any project
steering review group.
• any particular issues that the UWC needs to address in more detail
in terms of further study, analysis and consultation. This will
comprise the core of the Outline Level I Initial Scoping Study.
• a summary and recommendations of the inputs necessary to
progress the water cycle study strategy to any detailed Level II
study.

Grand Union
Canal
River Rea
Warwick &
Birmingham
Canal
City Centre
Birmingham Eastside Development Area.

Proposed Landuse Activities for Birmingham Eastside
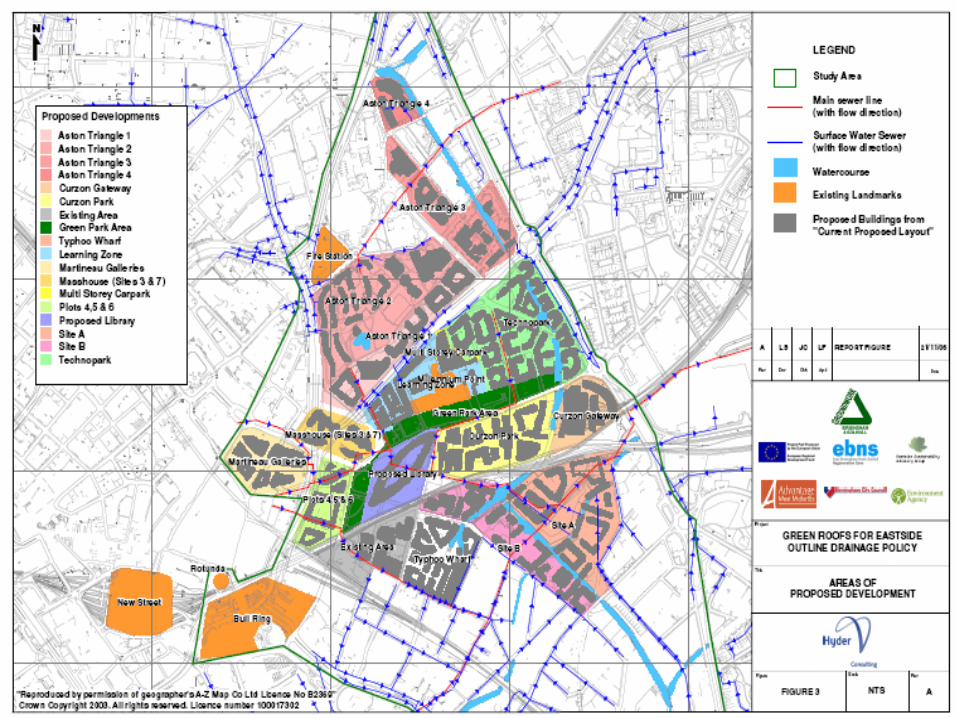

The primary concerns for surface water drainage
infrastructure provision across Eastside include:
• water demand, usage rates and wastewater flows and the
capacity to meet requirements
• the need for on-site attenuation, storage and/or infiltration
facilities especially in respect of overland flows associated
with extreme storm events
• the need to maintain and/or extend the drainage
infrastructure, including retrofitting, where appropriate
• the timetable for staged and integrated planning and delivery
of drainage infrastructure controls
• the costs, operational reliability and sustainability of the
drainage network resources being delivered.
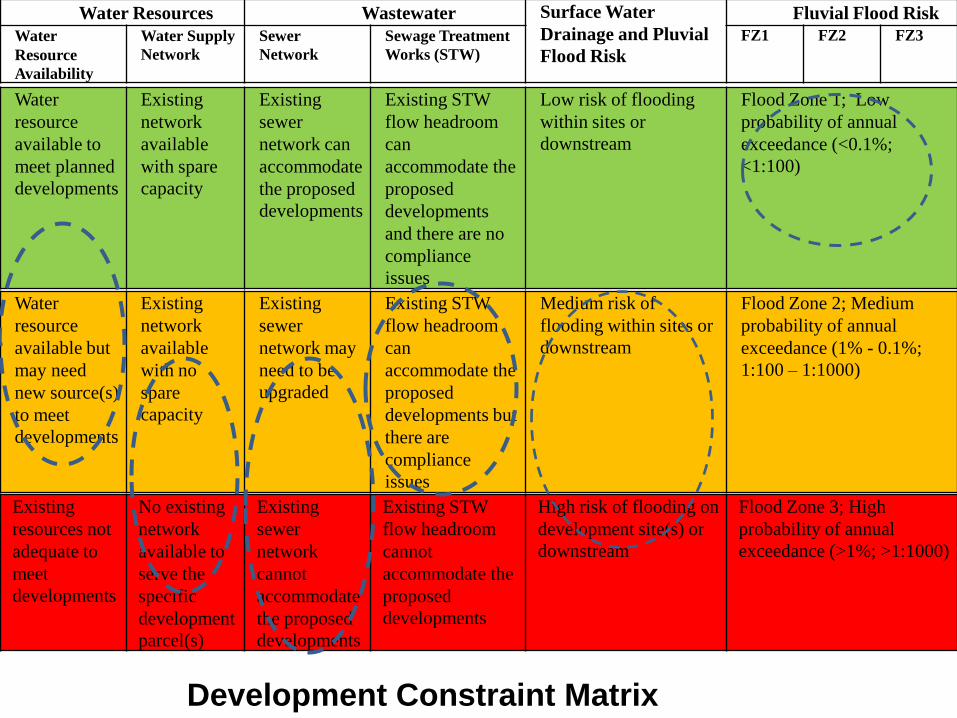
Water Resources Wastewater Surface Water
Drainage and Pluvial
Flood Risk
Fluvial Flood Risk
Water
Resource
Availability
Water Supply
Network
Sewer
Network
Sewage Treatment
Works (STW)
FZ1 FZ2 FZ3
Water
resource
available to
meet planned
developments
Existing
network
available
with spare
capacity
Existing
sewer
network can
accommodate
the proposed
developments
Existing STW
flow headroom
can
accommodate the
proposed
developments
and there are no
compliance
issues
Low risk of flooding
within sites or
downstream
Flood Zone 1; Low
probability of annual
exceedance (<0.1%;
<1:100)
Water
resource
available but
may need
new source(s)
to meet
developments
Existing
network
available
with no
spare
capacity
Existing
sewer
network may
need to be
upgraded
Existing STW
flow headroom
can
accommodate the
proposed
developments but
there are
compliance
issues
Medium risk of
flooding within sites or
downstream
Flood Zone 2; Medium
probability of annual
exceedance (1% - 0.1%;
1:100 – 1:1000)
Existing
resources not
adequate to
meet
developments
No existing
network
available to
serve the
specific
development
parcel(s)
Existing
sewer
network
cannot
accommodate
the proposed
developments
Existing STW
flow headroom
cannot
accommodate the
proposed
developments
High risk of flooding on
development site(s) or
downstream
Flood Zone 3; High
probability of annual
exceedance (>1%; >1:1000)
Development Constraint Matrix

The outputs from the outline Phase 1 UWC study should be reports that address the
following questions:
what and where are the risks from surface water flooding for development proposals and will these
developments be resilient to the effects of future climate change and the likely impacts on flood risk
drainage and water supply?
how will the effects of staged “parcel” development impact on the provision of an integrated,
sustainable drainage infrastructure?
how can rainfall-runoff and associated overland flows be managed within the development area for
extreme storm events and what is the potential for source control BMP/SUDS implementation?
are there locations that can be safely utilised for attenuation, infiltration and/or storage of
exceedance flows?
what water savings and demand management approaches can be implemented within the
developments, especially in respect of potential rainwater contributions to other components of the
urban water cycle?
will there be a water quality impact on the receiving watercourses and/or groundwater resources?
how will other outstanding concerns and uncertainties in respect of urban surface water drainage
infrastructure be addressed e.g costs, adoption, maintenance etc.?
identify any information, data, funding or policy/planning gaps and technical uncertainties that
require further exploration in a more detailed Phase 2 UCW study in conjunction with the local
development planning process.
identify procedures and supporting structures to ensure a coordinated stakeholder approach to
strategic water resource management.

Development Parcel Contributing
Area (m2)Peak (Average) Water
Demand (l/s)
Peak Wastewater
Discharge (l/s)
1 City Park 42900 22.0 50
2 Curzon Park 40470 32.5 (5.8) 314
3 Curzon Gateway 16200 6.0 (2.1) 120
4 VTP200
5 BCU 14164 105
6 Ventureast 52609 58.0 (4.5) 401
7 Masshouse 62483 (3.8) 462
8 Martineau Galleries 54997 (2.5) 407
9 Gate 18939 (6.2) 140
10 Millenium Point 48562 1.4 360
11 Multi-storey Carpark 8462 Negligble 63
12 Warwick Bar 18600 10.0 (1.0) 104
13 House
14 Typhoo Wharf 37400 (1.1) 277
15 UB40 3965 (0.5) 29
16 Aston Science Park 89030 (3.0) 659
17 Aston University 254450 (3.5)
TOTAL 77 (ha) ~106 3491
Summary of Peak Flow Data for Eastside
Water Services

Sewer
Node
Contributing
Parcel(s)Pipe Capacity Flow in Pipe
(m3/s)Surcharge
PotentialMinimum
(m3/s)
Maximum
(m3/s)
A 1,4,6,11 0.9 1.8 0.5 Unlikely
B 1,2,4,5,7,8,9,10,1
1
0.9 1.7 2.3 Probable
C 1 - 12, 14, 15 5.1 5.1 2.8 Unlikely
D 4,11 0.1 0.1 0.06 Unlikely
E 1,4 - 11 0.9 1.7 1.9 Probable
F 6 0.6 0.6 0.4 Unlikely
G 7 0.1 0.1 0.5 Probable
H 8 0.6 0.6 0.4 Unlikely
I 8,9 0.4 0.4 0.5 Probable
J 1,4,6,10,11 0.9 1.8 0.8 Unlikely
K 11 0.1 0.1 0.1 Unlikely
L 1,2,4 – 12,14,15 8.3 8.3 2.7 Unlikely
M 13 0.08 0.07 0.04 -
N 14 0.1 0.1 0.3 Probable
O 1,2, 4 - 11, 15 0.9 1.7 2.3 Probable
P 0.9 1.8 0.7 Unlikely
Peak Flows in the Eastside Surface Water
Sewer System

LANDUSE
SECTOR
RAINWATER
HARVESTING
GREYWATER
RECYCLING
Potential Payback
Time
(Years)
Potential Payback
Time
(Years)
Single residential 16 44
Shared residential 3.1 XX -
Public community
buildings
6.9 XX -
Hotels 38.4 10.5
Commercial office
buildings
? XX -
Retail buildings See Mixed use development
Industrial buildings ? ? ?
Leisure buildings 6.1 7.8
Public open space ? XX -
Mixed use
developments
? 4.1
Stormwater and Greywater Re-Use in Birmingham Eastside.
KEY: Potential; High potential; XX Negligible potential
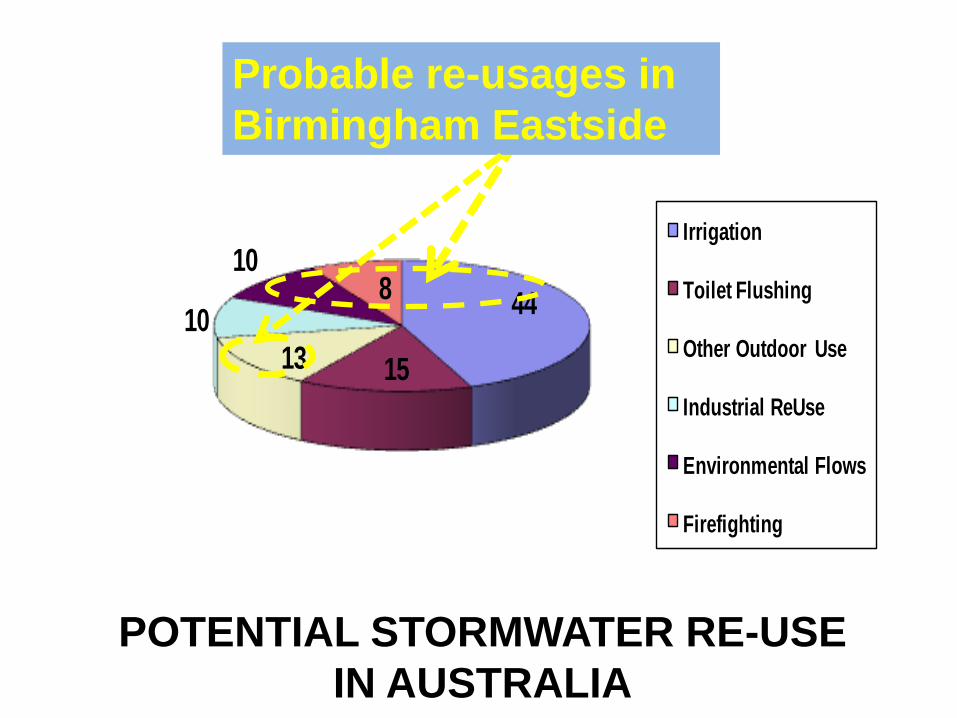
44
1513
10
108
Irrigation
Toilet Flushing
Other Outdoor Use
Industrial ReUse
Environmental Flows
Firefighting
POTENTIAL STORMWATER RE-USE
IN AUSTRALIA
Probable re-usages in
Birmingham Eastside

The STORM modelled sewered sub-catchment in Eastside

Predicted flow distribution and exceedance overflows for an extreme storm event
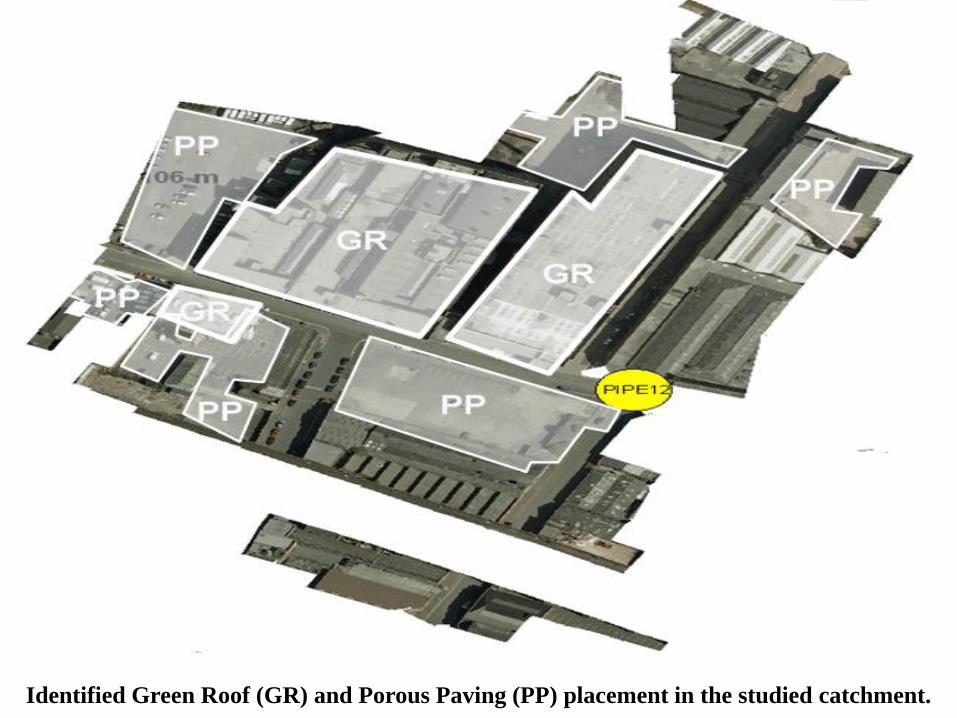
Identified Green Roof (GR) and Porous Paving (PP) placement in the studied catchment.
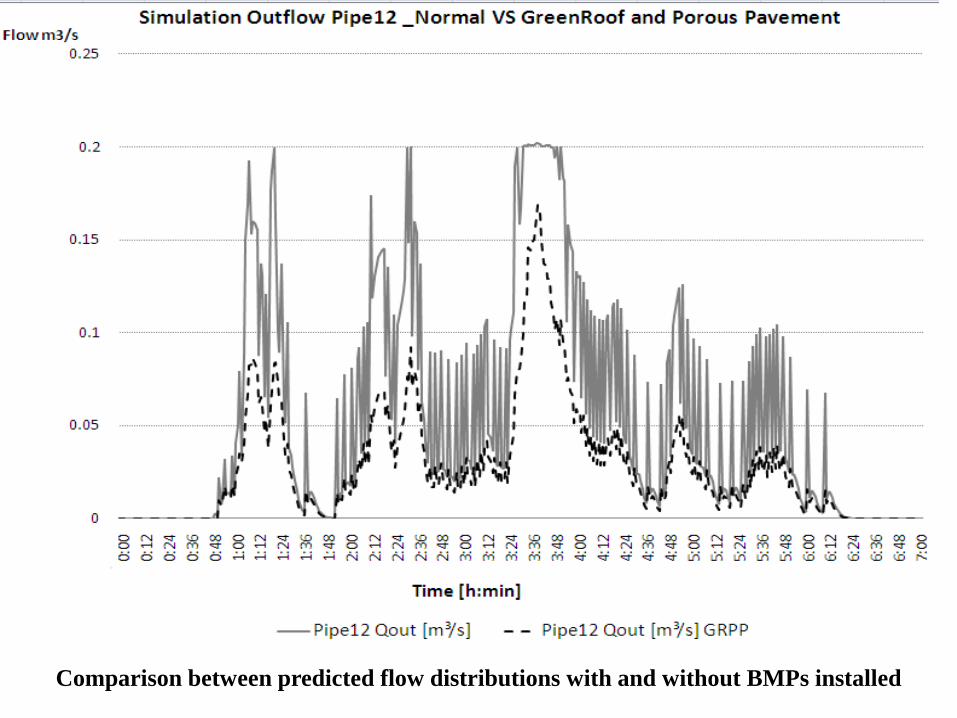
Comparison between predicted flow distributions with and without BMPs installed

FLOW (m3) FLOW
REDUCTION (%)
Time
Period
Precipitation
(mm)
Normal Green
Roof
Porous
Pavement
Green
Roof
Porous
Pavement
1am-
2am
5.6 230 169 174 26% 25%
2am-
3am
7 304 227 220 25% 28%
3am-
4am
13 568 425 410 25% 28%
4am-
5am
5 228 171 166 25% 27%
6am-
7am
3.2 143 107 104 25% 27%
7am-
8am
0.2 13 10 10 23% 22%
Birmingham Eastside BMP Runoff Volume Reductions.

CONCLUSIONS
- A preliminary Urban Water Cycle (UWC) study for the Birmingham Eastside
development area has identified that stormwater discharges can make significant
contributions to other components of the urban water cycle and to future strategic
urban water resource management
- These contributions can be at plot, site and sub-catchment levels and would
reduce water demand as well as pluvial flood and pollution risks
- The application of BMP/SUDS drainage infrastructure would substantially
reduce flood (peak flow) and pollution risks (~60% - 70%) as well as offering
recreational, amenity and other benefits
- Strategic UWC studies can make substantial inputs to flood risk assessment,
surface water management plans (SWMPs) and to wider catchment management
plans (CMPs)
- Stormwater management within an UWC is essentially a “wicked” problem
dominated by barriers at institutional and social levels reflecting the diversity of
stakeholder responsibilities and interests
- Sustainable urban water resource management requires successful stakeholder
consultation processes and delivery structures