strain gage selection criteria for textile composite materials · strain gage selection criteria...
TRANSCRIPT
i"
/
NASA Contractor Report 198286ry
Strain Gage Selection Criteria for TextileComposite Materials
John E. Masters
Lockheed Martin Engineering and Sciences Company, Hampton, Virginia
Contract NAS1-19000
February 1996
National Aeronautics and
Space AdministrationLangley Research CenterHampton, Virginia 23681-0001
https://ntrs.nasa.gov/search.jsp?R=19960015567 2018-06-03T19:50:14+00:00Z


Abstract:
Composite materials reinforced with braided, woven, knit, and
stitched fibrous preforms are emerging as potential alternatives to
unidirectional prepreg tape. A variety of these material forms are
currently being evaluated by major airframe manufacturers.
These new forms of composite materials bring with them
potential testing problems. The applicability of existing test methodsto the 2-D and 3-D braided, woven, stitched, and knit materials being
evaluated bears investigation. The overriding concern is that the
values measured are accurate representations of the true material
response.
This report will provide a review of efforts to establish a set of
strain gage selection guidelines for textile reinforced composite
materials.
A variety of strain gages were evaluated in the study to
determine the sensitivity of strain measurements to the size of the
strain gage. The strain gages were chosen to provide a range of gage
lengths and widths. The gage aspect ratio (the length-to-width ratio)was also varied.
The gages were tested on a diverse collection of textile
composite laminates. Test specimens featured eleven different
textile architectures: four 2-D triaxial braids, six 3-D weaves, and one
stitched uniweave architecture. All specimens were loaded in
uniaxial tension. The materials' moduli were measured in both the
longitudinal (parallel to the 0 ° yarns) and the transverse
(perpendicular to the 0 ° yarns) directions. The results of these
measurements were analyzed to establish the strain gage guidelines.

Introduction
NASA's Advanced Composite Technology (ACT) Program was
initiated in 1990 with the purpose of developing less costly
composite aircraft structures. A number of innovative materials and
processes have been evaluated as a part of this effort. Chief among
them are composite materials reinforced with textile preforms.
Composite laminates reinforced with continuous networks of braided,
woven, knit, or stitched fibers have been evaluated as a part of the
program. The viability of these material forms as potential
alternatives to unidirectional prepreg tape has been established as a
consequence.
These new composite material forms bring with them potentiai
testing problems. The fiber architecture plays a prime role in
determining the mechanical response of these braided, woven, and
stitched materials. Test methods currently used to evaluate
composite materials were developed for composite materials made of
unidirectional prepreg tape or simple 2-D woven fabrics. The
microstructure of these laminated composite materials differs
significantly from the textile composites evaluated in the ACT
program. Consequently, the applicability of the current test methods
to the wide range of emerging materials bears investigation. The
overriding concern is that the values measured are accurate
representations of the true material response.
A textile composite's preform architecture presents a variety of
size effects that are not encountered in tape laminates. A convenient
way to analyze a textile composite is to consider a unit cell of thematerial. A unit cell is defined as the smallest unit of repeated fiber
architecture. It may be considered the building block of the
material. The size of the unit cell is dependent on a number of
factors including the size of the yarns, the angle at which they are
intertwined or interwoven, and the intricacy of the braid or weave
pattern.
A representative volume of material must be tested and
monitored to accurately reflect true material response. Specimen
geometry and strain gage size must be reexamined in terms of unit
cell size. The effect of the sizes of the yarn bundles within the
3
preform must also be considered since they may also effect theperformance and the measurements. Specimen dimensionsestablished for tape type composites may not be applicable to textilecomposites. The degree of heterogeneity present in the lattermaterials is quite different from that encountered in the former. Thepotential effects of these differences must also be quantified.
A program to establish a set of test methods to evaluate textilecomposites was developed to address these size effect issues. Thisreport wiU provide a review of a portion of that work, the effort toestablish a set of strain gage selection guidelines for textilereinforced composite materials.
Moir6 interferometry was used to assess the degree ofheterogeneity present in textile composites [Ref. 1]. The technique,which defines deformation patterns in both the vertical andhorizontal directions, was used to define the full field strain
distribution in a variety of textile composite systems. It was appliedto specimens subjected to longitudinal and transverse tensile loading.Examples of the results obtained for a 2-D triaxially braided laminateare shown in Figures 1-5.
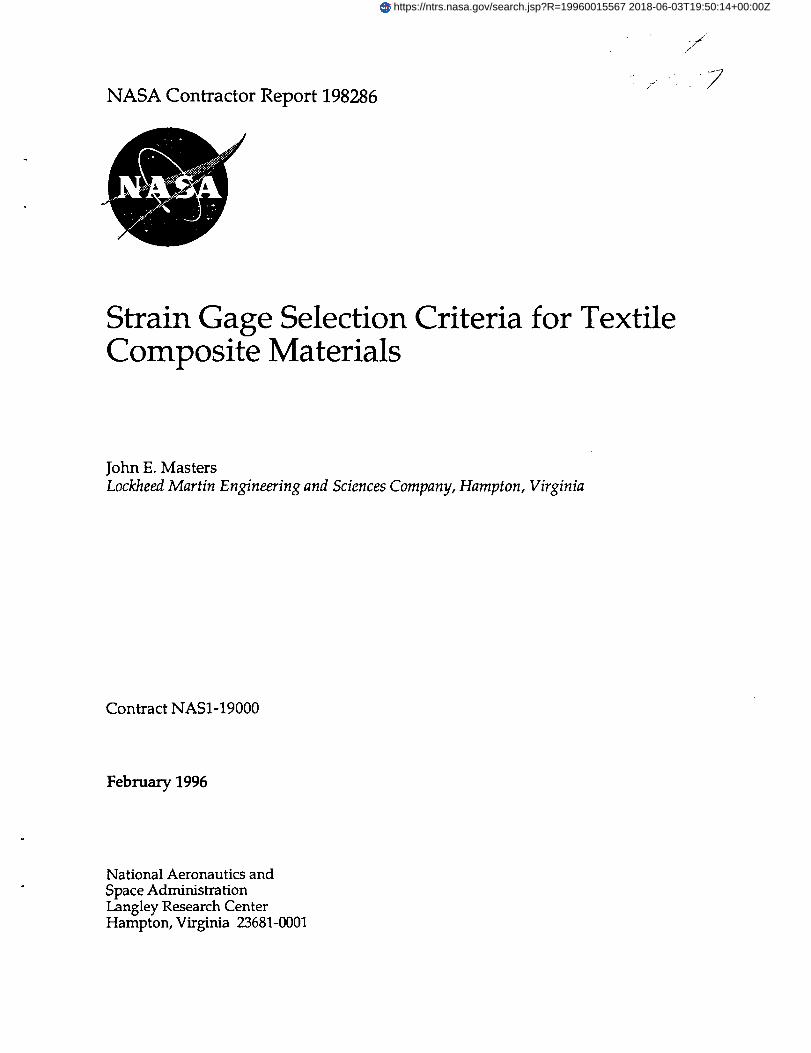
Figure i illustrates the geometry of the specimens investigatedin the interferometry studies. The vertical displacement field thatresulted when a specimen was loaded to 1200 micro-strain along the0 ° fiber direction is also shown in the figure.
The vertical displacement fields (V fields) consist of basicallyhorizontal fringes that indicate specimen extension. Points along one
fringe have been displaced vertically with respect to points along aneighboring fringe. For a uniform extension the fringes should be
evenly spaced and straight. The fringes for the specimens tested are,however, wavy and the spacing between them varies. The variationis cyclic and coincides with the repeated unit of the textilearchitecture.
4

I'q-_l 1.50 in.
©
O FiberDirection
"_1.50 in.
Vertical Displacement Field
©
Figure 1. Vertical Displacement Field in a 2-D TriaxiallyBraided Laminate Loaded in Longitudinal Tension.
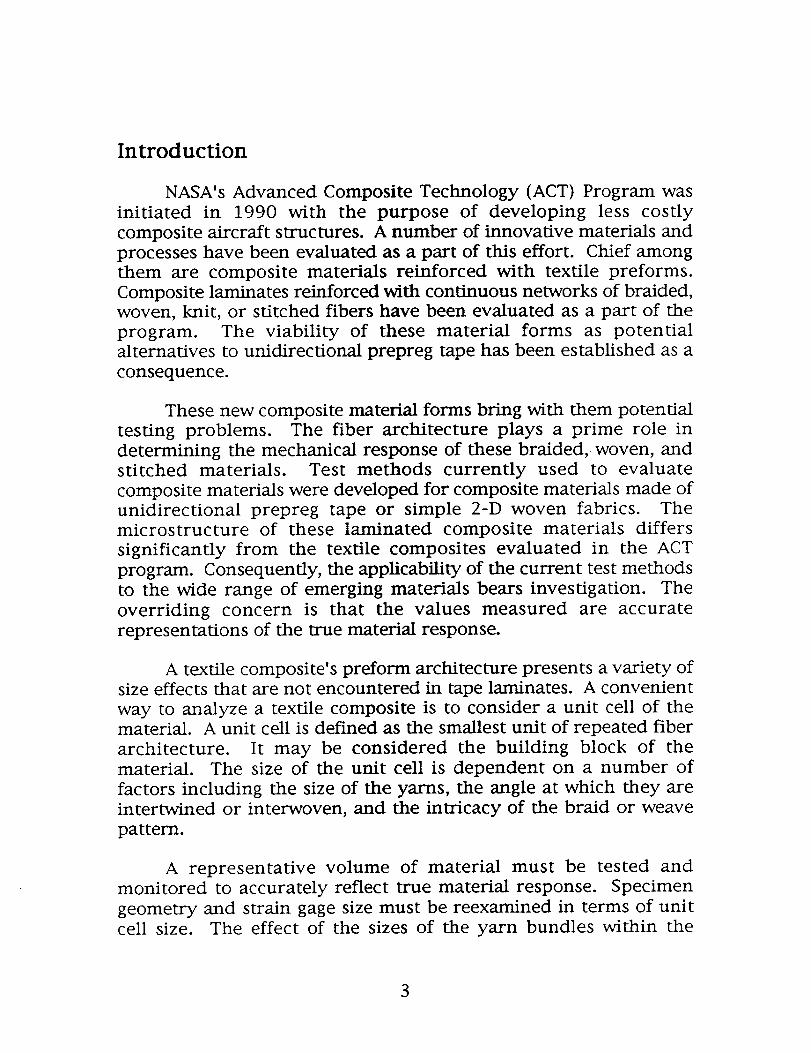
A typical horizontal displacement pattern (U field) found in
these specimens when subjected to axial tensile loading is shown inFigure 2. It consists of zigzag vertical fringes that display the
Poisson's effect. For uniform contraction the fringes should bestraight and the spacing constant. However, the fringes display acyclic variation that matches the braid geometry. The sharp kinks inthe U field fringes reveal the presence of shear strains between thefiber bundles.
5
"__ 1.50 in.
0
'_o _Fiber
Direction
-_1.50 in.
©Horizontal Displacement Field
Figure 2. Horizontal Displacement Field in a 2-D triaxiallyBraided Laminate Loaded in Longitudinal Tension.
Figure 3 shows the V and U fields of a highly magnified regionof the specimen, in each case focusing on two unit cells of material.The boundaries between adjacent fiber bundles and the outline ofthe cells are marked. The figure reveals that the shear deformationthat develops at the interfaces between the fiber bundles occurs over
a finite width. This width is illustrated in the patterns as thedistance between the closely spaced lines. This is consistent with thepresence of resin rich areas between the fiber bundles, which areabout one fifth of the width of the fiber bundle itself. The U field
shows that in the resin rich zones the shear strain, _'xy, isapproximately 0.5 times that of the average applied normal strain,
ey. Additionally, the U field shows that the Poisson effect was nearly
constant across the unit cell. The V displacement pattern clearly
shows that the ey strain varies significantly within each unit cell as
can be seen by the nonuniform fringe spacing. The ratio of
6
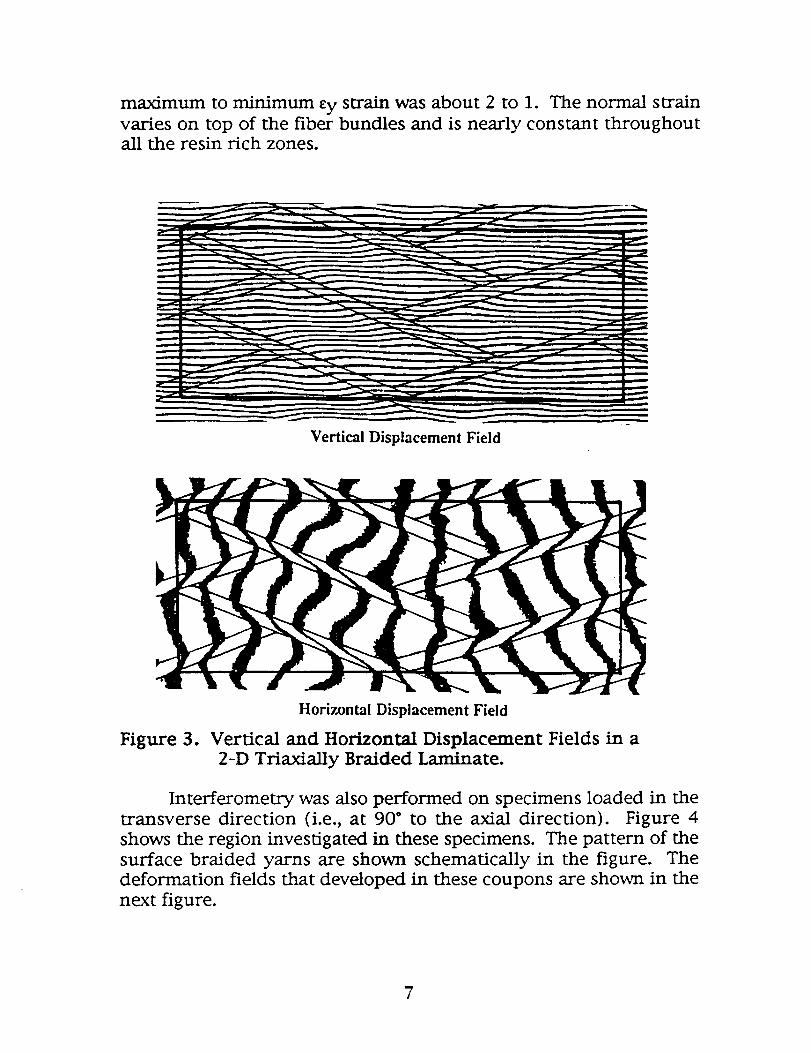
maximum to minimum ey strain was about 2 to 1. The normal strainvaries on top of the fiber bundles and is nearly constant throughoutall the resin rich zones.
Vertical Displacement Field
Horizontal Displacement Field
Figure 3. Vertical and Horizontal Displacement Fields in a2-D Triaxially Braided Laminate.
Interferometry was also performed on specimens loaded in thetransverse direction (i.e., at 90* to the axial direction). Figure 4
shows the region investigated in these specimens. The pattern of thesurface braided yarns are shown schematically in the figure. Thedeformation fields that developed in these coupons are shown in the
next figure.
7

In general, the interferometry results indicate that greatervariations in normal and shear strains existed in specimens loaded inthe transverse direction than in the axial direction.
0° FiberDirection
©
©
Figure 4. Test Specimen and Fiber Architecture of a 2-DTriaxially Braid Loaded in Transverse Tension.
Figure 5 displays the vertical displacement field for a coupon
loaded in the transverse direction. The locations of the yarns areevident in the vertical displacement fringe patterns. The sudden jogsin the fringes represent strong shear strains in the resin rich regions
8
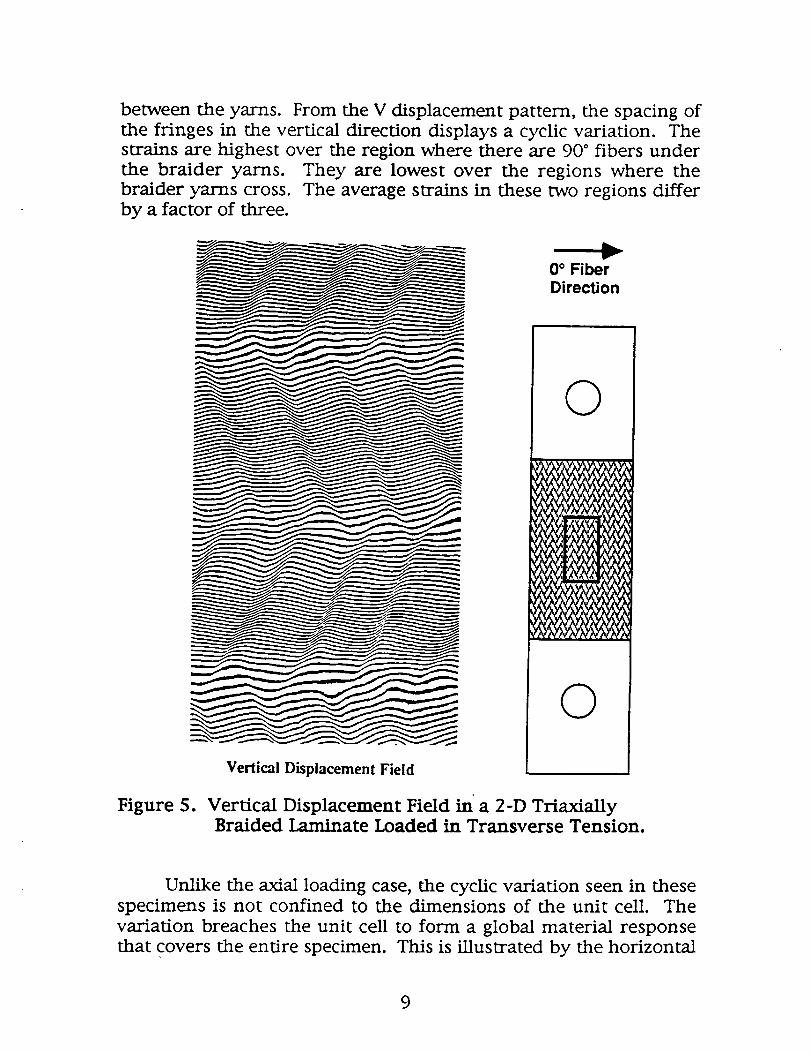
between the yarns. From the V displacement pattern, the spacing ofthe fringes in the vertical direction displays a cyclic variation. Thestrains are highest over the region where there are 90 ° fibers underthe braider yarns. They are lowest over the regions where thebraider yarns cross. The average strains in these two regions differby a factor of three.
0° FiberDirection
Figure 5.
©
©
Vertical Displacement Field
Vertical Displacement Field in a 2-D TriaxiallyBraided Laminate Loaded in Transverse Tension.
Unlike the axial loading case, the cyclic variation seen in thesespecimens is not confined to the dimensions of the unit cell. The
variation breaches the unit cell to form a global material responsethat covers the entire specimen. This is illustrated by the horizontal
9
bands seen in the figure. They span several unit cells and extendacross the specimen width.
The preceding figures illustrate the significance of thevariations in displacement field homogeneity that have beenidentified in braided textile composite specimens. Test specimensmust, therefore, be designed to encompass representative volumes ofmaterial within their test sections to obtain characteristic measures
of mechanical response. The size and type of instrumentation usedplays a similarly critical role in obtaining accurate measurements.
There are, of course, two common methods of instrumentingtest specimens: strain gages and extensometers. Extensometers
provide a more global measure of material response and will costless in the long run since they are reusable. They are, however, notapplicable to all test situations. For example, although suitable forcoupon testing, extensometers cannot be easily mounted to large testpanels. They can also be limiting since the specimens cannot behandled once the extensometers have been mounted, as this would in
most cases disturb the continuity of their measurements. Straingages are more versatile; they can be applied to a wider variety oftest situations. They are permanently affixed to the specimen and,therefore, permit its removal from the test machine for inspection,etc. Strain gages do, however, provide only a local measure of thematerial response and are, therefore, subject to local inhomogeneity.In particular, the local displacement fields that develop in textile
composites present a special challenge to strain gage usage. Thislatter problem was one of the subjects of this investigation.
A series of tensile tests was conducted to establish
performance levels of extensometers and strain gages on textilecomposites and to determine the sensitivity of strain measurementsto the size of the strain gage. This report will review the results ofthat study.
The following sections include descriptions of the materialsinvestigated in the study, the experimental procedures employed,and the test specimen geometries and strain gages used. Adiscussion of the experimental results will then be presented. This isfollowed by a summary that discusses instrumentation practices anddefines swain gage selection criteria for textile composite materials.
10
Materials Investigated
The program investigated the three material types evaluated in
Phase B of the ACT Program: 2-D triaxial braids, through-the-
thickness weaves, and stitched uniwoven laminates. The braided
and woven laminates featured braided AS-4 yarns that were
impregnated with Shell 1895 epoxy resin. The stitched laminates
featured AS-4 fibers and Hercules 3501-6 epoxy resin.
Braided Material
In a triaxially braided preform three yarns are intertwined toform a single layer of 0°/ + O° material. In this case, the braided
yarns are intertwined in a 2 x 2 pattern. Each + O yarn crosses
alternatively over and under two - O yarns and vice verse. The 0 °
yarns were inserted between the braided yarns. This yields a two-
dimensional material; there is not through-the-thickness
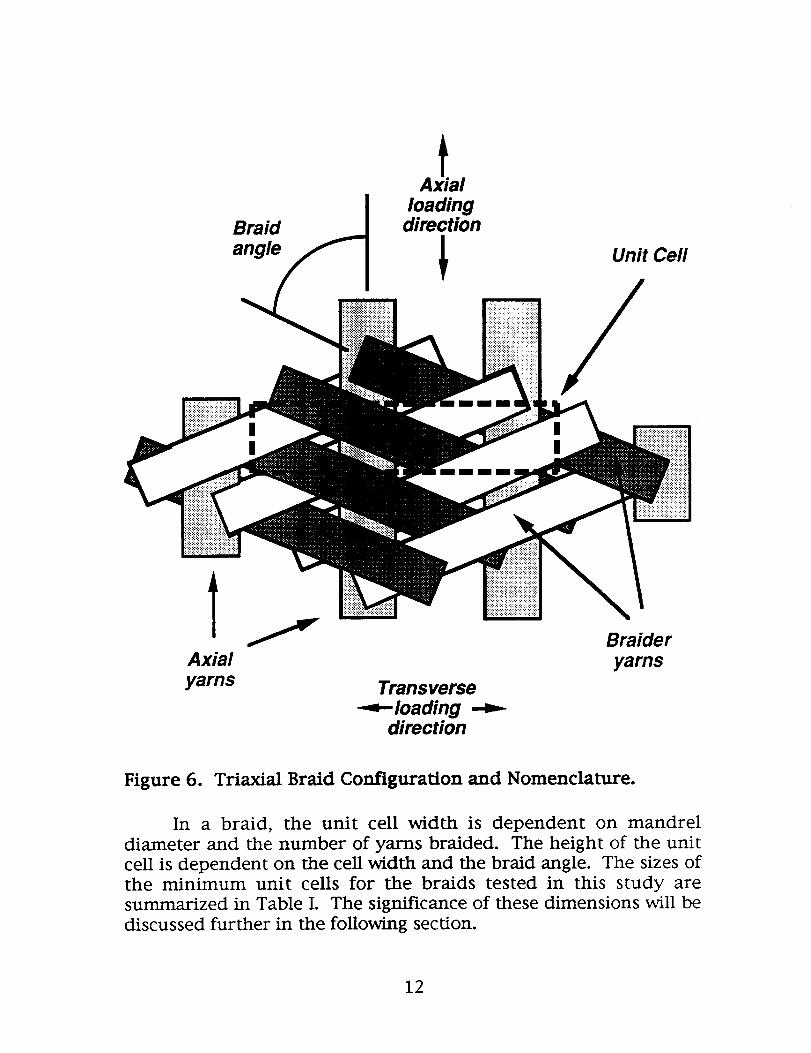
reinforcement. Figure 6 schematically illustrates the fiber
architecture and establishes the nomenclature used in the paper.
The yarns were braided over a cylindrical mandrel. The
desired preform thickness was achieved by overbraiding layers;
there are no through-the-thickness fibers. After braiding, the
preforms were removed from the mandrel, slit along the 0 ° fiber
direction, flattened, and border stitched to minimize fiber shifting.
The resin was introduced through a resin transfer molding process.
The figure shows a repeatable unit of the braid architecturethat is sometimes referred to as the braid's natural unit cell. As was
stated earlier, a unit cell is a repeatable unit of fabric geometry. It
represents the complete yarn or tow intertwinement pattern. It is
desirable, for analysis purposes, to define the smallest unit cell
possible. Rectangular unit cells are also preferable. The box outlinedwithin the rhombic unit cell defines the smallest unit cell for a 2/2
triaxial braid.
11
Braidangle
loadingdirection
Unit Cell
//
Axial
yarns Trans verse-_-ioading
direction
Braider
yarns
Figure 6. Triaxiai Braid Configuration and Nomenclature.
In a braid, the unit cell width is dependent on mandrel
diameter and the number of yarns braided. The height of the unit
cell is dependent on the cell width and the braid angle. The sizes of
the minimum unit cells for the braids tested in this study are
summarized in Table I. The significance of these dimensions will be
discussed further in the foUowing section.
12
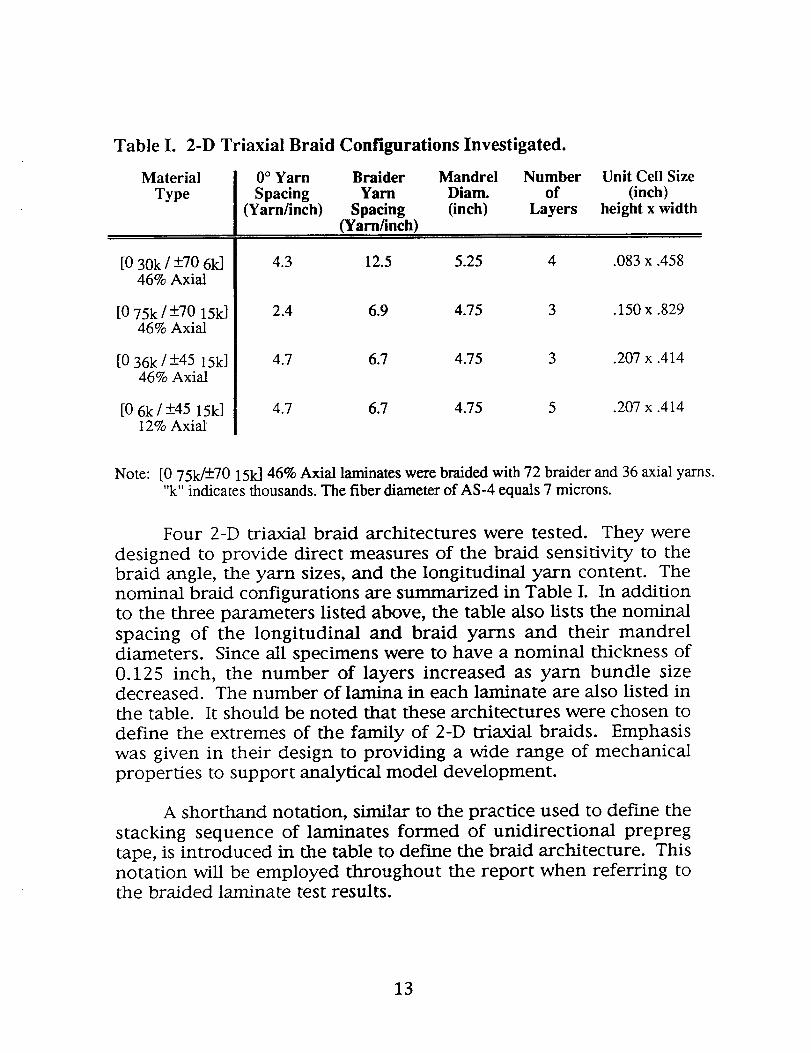
Table I. 2-D Triaxial Braid Configurations Investigated.
Material
Type
[0 30k / +70 61(]46% Axial
[0 75k / +70 15k]46% Axial
[0 36k / +45 15k]46% Axial
[0 6k / +45 15k]12% Axial
0° Yarn Braider Mandrel Number Unit Cell Size
Spacing Yarn Diam. of (inch)(Yarn/inch) Spacing (inch) Layers height x width
(Yarn/inch)
4.3 12.5 5.25 4 .083 x .458
2.4 6.9 4.75 3 .150 x .829
4.7 6.7 4.75 3 .207 x .414
4.7 6.7 4.75 5 .207 x .414
Note: [0 75k/+70 15k] 46% Axial laminates were braided with 72 braider and 36 axial yarns."k" indicates thousands. The fiber diameter of AS-4 equals 7 microns.
Four 2-D triaxial braid architectures were tested. They were
designed to provide direct measures of the braid sensitivity to the
braid angle, the yarn sizes, and the longitudinal yarn content. The
nominal braid configurations are summarized in Table I. In addition
to the three parameters listed above, the table also lists the nominal
spacing of the longitudinal and braid yarns and their mandrel
diameters. Since all specimens were to have a nominal thickness of
0.125 inch, the number of layers increased as yarn bundle sizedecreased. The number of lamina in each laminate are also listed in
the table. It should be noted that these architectures were chosen to
define the extremes of the family of 2-D triaxial braids. Emphasis
was given in their design to providing a wide range of mechanical
properties to support analytical model development.
A shorthand notation, similar to the practice used to define the
stacking sequence of laminates formed of unidirectional prepreg
tape, is introduced in the table to define the braid architecture. This
notation will be employed throughout the report when referring to
the braided laminate test results.
13

The proposed notation is
[0 ° xk / + e ° yk] N% Axial
where: O indicates the braid angle,
x indicates the number of fibers in the axial yarn bundles,
y indicates the number of fibers in the braided yarn
bundles,
k indicates thousands, and
N indicates the percentage by volume of axial yarns in the
preform
The braided laminates tested were cut from eight separate
laminates. The thicknesses, fiber content, and resin contents of each
plate are listed in Table II. As the table indicates, the fiber content
varied significantly in several of the plates. These variations must
be considered when reviewing the test results.
Table II. 2-D Triaxial Braid Laminate Fiber and Resin Content.
Material PreviousBraidCode
[0 30k / +70 6k ] SLL46 % Axial
[0 75k / +70 15k ] LLL46 % Axial
[0 36k / +45 15k ] LLS46 % Axial
[0 6k / +45 15k ] LSS12 % Axial
Specimen Thickness Fiber ResinNumber (inch) Content Content
(Volume %) (Volume %)
12 PH2 .232 55.3 45.4
13 PH .220 57.8 42.3
14 PH2 .229 59.4 40.7
15 PH .234 54.6 45.6
7 PH4 .222 58.4 41.4
8 PH .251 53.6 46.2
10 TUT .225 56.4 43.7
11 PH .226 57.1 42.5
Note: The laminates listed in the table have been the subject of several investigations. Athree letter code has often been used to identify the laminates in thoseinvestigations. Their designations in that code are given here for completeness.
14
Woven Material
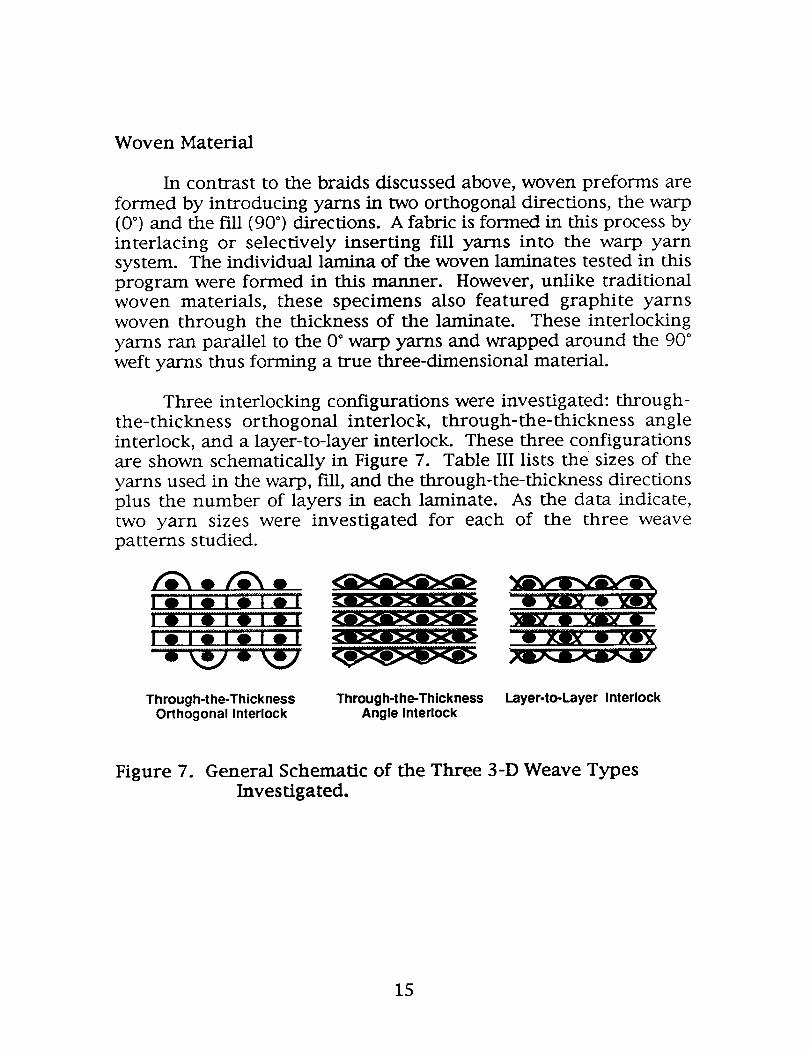
In contrast to the braids discussed above, woven preforms areformed by introducing yarns in two orthogonal directions, the warp(0 °) and the fill (90 °) directions. A fabric is formed in this process byinterlacing or selectively inserting fill yarns into the warp yarnsystem. The individual lamina of the woven laminates tested in thisprogram were formed in this manner. However, unlike traditionalwoven materials, these specimens also featured graphite yarnswoven through the thickness of the laminate. These interlocking
yarns ran parallel to the 0 ° warp yarns and wrapped around the 90 °weft yarns thus forming a true three-dimensional material.
Three interlocking configurations were investigated: through-the-thickness orthogonal interlock, through-the-thickness angleinterlock, and a layer-to-layer interlock. These three configurationsare shown schematically in Figure 7. Table III lists the sizes of the
yarns used in the warp, f'fll, and the through-the-thickness directionsplus the number of layers in each laminate. As the data indicate,two yarn sizes were investigated for each of the three weavepatterns studied.
_o_o
IOIOIOIOIk'"'_ l 0 U--o n Oil"-o i_i o i o n
i
_ah ab O
'o
• • r.,_qp.x-O_x
Through-the-ThicknessOrthogonal Interlock
Through-the-ThicknessAngle Interlock
Layer-to-Layer Interlock
Figure 7. General Schematic of the Three 3-D Weave TypesInvestigated.
15
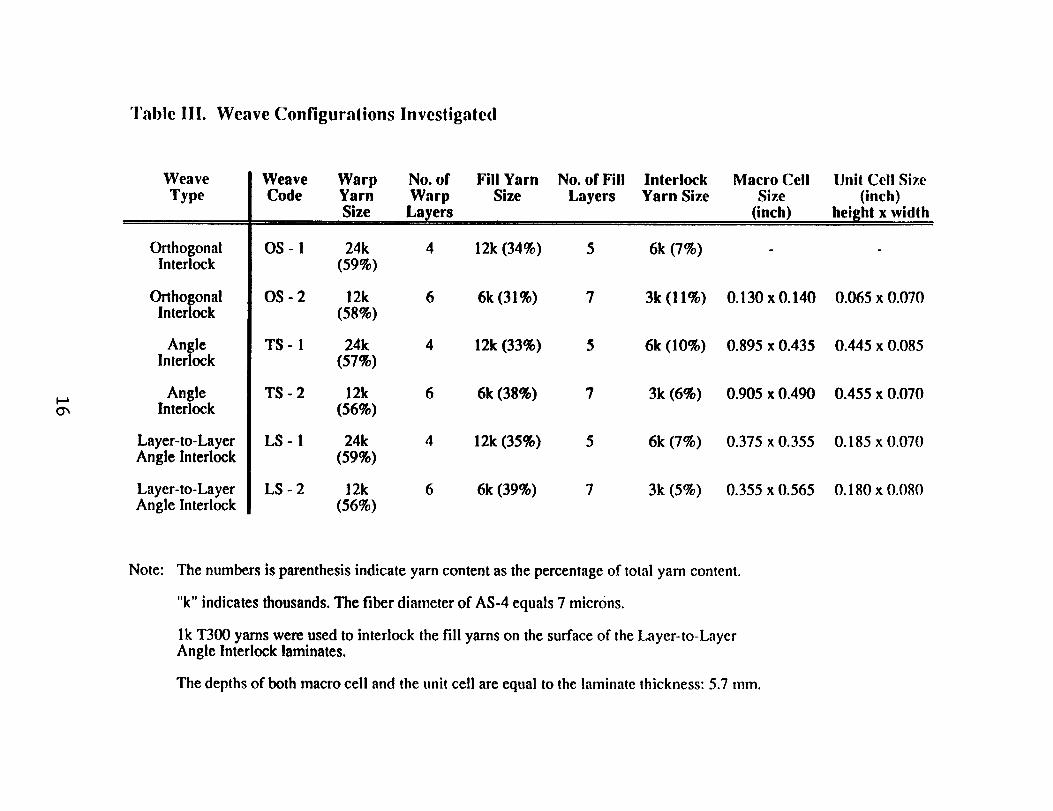
Table III. Weave Configuralions Invesligaled
Weave
Type
OrthogonalInterlock
OrthogonalInterlock
AngleInterlock
AngleInterlock
Layer-to-LayerAngle Interlock
Layer-to-LayerAngle Interlock
Weave Warp No. of Fill Yarn No. of Fill Interlock Macro CellCode Yarn Warp Size Layers Yarn Size Size
. Size Layers (inch)
OS - 1 24k 4 12k (34%) 5 6k (7%)(59%)
OS-2 12k 6 6k (31%) 7 3k (11%) 0.130 x 0.140(58%)
TS - 1 24k 4 12k (33%) 5 6k (10%) 0.895 x 0.435(57%)
TS - 2 12k 6 6k (38%) 7 3k (6%) 0.905 x 0.490(56%)
LS- 1 24k 4 12k (35%) 5 6k (7%) 0.375 x 0.355(59%)
LS - 2 12k 6 6k (39%) 7 3k (5%) 0.355 x 0.565(56%)
Unit Cell Size
(inch)
height x width
0.065 x 0.070
0.445 x 0.085
0.455 x 0.070
0.185 x 0.070
O. 180 x 0.080
Note: The numbers is parenthesis indicate yarn content as the percentage of total yarn content.
"k" indicates thousands. The fiber diameter of AS-4 equals 7 microns.
lk T300 yarns were used to interlock the fill yarns on the surface of the Layer-to-LayerAngle Interlock laminates.
The depths of both macro cell and the unit cell are equal to the laminate thickness: 5.7 ram.
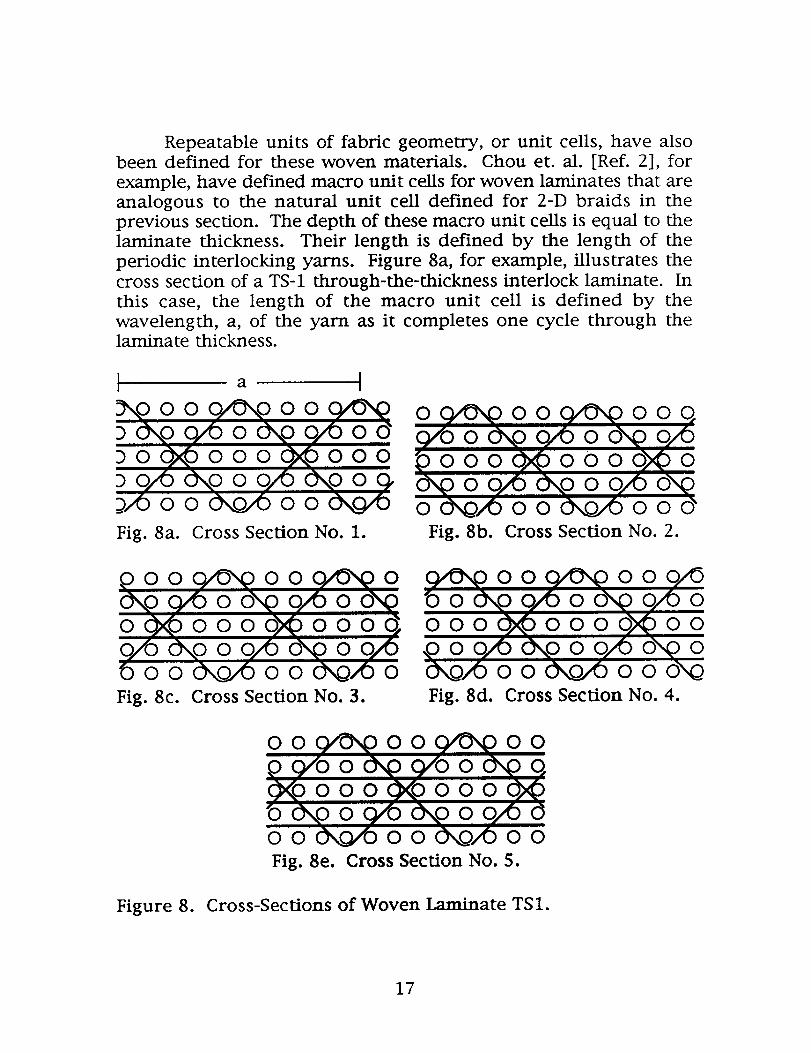
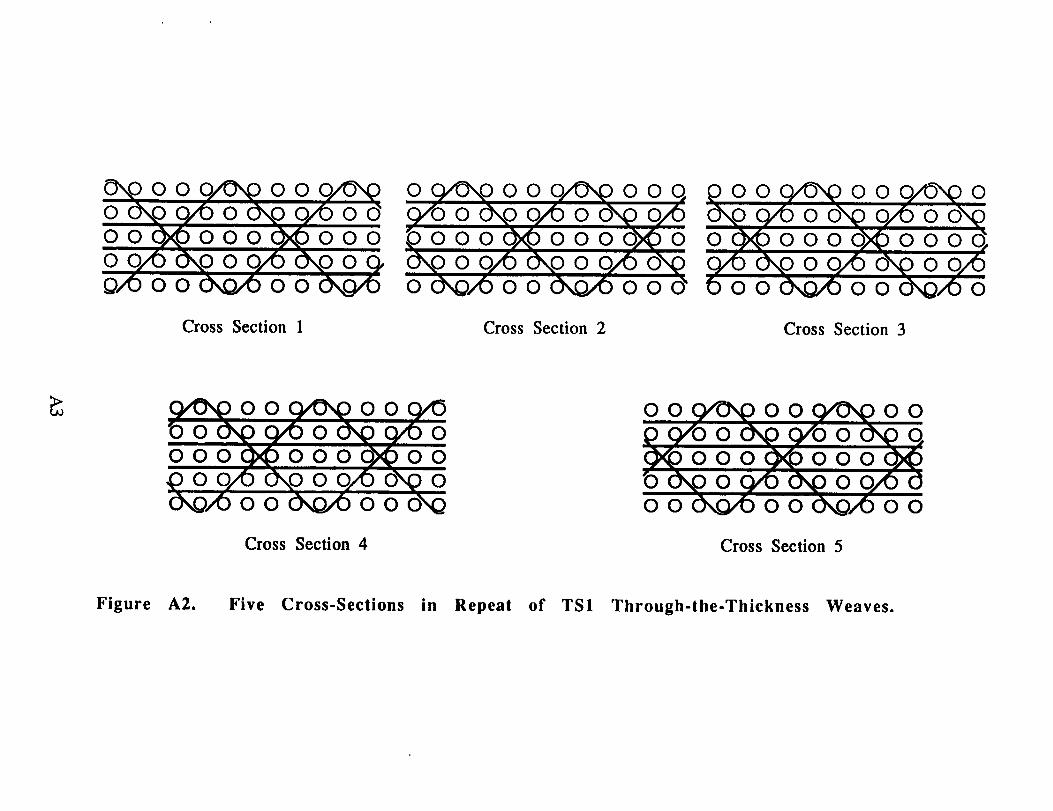
Repeatable units of fabric geometry, or unit cells, have alsobeen defined for these woven materials. Chou et. al. [ReL 2], forexample, have defined macro unit cells for woven laminates that areanalogous to the natural unit cell defined for 2-D braids in theprevious section. The depth of these macro unit cells is equal to thelaminate thickness. Their length is defined by the length of theperiodic interlocking yarns. Figure 8a, for example, illustrates thecross section of a TS-1 through-the-thickness interlock laminate. Inthis case, the length of the macro unit cell is defined by thewavelength, a, of the yarn as it completes one cycle through thelaminate thickness.
I a I
o 9,0,9 o o 9/o',p o o o,9,'0 o o',p 9/0 o o',,@o/o
Do ooo ooo _ o o o @qoo o o o::_ oo o 0 o _ _ o o _ o"9 o 9/0 _o o 9,o 0"9
_/o o o _ o o o,,,g/o o ox,o/O o o _ o oFig. 8a. Cross Section No. 1. Fig. 8b. Cross Section No. 2.
_ o o 9,v'9 o o 9,v'9 o oo oooo,,,o9,0 o 0",9o/o o o',9 oo oo oo o oo_oooo_oooc_ ooo oooo oo9/0 o,,,oo o/o o\,oo o,,,o0 o o OxO/Oo o oXo,,Oo _Fig. 8c. Cross Section No. 3. Fig. 8d. Cross Section No. 4.
Fig. 8e. Cross Section No. 5.
Figure 8. Cross-Sections of Woven Laminate TS1.
17

In practice, the patterns of the yarns woven through thelaminate's thickness, as shown in Figure 8a, are staggered across thewidth of the material. To demonstrate, Figure 8 illustrates fiveadjacent cross-sections of a TS-1 laminate. As the figure illustrates,the relative positions of the through-the-thickness yarns vary ateach cross-section. The yarns would return to the positions shown inFigure 8a if a sixth cross section were illustrated. The widths of themacro cells were defined by the number of units required tocomplete this cycle. Schematic cross sections of the six interlockingweaves investigated in this study are illustrated in Appendix A. Thewavelengths of the yarns woven through the laminates' thicknessesare illustrated in the figures. The relative positions of these yarns inthe adjacent laminate cross sections are also illustrated.
The Table III lists the dimensions of macro unit cells for thewoven materials investigated. The values listed in the table wereexperimentally determined through direct measurements ofsectioned laminates [Ref. 2].
As in the case of the 2-D triaxial braids, smaller unit cells mayalso be defined within the macro cells of the woven laminates. Forthe woven laminates investigated in this study, they are defined asone half the interlocking yarn's wavelength, a/2. Their widths aredetermined by dividing the macro cell's width by the number ofsections required to complete the cycle, i.e., five for the TS-1 and LS-1 laminates, seven for the TS-2 and LS-2 laminates, and four or twofor the OS-1 and OS-2 laminates, respectively. The dimensions ofthese smaller, building block unit cells are also listed in Table III foreach weave architecture.
Like the braided laminates, samples of the woven laminatestested were cut from several different plates. The fiber and resincontents of each plate were determined experimentally. The resultsof these measurements are given in Table W.
18
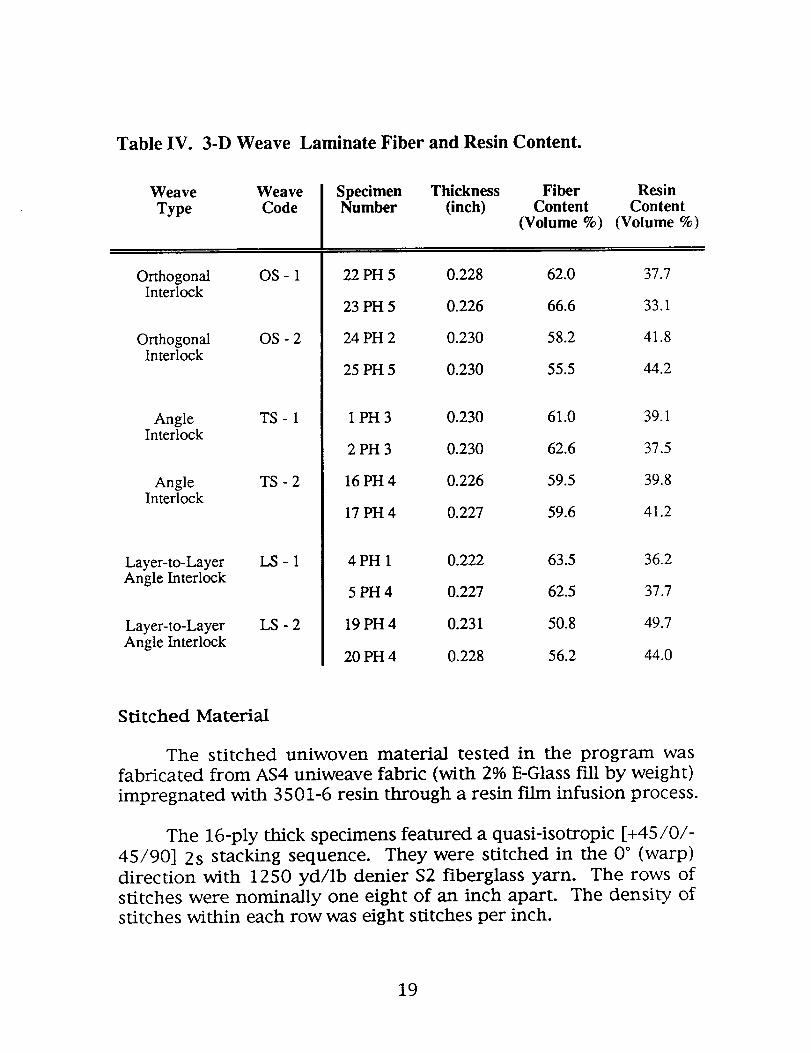
Table IV. 3-D Weave Laminate Fiber and Resin Content.
Weave Weave
Type Code
Orthogonal OS- 1Interlock
Orthogonal OS - 2Interlock
Angle TS- 1Interlock
Angle TS - 2Interlock
Layer-to-Layer LS - 1Angle Interlock
Layer-to-Layer LS - 2Angle Interlock
Specimen Thickness Fiber ResinNumber (inch) Content Content
(Volume %) (Volume %)
22 PH 5 0.228 62.0 37.7
23 PH 5 0.226 66.6 33.1
24 PH 2 0.230 58.2 41.8
25 PH 5 0.230 55.5 44.2
1 PH 3 0.230 61.0 39.1
2 PH 3 0.230 62.6 37.5
16 PH 4 0.226 59.5 39.8
17 PH 4 0.227 59.6 41.2
4 PH 1 0.222 63.5 36.2
5 PH 4 0.227 62.5 37.7
19 PH 4 0.231 50.8 49.7
20 PH 4 0.228 56.2 44.0
Stitched Material
The stitched uniwoven material tested in the program wasfabricated from AS4 uniweave fabric (with 2% E-Glass fill by weight)
impregnated with 3501-6 resin through a resin f'flm infusion process.
The 16-ply thick specimens featured a quasi-isotropic [+45/0/-45/90] 2s stacking sequence. They were stitched in the 0 ° (warp)direction with 1250 yd/lb denier $2 fiberglass yarn. The rows of
stitches were nominally one eight of an inch apart. The density ofstitches within each row was eight stitches per inch.
19
Test Specimens and Experimental Procedures.
Samples of the material systems described above were loadedin uniaxial tension. The materials' performance was measured inboth the longitudinal (parallel to the 0* yarns) and the transverse(perpendicular to the 0* yarns) directions.
Test Specimen Geometry
Forty-two specimens were tested in the program. A paucity ofmaterial limited the study to four specimens, two axial and twotransverse, per material type. The longitudinal or axial tensionspecimens were 1.5 inches wide and 10.0 inches long. Thetransverse tension specimens were 1.5 inches wide and 7.0 incheslong. All the braided and woven specimens tested in this study werenominally 0.250 inch thick; the stitched specimens had a nominalthickness of 0.125 inch Strain measurements were made over a 3
inch long section centered along the length of the specimen.
Strain Gages Investigated.
Six strain gage types were investigated in this study. Theywere chosen to provide a range of gage lengths and widths. They
ranged in length from 0.125 inch to 0.500 inch; their widths rangedfrom 0.062 inch to 0.500 inch. Three of the gages featured square
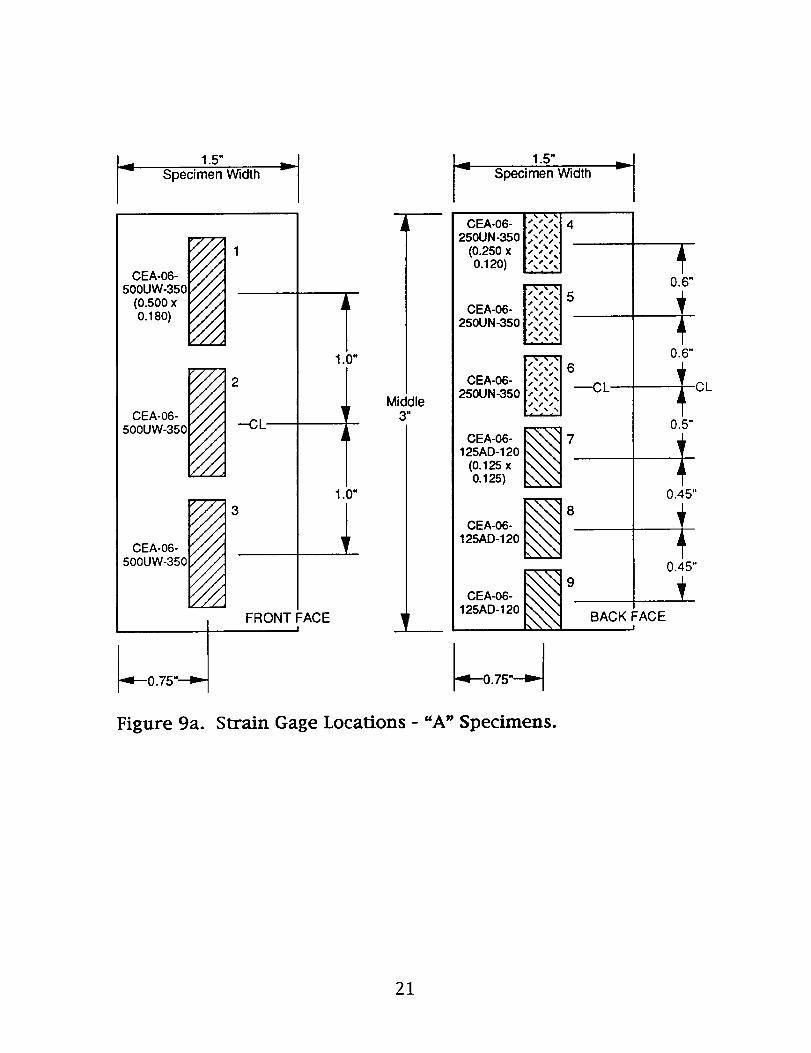
grids; three had rectangular grids. The length-to-width ratio of allthe rectangular gages was approximately 2 to 1. Nine strain gages(three of each type) were mounted on each specimen; six on one sideand three on the other. The location of each gage on the test
specimens is illustrated schematically in Figure 9.
Table V lists the gages used along with their dimensions,resistances, and the cost per package of five gages.
In addition to the strain gages, two extensometers weremounted on each specimen prior to testing. The extensometers,which had a 1.0 inch gage section, were mounted on opposite edgesof the specimens' test section. They provide a global measure of thematerials' response. Since the 1.0 inch gage sections spanned manyunit cells, these measurements were less sensitive to local variationsin fiber architecture and to local displacement field inhomogeneity.The extensometer measurements will be used as a benchmark; the
strain gage measurements will be compared to these results.
20
1°5 _t =....._
Specimen Width
CEA-06-500UW-350
(0.500 x0.180)
CEA-06-50OUW-350
CEA-O6-500UW-350
"--" 1
r/ /,_
f //._
_'i!,t
"///,'////l/t
////
///// / f
/ / / .,,
,4_0.75"--_,-
2
--CL
3
1.0"
l
i
-]
FRONT FACEI
Middle3"
1.5"
Specimen Width
.,%,%/%
CEA-06- ,,,,250UN-350 ,,',","U(0.250 x -',',"
0.120) "'"'"
CEA-06-250UN-350
CEA-06- D250UN-350
CEA-06- _
125AD-120
(o.125 x0.125)
CEA-06- D125AD-120
CEA-06- _125AD-120
6
--CL
7
CL
BACK FACE!
Figure 9a. Strain Gage Locations - "A" Specimens.
21

L, 1.5"
_ Specimen Width
EA-06- _X",X"_ 1
125BZ-350 I,,,_X,,](0.250 x I_'_'xl0.062)
EA-06- _ 2125BZ-350
EA-06- _ 3125BZ-350 --"CL
EA-06- I_.._.._.._,_.1
250AE- ,'.,'...-..-..'. 4350 ,",',',%."
(0.250 x """"*"""""0.250) "-%'-%'?"_"?
I;';';';';'1
EA-06- ,,",.",.",.",."5250AE- -","-"."-"
j%#_j%_,% s %
350 ,.%.-,,, %.,
I;';';';';'1
EA-06- _,,_, 6
S% e% s%#,%_, %
350 ,._,, , , ,
°i" M ,e
°io;_
FRONT FACE __
1.5" ""- iSpecimen Width
.__7EA-06-
50_)E
(o.5oo_'///////A
0.500)
EA-06- _ 8
50_5_E- -CL
9
1.0"
BACK FACE!
Figure 9b. Strain Gage Locations - =B" Specimens.
22
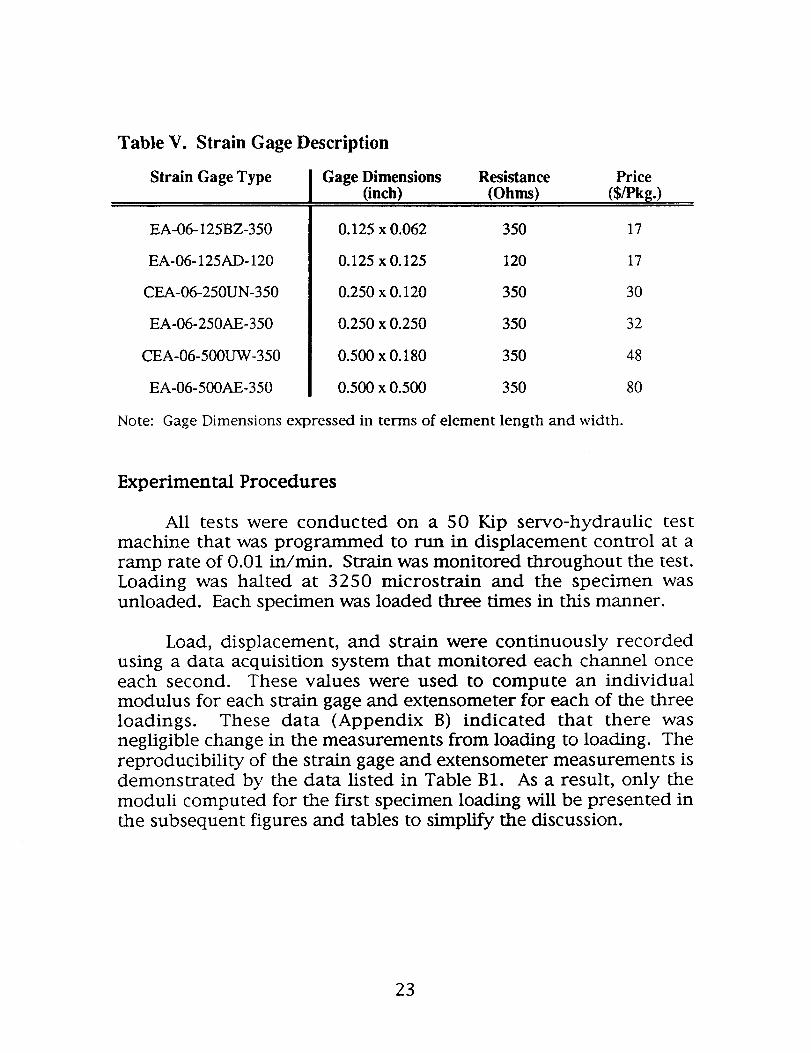
Table V. Strain Gage Description
Strain Gage Type
EA-06-125BZ-350
EA-06-125AD- 120
CEA-06-250UN-350
EA-06-250AE-350
CEA-06-500UW-350
EA-06-500AE-350
Note:
Gage Dimensions Resistance Price(inch) (Ohms) (S/Pkg.)
0.125 x 0.062 350 17
0.125 x 0.125 120 17
0.250 x 0.120 350 30
0.250 x 0.250 350 32
0.500 x 0.180 350 48
0.500 x 0.500 350 80
Gage Dimensions expressed in terms of element length and width.
Experimental Procedures
All tests were conducted on a 50 Kip servo-hydraulic testmachine that was programmed to run in displacement control at aramp rate of 0.01 ixt/min. Strain was monitored throughout the test.Loading was halted at 3250 microstrain and the specimen wasunloaded. Each specimen was loaded three times in this manner.
Load, displacement, and strain were continuously recordedusing a data acquisition system that monitored each channel onceeach second. These values were used to compute an individualmodulus for each strain gage and extensometer for each of the three
loadings. These data (Appendix B) indicated that there wasnegligible change in the measurements from loading to loading. The
reproducibility of the strain gage and extensometer measurements isdemonstrated by the data listed in Table B1. As a result, only themoduli computed for the first specimen loading will be presented in
the subsequent figures and tables to simplify the discussion.
23
Experimental Results
Braided Material
The longitudinal and transverse tension test results obtainedfor the 2-D braid materials are given in Tables VI and VII,
respectively. The tables list the average moduli measured by eachtype of strain gage and the standard deviations of thesemeasurements. In the case of the strain gage data, the modulicomputed for each of the three gages of that size were averagedtogether. The coefficients of variation of these measurements aregiven in parenthesis in the tables. The average moduli measured
using the two edge mounted extensometers are included in the tablesfor comparison. The standard deviations of the extensometermeasurements were not computed since only two values wereobtained per test.
In most cases the materials' moduli were computed over the1000 to 3000 microstrain region of the stress-strain curves. Theslopes of the curves were established through linear regression tothe data. The lone exceptions among the 2-D braided materials werethe [0 75k / _+70 15k] 46% Axial laminates. They apparently
developed damage at approximately 2500 microstrain. The moduliin these cases were computed over narrower strain ranges tomeasure the undamaged material response.
A discussion of these test results is necessarily restricted toqualitative assessments due to the limited amount of data available.
Only three replicate gages could be mounted on the specimens andonly two specimens were available for each material type.Qualitative assessments are, however, possible and general trends inthe data are apparent.
24
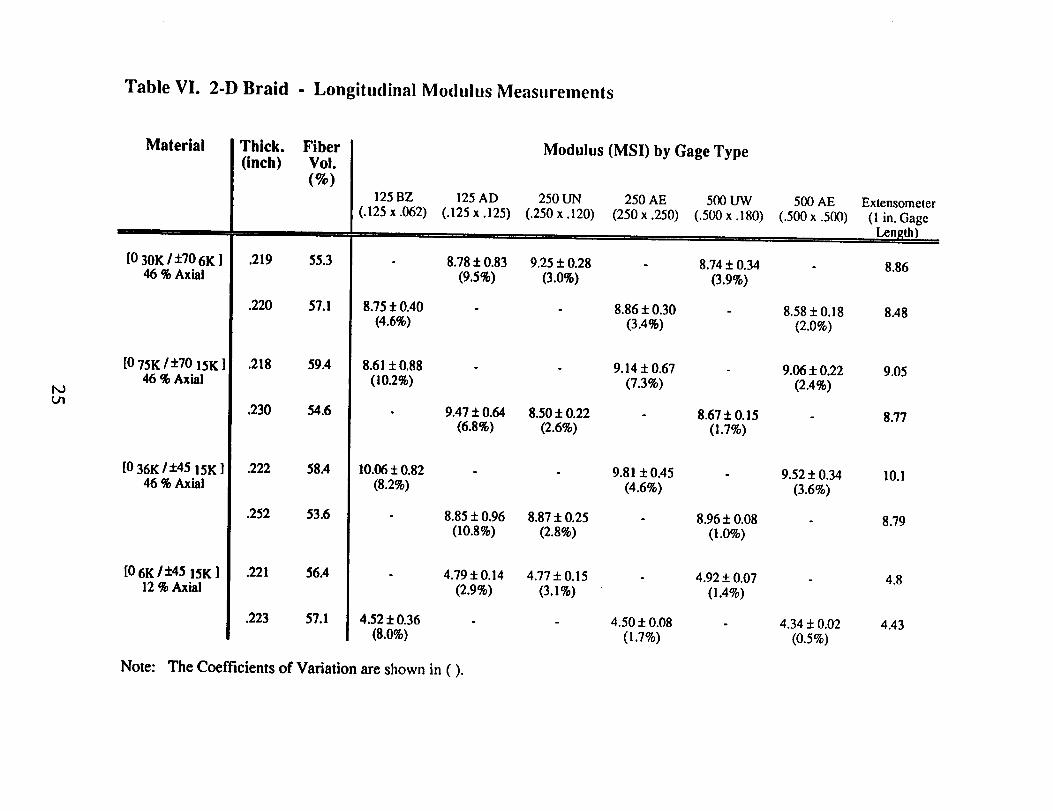
Table VI. 2-D Braid - Longitudinal Modulus Measurements
bO
Material
[0 30K / ±70 6K ]46 % Axial
[075K 1±70 15K ]46 % Axial
[0 36K I ±45 !5K ]46 % Axial
[0 6K/+45 15K ]12 % Axial
Thick. Fiber(inch) Vol.
(%)
.219 55.3
.220 57.1
.218 59A
_30 54.6
_22 58.4
.252 53.6
.221 56A
.223 57.1
125BZ
(.125x.062)
8.75 ± 0.40
(4.6%)
8.61 ± 0.88(10.2%)
10.06 ± 0.82
(8.2%)
4.52 ± 0.36(8.0%)
125AD
(.125x.125)
i 11.
8.78 ± 0.83
(9.5%)
Modulus (MSI) by Gage Type
250 UN 250 AE 500 UW 500 AE(.250 x .120) (250 x .250) (.500 x .180) (.500 x .500)
, ,, ,,, •
9.25 ± 0.28 8.74 ± 0.34
(3.0%) (3.9%)
8.86 ± 0.30(3.4%)
9.14 ± 0.67(7.3%)
9.47±0.64 8.505:0.22 - 8.675:0.15(6.8%) (2.6%) (1.7%)
9.81 + 0.45(4.6%)
8.85 :!:0.96 8.87:1:0.25 8.96 ± 0.08(10.8%) (2.8%) (1.0%)
4.79 + 0.14 4.77 ± 0.15 4.92 ± 0.07(2.9%) (3.1%) (1.4%)
4.50± 0.08
(1.7%)
8.58±0.18(2.0%)
9.06 5:0.22(2.4%)
9.52 ± 0.34(3.6%)
4.34 ± 0.02(0.5%)
Extensomeler
(1 in. Gage
, Length)
8.86
8.48
9.05
8.77
10.1
8.79
4.8
4.43
Note: The Coefficients of Variation are shown in ().
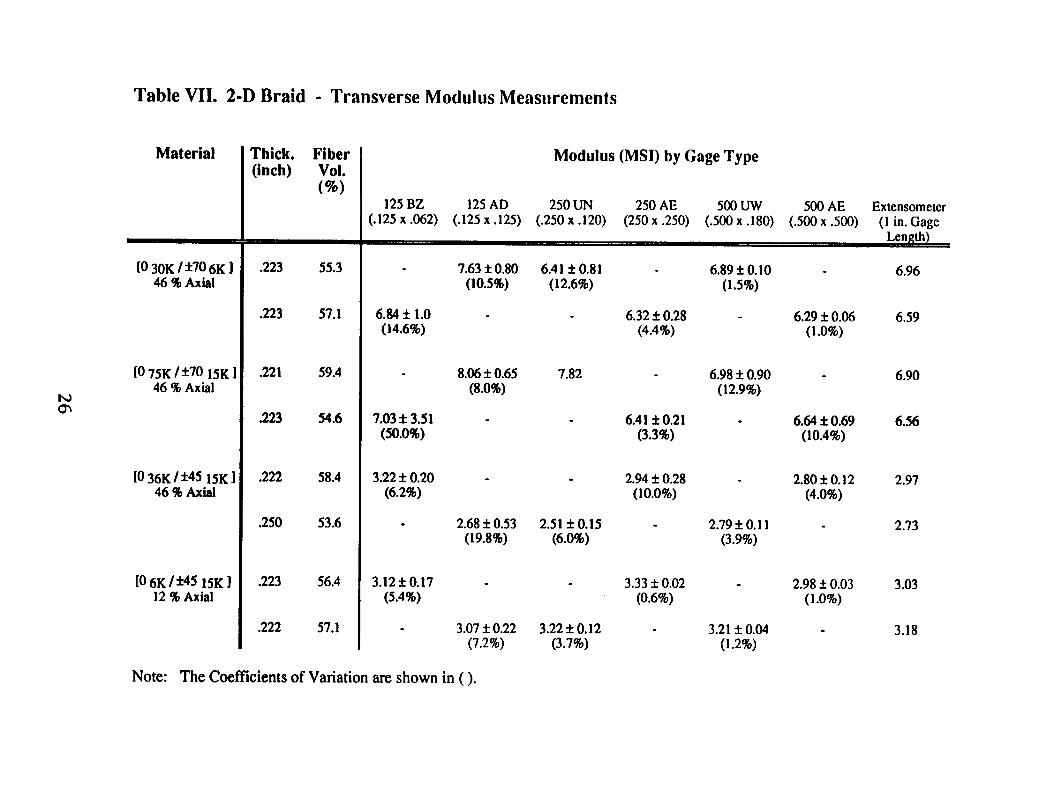
Table VII. 2-D Braid - Transverse Modulus Measuremenls
bO
Material
[0 30K / +70 6K ]46 % Axial
[0 75K/+70 15K ]46 % Axial
[0 36K/+45 15K]46 % Axial
[0 6K/+45 15K ]12 % Axial
Thick. Fiber(inch) Vol.
(%)
.223 55.3
.223 57.1
.221 59A
_23 54.6
.222 58.4
.250 53.6
.223 56.4
.222 57.1
Modulus (MSI) by Gage Type
125 BZ 125 AD 250 UN 250 AE 500 UW 500 AE Extensometer
(.125 x .062) (.125 x .125) (.250 x .120) (250 x .250) (.500 x .180) (.500 x .500) (1 in. Gage
.... Length)
6.84 + 1.0(14.6%)
7.03 ± 3.51(50.0%)
3.22 + 0.20(6.2%)
7.63±0.80 6.41 +0.81 - 6.89±0.1000.5%) (12.6%) 0.5%)
6.32 + 0.28(4.4%)
8.06 + 0.65 7.82 - 6.98 + 0.90(8.0%) (12.9%)
6.41 ± 0.21(3.3%)
3.12+0.17
(5.4%)
2.94 ± 0.28(10.0%)
6.96
6.29 + 0.06(I .0%)
6.59
2.68+0.53 2.51:1:0.15 2.79+0.11(19.8%) (6.0%) (3.9%)
6.64 ± 0.69(10.4%)
6.90
6.56
3.33+ 0.02(0.6%)
2.80 ± 0.12(4.0%)
2.97
2.73
3.07 + 0.22 3.22 + O.12 3.21 ± 0.04
(7.2%) (3.7%) (1.2%)
2.98 ± 0.03(1.0%)
3.03
3.18
Note: The Coefficients of Variation are shown in ().
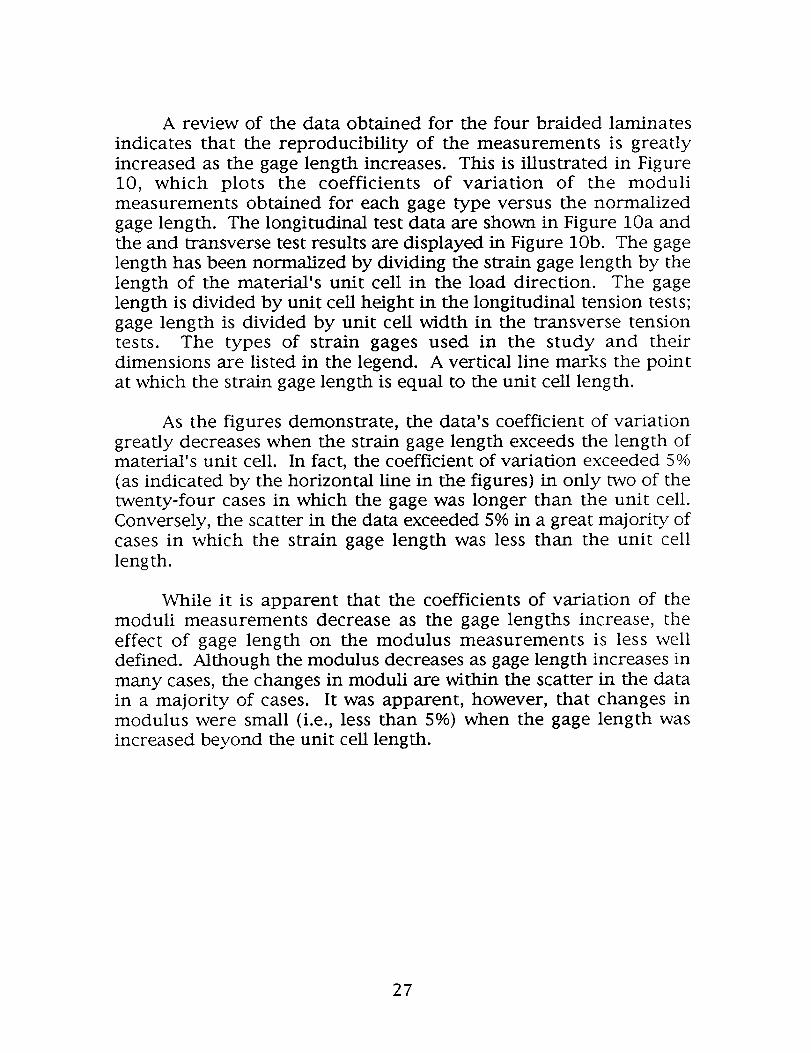
A review of the data obtained for the four braided laminatesindicates that the reproducibiliW of the measurements is greatlyincreased as the gage length increases. This is illustrated in Figure10, which plots the coefficients of variation of the modulimeasurements obtained for each gage type versus the normalizedgage length. The longitudinal test data are shown in Figure 10a andthe and transverse test results are displayed in Figure lob. The gagelength has been normalized by dividing the strain gage length by thelength of the material's unit cell in the load direction. The gagelength is divided by unit cell height in the longitudinal tension tests;gage length is divided by unit cell width in the transverse tensiontests. The types of strain gages used in the study and theirdimensions are listed in the legend. A vertical line marks the pointat which the strain gage length is equal to the unit cell length.
As the figures demonstrate, the data's coefficient of variationgreatly decreases when the strain gage length exceeds the length ofmaterial's unit cell. In fact, the coefficient of variation exceeded 5%(as indicated by the horizontal line in the figures) in only two of thetwenty-four cases in which the gage was longer than the unit cell.Conversely, the scatter in the data exceeded 5% in a great majority ofcases in which the strain gage length was less than the unit celllength.
While it is apparent that the coefficients of variation of the
moduli measurements decrease as the gage lengths increase, the
effect of gage length on the modulus measurements is less well
defined. Although the modulus decreases as gage length increases in
many cases, the changes in moduli are within the scatter in the data
in a majority of cases. It was apparent, however, that changes in
modulus were small (i.e., less than 5%) when the gage length was
increased beyond the unit cell length.
27
25.00
20.00
A
o¢15.00
al
a
>
_ 10.00O
"8
OO
u
0.00
0.0
Figure lOa.
Gage Length =Unit Cell Length(in Load Direction)
• COV Gage: 125 BZ (.125 x .062)
[] COV Gage: 125 AD (.125 x .125)
,L COV Gage: 250 UN (.250 x .120)
,,, COV Gage: 250 AE (.250 x .250)
• COV Gage: 500 UW (.500 x .160)
O COV Gage: 500 AE (.500 x .500)
o
[]
A
oCoefficient of Variation = 5 %
M •o
[] t ,L t 0
a, _ • 0
1.0 2.0 3.0 4.0 5.0 6.0 7.0
Normalized Gage Length (Gage Length/Unit Cell Length)
Longitudinal Tensile Test Results
25.00
20.00 []Gage Length =Unit Cell Length(in Load Direction)
A
v
¢:O"= 15.00(, •ma,.
> ,•
_ 12 210.00
Q []o ou
5.00 •
0.00
0.0
Figure lOb.
! • COV Gage: 125 BZ (.125 x .062)
13 COV Gage: 125 AD (.125 x .125)
a, COV Gage: 250 UN (.250 x .120)
A COV Gage: 250 AE (.250 x .250)
• COV Gage: 500 UW (.500 x .180)
O COV Gage: 500 AE (.500 x .500)
Coefficient of Variation = 5 %
db
,, _ID
1.0 2.0 3.0 4.0 5.0 6.0
Normalized Gage Length (Gage Length/Unit Cell Length)
Transverse Tensile Test Results.
7.0
Figure 10. CoVs Decrease as Gage Lengths Increase (2-D Braids).
28
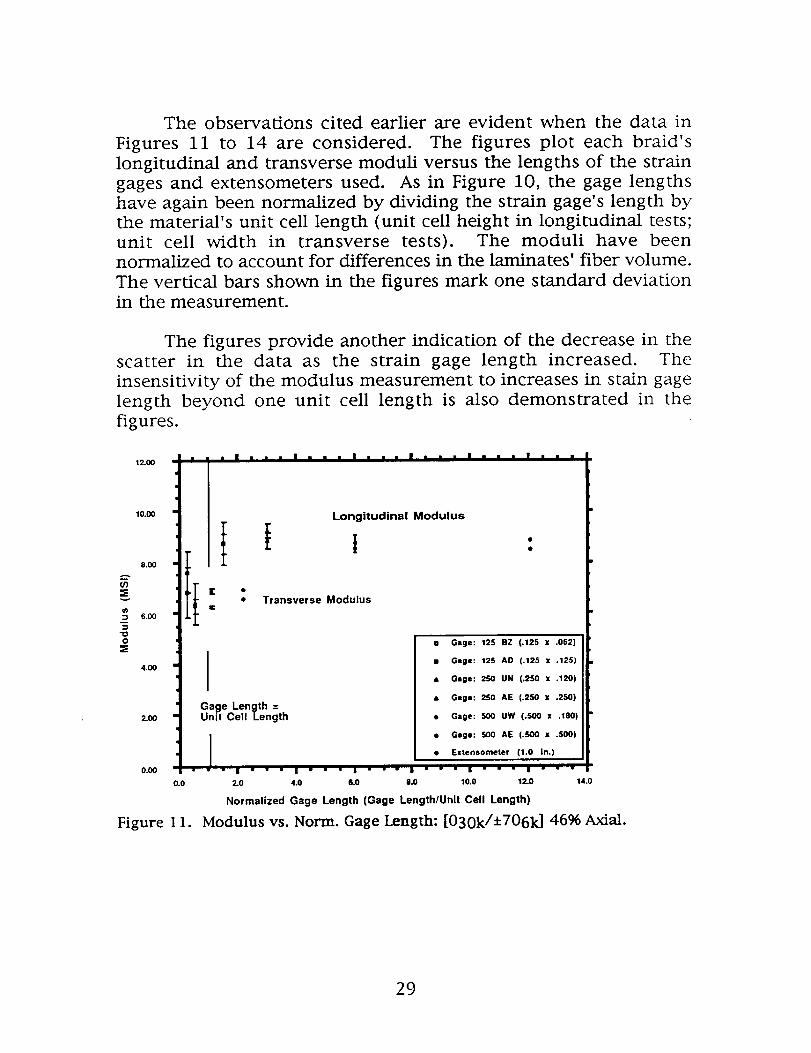
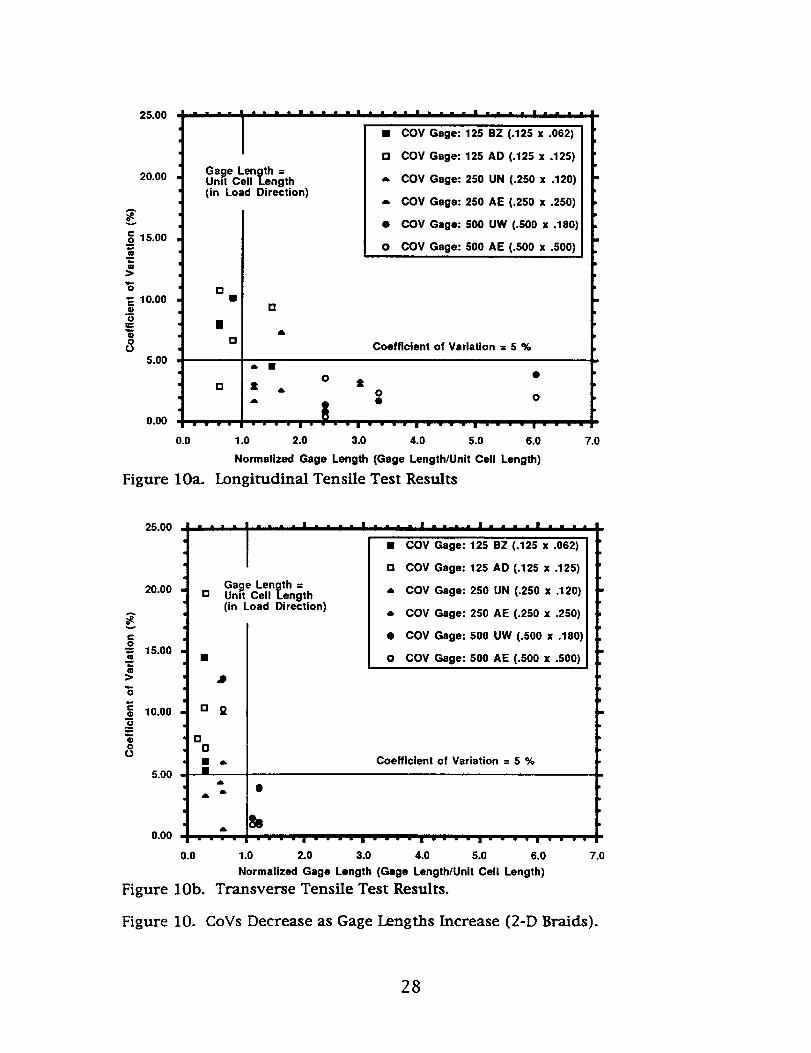
The observations cited earlier are evident when the data in
Figures 11 to 14 are considered. The figures plot each braid's
longitudinal and transverse moduli versus the lengths of the strain
gages and extensometers used. As in Figure 10, the gage lengths
have again been normalized by dividing the strain gage's length by
the material's unit cell length (unit cell height in longitudinal tests;
unit cell width in transverse tests). The moduli have been
normalized to account for differences in the laminates' fiber volume.
The vertical bars shown in the figures mark one standard deviation
in the measurement.
The figures provide another indication of the decrease in the
scatter in the data as the strain gage length increased. The
insensitivity of the modulus measurement to increases in stain gage
length beyond one unit cell length is also demonstrated in the
figures.
12.00
10.00
8.00
g}
D 6.00-5
O
4,00
2.00
0.00
0.0
Figure 11.
Longitudinal Modulus
• Transverse Modulus
Gage Length =Unit Cell Length
• Gage: 125 BZ (.125 z .062)
• Gage: 125 AD (.125 x .125)
• Gage: 250 UN (.250 x .120)
• Gage: 250 AE (.2S0 z .250)
• Gage: 500 UW (.500 x .180)
• Gage: 500 AE (.500 x .500)
• Exteneometer (I.0 in.)
2.0 4.0 6.0 8.0 10.0 12.0 14.0
Normalized Gage Length (Gage Length/Unit Cell Length)
Modulus vs. Norm. Gage Length: [030k/±706k] 46% Axial.
29
(n=[v
e02"oO
=s
12.00
10.00
8.00
6.00
4.00
2.00
0.00
0.0
Figure 12.
i[
.u.n|.t..I....I.•m.|mmmmlm••.
Longitudinal Modulus
I te
Transverse Modulus
Gage Length =Unit Cell Length
• Gags: 12S BZ (.125 x .062)
• Gage: 125 AD (.125 i .125)
a Gage: 250 UN (.250 x .120)
• Gage: 250 AE (.250 x .250)
• Gage: ,TOO UW (.,TOO x .100)
• Gage: 500 AE (.SO0 • .500)
• Extensomeler (1.0 In.)
• - - - i " " " - I • - - - g " " " " I " " " " I " " " " I " " " "
1.0 2.0 3.0 4.0 6.0 6.0 ?.0
Normalized Gage Length (Gage Length/Unit Cell Length)
Modulus vs. Norm. Gage Length: [075k/+7015k] 46% Axial.
12.00
10.00
8.00
(n=Sv
w 6.00
"5"OO
=E4.00
2.O0
0.00
0.0
Figure 13.
Longitudinal Modulus
] !
Transverse Modulus
I | ]Gage Length =Unit Ceil Length
• Gage: 125 OZ (.12S • .062)
• Gage: 125 AD (.125 • .125)
• Gage: 250 UN (.250 • .120)
• Gage: 250 AE (.250 • .250)
• Gage: 500 UW (.500 • .180)
• Gage: 500 AE (.SO0 • .SO0)
• Extensometer (1.0 in.)
1.0 2.0 3.0 4.0
Normalized Gage Length (Gage Length/Unit Cell Length)
5.0
Modulus vs. Norm. Gage Length: [036k/+4515k] 46% Axial.
30
"oo
6.00
5.00
4.00
3.00
2.00
1.00
0.o0
I •i
m
0.0
| I " .iml| • • • . | • • • • | I i i I
Longitudinal Modulus
; :Transverse Modulus
IGage Length =
Unit Cell Length
a Gage: 125 BZ (.125 x .052)
• Gage: 125 AD (.125 x .125)
• Gage: 250 UN (.250 z .120)
• Gage: 250 AE (.2S0 x .250)
• Gage: 500 UW (.SO0 x .180)
• Gage: SO0 AE (.SO0 x .500)
• Extensometer (1.0 in.)
• " • l I " | " • " •
1.0 2.0 3.0 4.0 5.0
Normalized Gage Length (Gage Length/Unlt Cell Length)
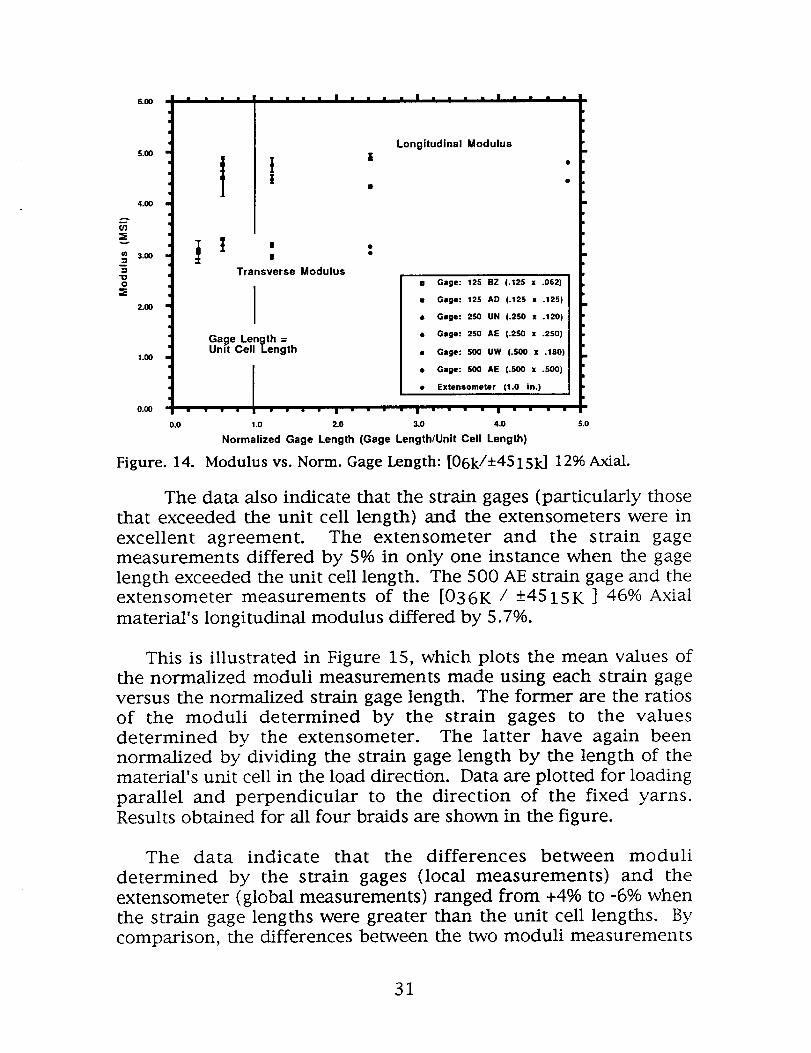
Figure. 14. Modulus vs. Norm. Gage Length: [06k/+4515k] 12% Axial.
The data also indicate that the strain gages (particularly those
that exceeded the unit cell length) and the extensometers were in
excellent agreement. The extensometer and the strain gage
measurements differed by 5% in only one instance when the gage
length exceeded the unit cell length. The 500 AE strain gage and theextensometer measurements of the [036K / +4515K ] 46% Axial
material's longitudinal modulus differed by 5.7%.
This is illustrated in Figure 15, which plots the mean values of
the normalized moduli measurements made using each strain gage
versus the normalized strain gage length. The former are the ratios
of the moduli determined by the strain gages to the values
determined by the extensometer. The latter have again been
normalized by dividing the strain gage length by the length of the
material's unit cell in the load direction. Data are plotted for loading
parallel and perpendicular to the direction of the fixed yarns.
Results obtained for all four braids are shown in the figure.
The data indicate that the differences between moduli
determined by the strain gages (local measurements) and the
extensometer (global measurements) ranged from +4% to -6% when
the strain gage lengths were greater than the unit cell lengths. By
comparison, the differences between the two moduli measurements
31
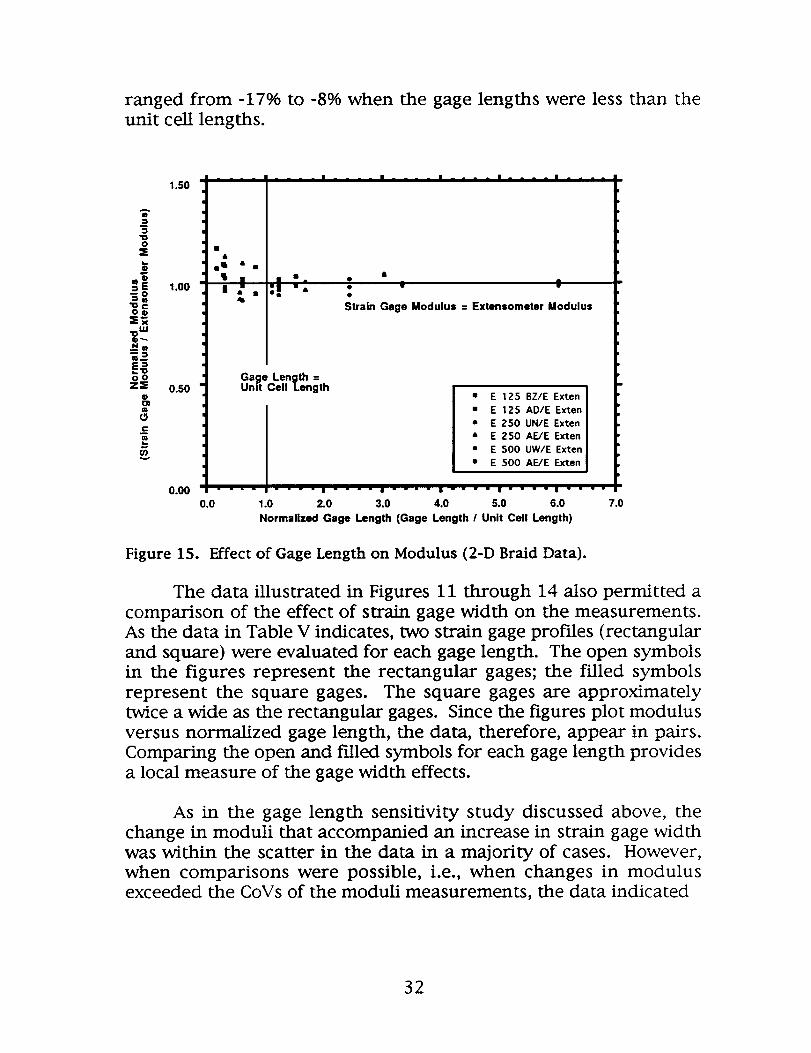
ranged from -1796 to -896 when the gage lengths were less than theunit cell lengths.
1.50
Ae
:"_" 1.oo
,0 I"
@.._._Nw
O0
z_ 0.50a)
0;
0
_=
m I • •
m:. lm -,
Gage Length =Unit Cell Length
Strain Gage Modulus = Extensometer Modulus
• E 125 BZ/E Exten
• E 125 AD/E Exten
• E 250 UN/E Exten
• E 250 AWE Exten
• E 500 UW/E Exten
• E 500 AE/E Exten
0.00
0.0 1.0 2.0 3.0 4.0 5.0 6.0 7.0
Normalized Gage Length (Gage Length / Unit Cell Length)
Figure 15. Effect of Gage Length on Modulus (2-D Braid Data).
The data illustrated in Figures 11 through 14 also permitted acomparison of the effect of strain gage width on the measurements.As the data in Table V indicates, two strain gage profiles (rectangularand square) were evaluated for each gage length. The open symbolsin the figures represent the rectangular gages; the filled symbolsrepresent the square gages. The square gages are approximatelytwice a wide as the rectangular gages. Since the figures plot modulusversus normalized gage length, the data, therefore, appear in pairs.Comparing the open and filled symbols for each gage length providesa local measure of the gage width effects.
As in the gage length sensitivity study discussed above, thechange in moduli that accompanied an increase in strain gage widthwas within the scatter in the data in a majority of cases. However,when comparisons were possible, i.e., when changes in modulusexceeded the CoVs of the moduli measurements, the data indicated
32

that increasing gage width decreased modulus. These changes
exceeded 5% in several cases in which the strain gage width
exceeded the unit cell width.
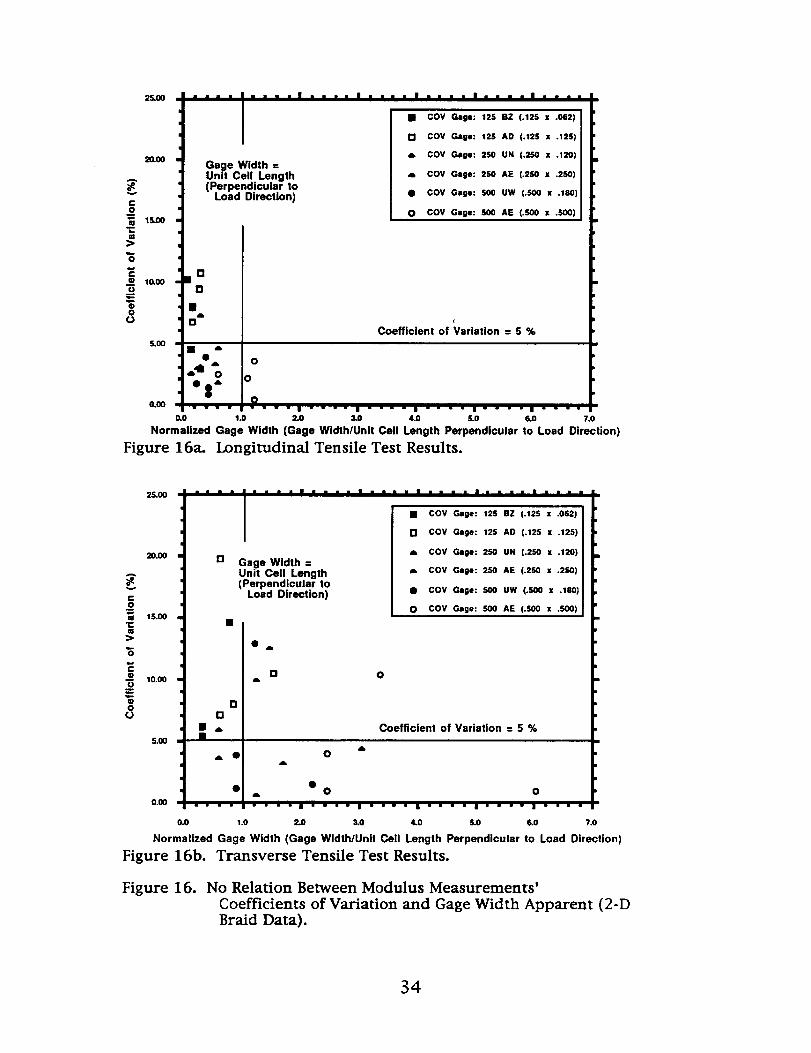
Figure 16 provides another means of considering gage width
effects. It plots the coefficients of variation of the materials'
longitudinal and transverse moduli measurements versus the
normalized strain gage width. In this case, gage width has been
normalized by dividing by the length of the material's unit cell in the
direction perpendicular to the load direction. The gage width is
divided by unit cell width in longitudinal tension tests; gage width is
divided by unit cell height in transverse tension tests.
Although a general trend of decreasing coefficients of variation
with increasing gage width is apparent, no strong relationship
between gage width and scatter in the data was discerned.
Measurements made using gages whose widths were less than the
length of the material's unit cell in the direction perpendicular to theload direction exceeded and fell below the 5% benchmark coefficient
of variation in equal numbers (Fig 16a). Correspondingly, the
coefficients of variation of the measurements made using gages that
exceeded the unit cell width greatly exceeded the 5% benchmark in a
significant number of instances (Fig 16b).
33
25.00
2O.OO
A
¢=Om
1_00m
• ln00iU
OU
5.OO
Gage Width =
Unit Cell Length(Perpendicular to
Load Direction)
• COY Gage: 125 BZ (.125 • .082)
rl COV Gage: 125 AD (.125 • .125)
COY Gage: 250 UN (.250 • .120)
COY Gage: 2SO AE (.250 • .250)
• COV Gage: SO0 UW (.500 • .180)
O COY Gage: S00 AE (.S00 • .SO0)
[]m
I"I
m'*
•8-
t
Coefficient of Variation = 5 %
0
0
0
1.0
0.00
nO
Normalized Gage Width (Gage Width/Unit Cell Length Perpendicular to Load Direction)
Figure 16a. Longitudinal Tensile Test Results.
m a m i m2.0 3.0 4.0 ¢0 6.0 7.0
A
I"o
al
¢D"6
q)O
O
25.00
20.00
15.00
10.00
6.00
D
D
G
,L •
Gage Width =
Unit Cell Length
(Perpendicular to
Load Direction)
• coy Gage: 12s BZ (.125 • .062)
I-I COY Gage: 125 AD (.125 x .126)
,a. COY Gage: 250 UN (.250 • .120)
,L COV Gage: 250 AE (.2S0 • .250)I!! • COV Gage: 500 UW (.SO0 • .180)
O COV Gage: 500 AE (.500 x .500)
• 4b
D4b
O
Coefficient of Variation = 5 %
dbO
A
• ,_ 0 00.00
o.o 1.o _.o 3.0 4.0 s.o 6.0 7.0
Normalized Gage Width (Gage Width/Unit Cell Length Perpendicular to Load Direction)
Figure 16b. Transverse Tensile Test Results.
Figure 16. No Relation Between Modulus Measurements'
Coefficients of Variation and Gage Width Apparent (2-DBraid Data).
34
Woven Material
Tables VIII and IX list the longitudinal and transverse tension
test results obtained for the 3-D woven laminates. The tables
present the average moduli measured by the extensometer and each
type of strain gage. The standard deviations of the strain gage
measurements are also listed in the tables; their coefficients of
variation are given in parenthesis.
The moduli were computed over the 1000 to B000 microstrain
region of the stress-strain curves. The slopes of the curves were
established through linear regression to the data. The IS 1 laminates
were the lone exception. They apparently developed damage at
approximately 2500 microstrain. As in the case of the [0 75k / _+70
15k] 46% Axial braided laminates, the moduli in these cases were
computed over narrower ranges, eliminating the microstrain region
where the gages reflected damage development.
Many of the same trends noted for the braided laminates were
apparent when the woven laminate data listed in Tables VIII and IX
were examined. Scatter in the data, as monitored by the coefficient
of variation, again decreased as gage length increased. Almost half of
the modulus measurements made using the shortest, 0.125 inch,
gages had coefficients of variation in excess of 5%. The number ofinstances in which the coefficients of variation exceeded this value
decreased markedly as gage length increased to 0.250 inch and 0.500
inch.
35
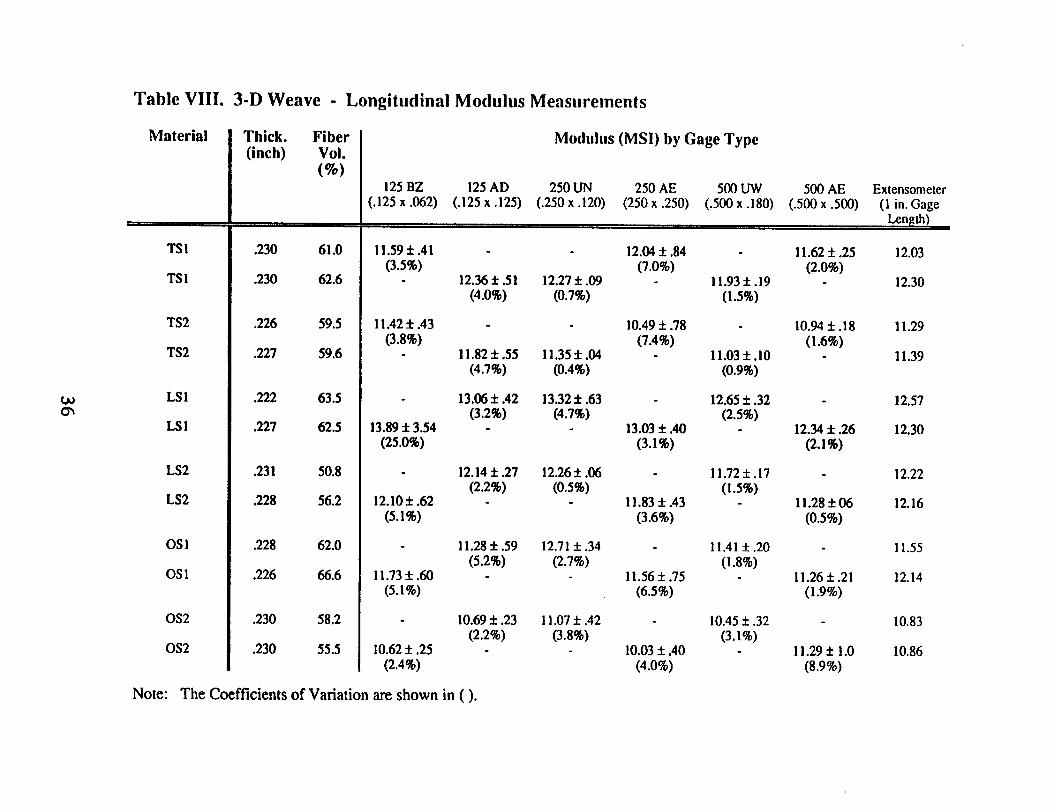
Table VIII. 3-D Weave Longitudinal Modulus Measurements
Material
TS!
TS1
TS2
TS2
LSI
LSI
LS2
LS2
OSI
OS1
OS2
OS2
Thick.
(inch)
., illl ir
.230
.230
.226
.227
.222
.227
.231
.228
.228
.226
.230
.230
Fiber
Vol.
(%)125 BZ
(.125 x .062)
61.0 11.59 + .41
(3.5%)62.6
59.5 11.42 + .43
(3.8%)59.6
63.5
62.5 13.89 + 3.54
(25.0%)
50.8
56.2 12.10+ .62
(5.1%)
62.0
66.6 11.73:1:.60
(5.1%)
58.2
55.5 10.62 + .25
(2.4%)
Modulus (MSI) by Gage Type
125 AD 250 UN 250 AE 500 lAW 500 AE Extensometer
(.125 x.125) (.250 x .120) (250x .250) (.500 x.180) (.500 x .500) (1 in. Gage
Length)
12.36 ± .51
(4.0%)
11.82 i .55
(4.7%)
13.06 + .42
(3.2%)
- 12.04 i .84 - 1!.62 i .25(7.0%) (2.0%)
12.27+ .09 ! !.93 +.19 -(0.7%) (1.5%)
10.49 + .78 - 10.94 ± .18 11.29(7.4%) (1.6%)
11.35+.04 11.03+.10 - 11.39(0.4%) (0.9%)
13.32 + .63 12.65 ± .32(4.7%) (2.5%)
13.03 + .40 - 12.34 + .26(3.1%) (2.1%)
12.14 + .27 12.26 ± .06 11.72 ± .17
(2.2%) (0.5%) (1.5%)11.83 + .43 11.28 ± 06
(3.6%) (0.5%)
11.28 ± .59 12.71 + .34 11.41 + .20
(5.2%) (2.7%) (1.8%)11.56 ± .75 I 1.26 ± .21
(6.5%) (1.9%)
10.69 ± .23 1 !.07 ± .42 10.45 + .32
(2.2%) (3.8%) (3.1%)10.03 + .40 1i.29 ± 1.0
(4.0%) (8.9%)
12.03
12.30
12.57
12.30
12.22
12.16
11.55
12.14
10.83
10.86
Note: The Coefficients of Variation are shown in ().

Table IX. 3.D Weave - Transverse Modulus Measurements
Material
iw, , i i,.
TS1
TSI
TS2
TS2
LSI
LSI
LS2
LS2
OS1
OSI
OS2
OS2
Thick. Fiber
(inch) Vol.(%)
.229 61.0
.229 62.6
.224 59.5
.231 59.6
.228 63.5
.223 62.5
.233 50.8
.231 56.2
.229 62.0
.225 66.6
.232 58.2
.232 55.5
Modulus (MSI) by Gage Type
125 BZ 125 AD 250 UN 250 AE 500 UW 500 AE
(.125 x.062) (.125 x.125) (.250 x.120) (250x.250) (.500 x.180) (.500x.500)
6.43 + A8
(7.5%)
7.32 + .61(8.3%)
6.18 + .29(4.7%)
6.70 + .89(13.3%)
6.53 + .19 6.35 + .06(2.9%) (1.0%)
6.44 i .20 6.76 ± .15 6.49 ± .03
(3.1%) (2.2%) (0.5%)
7.25 ± .33 7.25 ± .36 6.70 ± .07
(4.6%) (5.0%) (1.0%)- - 6.83±.17
(2.5%)
6.15 ± .42 6.41 + .59 6.35 ± .50(6.8%) (9.2%) (7.9%)
6.58 + .61 6.98 ± .41 6.53 + .05(9.3%) (5.9%) (0.8%)
- - 6.89 + .50
(7.3%)
6.78 + .06(0.9%)
6.27 ± .02 6.03 + .26(0.3%) (4.3%)
6.91 ± .43 7.00 ± .16 - 6.78 ± .06(6.2%) (2.3%) (0.9%)
7.17 ± .67 - - 6.91 ± .28
(9.3%) (4.1%)
6.35 ± .14
(2.2%)- - 6.22 + .07
(1.1%)6.20+ .14 6.21 + .07 6.14 ± .12
(2.3%) (1.1%) (2.0%)
°
6.58+ 11(1.7%)
6.75 + .08
(1.2%)
6.01 _+.09(1.5%)
Extensometer(1 in. Gage
Len_m)
6.30
6.23
6.63
6.93
5.94
6.25
6.67
6.87
6.48
6.89
6.20
6.33
Note: The Coefficients of Variation are shown in ().
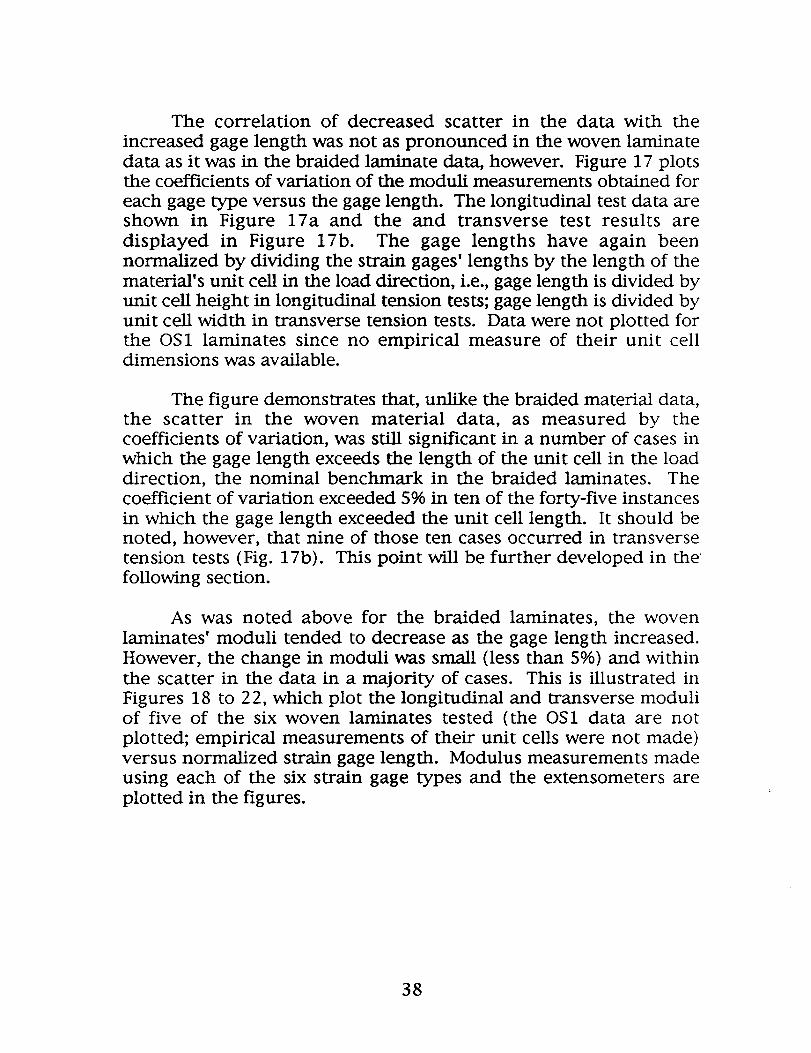
The correlation of decreased scatter in the data with the
increased gage length was not as pronounced in the woven laminatedata as it was in the braided laminate data, however. Figure 17 plotsthe coefficients of variation of the moduli measurements obtained for
each gage type versus the gage length. The longitudinal test data areshown in Figure 17a and the and transverse test results aredisplayed in Figure 17b. The gage lengths have again beennormalized by dividing the swain gages' lengths by the length of thematerial's unit cell in the load direction, i.e., gage length is divided byunit cell height in longitudinal tension tests; gage length is divided byunit cell width in transverse tension tests. Data were not plotted forthe OS1 laminates since no empirical measure of their unit celldimensions was available.
The figure demonstrates that, unlike the braided material data,the scatter in the woven material data, as measured by thecoefficients of variation, was still significant in a number of cases inwhich the gage length exceeds the length of the unit cell in the loaddirection, the nominal benchmark in the braided laminates. Thecoefficient of variation exceeded 5% in ten of the forty-five instances
in which the gage length exceeded the unit cell length. It should benoted, however, that nine of those ten cases occurred in transversetension tests (Fig. 17b). This point will be further developed in thefollowing section.
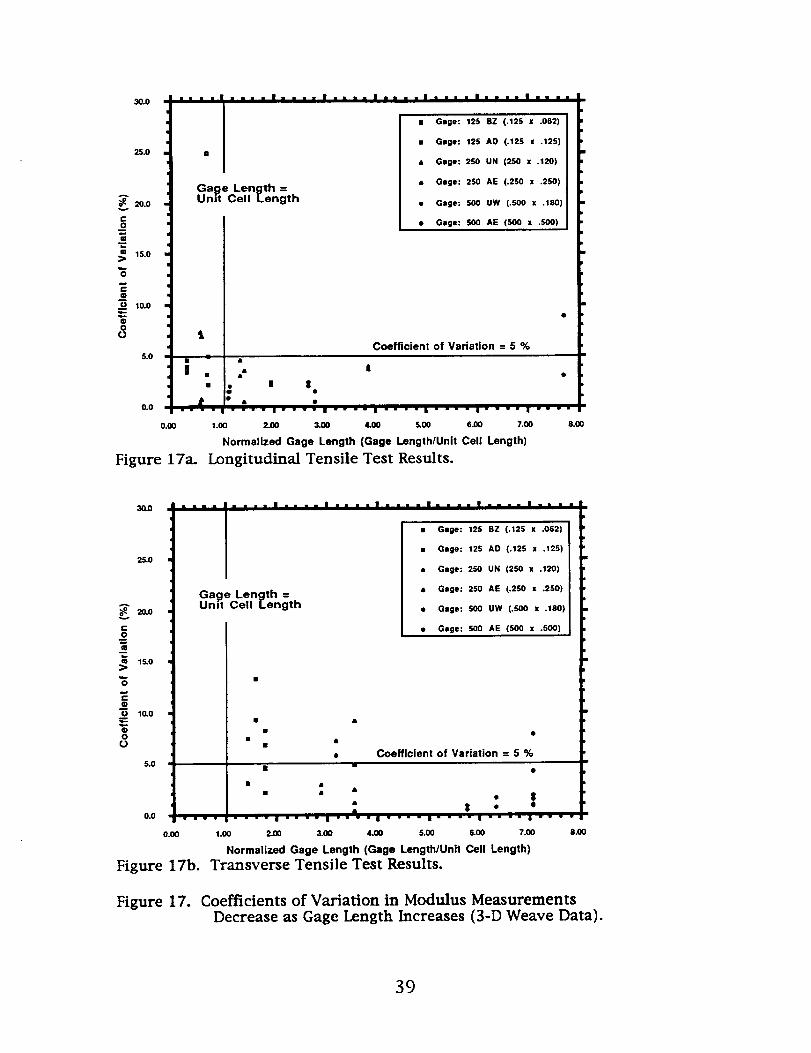
As was noted above for the braided laminates, the woven
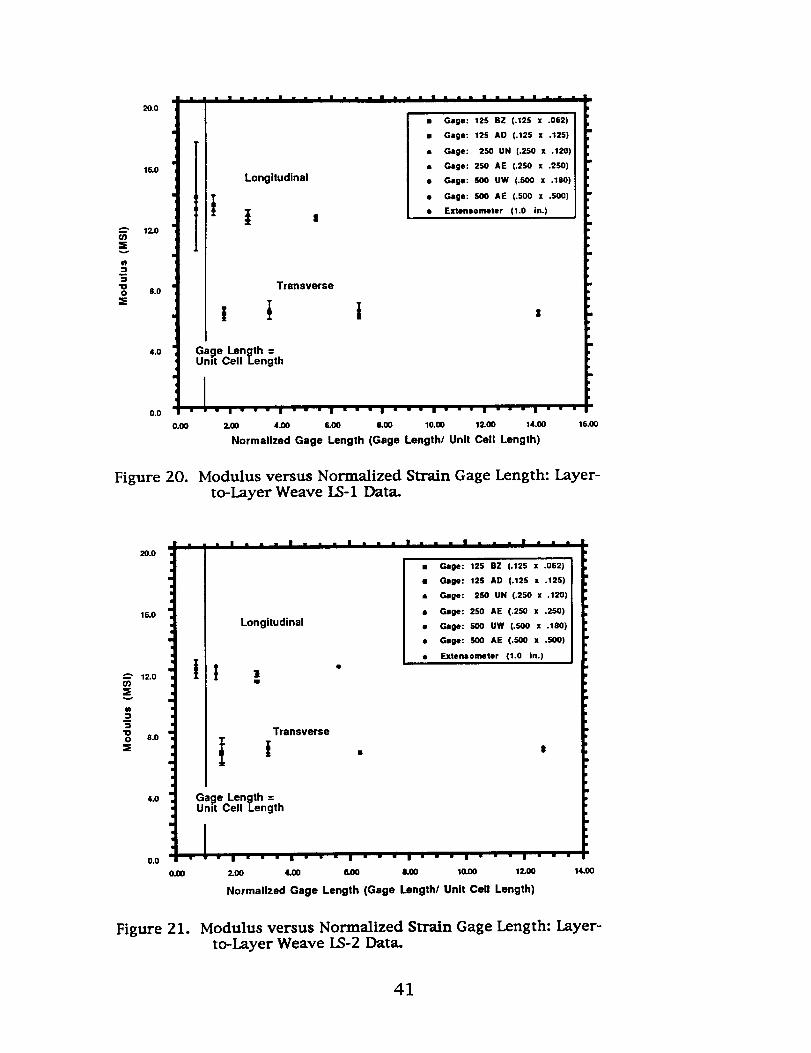
laminates' moduli tended to decrease as the gage length increased.However, the change in moduli was smaU (less than 5%) and withinthe scatter in the data in a majority of cases. This is illustrated inFigures 18 to 22, which plot the longitudinal and transverse moduliof five of the six woven laminates tested (the OS1 data are not
plotted; empirical measurements of their unit cells were not made)versus normalized strain gage length. Modulus measurements madeusing each of the six strain gage types and the extensometers are
plotted in the figures.
38
30.0
25.0 m
A
2o.ov
C0
msm
15.0
0
0 10.0
00
0
5.0
0.0
Gage Length =Unit Cell Length
n Gage: 125 BZ (.125 x .062)
a Gage: 125 AD (.125 x .125)
s Gage: 250 UN (250 • .120)
s Gage: 250 AE (.250 • .250)
!
• Gage: 500 UW (.500 x .180)
• Gage: S00 AE (500 • .SO0)
0.00
Coefficient of Variation = 5 %e
u ," i= : | |e
1.oo 2.o0 3,oo 4.oo s,oo 5.00 7,oo
Normalized Gage Length (Gage Length/Unit Cell Length)
Figure 17a. Longitudinal Tensile Test Results.
8.00
30.0
25.O
A
_ot-o
m
i.m 15.0
>
Q
0 111.0
@O
5.O
0.0
Ga_e Length =Unit Cell Length
• Gage: 125 BZ (.125 • .062)
m Gage: 125 AD (.125 • .125)
a Gage: 250 UN (2.50 • .120)
• Gage: 250 AE (.250 • ,250)i
• Gage: 500 UW (.500 • .180)!
• Gage: 500 AE (500 • .500)
0.00
• •
• •
m
• Coefficient of Variation = 5 %
• •
a• *. .,
• $$ • O
1.oo 2.00 3.0o 4.00 5.00 6.00 7.00
Normalized Gage Length (Gage Length/Unit Cell Length)
Figure 17b. Transverse Tensile Test Results.
8.00
Figure 17. Coefficients of Variation in Modulus MeasurementsDecrease as Gage Length Increases (3-D Weave Data).
39
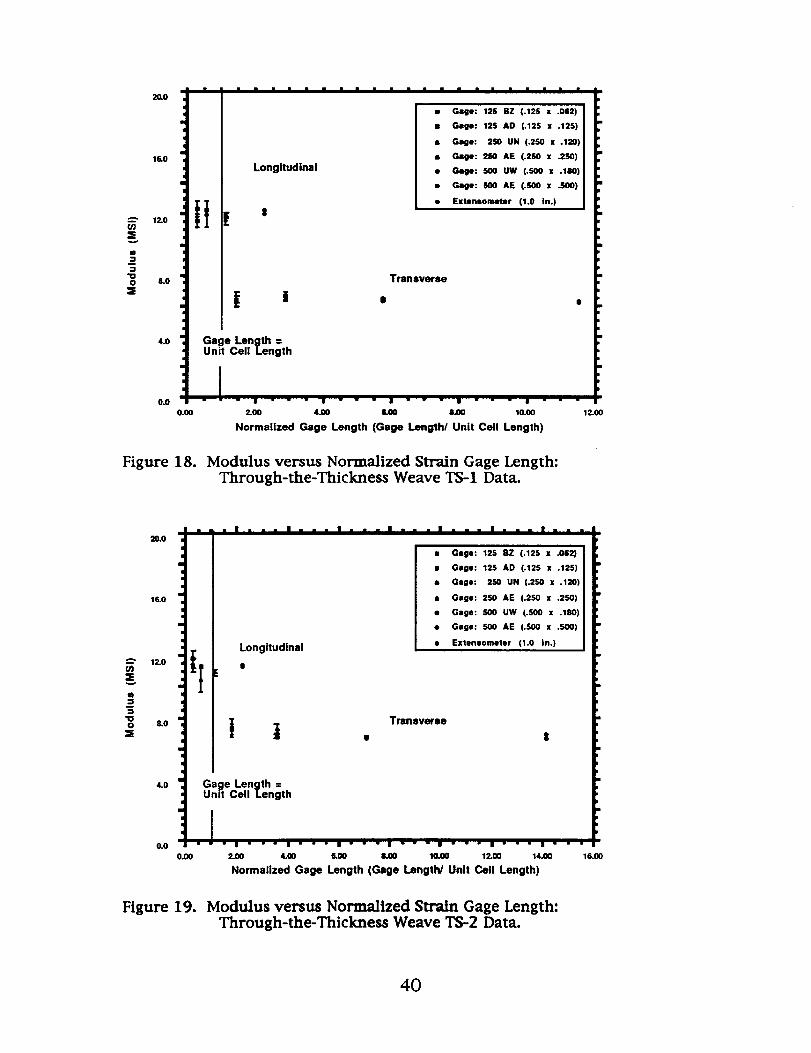
Figure 18.
Longitudinal
• Gage: 125 BZ (.12S • .062)
• Gage: 125 AD (.125 • .125)
a Gage: 250 UN (.250 X .120)
s Gage: 250 AE (.250 • .2S0)
a Gage: SO0 UW (.S00 • .180)
• Gage: S00 AE (.S00 x .SO0)
a Extensometer (1.0 in.)
Transverse
| i ,
Gage Length :Unit Cell Length
2.00 4.00 6.00 8.00 10.00
Normalized Gage Length (Gage Length/ Unit Cell Length)
Modulus versus Normalized Strain Gage Length:Through-the-Thickness Weave TS-1 Data.
12.00
20.0
16.0
12.0U) ILl
_ a
O 8.0
4.0
0.0
Figure 19.
Longitudinal
l
a Gage: 12S 8Z (.125 • .062)
• Gage: 125 AD (.125 • .125)
• Gage: 250 UN (.250 • .120)
s Gage: 250 AE (.2S0 • .250)
• Gage: 500 UW (.500 • .180)
• Gage: 500 AE (.S00 • ..TOO)
• Exleneomater (1.0 in.)
t Transversee $
Gage Length =Unit Cell Length
i
I
2.00 4.00 6,00 8.00 10.00 12.00 14,,00
Normalized Gage Length (Gage Length/ Unit Cell Length)
Modulus versus Normalized Strain Gage Length:Through-the-Thickness Weave TS-2 Data.
16.00
4O
20.O
16.0
12.0(n:S
O 8.0=s
4.0
0.0
0.00
Figure 20.
Longitudinal
• Gage: 125 BZ (.125 x .062)
• Gage: 125 A0 (.125 • .125)
• Gage: 2S0 UN (.250 • .120)
• Gage: 250 AE (.250 • .250)
• Gage: 500 UW (.500 • .180)
• Gage: 500 AE (.SO0 • .500)
• Extensomeler (1.0 in.)
Transverse
t I
Gage Length =Unit Cell Length
2.oo 4.00 6.oo s.oo 10.00 12.00 14.00
Normalized Gage Length (Gage Length/ Unit Cell Length)
16.00
Modulus versus Normalized Strain Gage Length: Layer-to-Layer Weave LS-1 Data.
20.0
16.0
12.0U):S
t
m
"OO 8.0
4.0
0.0
0.00
l.n.l.mnla..l.._g,o'lm'"
Longitudinal
• Gage: 12S BZ (.125 • .062)
• Gage: 125 AD (.125 • .125)
• Gage: 250 UN (.250 • .120)
s Gage: 250 AE (.250 • .250)
• Gage: S00 UW (.500 • .180)
• Gage: SO0 AE (.500 • .500)
• Extenaometer (1.0 in.)
Transverse
Gape Length =Un,t Cell Length
" l " " " l " " " n " " " i " " n - " " l " "
2.oo 4.{]O 6.00 ILOO 10.00 12.00
Normalized Gage Length (Gage Length/Unit Cell Length)
14.00
Figure 21. Modulus versus Normalized Strain Gage Length: Layer-to-Layer Weave LS-2 Data.
41
¢0
s)v
I
O
2O.O
16,0
12.0
8.0
4.0
0.0
0.00
I Gage: 125 BZ (.125 x .062)
m Gage: 125 AO (.125 • .125)
• Gage: 250 UN (.250 x .120)
• Gage: 250 AE (.2S0 x .250)
Longitudinal • Gage: 500 UW (.so0 • .180)
• Gage: SO0 AE (.S00 • .SO0)
• Extenlmmeter (1.0 In.)
, t' !
Transverse
I • l •
Gage Length =Unit Cell Length
I " I " " " I " " " I " " " I " " " l " " " I " " " I
2.00 4.00 6.00 8,.100 10.100 12.00 14.04)
Normalized Gage Length (Gage Length/ Unl! Cell Length)
u
16.00
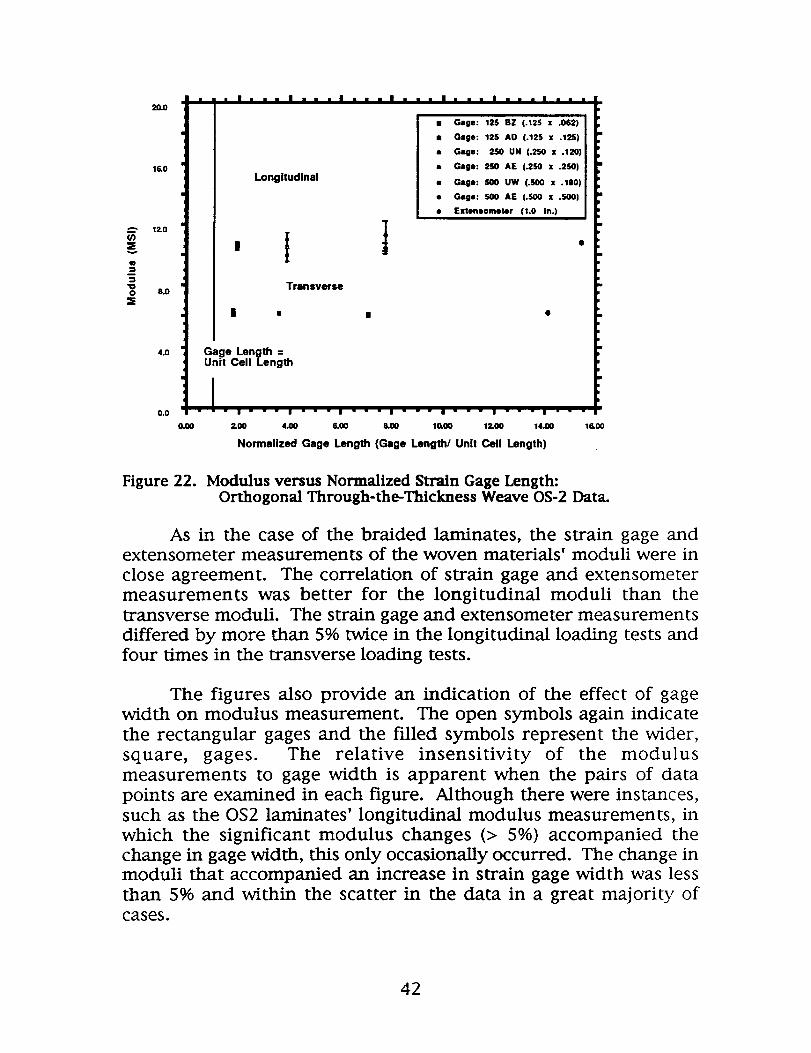
Figure 22. Modulus versus Normalized Strain Gage Length:Orthogonal Through-the-Thickness Weave OS-2 Data.
As in the case of the braided laminates, the strain gage andextensometer measurements of the woven materials' moduli were in
close agreement. The correlation of strain gage and extensometermeasurements was better for the longitudinal moduli than thetransverse moduli. The strain gage and extensometer measurementsdiffered by more than 5% twice in the longitudinal loading tests andfour times in the transverse loading tests.
The figures also provide an indication of the effect of gagewidth on modulus measurement. The open symbols again indicate
the rectangular gages and the filled symbols represent the wider,square, gages. The relative insensitivity of the modulusmeasurements to gage width is apparent when the pairs of datapoints are examined in each figure. Although there were instances,
such as the OS2 laminates' longitudinal modulus measurements, inwhich the significant modulus changes (> 5%) accompanied thechange in gage width, this only occasionally occurred. The change inmoduli that accompanied an increase in strain gage width was lessthan 5% and within the scatter in the data in a great majority ofcases.
42

Stitched Material
The six strain gages listed in Table V were also evaluated onlaminates formed of stitched uniweave material. The results of these
tests are listed in Table X. Limited material availability restricted
this evaluation to longitudinal modulus measurements, however.
The test results indicate that these measurements were
insensitive to strain gage size. All measurements showed excellentconsistency; the moduli ranged from 6.53 to 6.65 MSI. The scatter inthe individual measurements, even those made using the smallest,EA-O6-125BZ-350 gages, was also very good. All the gages hadcoefficients of variations below the 5% benchmark. The CEA-O6-
500UW-350 gages had the highest coefficient of variation, 3.7%.
43
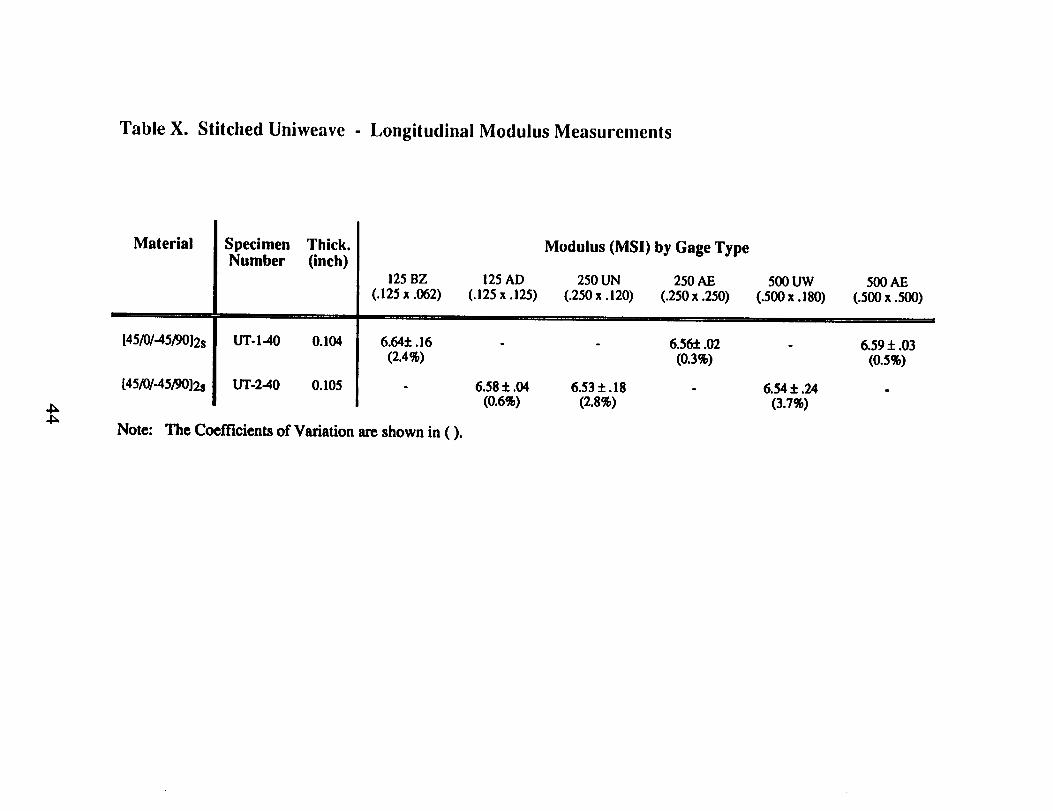
Table X. Stitched Uniweave - Longitudinal Modulus Measurements
4_4_
IMaterial | Specimen Thick.
INumber (inch)
I
I
[45/0/-45/9012S [ lYr-l-40 0.104
[45/0/-45/90]2s [ UT-2-40 0.105
125BZ 125AD
(.125x .062) (.125x .125)
6.64+ .16
(2.4%)
Note: The Coefficients of Variation are shown in ().
6,58 + .04(0.6%)
Modulus (MSI) by Gage Type
250 UN 250 AE
(.250 x.120) (.250x.250)
6.53 +. 18(2.8%)
6.56± .02(0.3%)
500UW
(.500x. 180)
6.54 + .24(3.7%)
500AE
(.500 x .500)
6.59 + .03(0.5%)
Summary:
Instrumentation Practice and
Strain Gage Selection Criteria
As the interferometry results demonstrated, textile composites
develop inhomogeneous displacement fields under even simple
loading conditions due to their unique microstructure. The
instrumentation of these materials, therefore, presents unique
challenges. The experimental results discussed in the previous
section form the basis of an instrumentation practice for textile
composite materials. These results can also be used to establish a set
of strain gage selection criteria for these materials.
The study addressed the three principal types of textile
composites investigated in Phase B of the ACT program; 2-D triaxial
braids, 3-D weaves, and stitched uniweaves. All fibrous preforms
featured AS4 graphite fibers. Epoxy resins were used in all
laminates; Shell's 1895 system was used in the braided and woven
specimens, Hercules' 5501-6 was used in the stitched laminates. A
range of braid and weave parameters were incorporated into the
textile architectures. Yarn size, yarn content, braid angle, and weave
pattern were some of the preform architecture parameters that were
varied to provide a range of material responses.
The materials' longitudinal and transverse tensile responses
were measured with a series of six strain gages and an extensometer.
Three gage lengths, 0.125, 0.250, and 0.500 inches, were studied.
The extensometers used featured a 1.0 inch gage section. The strain
gage width was also varied. Two gage profiles, square and
rectangular, were investigated at each gage length. The length-to-
width ratio of all the rectangular gages was approximately 2 to 1.
Three gages of each type and two extensometers were mounted
to the specimens. The materials' elastic moduli were determine
through linear regression to the 1000 to 3000 microstrain regions of
their stress-strain curves. The average moduli measured using each
gage type and the extensometers were reported. These values plusthe scatter in the data were used to evaluate the effectiveness of the
gages and the extensometers.
45
Instrumentation Practice
The two common methods of instrumenting test specimens,
strain gages and extensometers, were examined in the study. Bothmethods proved effective in measuring material response; they werein close agreement when the strain gage length exceeded the unit celllength. They each have advantages and disadvantages that definetheir usage.
Extensometers provide a more global measure of materialresponse; they are not as sensitive to the local variations indisplacement fields as the strain gages. They will also cost less in thelong run since they are reusable. As the results of this studydemonstrate, extensometers are effective in coupon testing.
Although acceptable for coupon testing, extensometers are notapplicable to all test situations. For example, they cannot be easilymounted to large test panels. Strain gages are a more appropriatechoice for component testing. Since they are, however, sensitive tolocal displacement field inhomogeneity, care must be taken inchoosing an appropriate strain gage size.
Strain Gage Selection Criteria
The investigation of the 2-D triaxially braided laminatesindicated that, although there were several instances in whichmodulus decreased as gage length increased, these changes werewithin the scatter in the data in the majority of cases. The data
clearly demonstrated, however, that changes in modulus were small(< 5%) when the gage length increased beyond the length of the unitcell in the load direction.
The braided laminates' test results also indicated that the
reproducibiliW of the measurements is greatly increased as the gagelength increases. The data's coefficient of variation greatly decreaseswhen the strain gage length exceeds the length of material's unit cellin the load direction. In fact, the coefficient of variation exceeded 5%
in only two of the twenty-four cases in which the gage was longerthan the unit cell.
The same general observations noted for the 2-D braidedmaterial applied to the 3-D woven laminate data. Scatter in the data,as monitored by the coefficient of variation, again decreased as gage
46
length increased. The coefficients of variation exceeded 596 in half of
the measurements made using the 0.125 inch gages. The number
decreased significantly as gage length increased to 0.250 inch and0.500 inch.
Unlike the braided laminates, however, a threshold gage length
was not readily apparent for the woven laminates. A plot of the
coefficients of variation versus normalized gage length for these
materials indicates that scatter in the data exceeded 5% in a number
of instances in which gage length exceeded unit cell length. However,nine of the ten cases in which the coefficient of variation exceeded
5% and the gage length exceeded the unit cell length occurred in
transverse tension tests (Fig 16b). The data indicates that the gage
length must exceed the unit cell length by a factor of four in thetransverse tension tests for the coefficient of variation to be reduced
to 5% or less. This is not too restrictive, however, since the woven
materials' unit cell lengths averaged only 0.076 inch in this direction.
The test results also indicated that both the braided materials'
and the woven materials' modulus measurements to be relatively
insensitive to gage width. No relationship between gage width and
unit cell dimensions was discerned for either type of material.
A rule of thumb to determine the size of strain gages to be
used with textile composite materials should be based on the
characteristic dimensions of the fiber architecture. The practices
recommended here are based on the definitions of the braided and
woven materials' unit cells developed earlier in this report.
2-D Triaxial Braids.
The experimental results indicate that gage length should, at a
minimum, equal the length of the unit cell in load direction for these
materials. Since no relationship between gage width and scatter in
the data was discerned, a rectangular gage seems sufficient. These
gages are less expensive than the larger square gages, particularly in
the large gage sizes. If rectangular gages are used, it is
recommended that the gage length to width ratio be kept at 2 since
data were not gathered for other gage configurations.
47
3-i) Woven Laminates.
Similar criteria can be applied to gage selection for wovenmaterials. The longitudinal tension test results indicate thatreproducible results were obtained with a gage length equal to theunit cell length in the load direction. This is, again, a minimum. Bothbraided and woven laminate test results indicted that the scatter in
the data is greatly decreased as the gage length increases. Theapparently more restrictive criterion that gage length exceed unitcell length by a factor of four in transverse tests is mitigated sincethe unit cells, as defined in this report, are quite narrow. Thecriterion could be met with relatively standard and affordable 0.375inch gages, for example, in the laminates evaluated in this report.
Stitched Laminates.
The results of the limited evaluation of the stitched laminates
indicted that strain gage size did not influence the modulusmeasurement or the scatter in the data. Acceptable results wereobtained using 0.125 inch gages even though their lengths andwidths were equal to the stitch spacing and pitch. This should beconsidered a minimum gage size for this stitch configuration,however, until data are developed for smaller gages.
48

References
ii Naik, R. A., Ifju, P. G., and Masters, J. E., "Effect of FiberArchitecture Parameters on Deformation Fields and Elastic
Moduli of 2-D Braided Composites," Journal of CompositeMaterials, Vol. 28, No. 7/1994, pp. 656 - 681.
2. Hardranft, D., Parvizi-Majidi, A., and Chou, T.-W., "Testing andCharacterization of Through-the-thickness Properties of Multi-Directionally Reinforced Textile Composites," Quarterly ProgressReport, NASA Advanced Composites Technology: Mechanics ofTextile Composites Work Group, March 1994, pp. 219 - 249.
49

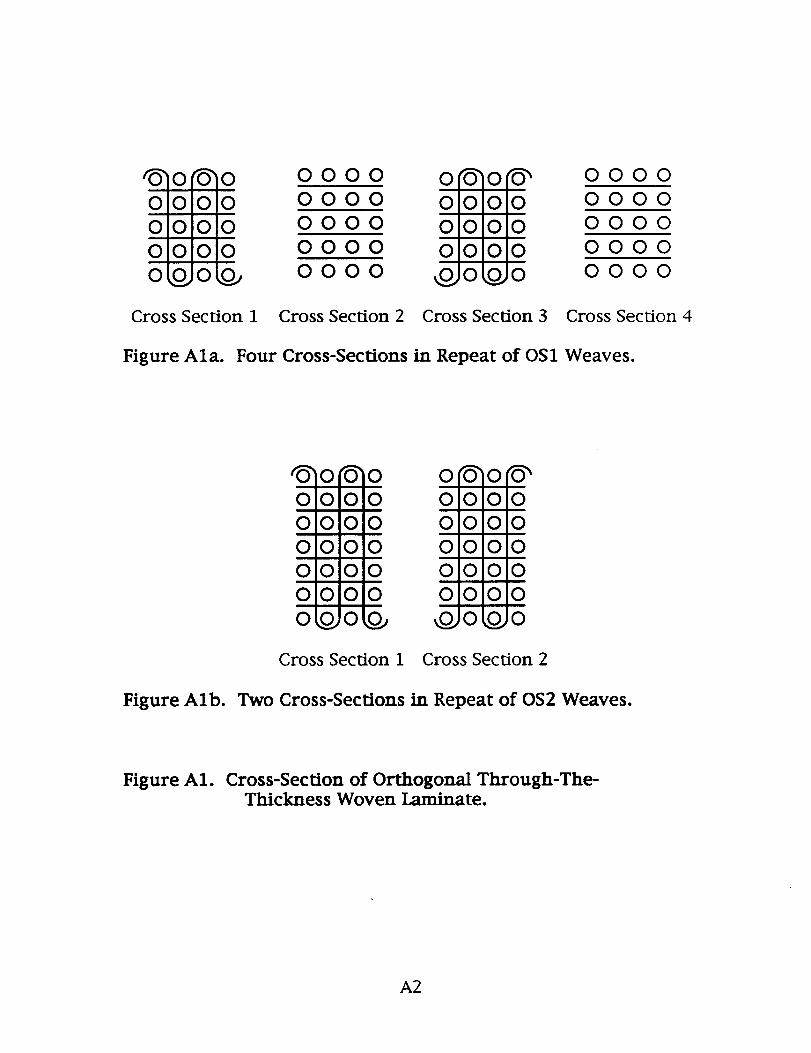
Appendix A: Unit Cells of 3-D Woven Materials
A1
0
3
O
0
0 0000 0
000 0000 DO0
000 0000 DO0
0_00 0000 DO0
oooo
0000
0 0000
0 0000
0 0000
0 0000
Cross Section 1 Cross Section 2 Cross Section 3 Cross Section 4
Figure Ala. Four Cross-Sections in Repeat of 0S1 Weaves.
Figure Alb.
rG0
0
00
0
0
Ol_'O 0I
0',00 _ 00I
C',O0 O 0 0I
3:00 O 00I
_',0 '0 O 00I
C',O 0 O 0 0I
6"0
0
0
0
0
0
Cross Section 1 Cross Section 2
Two Cross-Sections in Repeat of OS2 Weaves.
Figure A1. Cross-Section of Orthogonal Through-The-Thickness Woven Laminate.
A2
p o o o_ o o oz._x9°
oxoo/oo o',9o,loo o',9oo ooo ooo o cKoo o o o_ o o o c_
_/o o,,o o o,lo o',,p o o/o0 o o Ox_ o o oxozO °
Cross Section 1 Cross Section 2 Cross Section 3
Cross Section 4 Cross Section 5
Figure A2. Five Cross-Sections in Repeat of TS1 Through-the-Thickness Weaves.

o_ o o o 9,,o_ o o o o (_x,oo o 9/o o o,_ o o o/O o a
O0 000 -000
ooo5_ooooo.c_ooooo o qvo a,xoo o o O/Ooxo o o oo o/O o o Oxo o qv6 o o c_ o c_o_0 o o o o O,o,O o o o o O,,o,O
Cross Section 1
ooo9,o_oooo9,o_oooO0 0 O0 0 O0
_ 0,o o o o a,wp9,o o o o ox_ Q
o oo_ o 9_o o(_ o 9_o o ooooa_,,oooooo, o,oooo
Cross Section 3
_ o o o 9,o,9 o o o o 9o o o/o o c_ o o 9/o
bOO0 000 0
ooooo_ooooo9_oo_ o o o 9/o c_ o o o 9/o c_ o
oo ooCross Section 2
_ o oo o 9_ o o oo 9,o,9oo,_ o o 9,o o o,q o o 9,o o o,_o o_ 9,o o o o o,__9,,oo o o ooo9_ooooo_oooooo9,0o_ o oo 9,6a_ooo9_?0_o_oo_o_000000',0,'1300000",,0/00
Cross Section 4
o,o, o oooo(_,_ooooo,_ _oo_ooo
Oo oo o oo o
oooc_9,ooooo,_9,ooooooo_ooooog_oooooo9_o,_ooo9_o,_oo
Cross Section 5 Cross Section 6
o o o o 9,o_ o o o o 9m,_ o o° °
o0¢ooooo(_ooooo09,_ o'_ o o o 9,o o_ o o o 9/0o o o c_ o_o o o c_ o _o oo o o o (_,O,'D o o o o 0,0,0 o o
Cross Section 7
Seven Cross-Sections in Repeat of TS2 Through-the-ThicknessFigure A3. Weaves.

00000
00000o o% o00000Cross Section 1 Cross Section 2
00000
00000
o,'o,,o,,oxoCross Section 3
20000o% o00000
Cross Section 4 Cross Section 5
Figure A4a. Five Cross-Sections in Repeat of LS-1 Weaves.
_o,,oN;;_o _ ooooo0000000000 00000
o_o_o ooooo00000
ooooo 5ooooCross Section 1 Cross Section 2 Cross Section 3
00000
00000
00000
00000
OXO/O"xO,_Cross Section 4
00000
oooo o
00000
00000 00000Crossgection5 CrossSection6
00000
00000
oo oo00000
Cross Section 7
Figure A4b. Seven Cross-Sections in Repeat of LS-2 Weaves.
Figure A4. Cross-Sections of Layer-To-Layer Laminates.Note: All fibers are 3k, except for upper and lower surface weavers which are 1 k.
A5

Appendix B: Reproducibility of Measurements
The longitudinal moduli measured for the four 2-D triaxialbraids tested are given in Table B1. The table contains three entriesfor each type of strain gage and extensometer. These valuesrepresent the results of three separate specimen loadings. Anexamination of the data indicates that there was negligible change inthe measurements from loading to loading. The average moduli did
not vary from loading to loading. The scatter in the data, asmeasured by the standard deviation in the measurements was,similarly, unaffected by the repeated loadings. The data provide ameasure of the reproducibility of both the strain gage and theextensometer measurements.
Based on the reproducibility of the measurements from loading
to loading as seen by the data in Table B1, only the moduli computedfor the first specimen loadings were presented in the figures andtables in the main section of this report to simplify the discussion.
B1
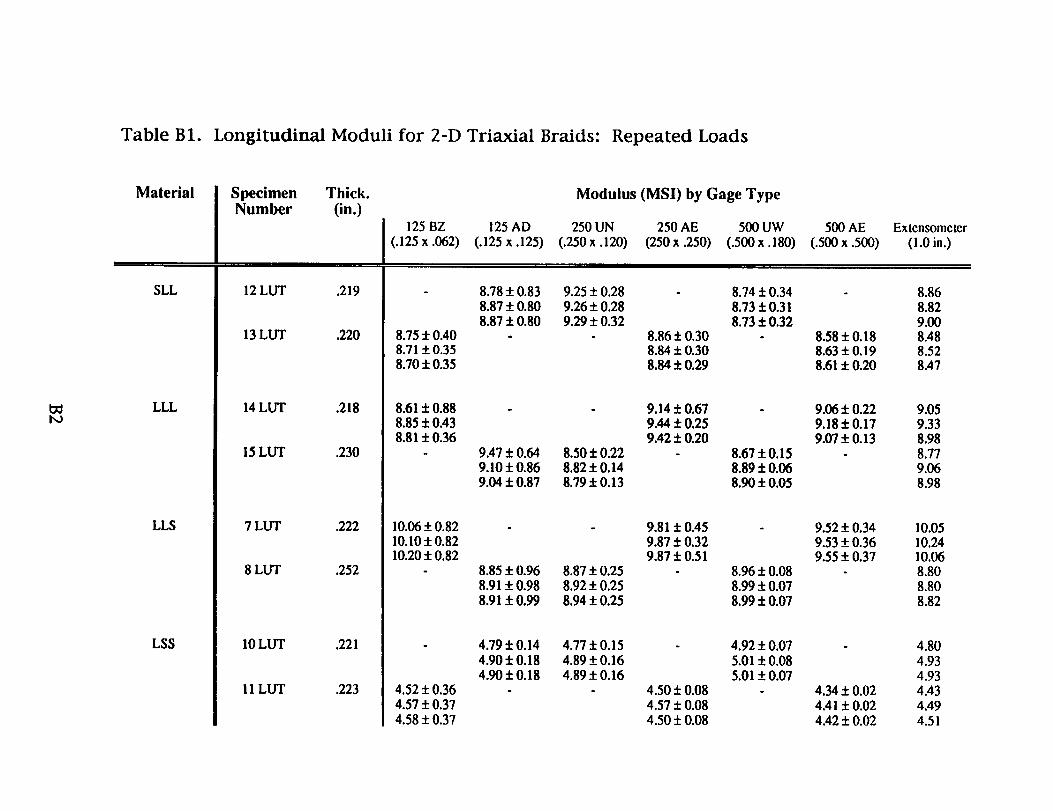
Table B1. Longitudinal Moduli for 2-D Triaxial Braids: Repeated Loads
bo
Material Specimen Thick.Number (in.)
SLL
LLI_
LLS
LSS
12 LUT .219
13 LIIT .220
14 LUT .218
15LOT .230
7LOT .222
8 LOT .252
10LUT .221
11 LOT
125BZ 125AD
(.125x.062) (.125x.125)
8.75± 0.408.71±0.358.70± 0.35
8.61 ± 0.888.85 + 0A38.81 ± 0.36
10.06 ± 0.8210.10+0.8210.20 ± 0.82
Modulus (MSI) by Gage Type
250 UN 250 AE 500 UW(.250x.120) (250x.250) (.500x.180)
8.78 + 0.83 9.25 ± 0.28 8.74 ± 0.348.87 ± 0.80 9.26 ± 0.28 8.73 + 0.318.87 ± 0.80 9.29 + 0.32 8.73 ± 0.32
8.86 + 0.308.84 ± 0.308.84 ± O.29
.223 4.52± 0.364.57± 0.37
4.58± 0.37
9.14 ± 0.679.44 ± 0.259A2 ± 0.20
9A7 ± 0.64 8.50+0.22 8.67+0.159.10± 0.86 8.82±0.14 8.89±0.069.04 ± 0.87 8.79 + 0.13 8.90 ± 0.05
9.81 ± 0.459.87 ± 0.329.87 ± 0.51
8.85 ± 0.96 8.87 ± 0.25 8.96 ± 0.088.91 + 0.98 8.92 ± 0.25 8.99 ± 0.078.91 + 0.99 8.94 ± 0.25 8.99 ± 0.07
4.79 + 0.14 4.77 ± 0.15 4.92 ± 0.074.90+0.18 4.89+0.16 5.01 +0.084.90±0.18 4.89+0.16 5.01 ±0.07
4.50 ± 0.084.57 ± 0.084.50 + 0.08
500 AE Extensomcter
(.500 x .500) (1.0 in.)
8.58+0.188.63 ± 0.198.61 ± 0.20
8.868.829.008.488.528.47
9.06 ± 0.229.18+0.179.07 ± 0.13
9.059.338.988.779.068.98
9.52 ± 0.349.53 ± 0.369.55 ± 0.37
10.0510.2410.068.808.808.82
4.34 + 0.024AI ± 0.024.42 ± 0.02
4.804.934.934.434.494.51

i
REPORT DOCUMENTATION PAGE FormApprovedOMB No. 0704-0188
Public repali_ burd4m tot th;,, o_lectlon of informalion / limaled 1o a_k'a0e 1 hour pw _ Inckxling the limb for revim_inQ tns_, umching mrslmg dala B_m:m,
galhedng and mamla_ the dala mmde(I, and o_n 0 and _ng lhe c_lectk_ ol infomlil_l. Send _ m_i/din 0 _ l_Jtd(if$ulinll_ Of any _ af,Csc¢ o( Ihi$
oolleclion of knfocmalion, incJuding suggestic_l lot redu¢_ _ I:x_rden, to W_hington He_ Sentlcli, D6mctorale 1o¢ Inlofm.alion O_ a_l I:_, 1215 Jetlerion Da_s
HiEs,w/, Sum 1204.Arlington,VA 22202-4302. andto 1heOlfcmo¢Managemm_andBuapt. Wal:eh_t Rmucmn Pn_ect(0704-01881,Wihingtm, IX: 20603.
1. AGENCY USE ONLY (Leave b/ank) 2. REPORT DATE
February 1996
4. TITLE AND SUBTITLE
Strain Gage Selection Criteria for Textile Composite Materials
6. AUTHOR(S)
John E. Masters
7. PERFORMINGORGANIZATIONNAME(S)AND ADDRESS(ES)
Lockheed Martin Engineering & Sciences144 Research Drive
Hampton, VA 23666
9. SPONSORING/MONITORINGAGENCYNAME(S)ANDADDRESS(ES)
National Aeronautics and Space AdministrationLangley Research CenterHampton, VA 23681-0001
3. REPORTTYPEAND DATESCOVERED
Contractor Report5, FUNDINGNUMBERS
Contract NASI-19000
WU 505-63-50-04
8. PERFORMING ORGANIZATIONREPORT NUMBER
10. SPONSORING/MONITORING
AGENCY REPORT NUMBER
NASA CR-198286
11. SUPPLEMENTARY NOTES
NASA Technical Monitor: I. S. Raju
12a.DISTRIBUTION/AVAILABILITYSTATEMENT
Unclassified - Unlimited
Subject Category 24
12b. DISTRIBUTION CODE
13. ABSTRACT (Maximum 200 words)
This report will provide a review of efforts to establish a set of strain gage selection guidelines for textilereinforced composite materials. A variety of strain gages were evaluated in the study to determine the sensitivity of strainmeasurements to the size of the strain gage. The strain gages were chosen to provide a range of gage lengths and widths.The gage aspect ratio (the length-to-width ratio) was also varied.
The gages were tested on a diverse collection of textile composite laminates. Test specimens featured elevendifferent textile architectures: four 2-D triaxial braids, six 3-D weaves, and one stitched uniweave architecture. Allspecimens were loaded in uniaxial tension. The materials' moduli were measured in both the longitudinal (parallel to the 0°yarns) and the transverse (perpendicular to the 0 ° yams) directions. The results of these measurements were analyzed toestablish performance levels for extensometers and strain gages on textile composite materials. Conclusions are expressedin a summary that discusses instrumentation practices and def'mes strain gage selection criteria.
14. SUBJECTTERMS
Braids, Weaves, Stitched Laminates, Strain Gage, Extensometer,Gage Length, Modulus
17. SECURITY CLASSIFICATION
OF REPORT
Unclassified
NSN 7540-01-280-5500
18. SECURITY CLASSIFICATIONOF THIS PAGE
Unclassified
9. SECURITY CLASSIFICATION
OF ABSTRACT
15. NUMBER OF PAGES
57
16.PRICE CODEA04
20. LIMITATION OF ABSTRACT
Standard Form 298 (Rev. 2-89)
Prescrll_d by ANSI SKI. Z39-18
298-102