strategic analysis of samsung's smartphone product portfolio
TRANSCRIPT

Strategic analysis of Samsung's smartphone product portfolio:Countering the challenge from Chinese competitors A
By
Soo Jin Go
Bachelor of Political Science, Korea University, 2006MBA, Sungkyunkwan University, 2015
MASSACHUSETT" INSTITuTEOF FECHNOL0LGY
JUN 2 4 2015
LIBRARIES
SUBMITTED TO THE MIT SLOAN SCHOOL OF MANAGEMENT IN PARTIAL FULFILLMENT OF THEREQUIREMENTS FOR THE DEGREE OF
MASTER OF SCIENCE IN MANAGEMENT STUDIESAT THE
MASSACHUSETTS INSTITUTE OF TECHNOLOGY
JUNE 2015
@2015 Soo Jin Go. All rights reserved.
The author hereby grants to MIT permission to reproduceand to distribute publicly paper and electronic
copies of this thesis document in whole or in partin any medium now known or hereafter created.
Signature of Author:
Certified by:
Accepted by:
Signature redactedMIT Sloan School of Management
Signature redacted May 8,2015
(I Michael A. CusumanoSMR Distinguished Professor of Management
Thesis Supervisor
Signature redactedU Michael A. Cusumano
SMR Distinguished Professor of ManagementProgram Director, M.S. in Management Studies Program
MIT Sloan School of Management
[Page intentionally left blank]
2

Strategic analysis of Samsung's smartphone product portfolio:Countering the challenge from Chinese competitors
By
Soo Jin Go
Submitted to MIT Sloan School of Managementon May 8, 2015 in Partial Fulfillment of the
requirements for the Degree of Master of Science inManagement Studies.
ABSTRACT
After entering the smartphone era, Samsung has recorded enormous growth in sales
and profits. It developed state of the art hardware technology and introduced innovative
features with its flagship models, the Galaxy S series. While it emphasized high-end product
development to compete with global vendors such as Apple, Samsung expanded its product
portfolio to the affordable segment. In the early stages, this strategy succeeded in increasing
revenues and market share. However, as Chinese vendors emerge in the global mobile device
market, Samsung has struggled to keep its market share in the low-end device markets.
Relatively cheap Chinese devices have attacked Samsung's affordable segment. Samsung's
strategy of utilizing economies of scale and the halo effect from flagship models was not
effective to compete against the price competitiveness of Chinese. Since the dynamic aspects of
competition and the importance of platform are increasing, Samsung needs to build a new
sustainable portfolio strategy integrating its platform service and hardware portfolio.
Thesis Supervisor: Michael A. Cusumano
Title: SMR Distinguished Professor of Management
3

[Page intentionally left blank]
4
Table of Contents
A BSTRACTT ................................................................................................................................................................ 3
Chapter 1: Introduction ...................................................................................................................................... 8
1.1. M otivation................................................................................................................................................8
1.2. Objectives and m ethodology ...................................................................................................... 9
1.3. Sam sung Electronics overview ................................................................................................. 10
Chapter 2: A nalysis of the early sm artphone m arket...................................................................... 11
2.1. M obile devices m arket trend.................................................................................................... 11
2.2. The advent of Chinese vendors................................................................................................. 14
2.3. Sam sung's early sm artphone portfolio strategy................................................................. 15
Chapter 3: Analysis of mid and low-end segments in the smartphone market......................19
3.1. M obile devices m arket trend.................................................................................................... 19
3.2. A scending Chinese com petitors.............................................................................................. 23
3.3. Samsung's portfolio strategy for the mid-end segment................................................. 32
Chapter 4: Recom m endations....................................................................................................................... 38
4.1. N ew challenges in the m id and low -end segm ents............................................................... 38
4.2. Case study - Benchmarking Xiaomi's successful case ..................................................... 39
4.3. Sam sung's lim itations ...................................................................................................................... 41
4.4. Recommendation for Samsung's product portfolio strategy........................................ 42
Chapter 5: Conclusion....................................................................................................................................... 44
References............................................................................................................................................................. 46
5
List of Figures
Figure 1. IT & Mobile Communications Division Revenue and Profit in Samsung.......9
Figure 2. Global Mobile Phone Sales: Smartphone vs Feature Phone 2008-2013 .... 12
Figure 3. Global Mobile Phone Market Share 2007 - 2013............................................. 13
Figure 4. Galaxy S Series Sales Units...................................................................................... 15
Figure 5. Regional Smartphone ASP and Chinese Average Manufacturing Cost........16
Figure 6. Worldwide Smartphone Vendor Market Share 2011.Q1 - 2012.Q1........18
Figure 7. Sales of Smartphones by Region 2013-2018 .................................................. 20
Figure 8. Sales of Smartphones - Developed vs Emerging World .............................. 20
Figure 9. Smartphone Sales Units and ASP Trend ............................................................. 22
Figure 10. Smartphone Priceband Forecast Chart - Units ............................................. 22
Figure 11. Worldwide Smartphone Vendor Market Share 2011.Q3 - 2014.Q4 ......... 24
Figure 12. Smartphone Sales Units of Chinese Manufacturers..................................... 27
Figure 13. Smartphone Market Share in the Mid-end Segment - below $200 ........... 28
Figure 14. Smartphone Market Share in China 2012 - 2014....................................... 29
Figure 15. Mobile Phone Market Share in China 2007 - 2013 .................................... 29
Figure 16. Product Portfolio by Price - Huawei ................................................................ 31
Figure 17. Product Portfolio by Price - ZTE........................................................................ 31
Figure 18. Samsung's Smartphone Market Share by Regions....................................... 35
Figure 19. Operating Margin of Smartphone Manufacturers ........................................ 37
6

List of Tables
Table 1. Worldwide Top Five Smartphone Vendors Shipments, Market Share and
Year-Over-Year Growth 2011-2012............................................................................. 13
Table 2. Samsung and Huawei Low-end Smartphone in 2011....................................17
Table 3. Smartphone ASP Forecast in Region..................................................................... 23
Table 4. Worldwide Top Five Smartphone Vendors Shipments, Market Share and
Year-Over-Year Grow th...................................................................................................... 25
Table 5. Mobile Phone Shipments by Region, 2012 and 2013 ..................................... 26
Table 6. Smartphone Main Components from Chinese Vendors................................. 27
Table 7. Samsung Galaxy S3 Mini, Galaxy S3 and Xiaomi Mi3....................................... 34
Table 8. Samsung Mid-end Smartphone Line-up ............................................................. 36
Table 9. Chinese Mid-end Smartphone Line-up................................................................ 36
7
Chapter 1: Introduction
1.1. Motivation
Samsung Electronics announced an earnings shock in 2014. Its revenue generated
is 206 trillion Korean won and profit is 25 trillion won. This result is called "earnings shock"
because its revenue decreased 9.8% from the previous year and profit decreased almost 32%
from the previous year. Most of the profit decreases are caused by a huge drop of revenues
and profits of the IT & Mobile Communications division. Due to low demand for new
products in the mobile market and keen competition from rivals like Apple's iPhone6, the
IM division recorded a 15 trillion Korean won profit, half of its previous profits. Until this
year, the mobile device business has been in a leading position to make most profits in the
corporation and to raise brand image as a global leading technology company. After
launching Galaxy S in 2010, mobile devices have increased their share of revenue and profit
in Samsung internally (up to 60.7% and 67.8% of revenue and profit, respectively), as well
as in absolute money amounts. The strategy of Samsung to expand its smartphone portfolio
to the low and mid-end range also contributed to increasing its market share as well as
revenues and profits. However, as consumer electronics such as mobile devices are
becoming commodities, price competition increases and the margin is getting lower.
Chinese competitors have diversified the aspect of competition in the past few years. Rising
Chinese companies in the market are intensifying this price war in the entry-level devices
market. In addition, major manufacturers in China have developed mobile communication
technology in order to keep up with multinational players such as Samsung and Apple.
Samsung has struggled to keep its market share in the market, faced with challenges from
8
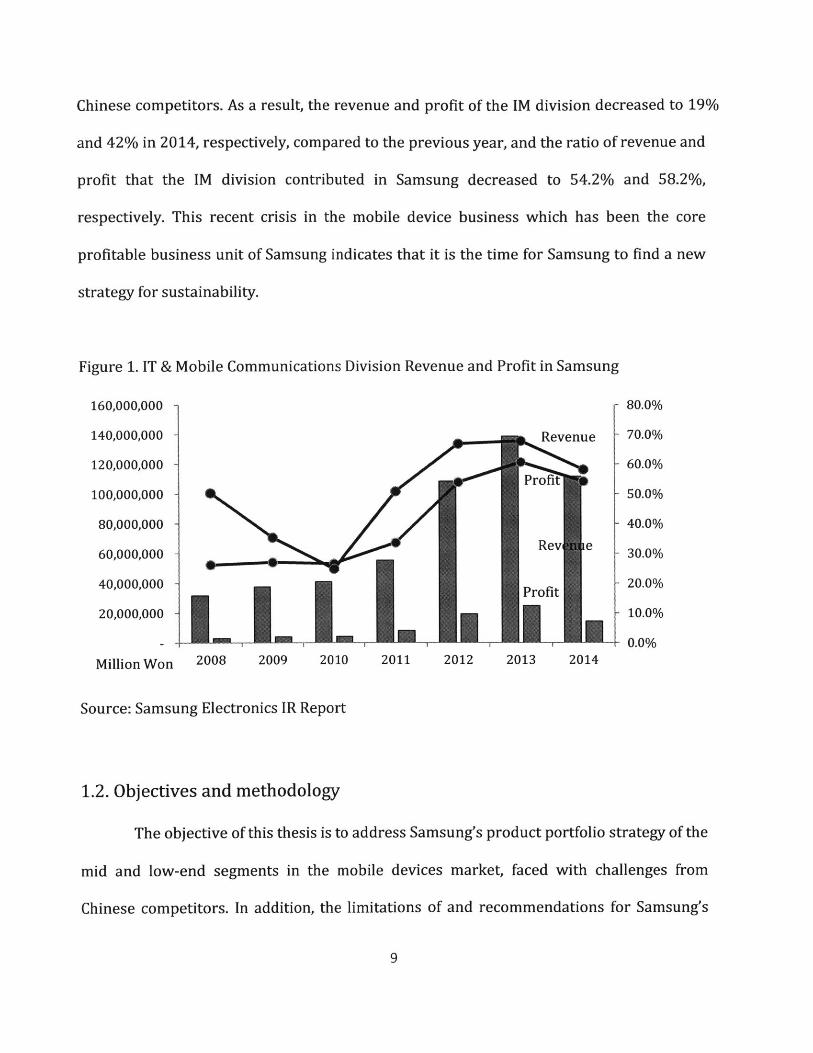
Chinese competitors. As a result, the revenue and profit of the IM division decreased to 19%
and 42% in 2014, respectively, compared to the previous year, and the ratio of revenue and
profit that the IM division contributed in Samsung decreased to 54.2% and 58.2%,
respectively. This recent crisis in the mobile device business which has been the core
profitable business unit of Samsung indicates that it is the time for Samsung to find a new
strategy for sustainability.
Figure 1. IT & Mobile Communications Division Revenue and Profit in Samsung
160,000,000 80.0%
140,000,000 Revenue 70.0%
120,000,000 60.0%
100,000,000 50.0%
80,000,000 40.0%
60,000,000 30.0%
40,000,000 Profit 20.0%
20,000,000 10.0%
- r0.0%
Million Won 2008 2009 2010 2011 2012 2013 2014
Source: Samsung Electronics IR Report
1.2. Objectives and methodology
The objective of this thesis is to address Samsung's product portfolio strategy of the
mid and low-end segments in the mobile devices market, faced with challenges from
Chinese competitors. In addition, the limitations of and recommendations for Samsung's
9

strategy is derived from that analysis. In this research, the change of market trends in this
segment will be reviewed in Chapter 2 and 3. According to the market trends, the case
study includes not only the strategy of Chinese competitors but also the strategies Samsung
has deployed to counter these threats. Finally, the limitations and recommendations for
Samsung's portfolio strategy will be described in the conclusion.
1.3. Samsung Electronics overview
Samsung Electronics Co., Ltd. is a South Korean multinational electronics company.
(Samsung, 2013) It is the world's largest information technology company. The company
achieved a record consolidated net income of US$26.2B on sales of US$ $268.8B in 2013. Its
main products are consumer electronics, IT & Mobile Communications, and device
solutions. It has manufacturing plants and sales networks in 80 countries and more than
370,000 employees around the world. Samsung has a unique organizational structure,
operating 10 independent business units. They are coordinated under three divisions.
Consumer Electronics (CE) consists of visual display, digital appliances, printing solutions,
and health and medical equipment business units. IT & Mobile Communications (IM)
encompasses the mobile communications, networks, and digital imaging business units.
Device Solutions (DS) includes memory, system LSI, and LED. Through relentless
innovations and research, the company has continued its successful growth and enhanced
its brand image in the global market, ranked 7th in Interbrand's best global brands 2014.
Samsung Electronics aspires to create new technologies that inspire the world. To fuel this
innovation, the company operates more than 30 R&D centers around the globe. In 2012, it
10

invested US$10.8B in R&D, with more than 60,000 employees worldwide dedicated to
developing future technologies.
Chapter 2: Analysis of the early smartphone market
2.1. Mobile devices market trend
Before the smartphone era, Nokia occupied a dominant place in the mobile devices
market for over 10 years. Nokia succeeded in transiting to 2G digital technology while
Motorola was clinging to 1G analog technology. (Kim, 2011) By having a strong cost-
efficient platform strategy, SCM, and distribution channel structure all around the world,
Nokia sold various products from high-end PDAs to low-end black and white display
cellphones in huge volumes. However, with the popularization of smartphones in 2009, the
center of gravity of the mobile phone market began to move into the smartphone business.
Steve Jobs announced the first iPhone in 2007 at MacWorld Expo Keynote. Smartphones
had already existed in the mobile phone market like the Nokia Symbian or Blackberry but
the iPhone was the first device offering easy and diversified applications. Apple provided
not only hardware with an operating system but also software with diversified applications.
Consumers could utilize their mobile phones as personal computers with various
applications such as the Safari web browser, E-mail, and navigations. Apple has developed
a digital platform to distribute mobile apps on iOS, allowing third parties to develop
applications with the iOS SDK. Apple opened the App Store on July 10, 2008, and now more
than 1,400,000 applications are available in the app store. (January, 2015) Apple has
recorded tremendous sales and profits every year. Over 500 million units of the iPhone
11

series were sold on March, 2014. This accomplishment took only 7 years after Steve Jobs
announced the first iPhone in 2007. At the same time, Nokia, Motorola, and LG that were
feature phone central firms fell sharply in market share. Nokia failed to transit to a
successful smartphone OS in the global market after the iPhone came out. Apple brought
out a new form of competition, based on software (operating system) as well as hardware
(devices). The two prominent OSs, Android and iOS, are expanding market share drastically
whereas Symbian that was almost the only smartphone OS before is shrinking. Nokia stuck
to the Symbian OS that was less convenient and innovative than iOS or Android.
In 2011, Samsung took the No.1 position from Nokia in the mobile devices market.
According to Gartner data, feature phone sales have decreased rapidly while smartphone
sales started to ramp up at a rapid pace from 2011. The traditional champions who were
stuck in the existing product portfolio lost sales and shares except for Apple and Samsung
who started to expand the smartphone portfolios.
Figure 2. Global Mobile Phone Sales: Smartphone vs Feature Phone 2008-2013
400,000 - -
350,000
300,000Feature Phone
250,000
200,000
Smartphone150.000
100,000
50,000-
1Qo8 4QO8 3Q09 2010 1Q11 4Q11 3Q12 2Q13
Source: Gartner
12

Table 1. Worldwide Top Five Smartphone Vendors Shipments, Market Share and Year-Over-
Year Growth 2011-2012
(Units in Millions)
2012 2012 2011 2011 Year-Over-Vendor Shipment Market Shipment Market Year Change
Volumes Share Volumes Share
Samsung 215.8 39.6% 94.2 19.0% 129.1%
Apple 136.8 25.1% 93.1 18.8% 46.9%
Nokia 35.1 6.4% 77.3 15.6% -54.6%
HTC 32.6 6.0% 43.6 8.8% -25.2%
RIM 32.5 6.0% 51.1 10.3% -36.4%
Others 92.4 16.9% 136 27.5% -32.1%
Total 545.20 100.0% 495.30 100.0% 10.1%
Source: IDC Worldwide Quarterly Mobile Phone Tracker
Figure 3. Global Mobile Phone Market Share 2007 - 2013
40% -36% 36%
35% -2%
30% -
25% -6% % 8% Samsung
20% - 2% 0%
15% - % 6% 1 Nokia
10% - 0 Apple0
5% 0 0 7% % LG0 1%20/ %3% Lenovo
0%
2007 2008 2009 2010 2011 2012 2013
Source: Euromonitor from Trade Sources/National Statistics
13
i MWW- -M-

2.2. The advent of Chinese vendors
The technology to manufacture smartphones in China was developed from a gray-
market (named "Shan-Zhai) in 2007. After the Chinese government removed the policy of
the approbation for mobile phone manufacturing, small-sized vendors started to imitate
well-known smartphones such as iPhone. In addition, these manufacturers provided
unique functions such as mobile TV or dual SIM mode. According to a survey by iSuppli in
2009, they sold 145 million units in 2009, which accounted for 35% of market share in
China. (Liao and Hsieh, 2012)
Big IT companies and OEM vendors in China started to pay attention to the
smartphone market and entered the market in 2011. Huawei and ZTE are global
telecommunications equipment manufacturers, and Lenovo is a global PC maker. Hisense
and TCL are LCD TV production companies in China. They had already built competitive
technology related with the IT and communication fields. In addition, OEM manufacturers
such as Tyenwi, Gionee and OPPO have grown their manufacturing capacity and experience.
Huawei and ZTE built strong relationships with operators, supplying communication
equipment. They possessed technology enough to provide quad-core devices with high
R&D investment as global suppliers of communication equipment. However, weak brand
awareness in the global market made it difficult for them to enter developed countries.
They provided "white box" handsets that Chinese vendors manufactured with operators'
brand names to carriers using strong relationship with operators in order to easily enter
the mobile devices market.
14
2.3. Samsung's early smartphone portfolio strategy
Launching the Galaxy S (19000) in June 2010, Samsung started to develop its
Android smartphone portfolio in earnest. Before Android, Samsung also had Symbian-
based PDAs and smartphone lines. In addition, Windows messaging phones such as the
Black Jack series (i607 and i617) were sold in the business market segment against
Blackberry products. These early smartphone products were positioned in the niche
product segment in Samsung's portfolio at that time. However, the Galaxy S was launched
as a flagship model in 2010. Before the Galaxy S, Samsung launched Omnia I and II,
Windows mobile OS based smartphones in 2008 and 2009, but it failed with customers
harshly criticizing its technical malfunctions.
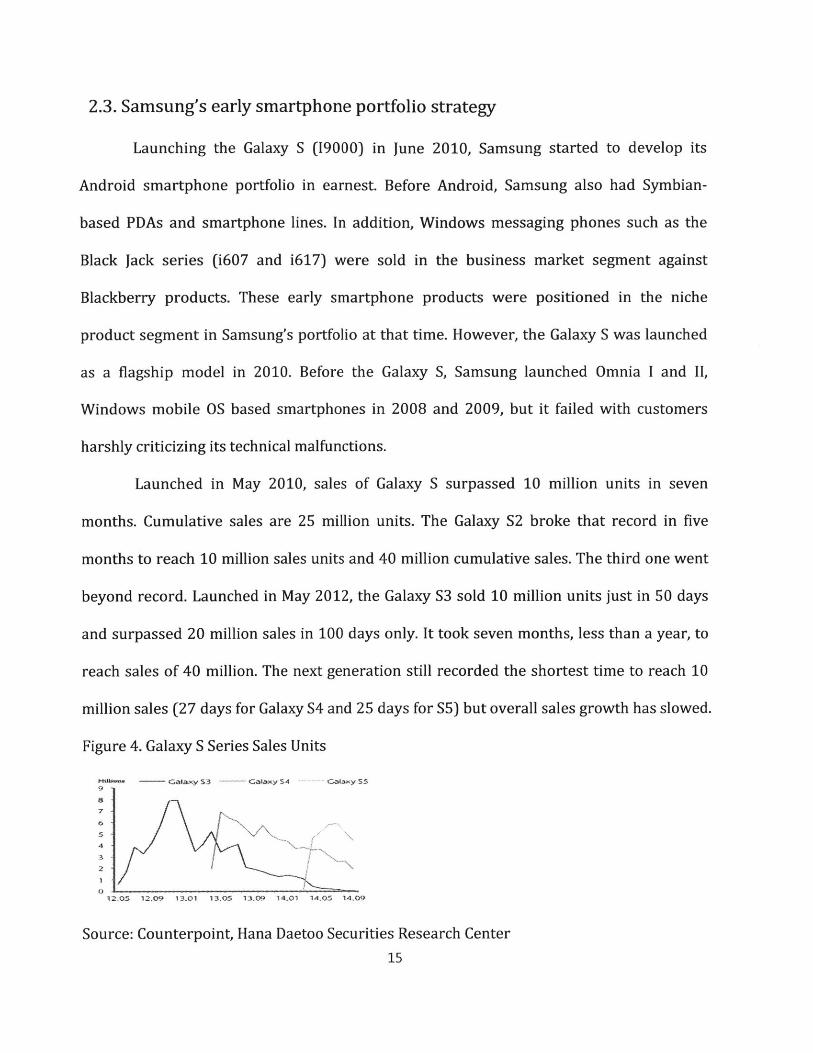
Launched in May 2010, sales of Galaxy S surpassed 10 million units in seven
months. Cumulative sales are 25 million units. The Galaxy S2 broke that record in five
months to reach 10 million sales units and 40 million cumulative sales. The third one went
beyond record. Launched in May 2012, the Galaxy S3 sold 10 million units just in 50 days
and surpassed 20 million sales in 100 days only. It took seven months, less than a year, to
reach sales of 40 million. The next generation still recorded the shortest time to reach 10
million sales (27 days for Galaxy S4 and 25 days for S5) but overall sales growth has slowed.
Figure 4. Galaxy S Series Sales Units
Hikh. G~a~ $3 Galaxy $4 Galaky SS
Source: Counterpoint, Hana Daetoo Securities Research Center
15
Samsung kept an eye on Chinese OEM vendor's performance in the global market.
Based on contracts with telecommunication operators, they increased sales and share
gradually. They launched entry smartphones with a relatively low technology barrier.
Cheaper chip solutions such as MediaTek were provided in domestic areas and Android
open OS was easy to develop. In addition, they have cost competitiveness in manufacturing
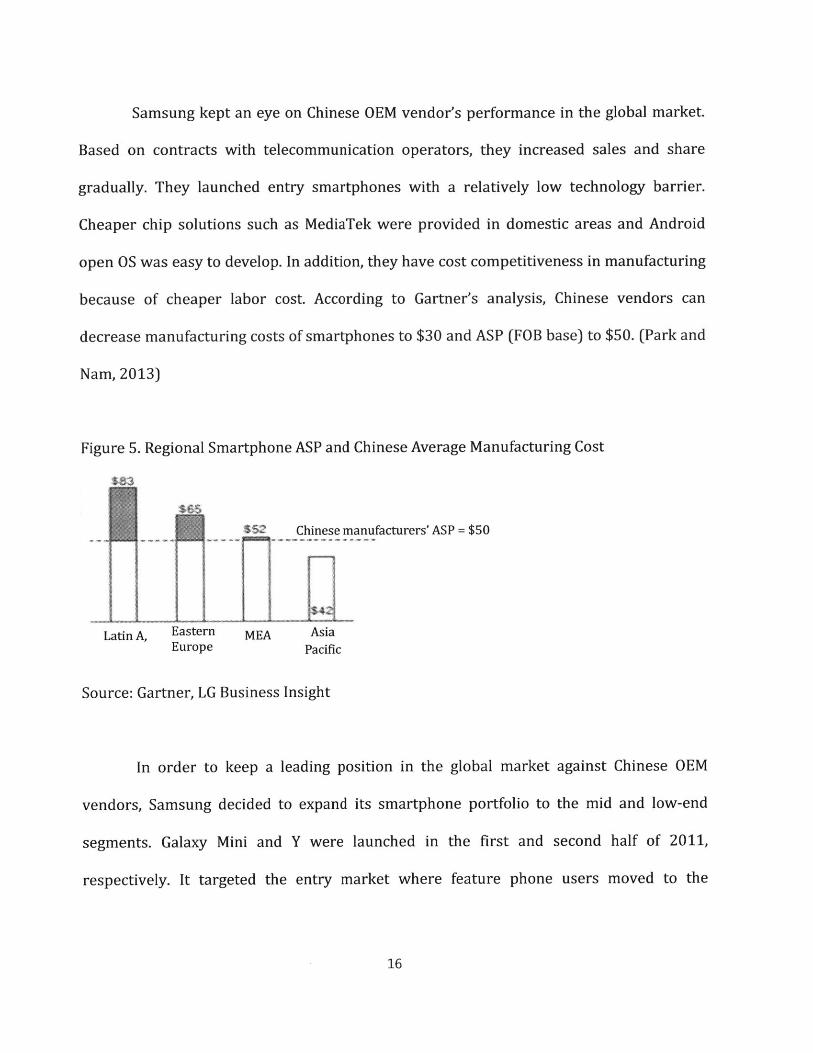
because of cheaper labor cost. According to Gartner's analysis, Chinese vendors can
decrease manufacturing costs of smartphones to $30 and ASP (FOB base) to $50. (Park and
Nam, 2013)
Figure 5. Regional Smartphone ASP and Chinese Average Manufacturing Cost
$ Chinese manufacturers' ASP = $50
Latin A, Eastern MEA AsiaEurope Pacific
Source: Gartner, LG Business Insight
In order to keep a leading position in the global market against Chinese OEM
vendors, Samsung decided to expand its smartphone portfolio to the mid and low-end
segments. Galaxy Mini and Y were launched in the first and second half of 2011,
respectively. It targeted the entry market where feature phone users moved to the
16

smartphone segment for the first time. These products had a smaller display size around
3.0" and basic features for Android OS to match its affordable price.
Table 2. Samsung and Huawei Low-end Smartphone in 2011
Samsung Galaxy Mini Samsung Galaxy Y Huawei U8650 SonicS5570 S5360
Image
Price* $150 $120 $145
Launch 2011.02 2011.10 2011.07
Network HSDPA7.2 HSDPA7.2 HSDPA7.2
3.14" 240x320 pixels 3.0" 240x320 pixels 3.5" 320x480 pixels
Display TFT TFT TFT
Android OS, v2.2OS(FroO), pg l Android OS, v2.3.5 Android OS, v2.3.3
OS (Froyo), upgradable .Gnebed Gnebedto 2. (inerred) (Gingerbread) (Gingerbread)to v2.3 (Gingerbread)
160 MB, 384 MB RAM, 180 MB, 290 MB RAM, 160 MB, 256 MB RAM,Memory microSD microSD microSD
Camera 3.15 MP 2MP 3.15 MP
Battery Li-Ion 1200 mAh Li-Ion 1200 mAh Li-Ion 1400 mAh
Bluetooth, A-GPS, Bluetooth, A-GPS, Bluetooth, A-GPS,microUSB, microUSB, microUSB,
Accelerometer, Accelerometer, Accelerometer,
Etc., Proximity, Compass, Proximity, Compass, Proximity, Compass,
Document Document Document
viewer/editor, viewer/editor, viewer/editor,
Photo/video editor Photo/video editor Photo/video editor
* Price: Retail Price in India and Pakistan
17

This strategy of expanding its portfolio was so successful that Samsung took the
first position in the smartphone market against Apple from 2011. While Apple sold its
iPhone series only in the premium product segment, Samsung provided various products
with a wide range of prices and specifications. With this product portfolio strategy of
providing a wide range of models, Samsung could keep its momentum in the mobile
devices market from the second half of 2011.
Figure 6. Worldwide Smartphone Vendor Market Share 2011.Q1 - 2012.Q1
35 %
30 % 29.1% Samsung
27.0- Others25 %% 24.2% Apple
20 % 18.3
15 % 1&.6%
10% - 8.2% Nokia6.7% RIM
5% 4.8% HTC
0%fo1l 2011 3011 4011
Source: IDC Worldwide Quarterly Mobile Phone Tracker
18
Chapter 3: Analysis of mid and low-end segments in the smartphone
market
3.1. Mobile devices market trend
As the matured market is saturated in developed countries, the emerging market is
becoming a target group for higher margins and volumes. Mobile device manufacturers
have paid attention to the emerging market with more potential customers as a new target
group because demand in developed countries is becoming more restrictive to grow.
According to Counterpoint and Hana Daetoo Securities Research Center, the penetration of
smartphones in developed countries is reaching to almost 88% while the penetration in
developing countries is below 70% of the global average. (Kim, 2014) The developed
market is depending on replacement demand for sales. Therefore, the emerging market is
becoming the main driver in smartphone sales growth. Even though the Chinese market is
expected to show slower sales growth in the long run, the country's vast population will
generate volume growth. (Golovko, 2014) In China and in India, mainly with a younger
generation, a significant number of feature phone users are trying to upgrade to the
smartphone segment. Several vendors are targeting this consumer group who are
interested in the latest technology but with a low budget by providing various models at a
cheaper price. (Pandey and Nakra, 2014)
19

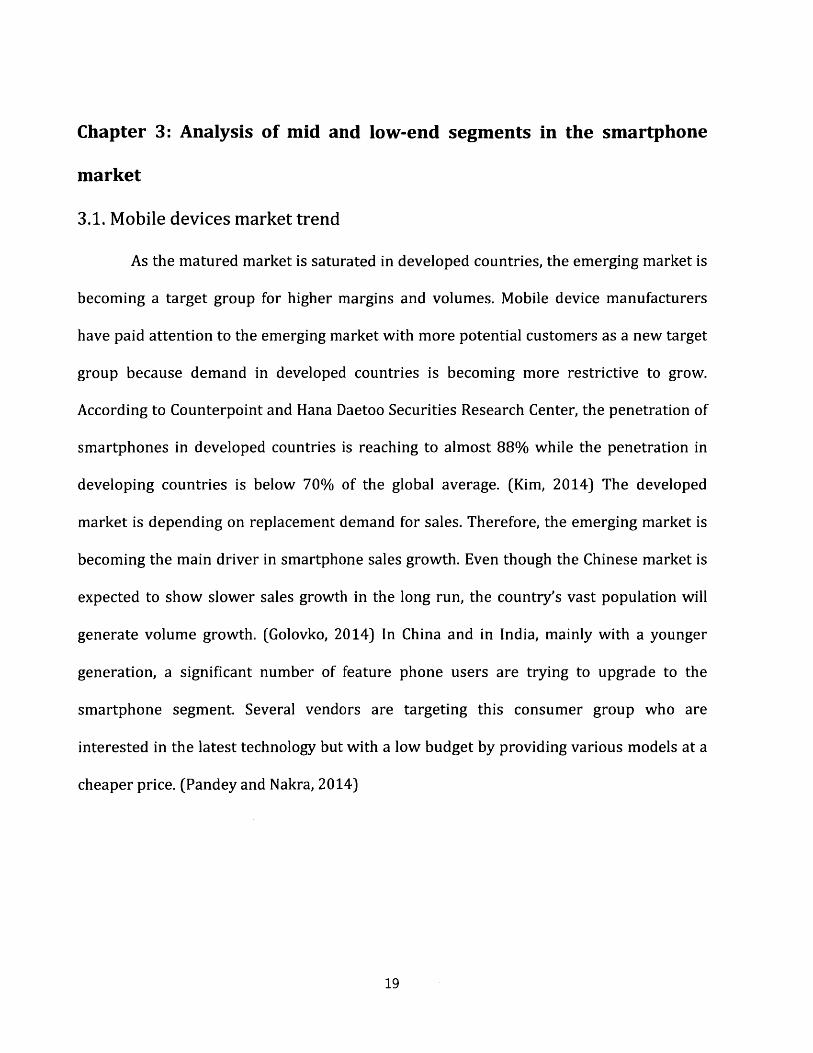
Figure 7. Sales of Smartphones by Region 2013-2018
20
1 8
1 6
1 4
1
1
0
2
6
2013 2014 2015 2016
m Northfka Arnierac3
-u fv1ddl1. East anrd A.truca
2017 2018
mVV4sterrn EjrCope
FotRes-t cpl Ass.
St Rest <>I t"*- WVorsc1
Source: Euromonitor International Passport Consumer Electronics Outlook, Trends and
Analysis (2014, September)
Figure 8. Sales of Smartphones - Developed vs Emerging World
Million
1.8001.600
1.400
1.20
1.000
600
400
200
0
]Devloped.cou
Emer. n
-. -. The ratio of emerging cuntries
Lnutries Countries
80%
70%
60%
50%
40%
30%
20%
10%
0%2008 2000 2010 2011 2012 2013E 2014E 2015E
Source: Strategy Analytics, Hanwha Investment and Securities Co., Ltd Research Center
20
0 4
02
0,0
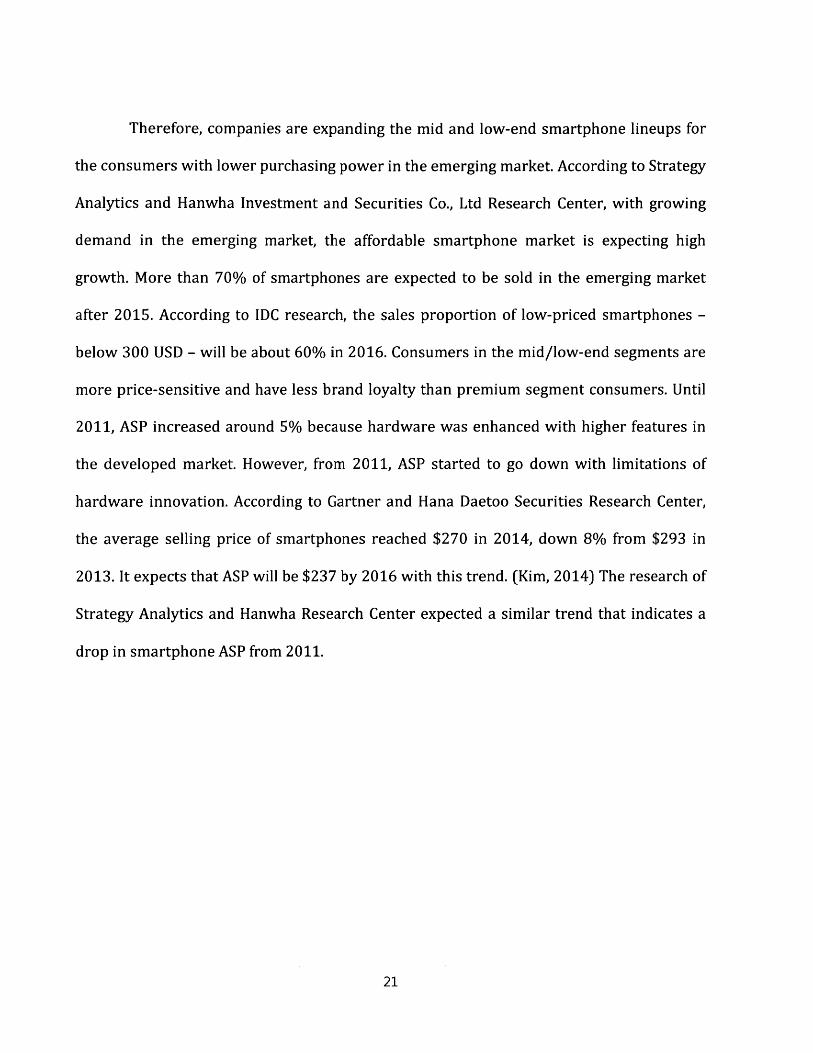
Therefore, companies are expanding the mid and low-end smartphone lineups for
the consumers with lower purchasing power in the emerging market. According to Strategy
Analytics and Hanwha Investment and Securities Co., Ltd Research Center, with growing
demand in the emerging market, the affordable smartphone market is expecting high
growth. More than 70% of smartphones are expected to be sold in the emerging market
after 2015. According to IDC research, the sales proportion of low-priced smartphones -
below 300 USD - will be about 60% in 2016. Consumers in the mid/low-end segments are
more price-sensitive and have less brand loyalty than premium segment consumers. Until
2011, ASP increased around 5% because hardware was enhanced with higher features in
the developed market. However, from 2011, ASP started to go down with limitations of
hardware innovation. According to Gartner and Hana Daetoo Securities Research Center,
the average selling price of smartphones reached $270 in 2014, down 8% from $293 in
2013. It expects that ASP will be $237 by 2016 with this trend. (Kim, 2014) The research of
Strategy Analytics and Hanwha Research Center expected a similar trend that indicates a
drop in smartphone ASP from 2011.
21

Figure 9. Smartphone Sales Units and ASP Trend
- Sales Unit
2008 2009
"*e ASP
million1.600
1.400
1.200
1.000
600
400
200
02012 2013E 201AE
Source: Strategy Analytics, Hanwha Investment and Securities Co., Ltd Research Center
Figure 10. Smartphone Priceband Forecast Chart - Units
100%
90%
80%
70%
60%
50%
40%
30%
20%
10%
0%
$700+
$650 - <$700
$600 - <$650
=$sso-<$600SSOO- <$550
* $4SO- <$500
a S400 -<$450
*$350-<$400
*$300-<$3SO
*$250- <$300
N$200 -<$250
N$150-<$200E $100 - 4150
E$50-<$100
N$0- <$50
2008 2009 2010 2011 2012 2013 2014 2015 2016
Source: IDC Market Analysis Perspective: Worldwide Mobile Phone Market, Dec. 2013
22
2010 2011
360
-340
- 320
-300
- 280
- 260
- 240
- 220
-200ZOSE
0. Ev-

Table 3. Smartphone ASP Forecast in Region
'10 '11 '12 '13 '14(F) '15(F) '16(F)North $402 $411 $435 $424 $399 $375 $346
AmericaWestern $345 $362 $362 $363 $330 $302 $280Europe
Asia $287 $301 $279 $248 $228 $216 $204
Latin $287 $296 $271 $243 $234 $226 $220AmericaEastern $283 $281 $287 $275 $264 $245 $230Europe
MEA $277 $274 $252 $246 $237 $230 $224
Global $329 $334 $319 $293 $270 $253 $237
Source: Gartner, Hana Daetoo Securities Research Center
3.2. Ascending Chinese competitors
From 2012, the global smartphone market has been deployed with competition
between Samsung and Apple, and Chinese vendors are in hot pursuit. Sales and profits of
earlier champions such as Nokia or HTC are slumped while Chinese vendors show a steady
growth trend. Huawei, ZTE, Lenovo, and Xiaomi have come to the front in the global market.
The rapid increase in low-end smartphone sales has driven the growth of these players.
According to Gartner's findings in 2014, Samsung sold 73.2 million smartphones
worldwide during the third quarter of 2014; shipments were down from the 80.4 million in
the third quarter of 2013. While Samsung is struggling, Xiaomi's sales record has risen to
15.8 million units from 3.6 million during the same period. They secured fourth place with
5.2% market share worldwide in the fourth quarter of 2014. (Reisinger, 2014) Chinese
23

vendors, Huawei, Lenovo, and Xiaomi have expanded global market share at around 5%
which is a similar level as LG.
However, this expansion is based on the growth of the Chinese domestic market.
According to CCS Insight, in 2013, the Chinese market increased 76% than in 2012, from
168 million to 296 million. The Chinese smartphone market occupied around 29% of the
global market in 2013, increasing from 23% in 2012.
Figure 11. Worldwide Smartphone Vendor Market Share 2011.Q3 - 2014.Q4
35.0% -
30.0% -
25.0% Samsung
20.0% Apple
15.0% -
10.0% LenovoHuawei
5.0% omi
0.0% -tL11.Q311.Q412.Q112.Q212.Q312.Q413.Q113.Q213.Q313.Q414.Q114.Q214.Q314.Q4
Source: IDC Worldwide Quarterly Mobile Phone Tracker
24
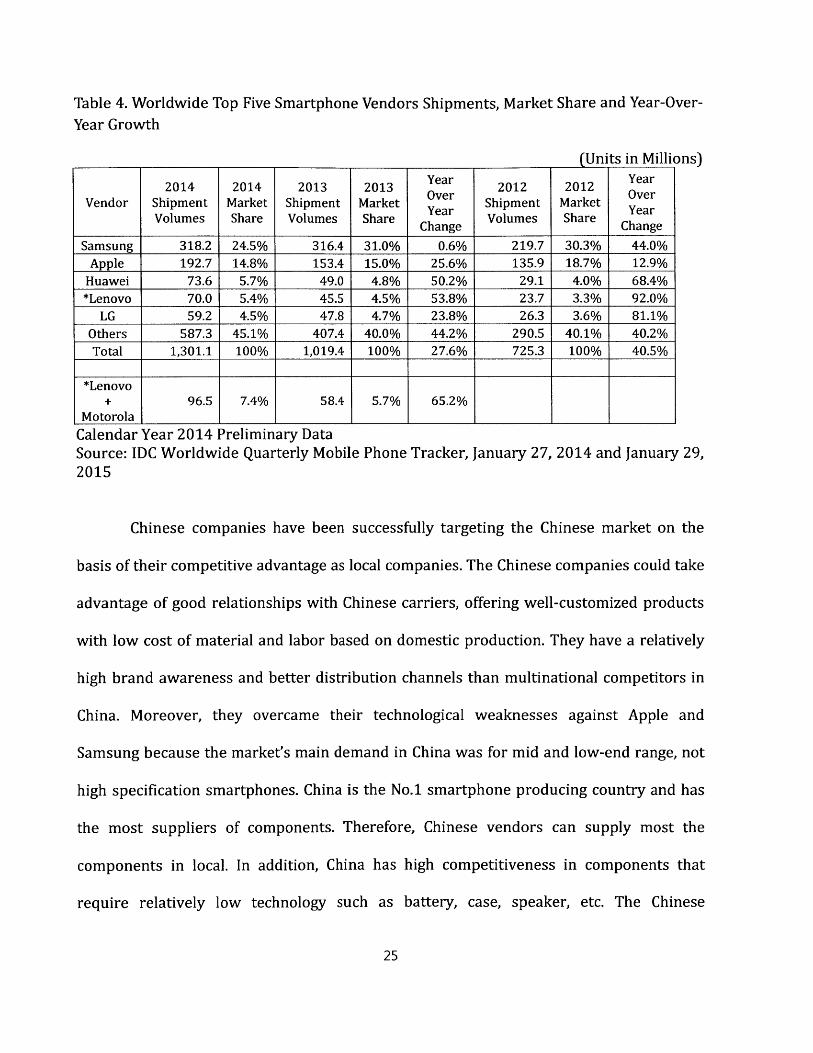
Table 4. Worldwide Top Five Smartphone Vendors Shipments, Market Share and Year-Over-
Year Growth
(Units in Millions)
2014 2014 2013 2013 Year 2012 2012 YearVendor Shipment Market Shipment Market Over Shipment Market Over
Volumes Share Volumes Share Year Volumes Share Chag_____Change Change
Samsung 318.2 24.5% 316.4 31.0% 0.6% 219.7 30.3% 44.0%Apple 192.7 14.8% 153.4 15.0% 25.6% 135.9 18.7% 12.9%
Huawei 73.6 5.7% 49.0 4.8% 50.2% 29.1 4.0% 68.4%*Lenovo 70.0 5.4% 45.5 4.5% 53.8% 23.7 3.3% 92.0%
LG 59.2 4.5% 47.8 4.7% 23.8% 26.3 3.6% 81.1%Others 587.3 45.1% 407.4 40.0% 44.2% 290.5 40.1% 40.2%Total 1,301.1 100% 1,019.4 100% 27.6% 725.3 100% 40.5%
*Lenovo+ 96.5 7.4% 58.4 5.7% 65.2%
Motorola 1 1Calendar Year 2014 Preliminary DataSource: IDC Worldwide Quarterly Mobile Phone Tracker, January 27, 2014 and January 29,2015
Chinese companies have been successfully targeting the Chinese market on the
basis of their competitive advantage as local companies. The Chinese companies could take
advantage of good relationships with Chinese carriers, offering well-customized products
with low cost of material and labor based on domestic production. They have a relatively
high brand awareness and better distribution channels than multinational competitors in
China. Moreover, they overcame their technological weaknesses against Apple and
Samsung because the market's main demand in China was for mid and low-end range, not
high specification smartphones. China is the No.1 smartphone producing country and has
the most suppliers of components. Therefore, Chinese vendors can supply most the
components in local. In addition, China has high competitiveness in components that
require relatively low technology such as battery, case, speaker, etc. The Chinese
25

government has expanded its supporting policies and investment for the mobile device
business and communication technology. China has decided telecommunication and
information industry as the main industry to enhance competitiveness in the global market.
It organized the "IMT-2020 Promotion Group" in February 2012 in order to develop 5G
technology. (Kim, 2014)
Table 5. Mobile Phone Shipments by Region, 2012 and 2013
Total Smartphones
FeaturePhones
Total Smartphones(%)
FeaturePhones
(Units in Millions)Growth in 2013 1
Smartphones
North 201 127 74 201 157 44 0% 24% -41%America (15%)Latin 174 68 106 180 90 90 3% 32% -15%America (9%)Western 183 119 64 184 144 40 1% 21% -38%Europe (14%)Eastern 111 44 67 114 57 57 3% 30% -15%Europe (6%)MEA 279 76 203 297 107 190 6% 41% -6%
(10%)Asia Pacific 776 301 475 859 472 387 11% 57% -19%
(46%)China 337 168 168 385 296 89 14% 76% -47%
(29%)India 213 43 170 240 65 175 13% 51% 3%
(6%)Developed 92 63 29 94 73 21 2% 16% -28%markets (7%)Emerging 135 27 108 140 38 102 4% 41% -6%markets (4%)
Total 1724 735 989 1835 1027 808 6% 40% -18%
Source: CCS Insight
26
2012 Shipments 2013 Shipments
Total FeaturePhones

Figure 12. Smartphone Sales Units of Chinese Manufacturers
800
Units (millios)
600
0
Source: Gartner
Table 6. Smartphone Main Components from Chinese Vendors
China/Taiwan SuppliersMemory
Semi-Conductor RA/RF
System on Chip MediaTek, Spreadtrum, Hisilicon,System___nChipLeadcore, RockchipCamera Module Sunny Optical, Truly, BYD, Lite-on Tech
Display Truly, Tianma, BYDE, BOETouch Panel 0-film tech, Truly, TPK, Wuhu token
Components PCB Kingboard, Goworld, CompegAcoustic AAC, GoerTek, GettopBatteries BAK, BYD, Scud
Source: Morgan Stanley
27

Figure 13. Smartphone Market Share in the Mid-end Segment - below $200
2013.09 2014.09
Huawei,6%
Nokia, LG, 6%Nokia, Alcatel, Lenovo, Nokia, Lenovo,7% 7% 4% 7%
Source: Gartner
In the third quarter of 2014, Samsung's market share in China plunged to 9%,
compared to 16% in 2013. Top Chinese brands such as Xiaomi, Lenovo, and Huawei
increased sales with aggressive promotion of high-end smartphones at low-price. The
average selling price of Chinese vendors is $ 100, whereas ASP of Samsung is $393 and
Apple's is $688. Looking at the Chinese market and Chinese companies, Chinese
manufacturers occupied 76% of market share in the Chinese smartphone market in the
first half of 2014 whereas multinational companies including Samsung, Apple and Nokia
took 57.3% of market share in 2011. Eight out of the top 10 companies are Chinese ones.
These companies are rapidly taking into the market share of foreign companies. (Kim, 2014)
28
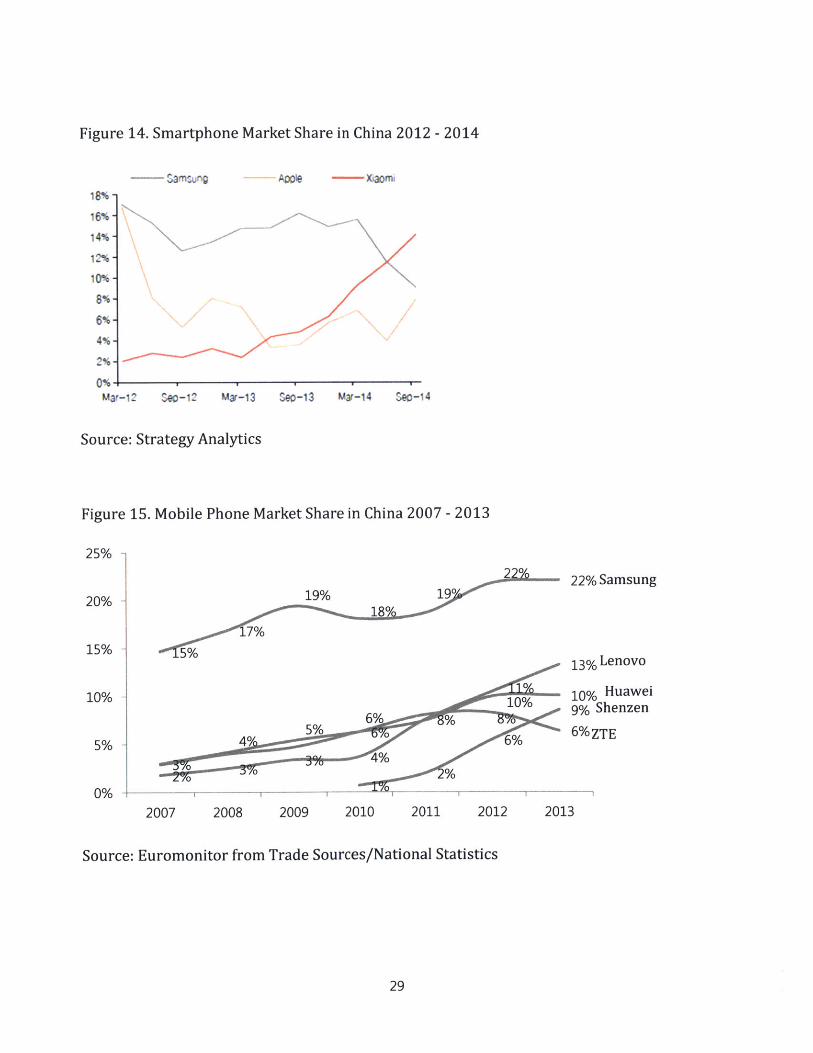
Figure 14. Smartphone Market Share in China 2012 - 2014
SSamseur Axile - aomi
x
N
Mar-14 Seo-14
Source: Strategy Analytics
Figure 15. Mobile Phone Market Share in China 2007 - 2013
25% -
29% 1922% Samsung
20% -198 9
15% 1 5%
2007
13% ~1%Lenovo
10% Huawei9% Shenzen
6%ZTE10/o
6%%5% Vc
40 4%* %O
2008 2009 2010 2011 2012 2013
Source: Euromonitor from Trade Sources/National Statistics
29
18%-
16%-
14%-
12%-
10%-
8%-
6%-4%-
2% -
Mar-12 seo-12 Mar-13 Seo-13
10% ~
5% -
U0O +-----

Qualitative innovation for smartphones is almost reaching the limit while
quantitative growth of devices and services continues. Chinese followers are closing the
technology gap with leaders such as Samsung and Apple since smartphone technology is
becoming standardized. Even Apple launched a lower cost model, the iPhone 5C, because of
market pressure. In addition, Chinese vendors have grown in technology innovation at a
rapid pace while Samsung and Apple have gone through a slowdown. For example, Huawei
developed its own AP (application processor). OPPO had the first smartphone with a 50
million pixels camera and Xiaomi launched the thinnest smartphone (5.5mm). By
developing their own technology, they started to expand their product portfolio from low-
end to mid-range models. Huawei established a production plant for premium products
and expanded M&A with European semi-conductor companies in order to secure high-end
technology. It has invested 14.2% of revenues in R&D in 2014 which was twice as much
as Samsung's R&D spending ratio of 6.4%. Even though Samsung spent more than twice
Huawei did on R&D ($13.4B, $6.6B, respectively), the relative numbers to overall revenue
implies that Huawei is focusing on developing technology first. Huawei's investment in
R&D even exceeds Apple's R&D spending, which was recorded at $6B in 2014, 3% of
annual revenue. Lenovo acquired Motorola in 2014 and expanded R&D and production in
Wuhan. It also bought the NFC patent from NEC Japan.
30

Figure 16. Product Portfolio by Price - Huawei
2013.10
$400- S500
1300-1400
$200 -$300
$100 -$200
$100 uxder
0% 10% 20% 30% 40%. 50% 60%
Source: Counterpoint, Hana Daetoo Securities
Figure 17. Product Portfolio by Price - ZTE
2013.10
5400-S500
$300 -$400
$200-S300
$100 -200
Sl00 under
1400- $500
1300-5400
1200-$300
1100-1200
S100 under
0% 10%
Research Center
1400-S500
5300-S400
1200-S300
1100-1200
$100 under
2014.09
0% 10% 20% 30% 40%
Source: Counterpoint, Hana
50% 6M% 7ft 0% 10% 20% 30% 40% 50% 60%
Daetoo Securities Research Center
Xiaomi reduced its prices through direct online distribution to end consumers.
Xiaomi provided high-end smartphones at half the price of Apple and Samsung at around
300-400 USD. Therefore, its amount of sales in China increased 15.8 million units in the
third quarter of 2014, from 3.6 million units of the same quarter in 2013. Xiaomi became
31
2014.09
20% 30% 40%
M

the best smartphone seller in China with 14% market share. It has captured the attention of
early adaptors using its distinguished marketing strategy and unique operating system,
imitating Apple's.
The commoditization of smartphone is leading the high volume growth in an
emerging market. The next target countries are India, Middle Asia, and Africa as China has
led market growth for a couple of years. These are the lowest income countries so price
competition would be fiercer causing worse profit for the whole industry. (Song, 2014)
Samsung's profit has decreased from the third quarter in 2014 and Chinese high-end
brands such as Lenovo and Huawei started to go through a slowdown in volume growth.
Even though sales units increased overall, operating profit of most main players decreased
significantly because of dropping ASP and increasing marketing costs. In order to expand
market share and secure enough profit, Chinese manufacturers are starting to pay
attention to potential in other regions.
3.3. Samsung's portfolio strategy for the mid-end segment
Given the more intense competition in the mid and low-end segments, cost
competitiveness is determined to be a more important issue. 60% of smartphone
components in Samsung are provided by internal production. This vertical integration in
production costs can be taken advantage of via aggressive pricing. One of the Samsung's
strengths is large and diverse manufacturing base. (Loo, 2015) Samsung occupies several
affiliates related to components of mobile devices unlike competitors who outsource most
components to third parties. It has 6 manufacturing plants only for mobile devices around
the world, including Korea, China, Vietnam, India and Brazil. These factors allow to
32

Samsung establish economies of scale and control costs. Samsung outperformed with good
quality and price competitiveness by R&D investment and mass production system at
product maturity stage rather than leading innovation at the early stage. It provided a wide
range of smartphones with various specifications and prices.
Samsung launched the "Mini Series" in 2012. Galaxy III Mini was a sub brand of
Galaxy S III. It had a similar platform and design identity as the flagship model, but had
lower specifications such as smaller display and lower camera resolution. It was aimed to
take a halo effect from the flagship model. This strategy that utilized derived products
applied a strong brand image and power of expansive products to less expensive items.
This lower price product was targeted to make consumers have same image and
expectations as the Galaxy S III by utilizing a powerful brand image. It was aimed at
satisfying two consumers' expectations: price and product functions.
33

Table 7. Samsung Galaxy S3 Mini, Galaxy S3 and Xiaomi Mi3
Samsung 18190 Samsung 19300 XiaomiGalaxy III Mini Galaxy S III Mi3
Image
Price $341 $699 $327
Launch 2012.11 2012.05 2013.12Network HSPA14.4/5.76Mbps HSPA21.1/5.76Mbps HSPA42.2/5.76Mbps
4.0" 480x800 pixels 4.8" 720x1280pixels 5.0" 1080x1920pixelsDisplay sAMOLED sAMOLED IPS LCD
Android OS, v4.0.4(Ice Android OS,OS OS, Cream Sandwich), v4.3(JellyBean),
4.3(JellyBean) 4.4.2 (KitKat)
Memory 8/16GB, 1GB RAM, 16/32/64GB, 1GB 16/64GB, 2GB RAMmicroSD RAM, microSD
Camera 5MP+VGA 8MP+1.9MP 13MP+2MP
Battery Li-Ion 1500 mAh Li-Ion 2100 mAh Li-Ion 3050 mAh
1.4GHz Quad-core 2.3GHz Quad-core Krait
1GHz Dual-core Cortex-A9, 400, Accelerometer,Cortex-A9, Accelerometer, Gyro, Gyro, Proximity,
Etc., Accelerometer, Gyro, Proximity, Compass, S Compass, Fast battery
Proximity, Compass Voice language charging: 60% in 30commands and min (Quick Charge 2.0)
dictation
However, Samsung lost significant market share in 2014. Samsung was a solid No.1
player in every region except North America. Furthermore, it had more than a 20% point
gap with the second player except in China. However, it dropped to the second position in
China with 0.1% point gap with Xiaomi and the market share decreased in every region,
especially more than 10% points in the emerging markets. Therefore, its global market
34
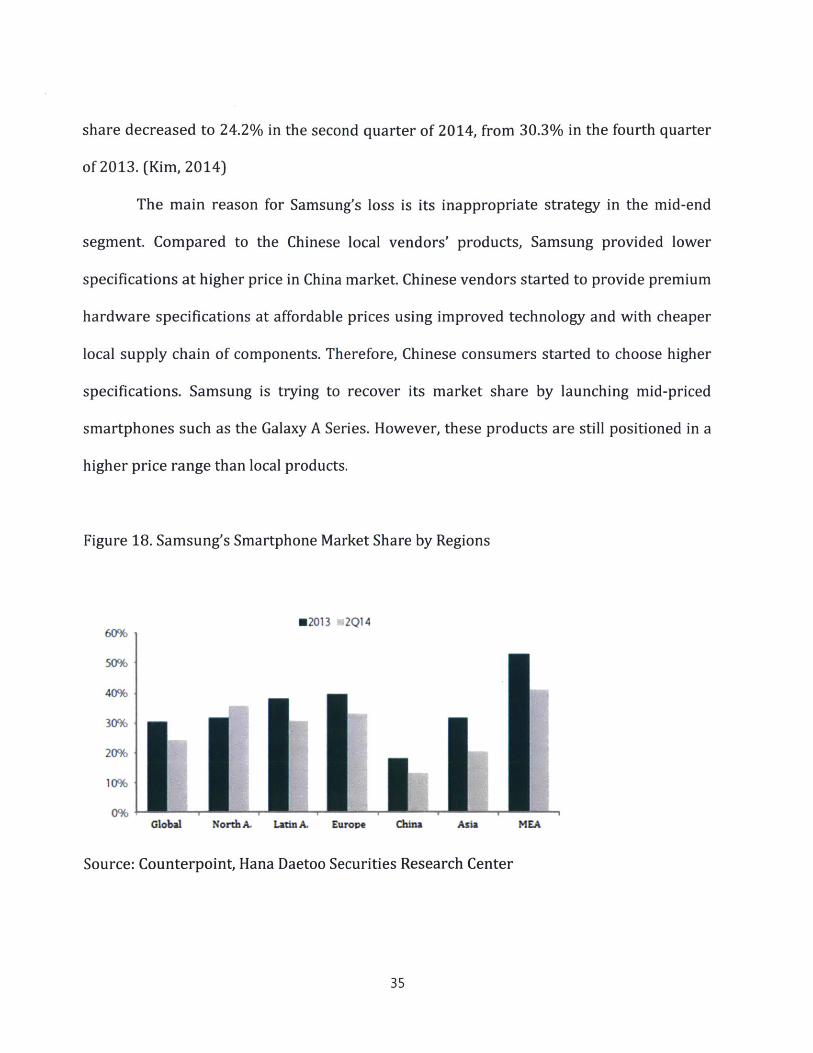
share decreased to 24.2% in the second quarter of 2014, from 30.3% in the fourth quarter
of 2013. (Kim, 2014)
The main reason for Samsung's loss is its inappropriate strategy in the mid-end
segment. Compared to the Chinese local vendors' products, Samsung provided lower
specifications at higher price in China market. Chinese vendors started to provide premium
hardware specifications at affordable prices using improved technology and with cheaper
local supply chain of components. Therefore, Chinese consumers started to choose higher
specifications. Samsung is trying to recover its market share by launching mid-priced
smartphones such as the Galaxy A Series. However, these products are still positioned in a
higher price range than local products.
Figure 18. Samsung's Smartphone Market Share by Regions
*2013 %2Q1460%
50%
40%
30%
20%
10%
0%Global NorthA. Latin A. Europm China Asia MEA
Source: Counterpoint, Hana Daetoo Securities Research Center
35

Table 8. Samsung Mid-end Smartphone Line-up
Galasy S Duos 3 Galaxy Ace 4 Galaxy Core 2 Galaxy Young 2
Image
Price $140 $270 $215 $120. 121.4x62.9x10.8 121.4x62.9x10x9.109.8x59.9x11.8Dimension 130.3x68x9.8 mm
mm mm mmWeight 124g 123.8g 138g 108g
AP 1200 MHz 1000 MHz 1200 MHz 1000 MHzCore/ Dual Core Quad Core Single Core
Chipset DulCrRAM 512MB 512MB 768MB 512MB
Display 4.0", 480x800 4.0", 480x800 4.5", 480x800 3.5", 320x480Camera 5M + VGA 5M + VGA 5M + VGA 3.15MBattery 1500mAh 1500 mAh 2000mAh 1300 mAh
Source: Hana Daetoo Securities Research Center
Table 9. Chinese Mid-end Smartphone Line-up
ZTE Blade L2 Huawei Honor 3C Xiaomi Mi 1S Lenovo A850+Play
Image
Price $140 $95 $130 $150
Dimension 142.5x72.2x9mm 142.2x72.3x9.4m 137x69x9.9mm 150x77x8.9mmm
Weight 166g 156g 158g 161gAP 1300 MHz 1300 MHz 1600 MHz 1400 MHz
Choset Quad Core Quad Core Quad Core Octa Core
RAM 1GB 1GB 1GB 1GBDisplay 5.0", 480x854 5.0", 720x1280 4.7", 720x1280 5.5", 540x960Camera 8M or SM +VGA 8M + 2M 8M +1.6M SM + VGABattery 2000 mAh 2000 mAh 2000 mAh 2500 mAh
Source: Hana Daetoo Securities Research Center
36

The fierce competition in the mid and low-end smartphone segment would be
expected to lead Samsung to a chicken game of losing its own profit, like in the semi-
conductor industry. Therefore, the success of lower price range smartphones depends on
creating other added values besides prices. (Song, 2014) Samsung's operating margin of
the IM division in 2014 dropped significantly to 13%, compared to 18% in 2013. The main
reason was lower sales records of the Galaxy S5 and the rise of mid-priced smartphones in
China. (Song, 2014) The Mini Series was also affected by poor reputation of the flagship
model. It showed that losing the leading position in mid-priced segment brings about a loss
of profits.
Figure 19. Operating Margin of Smartphone Manufacturers
30%
20%
0%
-10%-
-20%-Mar-
Samsung -A00e - Huawei
- Lenv - ZE- C0010ad
TCL
08 Mar-09 Mar-10 Mar-11 Mar-12 Mar-13 Mar-14
Source: Strategy Analytics
37
I

Chapter 4: Recommendations
4.1. New challenges in the mid and low-end segments
Recently, Chinese vendors are turning their attention to other markets out of China.
Xiaomi started to sell products in Singapore from 2014 and announced its launch in the
Indian market. In 2014, 6 Chinese players entered the Indian market. Lenovo launched 12
models in India from 2013, providing a wide price range of products from 4,000 to 36,000
rupees. The Middle East and Africa is another big emerging market for these vendors.
According to IDC research, the number of smartphones sold in Q3 2014 was up 300% year
on year. 40% of total handset shipments which reached 64 million units in Q2 2014 are in
the smartphones category. The leading countries are mostly GCC (Gulf Cooperation Council)
members such as UAE, Saudi Arabia, Turkey, and Kuwait but more developing countries in
sub-Saharan Africa are following the smartphone market growth at a rapid pace. The
primary factor is the extremely low-cost of devices from Chinese vendors. The main
Chinese vendors such as Huawei and Lenovo already entered this market and offered more
affordable devices than Apple and Samsung. According to IDC research, Huawei recorded
second place in the smartphone market, jumping its market share from 2% to 10% in Q2
2014. Samsung still remains the concrete leader with 45% market share but is struggling to
keep its position with 8% points market share drop from a year ago. (Shetty, 2014) In
addition, local brands outsourcing their phones from the production catalogues of
independent manufacturers in China have worked well with better functions but at much
lower prices than the main players. Tecno in Nigeria and Kenya is an example whose
smartphone shipments were up 269% year on year in Q3 2014. (Shetty, 2015)
38
Besides aggressive Chinese competitors, traditional players are preparing to start
over in the market. Nokia with Microsoft announced three mid-range segment devices on
September 4, 2014: Lumia 830, Lumia 730 Dual SIM, and Lumia 735. With high-end
specifications, 5" display, 10 megapixel camera, and LTE connectivity, Lumia 830 was
positioned in the mid-range price range, -E330/US$430. The others are clearly more
affordable than Lumia 830: Lumia 730 Dual SIM retailing at E199/US$257 and the Lumia
735 at E219/US$283D. (Llamas, 2014) For the entry market, Nokia launched the X series in
2014. The Nokia X retails at 89 euros and features a 4" touchscreen and a 3MP camera. The
Nokia X+ increases the memory and storage and raises the price to 99 euros. Finally, the
Nokia XL brings a 5" touchscreen and a front-facing 2MP camera for 109 euros. (Llamas,
2014) Surprisingly, Nokia utilized Android OS for lower specification and price. Nokia
targets the below $150 smartphone market, where 322.6 million units were sold
worldwide in 2013.
4.2. Case study - Benchmarking Xiaomi's successful case
Xiaomi's strategy is distinctive from other Chinese vendors. It gives up profit from
hardware, so provides well-featured smartphones at significantly low prices. Instead of
hardware sales, Xiaomi pursues profit from content and services. Its ultimate goal is
becoming a contents and services provider like Amazon, Google, or Facebook. Xiaomi has a
plan to expand its product portfolio to TV and home appliances in order to lock in more
users to its own eco system. Xiaomi's smartphones are still under the Android platform, but
Xiaomi created a unique and attractive user experience. Lei Jun, the founder and CEO of
39
Xiaomi, created a custom ROM in open source Android, named MiUI. MiUI has MiCloud, a
web storage service and MiTalk, a cross platform web-based messaging system. (Golovko,
2014) Xiaomi's user experience through MiUI, MI, aims at consolidating software,
hardware and services of all home appliances. By active discussion with Xiaomi product
users, Xiaomi has developed user-friendly features on its platform. After achieving
popularity with MiUI, he made a bet on a low-price and high-volume strategy in the market.
The price range is almost half of Samsung and Apple with similar specifications, so it could
capture first time smartphone users in China. As soon as they experienced Xiaomi's UX,
consumers became big fans of Xiaomi smartphones. Xiaomi spent little money for
marketing activities, depending on word of mouth and online direct distribution. Xiaomi
provides added value for consumers besides price. Therefore, Xiaomi has quickly emerged
as one of the largest smartphone manufacturers in 2014. This success comes from an
integrated strategy between hardware and platform. Xiaomi created a user friendly
platform which was transformed from Android and attracted consumers by affordably
priced high feature hardware. Although it has achieved most of the current success in China
where the government restricts Google and Android and supports Chinese platforms, the
next movement to foreign markets is expected by confirmed platform and product strategy
from millions of customers.
40

4.3. Samsung's limitations
Samsung has made an attempt to enhance its software competitiveness. However,
Samsung is evaluated as a hardware manufacturer, experiencing the failure of launching its
own operating system, Bada. Bada was an operating system based on Linux, mainly
developed by Samsung and Intel. Samsung initiated this development to target the
integration of a wide range of devices including smartphones, tablets, TVs, PCs, and other
consumer electronic appliances. This project started as LiMo (Linux Mobile) Foundation in
2007 and changed its name to Tizen Association in 2012. Samsung launched the Wave
series based on the Bada OS from 2009. However, it failed to expand its share in the
smartphone OS category and was absorbed into the Tizen project in 2013. Samsung
launched only two wearable smart watches with Tizen. However, without launching
hardware devices which is the core of mobile eco system, application developers cannot
help leaving the system, and vice versa.
In addition, Samsung established the MSC (Mobile Solution Center) in 2008 to
encourage development of content and services. It opened the "Samsung Mobile Innovator"
website for third parties to develop mobile software in October 2008. (Kim and Rhee, 2011)
In this website, application developers around the world shared ideas and were supported
to commercialize applications in "Samsung Apps". Furthermore, Samsung tried to secure
contents by strategic cooperation with contents providers such as Warner Brothers and
Universal Studios. The early strategy was to provide cross device contents to differentiate
products from Nokia. Samsung tried to expand its consumer range by providing compatible
contents to mobile, TV, laptop, and so on. However, Samsung considers software as
complementary to selling more hardware devices. The management level in Samsung
41

evaluated that content and services business can play a supporting role for making
hardware business as well as software business sustainable. Apple created a business
model of value added virtuous circle where device and content supports dramatic growth
in the market for each other. Looking at Apple's case, Samsung defined that the
sustainability of contents and services business had the capability to influence growth of its
core business continuously and repetitively. However, as a traditional hardware
manufacturer it faced high risk in jumping into a new business with high fluctuations.
Therefore, Samsung obtained contents by cooperation with contents providers instead of
developing them itself. Therefore, Samsung made an alliance with Google and became the
best contributor of Android's success.
4.4. Recommendation for Samsung's product portfolio strategy
Currently, more than hardware sales, contents and services are becoming the main
source of big revenue and profit. (Loo, 2015) As in Apple's success, controlling software is a
key factor of the company's success these days. Many successful companies in the IT
industry possess platforms in the eco systems like Google and Apple. Apple has established
a concrete ecosystem to seize power over content and services in the applications market.
Apple provides convenient SKD, a Software Development Kit and 70% of revenue per share
for application developers to lure them to join iOS spontaneously. (Kim and Rhee, 2011)
Apple succeeded in securing 1.4 million kinds of unique application software, two practical
online shops (iTunes music store and Apple App store) and simple operating systems (OS X
for Mac and iOS for iPhone and iPad) for customers.
42

There is an opportunity for Samsung to develop another OS in order to provide
more value for consumers. Xiaomi's success (MiUI) shows a good example of how to
circumvent the Android OS. Samsung has accumulated enough technology development
and experience of trial and error in the software business. Samsung can offer a distinctive
value using its core competency: convergence. Samsung needs to develop Tizen as an
operating system to unify multiple devices including mobile, TV, home appliances, and so
on. Samsung is perhaps the only manufacturer that is able to build this convergence eco-
system because it has all business divisions including consumer electronics, IT & mobile
communications, and device solutions. It has already settled mass production sites, R&D,
and distribution channels around the world. Using massive resources, Samsung can
develop a convergence OS easier than other competitors. This economy of scale also
supports its strong hardware strategy integrating price and marketing. Established high-
end technology and mass production can elaborate its marketing strategy to attract more
consumers in the ecosystem. Therefore, Samsung can create its own eco system and retain
its leadership in the fierce competition.
43
Chapter 5: Conclusion
Samsung has occupied the No.1 position in the global market just after its transition
to the smartphone portfolio. Apple is the only rival in this specific segment and its
distinguished product portfolio strategy which offers a wide range of products and has
succeeded in increasing sales units and revenues. However, the smartphone market
saturation is causing a shift towards low cost competition. Samsung needs to find a new
strategy to sustain its revenue growth. The war in the mid and low-end segments against
Chinese competitors is totally different from the war with Apple. Upon the same operating
system which is open for everyone, Samsung should attract more customers by very
limited differentiating points. What is worse, competitors have strength in price
competitiveness, which is the most important point for consumers of this segment.
Furthermore, as soon as they dominate the low-end market, Chinese competitors started to
encroach on premium segments with competitive prices, which is Samsung's main source
of share and profits. They aim to increase profits by securing a strong market position and
expanding product sales in the premium segment which has a higher operating margin. In
the premium segment, Samsung has led market growth using its own advanced technology
and alliance with Google against Apple. In this competition, Samsung should not offer just a
cheaper version of flagship models to low-end segment consumers like the Mini Series
because other competitors are providing smartphones with premium specifications at
relatively affordable prices. The key for Samsung is to find added value for consumers
besides price. How to build a strong power over platform and software is a key strategy for
the new competition. From the recent successful case of Xiaomi, Samsung needs to spread
44

its own ecosystem to consumers to confirm its competitive edge with attractive product
marketing strategies.
Faced with new challenges from various competitors, Samsung is showing that it
focuses on the original core competency. Galaxy S6 and S6 Edge emphasize the state of the
art technology of Samsung. The launching show in Barcelona pointed to strong competition
with Apple directly. However, it cannot ignore the enormous potential of the emerging
market and the mid and low-end segments. It is certain that Samsung is preparing for a
new takeoff in the smartphone market. Samsung is expected to show another success by
making the right strategic decision.
45
References
Danova, Tony (2013, August 20), Smartphones finally outsold feature phones in the global
market, Business Insider Australia
Golovko, Mykola (2014, September), Consumer electronics: outlook, trends and analysis,
Euromonitor International passport
Golovko, Mykola (2014, October), Beijing Xiaomi Co Ltd., in consumer electronics (world),
Euromonitor International passport
iSuppli. (2009), Cell phone industry's dirty little secret: China' 145 million unit gray market,
Retrieved from http://www.isuppli.com/china-electronicssupply-
chain/news/pages/cell-phone-industrys-dirty-little-secretchinas-145-million-unit-
gray-market.aspx
Kim, Dongwoo (2011, September 2), Changes and implications of the mobile phone market
competition, KB financial group Inc., industry report
Kim, Heesung, Oh, Jusik, Jeong, Hongsik, Seo, Younghi (2013, July 30), The golden age of
mid-low end smartphone and tablet PC's, Hanwha investment and securities Co., Ltd
research center, Hanwha morning brief
Kim, Jiyeon and Rhee, Dongkee (2011, April 20), The strategy of Samsung Electronics'
smartphone business: with managements' consideration for sustainability, The
journal of professional management
Kim, Jongki (2014, May 15), Global prospects and implications of Chinese smartphone
industry, Korea Institute for industrial economics & trade
Kim, Roko (2014, November 4), The trend and outlook of mobile device industry analysis in
2015, Hana Daetoo research center
46

Liao, Chun-Hsiung and Hsieh (2012, May), Determinants of consumer's willingness to
purchase gray-market smartphones
Llamas, Ramon T. (2014, February 24), Storming the Beach: Nokia Brings Open Source
Android to Entry-Level Smartphones, IDC Press Release
Llamas, Ramon T. (2014, May 28), Smartphone Momentum Still Evident with Shipments
Expected to Reach 1.2 Billion in 2014 and Growing 23.1% Over 2013, IDC Press
Release
Llamas, Ramon T. (2014, September 4), Microsoft Attacks the Mid-Range Smartphone
Market with Affordability and Capability, IDC Press Release
Loo, Wee Teck (2015, January), Passport: Samsung Corp in consumer electronics (world),
Euromonitor International
Pandey and Nakra (2014, November), Consumer preference towards smartphone brands,
with special reference to Android operating system
Park, R and Nam, H (2013, June 5), Analysis of Chinese mobile device manufacturers: from
local market to global market, LGERI LG Business insight
Reisinger, Don (2014, December 16), Xiaomi soars while Samsung sinks in Gartner
Smartphone Market Study, eWeek
Samsung in coordination with Cheil Worldwide and ICGroup (2013), Samsung profile 2013
Shetty, Anulekha (2014, October 13), Smartphones set the pace as MEA handset sales top
64 million units in Q2 2014, IDC Press Release
Shetty, Anulekha (2015, January 19), MEA smartphone market booms as 4G LTE shipments
to GCC grow 400%, IDC Press Release
Song, Eunjung (2014, November 11), The prospect of mobile device industry in 2015 - the
47
industry impact analysis of low-end smartphone below 100 USD, Hi investment &
securities research center industry report
48