strategic investment advisory group getting real about …
TRANSCRIPT

FOR INSTITUTIONAL / WHOLESALE / PROFESSIONAL CLIENTS AND QUALIFIED INVESTORS ONLY – NOT FOR RETAIL USE OR DISTRIBUTION
Getting real about rates: The post-war era of substantially positive real interest rates may be gone for good
STRATEGIC INVESTMENT ADVISORY GROUP
OCTOBER 2021

J .P . MORGAN ASSET MANAGEMENT | STRATEGIC INVESTMENT ADVISORY GROUP
FOR INSTITUTIONAL AND PROFESSIONAL INVESTORS ONLY | NOT FOR RETAIL USE OR PUBLIC DISTRIBUTION OCTOBER 2021
4
“Our Strategic Investment Advisory Group, with a sharp view from every vantage point, is able to connect the dots—the power of perspective that only a globally integrated team can offer.”

It’s no surprise that the investment landscape is going through a period of rapid change, raising new questions for investors. While change can present challenge, at J.P. Morgan Asset Management we firmly believe change is a catalyst for opportunity.
For years, we’ve partnered with the world’s largest institutional investors, providing
differentiated research, insights and solutions to help them manage volatility and enhance
returns. Now, we’re doubling down on our deep commitment to research, analyzing the
critical issues affecting our clients to uncover the most promising investment opportunities.
I’m pleased to introduce the Strategic Investment Advisory Group: our best and most
seasoned CIOs, portfolio managers and strategists, whose expertise spans every asset class,
joining forces to develop our sharpest comprehensive thinking. The Group is chaired by
Michael Cembalest, Chairman of Market and Investment Strategy. Through rigorous research,
debate and collaboration, the Strategic Investment Advisory Group examines the cross-currents
of global markets and identifies solutions to overcome the pressing obstacles investors
face today.
While many firms have deep expertise in individual asset classes, few can bring it all together.
Our Strategic Investment Advisory Group presents sharp views from every vantage point
and is able to connect the dots – the power of perspective that only a globally integrated
team can offer.
The inaugural publication, Getting Real About Rates: The post-war era of substantially positive
real interest rates may be gone for good, evaluates how investors may surmount one of their
greatest challenges. Despite expectations for a sustained strong economic recovery, low or
negative rates look set to persist for an extended period of time. This reflects a confluence
of forces, including a global pandemic, new monetary policy ideology and governments
preparing to take on social, infrastructure and climate issues. Still, investors have choices,
and opportunities to seize across the investment spectrum.
In the first of many publications, the Strategic Investment Advisory Group will guide you through
the emerging investment landscape. We hope you’ll find our insights valuable.
George GatchCEOJ.P. Morgan Asset Management
F O R E W O R D

J .P . MORGAN ASSET MANAGEMENT | STRATEGIC INVESTMENT ADVISORY GROUP
FOR INSTITUTIONAL / WHOLESALE / PROFESSIONAL CLIENTS AND QUALIFIED INVESTORS ONLY – NOT FOR RETAIL USE OR DISTRIBUTION OCTOBER 2021
2
John Bilton, CFA Head of Global Multi-Asset Strategy, Multi-Asset Solutions
Michael Buchenholz Head of U.S. Pension Strategy,Institutional Strategy and Analytics
Michael CembalestChairman of Market and Investment Strategy
Kyongsoo Noh, CFAPortfolio ManagerGlobal Liquidity
Andrew NorelliPortfolio ManagerGlobal Fixed Income, Currency & Commodities
Paul QuinseeGlobal Head of Equities& Co-head of the Asset Management Investment Committee
Pulkit Sharma, CFA, CAIAHead of Alternatives Investment Strategy& Solutions
Mark SnyderHead of Institutional Strategy & Analytics
Karen WardChief Market Strategist, EMEA, Global Market Insights Strategy
Jo AkehurstManagement Associate Global Liquidity
Berkeley BrownMarket and Investment Strategy Associate
Aidan BushMarket and Investment Strategy Analyst
Katya ChagaevaRetirement Insights Strategy Associate
Jason DeSenaHead of AnalyticsAlternatives Investment Strategy & Solutions
Jakub Kolodziej, CFAQuantitative Research International Equity Group
Dave LaughlinPortfolio ManagerGlobal Liquidity
Richard Morillot, CFAPortfolio ManagerInternational Equity Group
Katherine RoyChief Retirement StrategistHead of Retirement Insights Strategy
Valerie Stephan Head of Insurance Strategy and Analytics, EMEA
Rick WeiHead of Insurance Strategy and Analytics, APAC
Allison WigginsMarket and Investment Strategy Analyst
Ritchie ZhangStrategistInsurance Strategy and Analytics
A U T H O R S C O N T R I B U T O R S

J .P . MORGAN ASSET MANAGEMENT | STRATEGIC INVESTMENT ADVISORY GROUP
OCTOBER 2021FOR INSTITUTIONAL / WHOLESALE / PROFESSIONAL CLIENTS AND QUALIFIED INVESTORS ONLY – NOT FOR RETAIL USE OR DISTRIBUTION
3
US real yieldsYield less core inflation, percent
Source: Barclays, BLS, Bloomberg, JPMAM. August 2021. UST is yield to maturity;BBB and agency are yield to worst.
BBB corporates 10-year UST
-6%-4%-2%0%2%4%6%8%
10%12%
1980 1985 1990 1995 2000 2005 2010 2015 2020
Europe real yieldsYield less core inflation, percent
Source: Datastream, JPMAM. August 2021.
Europe BBB corporates France 10-year government bond
Germany 10-year government bond
-4%
-2%
0%
2%
4%
6%
8%
1998 2000 2002 2004 2006 2008 2010 2012 2014 2016 2018 2020
5-year agency
Getting real about rates: The post-war era of substantially positive real interest rates may be gone for good
There was a time when institutional investors could consistently earn 2% to 4% over the rate of inflation by simply investing in long-duration government, agency and corporate bonds. The onset of the Global Financial Crisis changed those dynamics abruptly in the fall of 2008. Over the last decade, many of us expected that the sustained global recovery that followed would eventually lead to some kind of normalization in monetary policy and rates. But with the passage of time, it has become clear that rate normalization relative to inflation is not apparent on any near-term or medium-term investment horizon. In this inaugural analysis from our Strategic Investment Advisory Group, my colleagues and I explore these issues and the implications for institutional investors.
INVESTMENT PRODUCTS ARE: NOT FDIC INSURED • NOT A DEPOSIT OR OTHER OBLIGATION OF, OR GUARANTEED BY, JPMORGAN CHASE BANK, N.A. OR ANY OF ITS AFFILIATES • SUBJECT TO INVESTMENT RISKS, INCLUDING POSSIBLE LOSS OF THE PRINCIPAL AMOUNT INVESTED.
A N O T E F R O M O U R C H A I R , M I C H A E L C E M B A L E S T

J .P . MORGAN ASSET MANAGEMENT | STRATEGIC INVESTMENT ADVISORY GROUP
FOR INSTITUTIONAL / WHOLESALE / PROFESSIONAL CLIENTS AND QUALIFIED INVESTORS ONLY – NOT FOR RETAIL USE OR DISTRIBUTION OCTOBER 2021
4

J .P . MORGAN ASSET MANAGEMENT | STRATEGIC INVESTMENT ADVISORY GROUP
OCTOBER 2021FOR INSTITUTIONAL / WHOLESALE / PROFESSIONAL CLIENTS AND QUALIFIED INVESTORS ONLY – NOT FOR RETAIL USE OR DISTRIBUTION
5
Executive SummaryDespite our expectations for a sustained strong economic recovery, low or negative real interest rates look set to persist for an extended period of time.
Non-price sensitive buyers—institutions that buy for regulatory or policy purposes—now represent such a large proportion of the market that bond yields could remain dislocated from economic fundamentals for much of the business cycle.
At its core, our thesis is based on the expectation that central banks will be unable to shrink their balance sheets meaningfully for fear of political reprisal or a financial shock. Central banks have backed themselves into a corner from which they will be unable to retreat. These captive holders sit alongside sovereign reserve managers whose purchases are dictated by currency ambitions, commercial banks that need to meet regulatory requirements and other financial institutions required to match their liabilities. Decisions are dictated by objectives other than an assessment of the appropriate price of bonds. The bond vigilantes are now outgunned by the bond pacifists.
This is not to say nominal yields won’t rise to a degree. In the fullness of time, we expect quantitative easing to cease and interest rates to rise. But our expectation is that any rise in nominal rates will fail to keep pace with inflation and so real rates remain very low or negative throughout the cycle. Such an environment is not without longer-run consequences: misallocation of capital and accelerating inflation are two potential endgames, even if these might be some years in their formation.
For investors, a multi-year period of negative real returns in government and high-grade bonds could have a profoundly negative impact on overall portfolio returns, given the pivotal role bonds have played in traditional asset allocation. While challenging core fixed income, such a scenario could benefit other assets.
As we discuss in detail in the following chapters, the investment solutions we find most appealing are:
• Medium to low-quality credit and short-duration securitized credit, both of which will benefit from an economy allowed to run hot for a prolonged period.
• A greater role for equities in providing income, with emphasis on high-dividend, low-volatility sectors such as utilities and telecoms.
• Core real assets – real estate, infrastructure, transportation and natural resources – that provide stable positive real yields with the potential for cash flow growth should inflation risks materialize.
Clearly, none of these options offers the risk-free real return once offered by government bonds, but that is the world in which we now live. Accepting an increase in portfolio volatility and illiquidity is an inevitable consequence of achieving “acceptable” portfolio returns.

J .P . MORGAN ASSET MANAGEMENT | STRATEGIC INVESTMENT ADVISORY GROUP
FOR INSTITUTIONAL / WHOLESALE / PROFESSIONAL CLIENTS AND QUALIFIED INVESTORS ONLY – NOT FOR RETAIL USE OR DISTRIBUTION OCTOBER 2021
6

J .P . MORGAN ASSET MANAGEMENT | STRATEGIC INVESTMENT ADVISORY GROUP
OCTOBER 2021FOR INSTITUTIONAL / WHOLESALE / PROFESSIONAL CLIENTS AND QUALIFIED INVESTORS ONLY – NOT FOR RETAIL USE OR DISTRIBUTION
7
T A B L E O F C O N T E N T S
8 W H Y W O U L D R E A L R AT E S R E M A I N S O L O W ?
14 U S I N F L AT I O N : P L AY I N G W I T H F I R E
15 H O W S H O U L D I N V E S T O R S R E S P O N D ?
17 PA R T O F T H E S O LU T I O N : S E C U R I T I Z E D C R E D I T
18 PA R T O F T H E S O LU T I O N : E Q U I T I E S
22 PA R T O F T H E S O LU T I O N : R E A L A S S E T S
27 C O N C LU S I O N
29 A P P E N D I X I : Corporate and public pensions and low-rates
31 A P P E N D I X I I : Insurers and low-rates
35 I M P O R TA N T I N F O R M AT I O N

J .P . MORGAN ASSET MANAGEMENT | STRATEGIC INVESTMENT ADVISORY GROUP
FOR INSTITUTIONAL / WHOLESALE / PROFESSIONAL CLIENTS AND QUALIFIED INVESTORS ONLY – NOT FOR RETAIL USE OR DISTRIBUTION OCTOBER 2021
8
-1
0
1
2
3
4
5
6
7
1991 1996 2001 2006 2011 2016 2021
US non-farm business sector productivityOutput per hour
US real investment: current cycle vs prior recessionsIndex (100 = Q0)
Source: BLS. Q2 2021. Current cycle
Source: BEA, JPMAM. Q2 2021. Dotted line = JPM forecast.
Dot-com bubble Global Financial Crisis
Quarters (0 = beginning of cycle)
Consumer inflation expectationsPercent change over the next 12 months
1-year fwd inflation expectations 12-month moving average
1%
2%
3%
4%
5%
6%
7%
1992 1996 2000 2004 2008 2012 2016 2020
Source: University of Michigan. August 2021.
7580859095
100105110115120125
-8 -4 0 4 8 12 16 20 24 28 32 36 40
Consumer price index rent vs Zillow observed rent3-month percent change
Source: BLS, Zillow. August 2021.
Consumer price index rent Zillow observed rent index (6mo lead)
0.00%
0.10%
0.20%
0.30%
0.40%
0.50%
0.60%
2016 2017 2018 2019 2020 2021
Why would real rates remain so low?There are two reasons we could find ourselves stuck in a low or negative real rate environment.
The first: a weak post-pandemic recovery in which households and businesses have a persistent desire to save rather than consume and invest. As a result, central banks struggle to meet inflation targets and are unable to normalize policy to any significant degree. In this case, secular stagnation that plagued the last cycle would intensify in the current one.
This is not the scenario that concerns us. We don’t believe that economies have suffered irreparable scarring during the pandemic, nor do we believe that inflation pressures are predominantly transient. While productivity has recently declined from its pandemic highs, it’s still above levels of the last decade, and investment has bounced back quickly. Higher inflation is showing up in “main street” expectations and in the critical shelter component of inflation statistics.

J .P . MORGAN ASSET MANAGEMENT | STRATEGIC INVESTMENT ADVISORY GROUP
OCTOBER 2021FOR INSTITUTIONAL / WHOLESALE / PROFESSIONAL CLIENTS AND QUALIFIED INVESTORS ONLY – NOT FOR RETAIL USE OR DISTRIBUTION
9
Debt and deficits% of US GDP
Interest burden on federal debtInterest payments on federal debt as a % of US GDP
Source: CBO, CRFB. 2020. Dots = 2021 estimate. Source: OMB, CBO. February 2021. Dotted line = CBO projections.
-10%
0%
10%
20%
30%
0%
20%
40%
60%
80%
100%
120%
1940 1960 1980 2000 20200.0%
0.5%
1.0%
1.5%
2.0%
2.5%
3.0%
3.5%
4.0%
1940 1950 1960 1970 1980 1990 2000 2010 2020 2030
Federal debt held by the public
Fiscal deficit
Our main concern is the second reason: an extended period of financial repression that forces nominal interest rates away from where economic fundamentals would dictate.
In practice, central banks hold nominal rates low via policy rates and interventions in long-term interest rate markets, accepting higher inflation as a means to grow nominal GDP and maximize employment. At the same time, the nominal stock of government and private sector debt are inflated away, and borrowing costs are lower in real terms.
One reason this might appeal to the Fed: The US has wartime levels of debt and deficits but without the comparative advantages that the US held over Europe and Japan during the post-war era. Following the Second World War the combination
of artificially depressed interest rates and strong growth supported by a younger and more mobile population of active workers rapidly reduced the debt burden. Such supportive demographics don’t exist today, pressuring the Fed to partially monetize the debt. While interest on the federal debt is still low relative to GDP, CBO projections show it spiking even under normal paths of rate normalization.
J .P . MORGAN ASSET MANAGEMENT | STRATEGIC INVESTMENT ADVISORY GROUP 9

J .P . MORGAN ASSET MANAGEMENT | STRATEGIC INVESTMENT ADVISORY GROUP
FOR INSTITUTIONAL / WHOLESALE / PROFESSIONAL CLIENTS AND QUALIFIED INVESTORS ONLY – NOT FOR RETAIL USE OR DISTRIBUTION OCTOBER 2021
10
-10%
-8%
-6%
-4%
-2%
0%
2%
4%
6%
1971 1976 1981 1986 1991 1996 2001 2006 2011 2016 2021
Source: US Treasury. 2020.
Ownership of US Treasuries by the Fed and foreigners% of total owned
15%
Civil War
WWI
WWII-5%
0%
5%
10%
-10%
1830
1840
1850
1860
1870
1880
1890
1900
1910
1920
1930
1940
1950
1960
1970
1980
1990
2000
2010
2020
Source: FRB, Robert Shiller, GFD, BLS, JPMAM. December 2020.
US headline CPI less 10-year US Treasury yields
Source: BLS. August 2021.
Lowest real yields on cash since 1830, other than during wartime T-bill/Funds rate less inflation, 5-year average
All other foreigners
Russia
Japan
China
The Fed
Source: IMF, World Bank. 2020. Includes debt for Australia, Canada, France, Germany, Japan, UK and USA, shown as % of same countries' nominal GDP.
Holdings of select high-quality government debt% of developed market nominal GDP
1990
140%
120%
100%
80%
60%
40%
20%
0%1994 1998 2002 2006 2010 2014 2018
Domestic central bank and foreign o�cial sector
Private sector
0%
10%
20%
30%
40%
50%
60%
70%
’90 ’92 ’94 ’96 ’98 ’00 ’02 ’04 ’06 ’08 ’10 ’12 ’14 ’16 ’18 ’20
This distortion of the yield curve is a further loosening of monetary policy and financial conditions, when it is only debatably necessary. In fact, US CPI exceeds the 10-year Treasury yield by the widest margin in 40 years, creating a very large windfall benefit for borrowers at the expense of traditional fixed income investors. As shown on the bottom left, the duration of the current negative real rate era is the longest in the country’s history, eclipsed in terms of the magnitude of negative real rates only during wartime.
Central bank intervention takes two forms: purchases in their own markets for monetary policy purposes, and purchases in other countries’ markets for currency management and balance of payments reasons.
Both actions predate the financial crisis and quantitative easing, and were then magnified by them. The growth of developed market central bank holdings since the financial crisis absorbed the increase in debt issuance in recent years; this calls into question the ability of central banks to shrink their balance sheets in countries where issuance remains high or where it spikes due to stimulus resulting from future recessions.

J .P . MORGAN ASSET MANAGEMENT | STRATEGIC INVESTMENT ADVISORY GROUP
OCTOBER 2021FOR INSTITUTIONAL / WHOLESALE / PROFESSIONAL CLIENTS AND QUALIFIED INVESTORS ONLY – NOT FOR RETAIL USE OR DISTRIBUTION
11
US bank reserves vs 10-year yields: 2003-2021US$, trillions
US banking system reserve balances with Federal Reserve banks (lhs)
US 10-year Treasury yield (rhs)
US bank reserves vs 10-year yields: 2020-2021US$, trillions
Source: Bloomberg, JPMAM. September 8, 2021. Shading indicates periods of reserve growth.
US banking system reserve balances with Federal Reserve banks (lhs)
US 10-year Treasury yield (rhs)
Source: Bloomberg, JPMAM. September 8, 2021. Shading indicates periods of reserve growth.
$0.02003 2006 2009 2012 2015 2018 2021
$0.5
$1.0
$1.5
$2.0
$2.5
$3.0
$3.5
$4.0
$4.5
$0.0
$0.5
$1.0
$1.5
$2.0
$2.5
$3.0
$3.5
$4.0
$4.56%
5%
4%
3%
2%
1%
0%
2.0%
1.6%
1.2%
0.8%
0.4%
0.0%MAR ’20 SEP ’20 MAR ’21 SEP ’21
A technical note on Fed mechanicsConventional wisdom suggests that when the Fed actively buys bonds via its QE operations, the price of those bonds should go up (yields down), but that is not always the case.
Indeed, if one views the post-GFC QE era as a whole, the Fed balance sheet trended higher and Treasury yields trended lower. Importantly, though, during periods where the Fed was actively buying bonds and paying for them with freshly printed money (i.e., reserves), the opposite appears to be true: Even though the Fed was buying, bond prices declined and yields rose. The shaded regions in the charts below show periods of active reserve growth (mostly QE purchases) when yields tended to rise. Similarly, when the Fed stopped buying, bond yields tended to fall; in fact, essentially all of the trend lower in yields during the QE era occurred outside periods of active Fed buying.
In the charts below, we have chosen to compare banking system reserves to yields instead of comparing them to the total Fed balance sheet. The reason is that since March of this year the Fed has financed its QE purchases not with freshly minted money but rather mostly via reverse repo operations with money market funds. In other words, the Fed borrowed the cash from money market funds to do its QE purchases. The reasons for the Fed’s funding change (and why reserve changes are positively correlated with 10-year yields) are beyond the scope of this paper and are related to leverage and other regulatory issues affecting banks. The upshot is that despite QE continuing, banking system reserves stopped rising from April through July and yields once again fell, suggesting again that reserve changes are the more important thing to follow than balance sheet size. There are early signs that reserves may have once again begun to rise due to banking system demand, in which case we would expect yields to rise as well.

J .P . MORGAN ASSET MANAGEMENT | STRATEGIC INVESTMENT ADVISORY GROUP
FOR INSTITUTIONAL / WHOLESALE / PROFESSIONAL CLIENTS AND QUALIFIED INVESTORS ONLY – NOT FOR RETAIL USE OR DISTRIBUTION OCTOBER 2021
12
G4 central bank balance sheets US$ trillions
Source: National central banks, J.P. Morgan Economic Research. June 2021.
Current projections Projections (2018)
$0
$5
$10
$15
$20
$25
$30
2008 2010 2012 2014 2016 2018 2020 2022
Employment gains and losses from establishment births and deathsNumber of jobs, thousands
Source: BLS. 2020.
Births Deaths
600
700
800
900
1,000
1,100
1,200
1,300
1,400
1993 1997 2001 2005 2009 2013 2017 2021
Think the central banks will normalize their balance sheets? That’s what people thought in 2018 (left chart), but the Fed’s pursuit of “normalization” was reversed after only modest progress due to tightening financial conditions, the US-China trade war and eventually COVID-19 as well. The effectiveness of balance sheet expansion during COVID suggests that the central banks have now locked themselves into a “new normal”: a balance sheet response every time something adverse happens. So far, central bank monetization of debt has had no discernible negative consequences, especially if current inflation in the US is viewed with indifference at worst. Absent uncontrolled inflation in the future, there is no need for central bank balance sheets to shrink, ever. Taxes will never have to go up to “pay off” debts owed to the central banks. If anything, persistently negative real interest rates that accompany continued financial repression in effect amount to a “shadow” tax on savers. Our recommendations that follow can help minimize that shadow tax, but it can’t be completely avoided, since risk-free rates are a foundational component of all investment returns.
Over the long run, economy-wide reallocation of investment resources in response to financial repression can be an inefficient use of those resources; the resulting distortions represent the price paid for ultra-loose monetary policy.
Before the GFC, analysts studying Japan pointed to declining economic dynamism as a negative by-product of its excessively loose monetary policy. As shown on the right, the US has experienced a falling corporate birth-death rate as well, one whose lowest levels coincided with the onset of GFC monetary policy.
We should note our thesis is not solely that the actions of central banks are distorting interest rates.
Many other major actors, such as life insurers and pension funds, have far less price sensitivity than pure-play total return or speculative bond investors – hence, the capacity for bond market vigilantism is far reduced. Case in point: hedge fund AUM of ~$3.5 trillion pales in comparison to the $30 trillion we see on central bank balance sheets as a result of quantitative easing over the years1. Since many buyers are holding bonds not for income or return but for regulatory reasons, liability management or (in the case of central banks) policy transmission, the need to compensate with large term risk premiums has passed.
1 Source: AlphaWeek, eVestment and central banks.
J .P . MORGAN ASSET MANAGEMENT | STRATEGIC INVESTMENT ADVISORY GROUP
OCTOBER 2021FOR INSTITUTIONAL / WHOLESALE / PROFESSIONAL CLIENTS AND QUALIFIED INVESTORS ONLY – NOT FOR RETAIL USE OR DISTRIBUTION
13
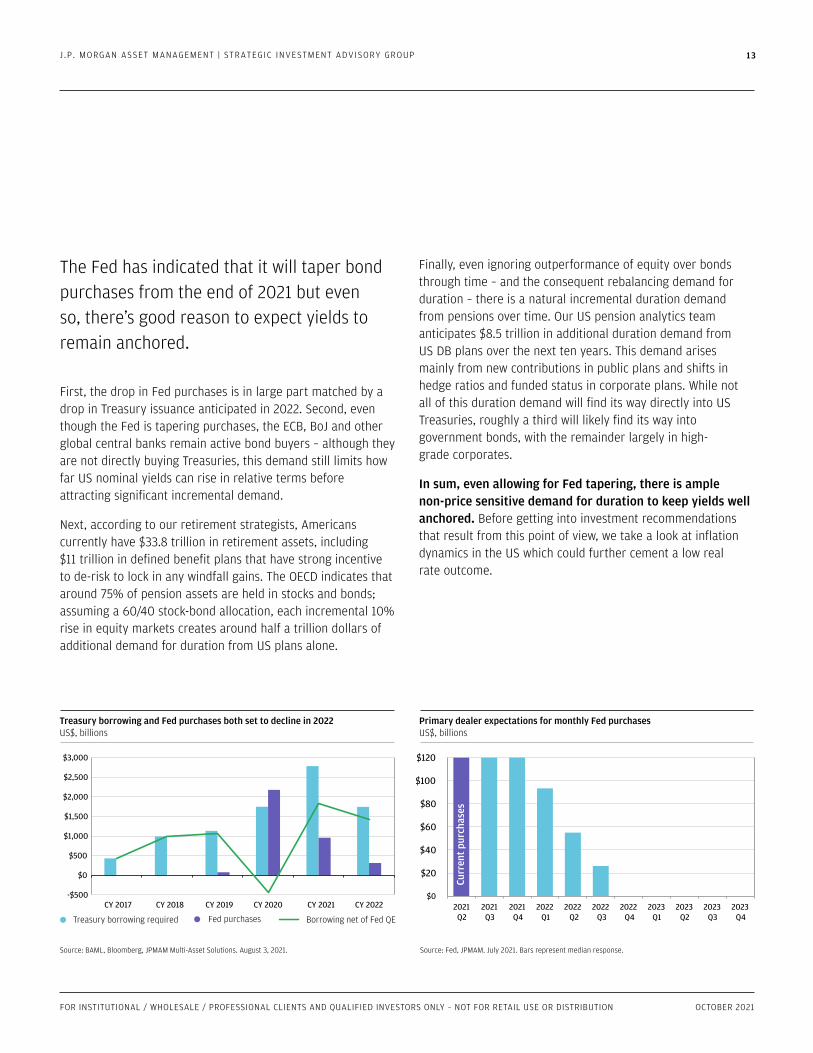
Source: BAML, Bloomberg, JPMAM Multi-Asset Solutions. August 3, 2021.
Treasury borrowing and Fed purchases both set to decline in 2022 US$, billions
Treasury borrowing required Fed purchases Borrowing net of Fed QE
-$500
$0
$500
$1,000
$1,500
$2,000
$2,500
$3,000
CY 2017 CY 2018 CY 2019 CY 2020 CY 2021 CY 2022
Source: Fed, JPMAM. July 2021. Bars represent median response.
Primary dealer expectations for monthly Fed purchasesUS$, billions
$0
$20
$40
Curr
ent p
urch
ases
$60
$80
$100
$120
2021Q2
2021Q3
2021Q4
2022Q1
2022Q2
2022Q3
2022Q4
2023Q1
2023Q2
2023Q3
2023Q4
The Fed has indicated that it will taper bond purchases from the end of 2021 but even so, there’s good reason to expect yields to remain anchored.
First, the drop in Fed purchases is in large part matched by a drop in Treasury issuance anticipated in 2022. Second, even though the Fed is tapering purchases, the ECB, BoJ and other global central banks remain active bond buyers – although they are not directly buying Treasuries, this demand still limits how far US nominal yields can rise in relative terms before attracting significant incremental demand.
Next, according to our retirement strategists, Americans currently have $33.8 trillion in retirement assets, including $11 trillion in defined benefit plans that have strong incentive to de-risk to lock in any windfall gains. The OECD indicates that around 75% of pension assets are held in stocks and bonds; assuming a 60/40 stock-bond allocation, each incremental 10% rise in equity markets creates around half a trillion dollars of additional demand for duration from US plans alone.
Finally, even ignoring outperformance of equity over bonds through time – and the consequent rebalancing demand for duration – there is a natural incremental duration demand from pensions over time. Our US pension analytics team anticipates $8.5 trillion in additional duration demand from US DB plans over the next ten years. This demand arises mainly from new contributions in public plans and shifts in hedge ratios and funded status in corporate plans. While not all of this duration demand will find its way directly into US Treasuries, roughly a third will likely find its way into government bonds, with the remainder largely in high- grade corporates.
In sum, even allowing for Fed tapering, there is ample non-price sensitive demand for duration to keep yields well anchored. Before getting into investment recommendations that result from this point of view, we take a look at inflation dynamics in the US which could further cement a low real rate outcome.

J .P . MORGAN ASSET MANAGEMENT | STRATEGIC INVESTMENT ADVISORY GROUP
FOR INSTITUTIONAL / WHOLESALE / PROFESSIONAL CLIENTS AND QUALIFIED INVESTORS ONLY – NOT FOR RETAIL USE OR DISTRIBUTION OCTOBER 2021
14
Source: Bloomberg. August 2021.
Headline inflationy/y % change in consumer price index
-15%
-10%
-5%
0%
5%
10%
15%
20%
25%
1915 1935 1955 1975 1995 2015
Source: World Bank, IMF. 2019
Globalization index – Index of global trade, portfolio flows and foreign direct investment as % of global GDP, 2010 = 100
20
40
60
80
100
120
140
1970 1980 1990 2000 2010 2020
US inflation: Playing with fireHolding real interest rates below the level appropriate for economic fundamentals could well have undesirable side effects. A misallocation of resources and asset bubbles have been uncomfortably common historical events, the subprime crisis being the most obvious and recent.
In the last hundred years, there have been five occurrences when inflation in the US persisted above 5% for more than a quarter or two: World War I, World War II, post-WWII reconstruction, the Korean War and the Great Inflation. Some of the roots were peculiar to wartime: The periods of the World Wars were characterized by supply constraints caused by hoarding, war rationing and shifting civilian production capacity towards military hardware. The Great Inflation was more complicated—it was seeded by complacency about the interaction between public policy, stimulus and prices during the Great Society programs of the 1960s and later exacerbated by external commodity shocks including the Oil Crisis of 1973. However, the one thing all of these periods had in common was extraordinarily easy monetary policy put into place to help defray the cost of deficit spending and/or for stimulus.
Like many of the prior periods of high-inflation, the pandemic is also a war–only this time, humankind is pitted against a global virus rather than against itself. Like the past bouts of inflation during wartime, we have two of the same ingredients: a curtailed supply of goods and services (in this case, it is not hoarding, war rationing and shifting production but
de-urbanization, a tight labor market, an understocking of inventories, and chip shortages) and easy monetary policy. Similar to the period before the Great Inflation, there’s a public policy shift toward promoting social justice and wealth equality funded by deficit spending.
The result of these forces is 5.3% headline inflation as of August 2021, the highest price increase since 1990. The jury is out on whether today’s inflation is transitory, as the Fed believes, or persistent. If elevated prices are transitory, monetary policy normalization can be spread over a number of years. If elevated prices are more persistent, normalization will come faster. However, even then, because of the current interconnectedness of the global sovereign bond markets and the indebtedness of the developed market governments as a whole, the Fed’s ability to raise rates is not as independent as in years past. Furthermore, policy makers have shown a preference for financial stability, which points to a higher chance of a more dovish than hawkish policy error.
One last comment on inflation. Three of the big-picture deflationary forces of the last 25 years are fading, as shown on the right: cross-border portfolio flows, trade and foreign direct investment.

J .P . MORGAN ASSET MANAGEMENT | STRATEGIC INVESTMENT ADVISORY GROUP
OCTOBER 2021FOR INSTITUTIONAL / WHOLESALE / PROFESSIONAL CLIENTS AND QUALIFIED INVESTORS ONLY – NOT FOR RETAIL USE OR DISTRIBUTION
15 15
OCTOBER 2021FOR INSTITUTIONAL / WHOLESALE / PROFESSIONAL CLIENTS AND QUALIFIED INVESTORS ONLY – NOT FOR RETAIL USE OR DISTRIBUTION
15
How should investors respond?
-5%
0%
5%
10%
15%
20%
25%
High yield zero-default "real yield"
High yield YTW less y/y CPI
High yield YTW less 5-year breakeven inflation rate
Source: Bloomberg. September 14, 2021.
1987 1990 1993 1996 1999 2002 2005 2008 2011 2014 2017 2020
How should investors respond?If we do not expect another 1980s-style golden era of strongly positive real yields in the fixed income markets anytime soon, what should investors do to adapt to this environment?
For fixed income investors, the blessing and the curse is that maximum returns are mostly predetermined (i.e. locked in) if the investor holding period is similar to the investment’s duration. Given today’s bond prices, it almost doesn’t matter whether financial repression continues or it does not and rates normalize. In essence, holders of broad passive fixed income securities are now effectively guaranteed to do no better than to lose purchasing power over the duration of their investments if inflation does not quickly drop back below the Fed’s target. To avoid losing purchasing power over the life of a normal fixed rate Treasury investment, today’s above-target inflation would have to disappear as quickly as it arrived, and would have to undershoot the TIPS-breakeven inflation by 100 basis points or more.
Additionally, as loose fiscal policy has boosted investor risk tolerance and the creditworthiness of most private sector borrowers, spreads have tightened. As a result, expected returns for traditionally riskier fixed income, such as high-yield corporates or low-rated securitized credit, have approached zero in real terms even if every (risky) borrower repays on time and in full.

J .P . MORGAN ASSET MANAGEMENT | STRATEGIC INVESTMENT ADVISORY GROUP
FOR INSTITUTIONAL / WHOLESALE / PROFESSIONAL CLIENTS AND QUALIFIED INVESTORS ONLY – NOT FOR RETAIL USE OR DISTRIBUTION OCTOBER 2021
16
One knee-jerk reaction is to reach for inflation-protected securities, where there is no cash flow risk to inflation.
However, owning TIPS means locking in current negative real yields, with no chance of redemption if inflation unexpectedly falls. In fact, current TIPS pricing vs. nominal Treasuries indicates that part of the market expects inflation to exceed the Fed’s target rather than miss it. This is another reason to doubt the COVID-related economic scarring / secular stagnation explanation for current low-interest rates.
Traditional floating rate fixed income won’t necessarily work either if financial repression extends deep into the investment horizon, since floating rate bonds typically reset off very short-term interest rates like LIBOR or SOFR. Though floating rate bonds should protect investors from rising rates, they typically only protect investors from rising policy rates, which won’t go up if financial repression continues.
For portfolios that must invest in fixed income, duration is the enemy of inflation but credit risk is not, because a high-nominal GDP environment improves the creditworthiness of nearly all borrowers.
As a result, investors should opt for larger cash flows over smaller, favoring medium-to-low quality credit, and shorter cash flows over longer, focusing on short average life securitized credit, current tight spreads notwithstanding. For pension funds and insurance companies with structural needs to own longer-duration credit, it is possible to hedge interest rate exposure with a short position in Treasuries or swaps. If rates don’t move, the hedge cost is manageable, and if rates do normalize as a result of investor reallocations we’re recommending, then hedges would add returns without eroding the income component of spread product.
The real opportunities lie outside of traditional fixed income.
Ideally investors should seek assets whose cash flows can float upward with nominal GDP, not with Fed-controlled interest rates. Securitized credit, equities, inflation-protected utilities, infrastructure investments and rental real estate all exhibit some degree of positive sensitivity to nominal GDP. In the subsequent sections, we review them.
FOR INSTITUTIONAL / WHOLESALE / PROFESSIONAL CLIENTS AND QUALIFIED INVESTORS ONLY – NOT FOR RETAIL USE OR DISTRIBUTION OCTOBER 2021

J .P . MORGAN ASSET MANAGEMENT | STRATEGIC INVESTMENT ADVISORY GROUP
OCTOBER 2021FOR INSTITUTIONAL / WHOLESALE / PROFESSIONAL CLIENTS AND QUALIFIED INVESTORS ONLY – NOT FOR RETAIL USE OR DISTRIBUTION
17
Corporate High Yield Corporate Investment Grade
Securitized Credit (AAA) Securitized Credit (BBB and below)
Securitized Credit
Sharpe ratio since 2018Volatility adjusted excess return over risk free rate
Source: BoA Research. July 21, 2021.
0.0
0.5
1.0
1.5
2.0
Securitized credit excess spread vs corporate bondsSecuritized product yield less 1-5yr investment grade corp bond yield
BBB AA
Source: BoA Research, ICE. August 13, 2021.
A
0%
1%
2%
3%
4%
5%
6%
2017 2018 2019 20212020
Part of the solution: Securitized creditOver the past two decades, especially in the US, the capital markets have increasingly provided financing for large pools of commonplace assets in the economy. Both sellers and end users (of cars, recreational vehicles, business jets, mobile phone contracts, single- and multifamily rental real estate, solar panels and other green energy products) have all tapped securitized credit markets to finance underlying assets. Nonbank consumer lenders as well have pooled loans and sold the risk and return to end investors. The once-clear delineations between investment categories have blurred: “Asset-Backed Securities” used to typically refer to credit cards and prime auto loans but now also includes loans against a wide variety of hard assets or unsecured consumer loans. “Non-Agency Mortgages” used to refer mostly to jumbo loans and subprime/Alt-A, but now is mostly prime mortgages issued by the agencies as part of their mandatory credit risk transfer programs. And finally, “Commercial Mortgage-Backed Securities” used to mostly refer to multifamily and office loan conduits but now also includes single-family rental and agency multifamily credit risk transfer.
For investors, there are some noteworthy advantages to securitized credit when compared to public market corporate bonds. The frequently “retail” nature of the underlying assets (think cell phone leases) means securitized credit commonly offers amortizing cash flows and relatively
short maturities. Asset pools are divided up into tranches of payment seniority with their own risk and return characteristics. The bespoke nature of the collateral pools requires analysis and surveillance, but typically returns are higher than for a given corporate credit with comparable default risk. For these reasons, risk-adjusted returns as measured by Sharpe ratio tend to be advantageous in securitized credit when compared to corporate credit equivalents.
The quality of the collateral pools has generally increased since COVID: Borrower creditworthiness improved due to the fiscal response and subsequent wage growth, and the value of hard assets (i.e. used cars) rose due to supply chain/demand reasons. These are trends we expect to continue.
AA: CLO, CMBS 10 yr, Investment Grade corporate 1-5yr. A: CLO, Prime Auto 4 yr, Subprime Auto 4 yr, Credit card 5 yr, Container 5 yr, Timeshare 3 yr, CMBS 10 yr, Consumer 3 yr, Agency CMBS subdebt, non-performing residential mortgages, Investment Grade corporate 1-5 yr. BBB: CLO, Prime auto 5 yr, Subprime 5 yr, CMBS 10 yr, Agency CMBS multifamily subdebt, Agency credit risk transfer (single family), Investment grade corporate 1-5 yr. Securitized product data from BofA Research; Corporate spread data from Intercontinental Exchange Indices. The BofA Securitized Products Return Indicator (which we label Securitized Credit) aggregates monthly returns across select US securitized products. The total is comprised of: 1) the AAA Indicator that tracks AAA-rated CMBS, CLO and ABS bonds, and 2) a Down in Credit Indicator (BBB and below) which tracks CLO BBB/BB tranches, CMBS BBB tranches and CAS/STACR (prime residential mortgages) below-IG rated bonds. Returns are par value-weighted.

J .P . MORGAN ASSET MANAGEMENT | STRATEGIC INVESTMENT ADVISORY GROUP
FOR INSTITUTIONAL / WHOLESALE / PROFESSIONAL CLIENTS AND QUALIFIED INVESTORS ONLY – NOT FOR RETAIL USE OR DISTRIBUTION OCTOBER 2021
18
Global US
Source: Bloomberg, Datastream, JPMAM. August 2021. Based on MSCI ACWI /S&P500 dividend yield and yield to maturity of Barclays Global / US Agg.
Gross buyback yield Dividend yield
Source: Bloomberg, Datastream, JPMAM. June 2021.
10%
20%
30%
40%
50%
60%
70%
80%
1996 2000 2004 2008 2012 2016 20200.0%0.5%1.0%1.5%2.0%2.5%3.0%3.5%4.0%
FTSE All-Share S&P 500 MSCI World MSCI Japan MSCI EMMSCI Europeex-UK
Dividend yield by industry group
Industry groupMortgage REITsTobaccoGas UtilitiesOil, Gas & Consumable FuelsMarineDiversified TelecommunicationConstruction & EngineeringElectric UtilitiesInsuranceMulti-UtilitiesBanksTelecommunication ServicesEquity Real Estate InvestmentWater UtilitiesPaper & Forest ProductsMetals & MiningCapital MarketsPower and RenewablesContainers & PackagingHousehold ProductsConstruction MaterialsPharmaceuticalsHousehold DurablesChemicalsFood & Staples Retailing
US EUR JPN EM Average9.58% na na na 9.58%
Highest volatility Lowest volatility
6.12% 6.26% 5.93% na 6.10%2.98% 6.84% 2.11% 6.84% 4.69%3.87% 4.78% 4.65% 4.93% 4.56%na 1.56% 6.96% na 4.26%4.03% 4.33% 3.40% 4.51% 4.07%na 4.04% 3.24% 4.05% 3.78%3.32% 4.13% 3.19% 4.34% 3.75%1.65% 4.60% 3.98% 4.66% 3.73%3.14% 3.70% na 3.42% 3.42%2.62% 3.01% 4.00% 2.59% 3.05%0.00% 5.76% 3.11% na 2.96%3.07% 2.69% 3.38% 2.29% 2.86%1.80% 3.81% na na 2.80%
na 2.48% 2.36% 2.91% 2.59%1.99% 4.67% 2.41% 1.13% 2.55%1.67% 2.08% 4.37% 1.98% 2.52%2.91% 2.08% na 2.08% 2.35%2.03% 2.38% na 2.38% 2.27%2.43% 2.58% 1.52% 2.42% 2.24%0.77% 3.20% na 2.71% 2.23%1.80% 2.64% 1.87% 2.56% 2.22%1.37% 3.92% 1.78% 1.65% 2.18%1.99% 2.15% 2.04% 2.36% 2.13%2.10% 2.57% 1.21% 2.63% 2.13%
Source: Bloomberg. September 16, 2021.
Equity income in 60:40 portfoliosDividends as % of total portfolio income
Equity index yields % yield
Part of the solution: EquitiesGiven prevailing rate trends, investors are increasingly turning to equities for return and income. Even though equity dividend yields are close to their lowest levels in many years (the S&P 500 dividend yield is just 1.34%), more than two-thirds of the income in 60/40 portfolios is now derived from equities, with dividend opportunities even more attractive outside the US. Note that dividend measures for equities do not incorporate gross buybacks, which in the US and Europe can contribute meaningfully to returns.
The table below shows sectors of US, European, Japanese and Emerging equity markets with the highest current dividend
On mortgage REITs. These are generally highly levered, low-quality companies that have to pay out 90% of retained earnings in dividends but end up using capital to do so since retained earnings don’t equal cash flow. This sector has usually underperformed the market over long time periods.
yields. The color scheme indicates each sector’s price volatility computed over the last three years, with red representing the most volatile sectors and blue the lowest. Some of the highest dividend yields exist in sectors such as oil & gas, where price volatility can quickly overwhelm a dividend-oriented strategy. Yield-oriented investors in volatile sectors need to be prepared for long holding periods through difficult times, and even in less volatile sectors total returns can substantially lag overall index measures whose returns are substantially driven by outperformance of growth stocks.

J .P . MORGAN ASSET MANAGEMENT | STRATEGIC INVESTMENT ADVISORY GROUP
OCTOBER 2021FOR INSTITUTIONAL / WHOLESALE / PROFESSIONAL CLIENTS AND QUALIFIED INVESTORS ONLY – NOT FOR RETAIL USE OR DISTRIBUTION
19
Source: Factset, S&P, MSCI. August 2021.
MSCI World dividend yield, nominal yields and real yields
Source: Factset, Bloomberg, JPMAM. July 2021.
MSCI World dividend yield 10Y nominal rate 10Y real rate
S&P 500 ex-financials EAFE ex-financials
-2%
0%
2%
4%
6%
8%
10%
1990 1995 2000 2006 2011 2017
Dividend payout ratiosDividend share of net income
Corporate sector cash balancesCash / total assets ratio
Source: Factset, JPMAM. July 2021.
MSCI EAFES&P 500
20%30%40%50%60%70%80%90%
1990 1995 2000 2005 2010 2015 2020 2025
0.040.060.080.100.120.140.160.180.20
1990 1995 2000 2005 2010 2015 2020
A longer discussion on equity dividends For investors in US equity markets, dividends have not been a critical part of total return. For the 10-year period ending December 31, 2020, US large cap stocks had an annualized total return close to 14%; only 2.1% of this return came from dividends. However, this was not the case in international equity markets. Investors in portfolios linked to the MSCI EAFE Index (Europe, Australasia, Far East) earned annualized total returns of just 6%, with 3.3% coming from dividends (more than half of the return). Dividends contributed an even larger percentage to 10-year annualized total returns in Emerging Markets (dividend return of 2.84% out of an annualized return of just 4%). While there is plenty of dispersion in dividend contributions to total returns by region, longer time frames show more similarity. Since 1929, dividends have contributed 38% of total returns in the US. Data doesn’t go back as far for non-US
markets; developed international equity market data begins in 1986. Over this time period, dividends contributed 33% of total returns, and since 2001, Emerging Market dividends have contributed 29% to total returns. In other words, over the long run, dividend contributions to returns are more similar. Our long-term capital market assumptions estimate that global equity returns over the next decade will range from 4.5% for US large cap stocks to around 7% for Emerging Markets. If our assumptions are correct, given current dividend yields, the dividend contribution would revert to its historical 30%-40% range. While the implied dividend yields might seem on the low-side compared to history, we believe that MSCI World dividend yields will exceed nominal and real yields on US government bonds. That has been the case since the Global Financial Crisis, a trend we expect to continue. Payout ratios appear sustainable, and companies have plenty of cash on their balance sheets.

J .P . MORGAN ASSET MANAGEMENT | STRATEGIC INVESTMENT ADVISORY GROUP
FOR INSTITUTIONAL / WHOLESALE / PROFESSIONAL CLIENTS AND QUALIFIED INVESTORS ONLY – NOT FOR RETAIL USE OR DISTRIBUTION OCTOBER 2021
20
MSCI World relative dividend yield% of stocks with dividend yields above country 10Y bond yields
Source: Factset, Bloomberg, JPMAM. July 2021.
0%10%20%30%40%50%60%70%80%90%
100%
2002 2004 2006 2008 2010 2012 2014 2016 2018 2020
European oil, gas & consumable fuels performanceIndex (100 = Mar 2019)
Source: Bloomberg. September 3, 2021.
40
50
60
70
80
90
100
110
Mar ’19 Aug ’19 Jan ’20 Jun ’20 Nov ’20 Apr ’21 Sep ’21
Total return Price return
European diversified telecoms performanceIndex (100 = Mar 2019)
Source: Bloomberg. September 3, 2021.
60
70
80
90
100
110
120
130
Mar ’19 Aug ’19 Jan ’20 Jun ’20 Nov ’20 Apr ’21 Sep ’21
Total return Price return
When we drop down to the individual stock level, the results are even more compelling: Over 70% of companies around the globe offer a dividend yield higher than the nominal yield on their respective country’s 10-year bond.
As active stock pickers, we would not counsel blindly chasing dividend yields as not all dividends are equal. We know from experience that dividends may be cut or in some instances, the dividend is defended at the expense of other uses of capital and/or the company’s stock price. Let’s take two high-yielding examples from the table on page 18: European Oil/Gas E&P companies and European Diversified Telecoms. Let’s also assume that investors entered at the “wrong” time, a few months before the COVID recession. For volatile Oil/Gas companies, high-dividends help but do not offset the entire pain of the price drawdown. For less volatile Telecoms, drawdowns are not as large, allowing dividends to represent a larger share of positive returns.

J .P . MORGAN ASSET MANAGEMENT | STRATEGIC INVESTMENT ADVISORY GROUP
OCTOBER 2021FOR INSTITUTIONAL / WHOLESALE / PROFESSIONAL CLIENTS AND QUALIFIED INVESTORS ONLY – NOT FOR RETAIL USE OR DISTRIBUTION
21
Fast-growing company valuationsEnterprise value / sales vs market for top quintile sales growth stocks, US
Source: Factset, JPMAM. August 2021.
US real yields%, 10 year yield less breakeven inflation
Source: Bloomberg, JPMAM. August 2021.
1.1
1.2
1.3
1.4
1.5
1.6
1.7
1.8
1.9
2.0
1998 2000 2002 2004 2006 2008 2010 2012 2014 2016 2018 2020-2%
-1%
0%
1%
2%
3%
4%
5%
6%
1998 2000 2002 2004 2006 2008 2010 2012 2014 2016 2018 2020
We also recommend that investors avoid extrapolating the sector trends that have prevailed in recent years even as we anticipate a period of low interest rates ahead.
There are a lot of factors driving sector performance other than monetary policy; over the last decade, other important drivers included a relentless pace of innovation, China’s rising contribution to global growth and its shift from investment to consumption, and a lax environment with respect to antitrust policies that are now changing in the US, Europe and China.
And crucially, our work shows that over time the rate of change of interest rates is much more important than the level of interest rates when driving sector relative performance. Given how much faster-growing US equities have already been rerated higher as real yields fell (illustrated below), investors should think about a broader range of opportunities for stock selection rather than just owning large cap technology winners, including of course the higher dividend paying stocks already discussed.
OCTOBER 2021FOR INSTITUTIONAL / WHOLESALE / PROFESSIONAL CLIENTS AND QUALIFIED INVESTORS ONLY – NOT FOR RETAIL USE OR DISTRIBUTION

J .P . MORGAN ASSET MANAGEMENT | STRATEGIC INVESTMENT ADVISORY GROUP
FOR INSTITUTIONAL / WHOLESALE / PROFESSIONAL CLIENTS AND QUALIFIED INVESTORS ONLY – NOT FOR RETAIL USE OR DISTRIBUTION OCTOBER 2021
22
Strategic role: Core real assets sit above the stock-bond frontierExpected compound return
Source: Moody's, JPMAM. June 30, 2021.
Core Real Assets
0%
1%
2%
3%
4%
5%
6%
7%
8%
0% 5% 10% 15% 20%Expected volatility
Return composition
US inflation (2021)
Balanced 60/40 portfolioAC World Equity
US Agg Bonds
Appreciation
Income
US Cash
Part of the solution: Real assetsIf public markets continue to offer negative real yields and the possibility of capital losses if and when rates rise, private markets can offer compelling alternatives for investors. Investors should focus on “core” real assets, which offer stable real yields with potential for cash flow growth during inflationary periods. Core real assets refer to tangible investments in real estate, infrastructure, transportation and natural resources that generate the majority of their returns through consistent, long-term contracted cash flows, which can be estimated with a low-margin of error. They typically operate in developed markets, employ moderate leverage and provide some degree of inflation protection. Our preferred real asset sectors are ones with sufficient scale and transaction volume to provide adequate price discovery and sufficient liquidity to open-end vehicles.
As a hybrid asset class, core real assets have risk and return characteristics that fall between public market stocks and bonds. Due to localized and differentiated return drivers at the asset level, core real assets often exhibit low-correlation to public equities, and are a good source of portfolio diversification. Additionally, having significant and forecastable income dampens downside risk during periods of market stress.
Over a long-term investment horizon, we expect core real assets to deliver returns over financial assets and inflation with less downside risk than public equities. This is illustrated below2 in a simplified efficient frontier. The primary trade-off is less liquidity; every institutional investor should develop their own framework for illiquidity risk, since it must include the duration of their liabilities; the preexisting level of illiquidity already present in the portfolio;3 the share of parent-level reliance on portfolio returns for annual cash flow (i.e., the high-level of reliance on university endowments to fund capital commitments, tuition, grants, etc.); and the potential for policy changes that could substantially alter the timing of the plan’s obligations (i.e., a defined benefit plan that closes to new or existing members).
2 Source: J.P. Morgan Asset Management and Moody’s. Efficient frontier is based on JPMAM 2021 Long-Term Capital Market Assumptions. The expected returns and volatilities are for illustrative purposes only and are subject to significant limitations. Core real assets represent a diversified portfolio of global real estate, infrastructure and transportation asset class exposures. An investor should not expect to achieve actual returns similar to the target returns and volatilities shown above. 3 When asked about a “fair” return over public markets for illiquidity risk, that’s a difficult question to answer without knowing a portfolio’s existing illiquidity level. There’s a big difference between a portfolio with a 15% allocation to alternative investments and 35%. Before the GFC, some of the largest US college endowments had 50% or more allocated to alternatives; a framework that increased required excess returns as illiquidity rises would likely have protected these endowments from the liquidity squeeze that followed.

J .P . MORGAN ASSET MANAGEMENT | STRATEGIC INVESTMENT ADVISORY GROUP
OCTOBER 2021FOR INSTITUTIONAL / WHOLESALE / PROFESSIONAL CLIENTS AND QUALIFIED INVESTORS ONLY – NOT FOR RETAIL USE OR DISTRIBUTION
23
Against the backdrop of a prolonged period of low and sometimes negative real rates, the case for allocating to core real assets is more compelling, particularly if cash flows are more durable or rise in a rising rate environment. Many of these assets have implicit or explicit inflation hedges in place, albeit with a modest lag. One example is staggered commercial real estate lease terms which reprice based on inflation expectations; another is embedded pass-through pricing mechanisms in which revenues adjust in line with inflation indices, as with certain utility investments. For example, many regulated utilities in Europe and the UK operate with a link between their weighted average cost of capital (WACC) and their allowable return on equity (ROE), which permits earnings to rise as inflation impacts the company’s WACC.
The table below provides an overview of different types of private market real assets, as well as examples of inflation-sensitive characteristics which may benefit the asset class during inflationary environments. Note that the inflation drivers highlighted are not universal to the asset class and may only be relevant for certain sectors.
REAL ASSET CATEGORY
GEOGRAPHY TYPICAL MAJOR SECTOR EXPOSURES
ILLUSTRATIVE INFLATION-SENSITIVE ATTRIBUTES
Core/core+ real estate Developed markets Office, industrial, residential, retail, extended sectors
Staggered lease terms which reprice based on inflation expectations, easily levered assets, slow supply response, transparent rental spot market when markets are in equilibrium or tighter
Core/core+ infrastructure Developed markets Distribution/regulated, contracted/power, GDP-sensitive
Inflation-indexed returns, expense pass-through mechanisms incorporate input costs
Core/core+ transportation Global Maritime, Energy Logistics, Aircraft, Rail & Vehicles
Staggered lease terms at the portfolio level, asset values adjust to reflect input costs for new supply (e.g., labor, steel), lease rates which are typically correlated with inflation
Core/core+ timber Developed markets Softwood, Hardwood Demand derived from the broader economy, inelastic supply given the long production cycle, ability to shift production and optimize price

J .P . MORGAN ASSET MANAGEMENT | STRATEGIC INVESTMENT ADVISORY GROUP
FOR INSTITUTIONAL / WHOLESALE / PROFESSIONAL CLIENTS AND QUALIFIED INVESTORS ONLY – NOT FOR RETAIL USE OR DISTRIBUTION OCTOBER 2021
24
US core real estate spread to BBB corporates Estimated IRR at purchase less BBB corporate yield
Source: Moody's, JPMAM. June 2021. BBB: average of Moody's intermediate-term BBB corporate bond yield
-1%
0%
1%
2%
3%
4%
5%
2003 2006 2009 2012 2015 2018 2021
As one example, this chart illustrates our estimated premium of US core real estate unlevered returns, based on underwriting expectations prevailing at the time, relative to BBB corporate bonds. This spread is near the highest level seen over the last 20 years. Furthermore, whereas low-interest rates are a headwind for fixed income investors, they are accretive to real asset investors, as moderate leverage can increase return potential. While these are private market assets, they can often be accessed in semi-liquid investment structures such as open-end perpetual life private funds with varying redemption provisions (i.e., “evergreen funds”). This provides added portfolio flexibility relative to less liquid closed-end fund structures, which offer less certainty around both the pace of initial investment and the ultimate return of capital.

J .P . MORGAN ASSET MANAGEMENT | STRATEGIC INVESTMENT ADVISORY GROUP
OCTOBER 2021FOR INSTITUTIONAL / WHOLESALE / PROFESSIONAL CLIENTS AND QUALIFIED INVESTORS ONLY – NOT FOR RETAIL USE OR DISTRIBUTION
25

J .P . MORGAN ASSET MANAGEMENT | STRATEGIC INVESTMENT ADVISORY GROUP
FOR INSTITUTIONAL / WHOLESALE / PROFESSIONAL CLIENTS AND QUALIFIED INVESTORS ONLY – NOT FOR RETAIL USE OR DISTRIBUTION OCTOBER 2021
26
Conclusion

J .P . MORGAN ASSET MANAGEMENT | STRATEGIC INVESTMENT ADVISORY GROUP
OCTOBER 2021FOR INSTITUTIONAL / WHOLESALE / PROFESSIONAL CLIENTS AND QUALIFIED INVESTORS ONLY – NOT FOR RETAIL USE OR DISTRIBUTION
27
A decade of secular stagnation coupled with a global pandemic has given rise to a profound change in policymaker ideology.
Governments have lost their fear of debt at just the time central banks have lost their fear of inflation. Whether current inflation pressure is transitory in the US and globally is a matter of debate, but the persistence of financial repression is likely to remain long-lived.
Central banks are still coming to grips with the possible consequences of actually shrinking their balance sheets, while also contemplating the limits of their capacity to use balance sheets as a tool for monetary policy, financial stability and, in some cases, social policy. At present, central banks look poised to assist governments in coping with legacy debt, and are also under pressure to support efforts to tackle inequality, infrastructure renewal and climate change. Hence, we should expect monetary and fiscal coordination to last for many years.
In practical terms, this makes a lengthy period of negative real interest rates a highly likely outcome, as nominal yields are held below the rate of inflation. This will prove challenging for many fixed income markets; even so, such an outcome should continue to be a tailwind for other assets.
Investors seeking to maintain and grow the purchasing power of their portfolios in such a world do have choices, if they’re prepared to embrace the full spectrum of fixed income and hybrid assets, dividend-paying stocks and core real assets. An increase in portfolio volatility is likely to be the price paid in exchange. This is not a trivial change, and will require communication and consensus-building with stakeholders, regulators and beneficiaries.

J .P . MORGAN ASSET MANAGEMENT | STRATEGIC INVESTMENT ADVISORY GROUP
FOR INSTITUTIONAL / WHOLESALE / PROFESSIONAL CLIENTS AND QUALIFIED INVESTORS ONLY – NOT FOR RETAIL USE OR DISTRIBUTION OCTOBER 2021
28
Appendix

J .P . MORGAN ASSET MANAGEMENT | STRATEGIC INVESTMENT ADVISORY GROUP
OCTOBER 2021FOR INSTITUTIONAL / WHOLESALE / PROFESSIONAL CLIENTS AND QUALIFIED INVESTORS ONLY – NOT FOR RETAIL USE OR DISTRIBUTION
29
Appendix I: Corporate and public pensions and low-ratesLow-interest rates have a particularly damaging impact on pension funds by inflating liabilities and reducing expected returns on many yield-oriented assets. Prior to the dot-com bubble, many public and corporate plans were in surplus, and many corporate pension discount rates were above 8.0%. Today, corporate discount rates are generally below 3.0% and corporate plans still have nearly recovered to full surplus. Conversely, many state, county and city plans remain poorly funded despite using much higher discount rates.
Corporate Defined Benefit Plans
Corporate plans have increasingly adopted liability-aware strategies across their balance sheets: Many have closed plans to new entrants, frozen new benefit accruals and offloaded liabilities via direct lump sums to participants or via annuitizations with life insurers. Many have also de-risked portfolios, holding roughly 50% in long-duration investment grade bonds. While the long-term rate trajectory has been down, there have been pockets of rising rates providing de-risking opportunities (e.g., 2013, 2015, 2016, 2018, 2021). With each successive rate decline, plans are better hedged and less impacted by subsequent bouts of falling rates. With equity markets now at all-time highs, corporate plans find themselves in aggregate close to fully funded4. On a forward-looking basis, returns in the 4%-5% range will be needed to attain a self-sustaining surplus that can be annuitized or managed with the goal of avoiding further sponsor contributions. While this target is more reasonable than figures of the past, it still presents a challenge given large allocations to low-returning bonds, which are often held to reduce the volatility of a plan’s funded status rather than to enhance yields per se.
Against this backdrop, corporate plans have adopted several strategies for achieving 4%-5% returns while coping with a low-rate environment:
• Alternative Income: Income-oriented assets like core real assets can provide equity diversification, volatility dampening and a source of cash yield to fund increasing net outflows. For corporate plans, alternative income assets can replace a portion of concentrated corporate bond portfolios as well.
• Credit Diversification: As funded status has improved, long-duration credit portfolios now comprise almost 50% of total assets. Finding alternate sources of yield, like CMOs and newer longer-duration agency securitized assets, is key for resiliency.
• Increasing Illiquid Assets: Large allocations to low-return hedging assets necessitate a higher returning growth portfolio to meet return needs. Further substitutions out of public equity into illiquid growth assets may help, although this needs to be balanced against liquidity needs for pension risk transfer.
4 Corporate pension life cycles. In early stages when a plan has a large deficit, the focus is on outearning the liability; as a result, funded status volatility tolerance is high. As the plan’s health improves, subsequent returns needed to reach full funding decline along with tolerance for risk. This dynamic, along with asymmetric incentives (surplus is not easily monetized by the sponsor, whereas funded status drawdowns may trigger additional contributions), usually leads to portfolio de-risking as funded status improves. In practice, sponsors will target a surplus, typically ~110% funded, to account for administrative costs and serve as a buffer against adverse experience in assets and liabilities. In aggregate for the corporate universe, we estimate a required return of ~5.0% to reach this objective over the next 10 years without sponsor contributions. While sponsor cash contributions to the plan would reduce this figure, it is rare to come across a corporate sponsor who wishes to make them voluntarily, and recent pension regulatory relief ensures that for all but the most severely underfunded plans, contributions will be a voluntary exercise. However, there is some dispersion in required returns within the overall universe. For example, a plan that is 85% funded would require a 6.6% return while a plan that is 105% funded would require only 3.7%. Thus, at different stages of the pension life cycle, investment objectives and risk can change.

J .P . MORGAN ASSET MANAGEMENT | STRATEGIC INVESTMENT ADVISORY GROUP
FOR INSTITUTIONAL / WHOLESALE / PROFESSIONAL CLIENTS AND QUALIFIED INVESTORS ONLY – NOT FOR RETAIL USE OR DISTRIBUTION OCTOBER 2021
30
Source: J.P. Morgan Asset Management, State Annual Financial Reports, Moody's. FY 2020. Each tier contains 10 states.
What states would have to pay assuming a 6% plan return and 30 year level dollar amortization
What states are currently paying
2017 vs 2020: The cost of unfunded pensions and retiree healthcare as a % of state revenues % of state revenues required to pay the sum of interest on net direct debt, the state's share of unfunded pension and retiree healthcare liabilities, and defined contribution plan payments
2 34 5IL NJ HI CT KY MA MD PA WV
0%
10%
20%
30%
40%
50%
’17 ’20 ’17 ’20 ’17 ’20 ’17 ’20 ’17 ’20 ’17 ’20 ’17 ’20 ’17 ’20 ’17 ’20 ’17
Other states byIPOD ratio tier
Public Defined Benefit Plans In contrast to corporate plans, public plans have not experienced a broad-based recovery in funded status levels. These plans largely remain open to new participants, although many have reduced the richness of benefits by, for example, reducing or eliminating cost-of-living adjustments. While investment returns have largely met or exceeded targets, actuarial required contributions have often not been paid in full, and the assumptions used to derive them have been overly optimistic. Also unlike corporate plans, public plans have not meaningfully reduced their expected return assumptions (the average assumption has declined less than 100 bps over the last 20 years). Thus, as forward-looking asset class returns declined, plans redirected portfolios away from safer assets like fixed income into larger public equity and alternatives allocations in order to keep up with 7%+ return assumptions. Since the year 2000, alternative investments have risen from negligible shares to ~30% of public plan portfolios. This has all transpired amid a rapidly aging public defined benefit plan system, which often requires asset sales to fund payouts to pensioners. Given the prospect of negative net cash flows, some pensions have adopted the following strategies: (a) risk overlays/leverage, (b) matching near-term cash flows with fixed
income to increase the illiquidity budget for the remaining portfolio and (c) greater reliance on income-generating alternative investments.
It’s worth noting that public returns for the fiscal year ending June 2021 are in the 25%-30% range, vastly exceeding expected return targets. Some plans are taking this opportunity to decrease expected returns (e.g., New York State & Local Retirement System lowered its investment return assumption to 5.9% from 6.8% after a 33.5% fiscal year return), which has the effect of shifting some of the future burden, currently on the investment portfolio, to employer contributions. Should the rising-asset trend persist, the challenge of low-rates would lessen but still remain. For example: As illustrated below, a ratio of pension and retiree health care obligations to revenues for several highly indebted states has improved since 2017 due to above-trend public and private equity returns, some tax increases and contributions to underfunded plans. However, these ratios are still high in absolute terms (i.e., the share of total state revenue required to pay all future pension and OPEB obligations).5
5 We will go into greater detail on our state- and city-level municipal analysis in the fifth installment of the Eye on the Market “ARC and the Covenants” series later this fall.

J .P . MORGAN ASSET MANAGEMENT | STRATEGIC INVESTMENT ADVISORY GROUP
OCTOBER 2021FOR INSTITUTIONAL / WHOLESALE / PROFESSIONAL CLIENTS AND QUALIFIED INVESTORS ONLY – NOT FOR RETAIL USE OR DISTRIBUTION
31
Appendix II: Insurers and low-ratesSignificant segments of the global insurance industry are not particularly sensitive to low-interest rates. Those insurers that are impacted (usually life insurers) often find limited means for changing asset allocation in response, and their decisions are usually similar.
• Much of the insurance market consists of short-maturity health and P&C6 contracts that can be re-priced frequently. Low-interest rates are not particularly relevant since pricing can adjust to reflect prevailing fixed income yields. Furthermore, for public companies, investors tend to focus on core underwriting as the primary source of earnings rather than portfolio earnings.
• Life insurers generally have the highest interest rate exposure, but variations in business mix and product design can result in vastly different exposures by insurer. Many life insurance products are effectively immunized with high- quality fixed income upon sale or are designed to allow insurers to pass some or all investment risk on to
policyholders,7 mitigating the impact of low-interest rates. There are three key scenarios where low-rates are problematic for life insurers: (a) ultra-long liabilities whose cash flows cannot be matched with fixed income; (b) products that take in premiums over time, making immediate immunization of long-term liabilities impossible and resulting in high-interest rate convexity; and (c) legacy products designed with variable crediting rates and minimum guarantees8 that are now in the "money" requiring insurers to credit more to policyholders than they earn on reinvested assets. Note that all three of these factors can be present in the same insurance product.
• Consequences for life insurers: lower valuations. An extended period of low-rates has resulted in lower investment income and earnings as many life insurers invest new money at lower yields and suffer an ongoing hit to earnings due to legacy products whose reinvestment yields are below original underwriting assumptions. Even for life insurers whose business mix does not jeopardize their solvency, we see depressed market-to-book ratios due to the likely reduction in future earnings. The relatively larger impact of low-rates on life insurers vs. other insurance categories is illustrated in a chart at the top of the next page.
6 There are some long-duration P&C liabilities like workers’ compensation, but these are typically not significant. 7 Equity investment risk can be passed to policyholders via variable crediting rate mechanisms. Examples include participating whole life (referred to as "with-profits" insurance outside the US) that give policyholders exposure to markets via options contracts purchased by the insurer and which leave residual equity exposure with the policyholder; insurers only retain the credit risk of their investments which fund the purchase of the option contracts. Other examples are products whose policyholders own a separate investment account whose returns are guaranteed and hedged by the insurer. 8 Minimum investment guarantees can be a difficult hurdle when rates remain low for a long period of time. In the US, the problem of minimum guarantees is not a significant issue for the large mutual insurers that dominate participating whole life. US annuities are generally in good shape as well, with most insurers having far less than 50% of annuities at contractual minimum crediting rates. The larger issue is that as of December 31, 2020, between 50% and 90% of universal life reserves were at contractual minimum crediting rates. In these situations, some non-economic universal life policies can be effectively dealt with by insurers adjusting fees to render the policies less attractive to policyholders; others may lapse due to the increasing cost of insurance as people age. In Europe, disclosure is more limited, but we infer that issues with minimum guarantees on participating insurance are a bigger problem; since rates have been low for a longer period, there’s less spread product to buy and guarantees were provided at higher levels than in the US.

J .P . MORGAN ASSET MANAGEMENT | STRATEGIC INVESTMENT ADVISORY GROUP
FOR INSTITUTIONAL / WHOLESALE / PROFESSIONAL CLIENTS AND QUALIFIED INVESTORS ONLY – NOT FOR RETAIL USE OR DISTRIBUTION OCTOBER 2021
32
Life insurance vs P&C insurance price to book Ratio
0.0
0.5
1.0
1.5
2.0
2.5
1990 1995 2000 2005 2010 2015 2020
Source: Bloomberg, JPMAM. September 9, 2021.
P&C insurance Life insurance
Regulatory constraints on asset allocation, regulatory and rating agency capital requirements, and concerns about earnings volatility and taxes often constrain what life insurers can do about low-rates.9 The two key responses taken so far and which are likely to continue: the use of extended fixed income and the replacement of some long-duration fixed income and public equity with illiquid alternatives. Extended fixed income refers to largely illiquid private credit, asset-backed securities with nontraditional collateral, emerging market debt and non-local currency fixed income. Specifics on various markets are as follows:
US/Bermuda The use of illiquid alternatives may grow due to recent regulatory changes increasing capital charges on A/BBB fixed income and reducing them on real estate limited partnerships. Insurers that reinsure long-duration US products via Bermuda tend to allocate up to 10% of the portfolio to illiquid alternative assets. Other than Bermuda reinsurance portfolios, changes in asset allocation have been relatively small; most US life insurers have not significantly changed asset allocation in the past five years due to structural constraints. An exception is non-traditional life insurance models where an insurer has an affiliation with a private credit or alternative asset manager. These insurers invest significantly in private ABS, private credit and CLOs, and tend to dominate the M&A, reinsurance and pension risk transfer markets. They generally do not use illiquid alternatives more than traditional US insurers for onshore business, but are heavy users in Bermuda.
Europe European insurers have broadly followed the US playbook of adding extended fixed income and illiquid alternatives. There have been notable allocations to infrastructure equity due to favorable regulatory capital treatment and to US taxable municipal bonds because of the diversification they offer in terms of issuers and yield pickup vs. other long-duration options. EU insurers also have large holdings in private credit.
China With government bonds still yielding +3% (for tenors longer than 10 years), Chinese insurers are less exposed to the global low-rate environment. Unlike in other major markets in Asia, Chinese insurers invest only about 2% in overseas assets. For many years Chinese insurers relied on alternative investment products to deliver attractive yields, including trust plans, bank wealth management products, real estate and infrastructure debt. As a result of new asset management product rules and new regulations to curb debt levels of local governments and the real estate industry, Chinese insurers are facing a severe challenge in finding quality alternative investment products to invest in.
Japan Life insurance asset allocations changed little in the last few years, as they had long since settled into a low-rate environment. The primary notable shift over time: a gradual increase in non-JPY securities, which now comprise 26% of total assets.
9 P&C and health insurers are less constrained in many ways, but shareholders generally do not reward them for taking substantially more investment risk.
US life insurer relative return vs A-rated corporate bonds and 7-10 year Treasury yields
0%
1%
2%
3%
4%
5%
0.4x
0.6x
0.8x
1.0x
1.2x
1.4x
1.6x
2010 2012 2014 2016 2018 2020
Source: Bloomberg. March 31, 2021.
Annual return vs S&P 500 Yield to worst
Prudential (lhs)RGA (lhs) Lincoln (lhs) MetLife (lhs)Principal (lhs)
A-rated corporates, 7-10 yrs (rhs) Treasuries, 7-10 yrs (rhs)

J .P . MORGAN ASSET MANAGEMENT | STRATEGIC INVESTMENT ADVISORY GROUP
OCTOBER 2021FOR INSTITUTIONAL / WHOLESALE / PROFESSIONAL CLIENTS AND QUALIFIED INVESTORS ONLY – NOT FOR RETAIL USE OR DISTRIBUTION
33
US life insurer relative return vs A-rated corporate bonds and 7-10 year Treasury yields
0%
1%
2%
3%
4%
5%
0.4x
0.6x
0.8x
1.0x
1.2x
1.4x
1.6x
2010 2012 2014 2016 2018 2020
Source: Bloomberg. March 31, 2021.
Annual return vs S&P 500 Yield to worst
Prudential (lhs)RGA (lhs) Lincoln (lhs) MetLife (lhs)Principal (lhs)
A-rated corporates, 7-10 yrs (rhs) Treasuries, 7-10 yrs (rhs)
Broader Asia In markets like Korea and Taiwan, the average guarantee on legacy products remains high (>4%) so insurance companies are under pressure to search for yield while balancing capital, accounting and other risk metrics. To maintain yield, insurers are increasingly sourcing assets outside of their home markets for income, alpha and diversification. Active management (higher credit spreads and some contribution from active credit and duration trading) will continue to be a popular approach for dealing with low-bond yields, especially in Taiwan. Within fixed income, Asian insurers are actively searching for yield in emerging market debt and select US and Asian high-yield credits. Outside of fixed income, illiquid alternative assets are transitioning from optional to essential for insurance companies across Asia.
Many large life insurers are either privately held or are mutual companies, and thus don’t have share prices to provide market signals about future expected earnings. However, for life insurers that are public, share prices are closely tied to fixed income yields. The chart below shows the performance of US life insurers relative to the S&P 500 (left axis) vs. yields on A rated corporate bonds and Treasuries (right axis).
The Athene situation is a notable example of what can happen when insurers invest aggressively in response to low-yields. Athene is a life insurance company owned by Apollo which was taken public in 2016. Its investment portfolio was leveraged, more opaque than competitors’ and exposed to material amounts of non-agency bonds, private asset-backed securities and mezzanine debt. While Athene’s portfolio delivered high- net investment income, investors did not reward the company for its approach, and its stock price underperformed the industry from 2016 to March 2021, when it was announced that Athene would be taken private again in 2022.
The problem of low-interest rates is not new for the global life insurance industry. Japan and Taiwan in particular have been dealing with low-interest rates for more than twenty years. The themes that emerged in those countries: Profitable lines of business subsidized other, interest-sensitive lines, insurers relied more on alternative assets for return, and also made allocations outside of their local currencies. These themes are likely to migrate to the US and Europe, though in the US life insurers are unlikely to allocate significantly outside of USD unless state regulations and treatment of FX hedges changes. Another key difference for the US: Life insurers will probably be heavier users of reinsurance and M&A solutions involving non-traditional insurers referenced earlier. These types of insurers have focused on sourcing private assets with wide credit spreads relative to their ratings.

J .P . MORGAN ASSET MANAGEMENT | STRATEGIC INVESTMENT ADVISORY GROUP
FOR INSTITUTIONAL / WHOLESALE / PROFESSIONAL CLIENTS AND QUALIFIED INVESTORS ONLY – NOT FOR RETAIL USE OR DISTRIBUTION OCTOBER 2021
34
Important information

J .P . MORGAN ASSET MANAGEMENT | STRATEGIC INVESTMENT ADVISORY GROUP
OCTOBER 2021FOR INSTITUTIONAL / WHOLESALE / PROFESSIONAL CLIENTS AND QUALIFIED INVESTORS ONLY – NOT FOR RETAIL USE OR DISTRIBUTION
35
FOR MORE INFORMATION
If you’re interested in any of these services or other discussions and analysis, please contact your J.P. Morgan Asset Management Client Advisor directly.
NOT FOR RETAIL DISTRIBUTION: This communication has been prepared exclusively for institutional, wholesale, professional clients and qualified investors only, as defined by local laws and regulations.
This document is a general communication being provided for informational purposes only. It is educational in nature and not designed to be taken as advice or a recommendation for any specific investment product, strategy, plan feature or other purpose in any jurisdiction, nor is it a commitment from J.P. Morgan Asset Management or any of its subsidiaries to participate in any of the transactions mentioned herein. Any examples used are generic, hypothetical and for illustration purposes only. This material does not contain sufficient information to support an investment decision and it should not be relied upon by you in evaluating the merits of investing in any securities or products. In addition, users should make an independent assessment of the legal, regulatory, tax, credit, and accounting implications and determine, together with their own financial professional, if any investment mentioned herein is believed to be appropriate to their personal goals. Investors should ensure that they obtain all available relevant information before making any investment. Any forecasts, figures, opinions or investment techniques and strategies set out are for information purposes only, based on certain assumptions and current market conditions and are subject to change without prior notice. All information presented herein is considered to be accurate at the time of production, but no warranty of accuracy is given and no liability in respect of any error or omission is accepted. It should be noted that investment involves risks, the value of investments and the income from them may fluctuate in accordance with market conditions and taxation agreements and investors may not get back the full amount invested. Both past performance and yields are not reliable indicators of current and future results.
J.P. Morgan Asset Management is the brand for the asset management business of JPMorgan Chase & Co. and its affiliates worldwide.
To the extent permitted by applicable law, we may record telephone calls and monitor electronic communications to comply with our legal and regulatory obligations and internal policies. Personal data will be collected, stored and processed by J.P. Morgan Asset Management in accordance with our privacy policies at https://am.jpmorgan.com/global/privacy.
This communication is issued by the following entities:
In the United States, by J.P. Morgan Investment Management Inc. or J.P. Morgan Alternative Asset Management, Inc., both regulated by the Securities and Exchange Commission; in Latin America, for intended recipients’ use only, by local J.P. Morgan entities, as the case may be. In Canada, for institutional clients’ use only, by JPMorgan Asset Management (Canada) Inc., which is a registered Portfolio Manager and Exempt Market Dealer in all Canadian provinces and territories
except the Yukon and is also registered as an Investment Fund Manager in British Columbia, Ontario, Quebec and Newfoundland and Labrador. In the United Kingdom, by JPMorgan Asset Management (UK) Limited, which is authorized and regulated by the Financial Conduct Authority; in other European jurisdictions, by JPMorgan Asset Management (Europe) S.à r.l. In Asia Pacific (“APAC”), by the following issuing entities and in the respective jurisdictions in which they are primarily regulated: JPMorgan Asset Management (Asia Pacific) Limited, or JPMorgan Funds (Asia) Limited, or JPMorgan Asset Management Real Assets (Asia) Limited, each of which is regulated by the Securities and Futures Commission of Hong Kong; JPMorgan Asset Management (Singapore) Limited (Co. Reg. No. 197601586K), this advertisement or publication has not been reviewed by the Monetary Authority of Singapore; JPMorgan Asset Management (Taiwan) Limited; JPMorgan Asset Management (Japan) Limited, which is a member of the Investment Trusts Association, Japan, the Japan Investment Advisers Association, Type II Financial Instruments Firms Association and the Japan Securities Dealers Association and is regulated by the Financial Services Agency (registration number “Kanto Local Finance Bureau (Financial Instruments Firm) No. 330”); in Australia, to wholesale clients only as defined in section 761A and 761G of the Corporations Act 2001 (Commonwealth), by JPMorgan Asset Management (Australia) Limited (ABN 55143832080) (AFSL 376919). For all other markets in APAC, to intended recipients only.
For U.S. only: If you are a person with a disability and need additional support in viewing the material, please call us at 1-800-343-1113 for assistance.
Copyright 2021 JPMorgan Chase & Co. All rights reserved. 09vc212709195616

Our Mission The Strategic Investment Advisory Group (SIAG) approaches today’s investment challenges with a global view across asset classes. Through an unrivaled collaboration that unites our deep expertise and research within each investment sector, we offer the power of perspective to help our most sophisticated clients achieve their long-term investment goals and build stronger portfolios.
J.P. MORGAN ASSET MANAGEMENT | STRATEGIC INVESTMENT ADVISORY GROUP
Felise AgranoffPortfolio ManagerU.S. Equity
John Bilton, CFA Head of Global Multi-Asset Strategy, Multi-Asset Solutions
Ted DimingHead of Advisory and Core Beta Solutions
John DonohueChief Executive Officer, Asset Management Americas
Jeff GellerPortfolio ManagerMulti-Asset Solutions
Jared GrossHead of Institutional Portfolio Strategy
Tai HuiChief Market Strategist, Asia, Global Market Insights Strategy
Dr. David Kelly, CFAChief Global Strategist, Head of Global Market Insights Strategy
Jed LaskowitzGlobal Head of Asset Management Solutions
E X E C U T I V E S P O N S O R
George GatchCEO of J.P. Morgan Asset Management
C H A I R
Michael CembalestChairman of Market and Investment Strategy
S T R A T E G I C I N V E S T M E N T A D V I S O R Y G R O U P M E M B E R S
Bob MicheleGlobal Head of Fixed Income, Currency & Commodities,& Co-head of the Asset Management Investment Committee
Kyongsoo Noh, CFAPortfolio ManagerGlobal Liquidity
Andrew NorelliPortfolio ManagerGlobal Fixed Income, Currency & Commodities
Brian NottagePortfolio ManagerAlternatives
Anton PilGlobal Head of Alternatives
Paul QuinseeGlobal Head of Equities& Co-head of the Asset Management Investment Committee
Karen WardChief Market Strategist, EMEA, Global Market Insights Strategy

J .P . MORGAN ASSET MANAGEMENT | STRATEGIC INVESTMENT ADVISORY GROUP
am.jpmorgan.com