strategic management and perceived performance of … paul.pdf · strategic management and...
TRANSCRIPT

STRATEGIC MANAGEMENT AND PERCEIVED PERFORMANCE OF SELECTED MANUFACTURING
FIRMS IN NIGERIA
BY
AKANBI, PAUL AYOBAMI, Ph.DDEPARTMENT OF BUSINESS ADMINISTRATION
FACULTY OF MANAGEMENT SCIENCESAJAYI CROWTHER UNIVERSITY, OYO
2ND MAY, 2017
1

Background to the Study
• Strategic Management(SM) is a broad, complexand comprehensive rethink that enablesorganizations to deal with changes, challengesand surprises in their environments (John, 2001).
• Organizational Performance is viewed in terms offinancial and non-financial measures
2

• This study therefore intends to explore theveracity of past findings and determine thedirection and strength of SM impact on theperformance of manufacturing firms.
3

Statement of the Research Problem• There seems to be no consensus of opinion as to:
i what and how variables of strategicmanagement affect organizational performance;
ii The problem of ascertaining the degree ofinfluence of strategic management onorganizational success.
• multidimensionality of strategic managementfactors that affect organizational performance.
4

Research QuestionsThis study provided answers to the following
research questions: i. Do perceived environmental uncertainty and organizational learning have main and/ or interaction effect on organizational performance?ii. Is there a relationship between strategic agility and
organizational performance?iii. Is there a relationship between knowledge
management strategy and organizational performance?iv. Can perceived environmental uncertainty, strategic agility, organizational learning and knowledge management strategy jointly and independently affect organizational performance? 5

Research Objectives1. To examine the main and interaction effect of perceived
environmental uncertainty and organizational learning on organizational performance.
2. To analyse the relationship between strategic agility and organizational performance.3. To assess the relationship between knowledge management strategy and organizational performance.4. To ascertain whether perceived environmental uncertainty, strategic agility, organizational learning and knowledge management strategy can jointly and independently predict organizational performance.
6

Research Hypotheses
i There is no main and interactive effect of perceived environmental uncertainty and organizational learning on organizational performance.
ii There is no significant relationship between strategic agility and organizational performance.
iii There is no significant relationship between knowledge management strategy and organizational performance.
iv Perceived environmental uncertainty, strategic agility, organizational learning and knowledge management strategy cannot jointly and independently predict organizational performance.
7

Significance of the Study• No doubt that manufacturing remains one
of the most powerful engines of economic growth. It acts as a catalyst to transform the economic structure of countries, from simple, slow-growing and low-value activities,tradition-based to more productive activities that enjoy greater margins, driven by technology, and higher growth potentials.
8
Scope of the Study• This study concentrated on the impact of
strategic management as a tool for improving the performance of manufacturing firms in Nigeria.
This research considered the 4 identifiable strategic management factors namely: • perceived environmental uncertainty, • strategic agility• organizational learning and • knowledge management strategy.
9

LITERATURE REVIEW
10
Theoretical Review
Resource Based ViewKnowledge Based View

11
Empirical Review of Literature
S/N AUTHOR RESEARCH VARIABLES METHODSOF DATAANALYSIS
RESULT
1. Ofoegbu, O.E (1991)
The role of Strategic Management in organizational performance: A case study of some Nigerian Organizations
Dependent variable-organizational performance.Independent Variables-organizational size, nature of organizational environment. Locus of strategic decision making, organizational readiness
Pearson’s correlation analysis, Regression and Factor Analysis
Positive relationship between strategic management practice and organizational performance
2. Ogunsiji, A.S.(2002)
The Practice and Impact of Strategic Management Approach on Small and Medium Scale Enterprises in Oyo State.
Dependent variable-organizational performance.Independent Variables-Organizational Variables,Leadership Variables,Environmental Variables
Multiple regression, Pearson’s correlation analysis, and Factor Analysis
Gender and other entrepreneurial traits, organizational age, size and structure have dynamic bearings on general performance and survival of small scale industries
3. Adebisi, S.A (2010)
Strategic Management Process and Organizational Performance in selected Global System of Mobile Telecommunication Service Providers in Nigeria.
Dependent variable-organizational performance.Independent Variables- strategic vision,Strategic mission,Strategic planning,Environmental factors choice of strategy
Multiple regression using Logit Model and T-test
The independent variables were significant and impacted on organizational performance in the organizations.
12
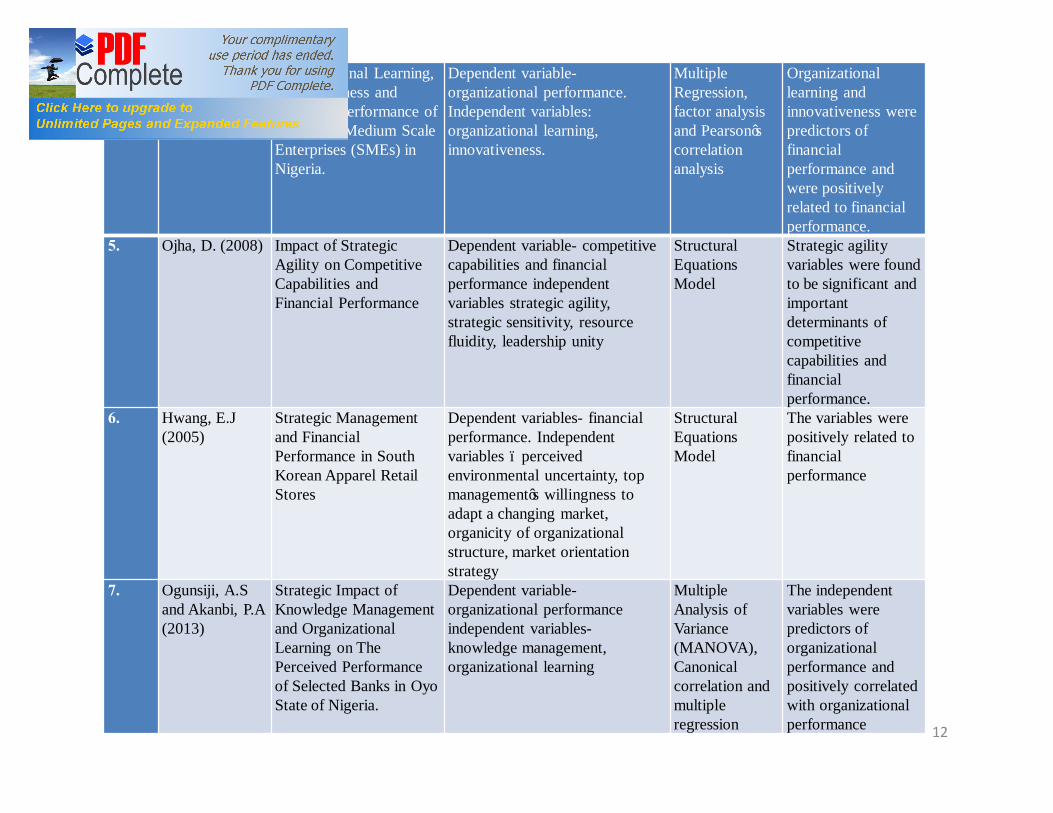
4. Idowu, A. (2013)
Organizational Learning, Innovativeness and Financial Performance of Small and Medium Scale Enterprises (SMEs) in Nigeria.
Dependent variable-organizational performance.Independent variables: organizational learning, innovativeness.
Multiple Regression, factor analysis and Pearson’s correlation analysis
Organizational learning and innovativeness were predictors of financial performance and were positively related to financial performance.
5. Ojha, D. (2008) Impact of Strategic Agility on Competitive Capabilities and Financial Performance
Dependent variable- competitive capabilities and financial performance independent variables strategic agility, strategic sensitivity, resource fluidity, leadership unity
Structural Equations Model
Strategic agility variables were found to be significant and important determinants of competitive capabilities and financial performance.
6. Hwang, E.J (2005)
Strategic Management and Financial Performance in South Korean Apparel Retail Stores
Dependent variables- financial performance. Independent variables – perceived environmental uncertainty, top management’s willingness to adapt a changing market, organicity of organizational structure, market orientation strategy
Structural Equations Model
The variables were positively related to financial performance
7. Ogunsiji, A.S and Akanbi, P.A (2013)
Strategic Impact of Knowledge Management and Organizational Learning on The Perceived Performance of Selected Banks in Oyo State of Nigeria.
Dependent variable-organizational performance independent variables-knowledge management, organizational learning
Multiple Analysis of Variance (MANOVA), Canonical correlation and multiple regression
The independent variables were predictors of organizational performance and positively correlated with organizational performance
CONCEPTUAL REVIEW OF LITERATURE
• Strategic agility• Knowledge Management • Organizational Learning• Perceived Environmental Uncertainty
13

Performance Measurement
• Performance measures could therefore be of a financial nature as well as non-financial nature, such as number of complaints and delivery time (reflecting, for example, quality or customer satisfaction) (Anthony et al., 2001).
14


METHODOLOGY
• Study Area
The study area is the manufacturing sector of the Nigerian economy in Lagos State.
16
Study Population
• The population of this research work were all the employees in the eleven segments of the manufacturing firms selected for this study.
17

Sampling Frame
• The sampling frame that were used for this study included all employees of the thirty- one companies sampled.
18
Sampling Methods and Sample Size
Multi-stage Sampling Technique comprising:• Stratified random sampling technique and
categorized random sampling for the employees.
• The sample were twenty employees in each of the manufacturing firms.
19
Sources of Data
• This study employed both:• primary data• secondary data.
20

Data Collection Instruments
• The data collection instrument employed for this study is the questionnaire.
21

Description of the Instruments• The questionnaire by design consisted of six
sections.
22

Variable Identification
• Two major variables were the focus of this study: strategic management (independent variable) and organizational performance (dependent variable).
23

Four variables were used to measure strategic management practice namely:
X1: Knowledge management strategy (system orientation strategy and human orientation strategy)
X2: Perceived environmental uncertainty (perceived market turbulence and competitive intensity)
X3: Organizational learning (knowledge acquisition, knowledge distribution, knowledge interpretation and organizational memory)
X4: Strategic agility (strategic sensitivity, leadership unity and resource fluidity)
24

Organizational Performance Variable(Y)
This was considered from the following perspectives:
Y1- Employee’s job satisfactionY2- Growth rate of sales or revenueY3- Employee’s productivityY4- Financial strengthY5- Employee’s commitment or loyaltyY6- Public imageY7- Organization’s goodwillY8- Product quality
25

Study Model Development
• The model for this study depended largely on the variables involved in this research work.
• The study’s general model is stated as follows:
26
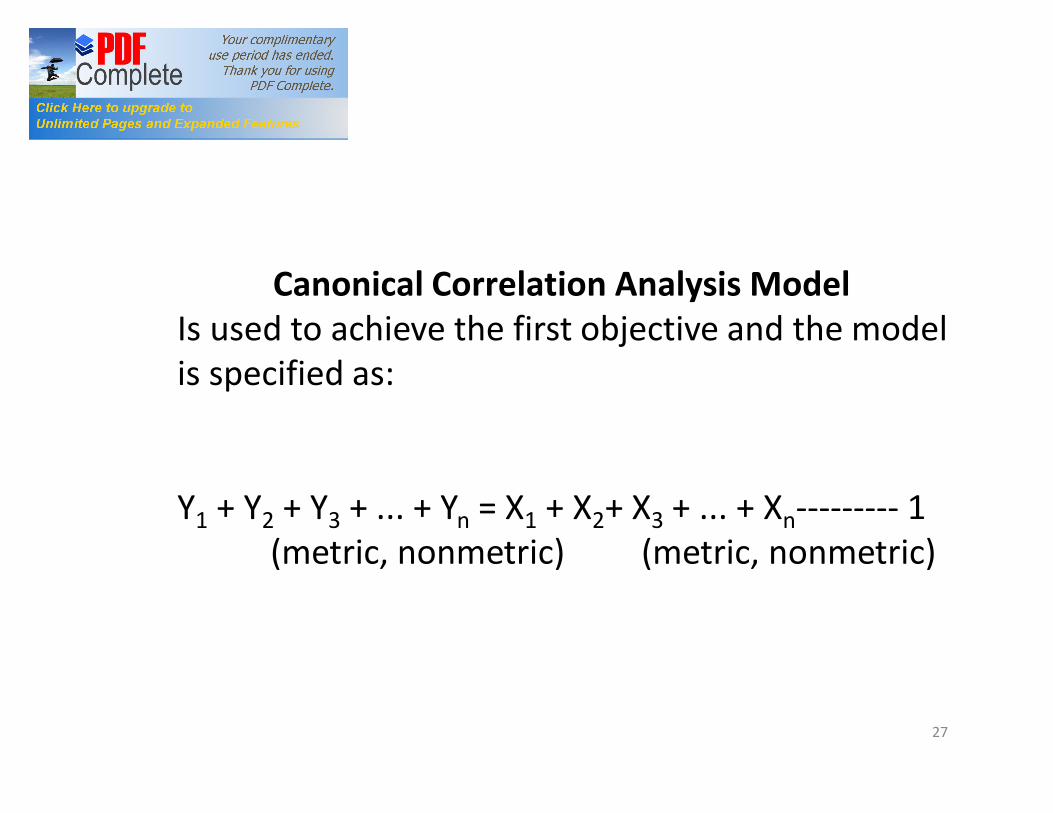
Canonical Correlation Analysis ModelIs used to achieve the first objective and the model is specified as:
Y1 + Y2 + Y3 + ... + Yn = X1 + X2+ X3 + ... + Xn--------- 1(metric, nonmetric) (metric, nonmetric)
27
Pearson’s Correlation Techniqueis used to achieve objectives 2 and 3
28

To achieve the 4th objective, multiple regression analysis was employed and the model takes the following form:
OP = f(KMS, PEU, OL, SA …)………………………………2
Where:OP= Organizational Performance KMS= Knowledge Management StrategyPEU= Perceived Environmental UncertaintyOL= Organizational LearningSA= Strategic Agility
In econometric term, the model is specified as:OP = βO + β1KMS + β2PEU + β3OL + β4SA + Ut ………….. 3Ut = error term
29

RESULTS AND DISCUSSIONTable 1
S/N COMPANY NO OF QUESTIONNAIRERETRIEVED
NO OF QUESTIONNAIREADMINISTERED
1 BERGER PAINT 20 202 D.N. MEYER 16 203 GUINNESS 20 204 UACN 16 205 FIDSON 17 206 VITA FOAM 15 207 VONO FOAM 20 208 GSK 16 209 PORTLAND PAINT 18 2010 LAFARGE/WAPCO 20 2011 PZ 18 2012 NIGERIAN BAGS 20 2013 MAY & BAKER 14 2014 AVON CROWN 19 2015 NESTLE 18 2016 CADBURY 18 2017 NBC 17 2018 NIGERIA ROPES 19 2019 UNILEVER 19 2020 CUTIX 14 2021 NIGERIAN BREWERIES 20 2022 FLOUR MILLS 17 20
TOTAL 391 440
30

Table 2: Cronbach’s Alpha Reliability Coefficients for Strategic Management Factors/Variables and
Organizational Performance.``
VARIABLES/FACTORS Cronbach’s Alpha Reliability Coefficients
STRATEGIC MANAGEMENT VARIABLES
No of Items
Perceived Environmental Uncertainty
10 0.82
Knowledge Management Strategy 8 0.80Organizational Learning 25 0.89Strategic Agility 15 0.91ORGANIZATIONAL PERFORMANCE 8 0.83
31
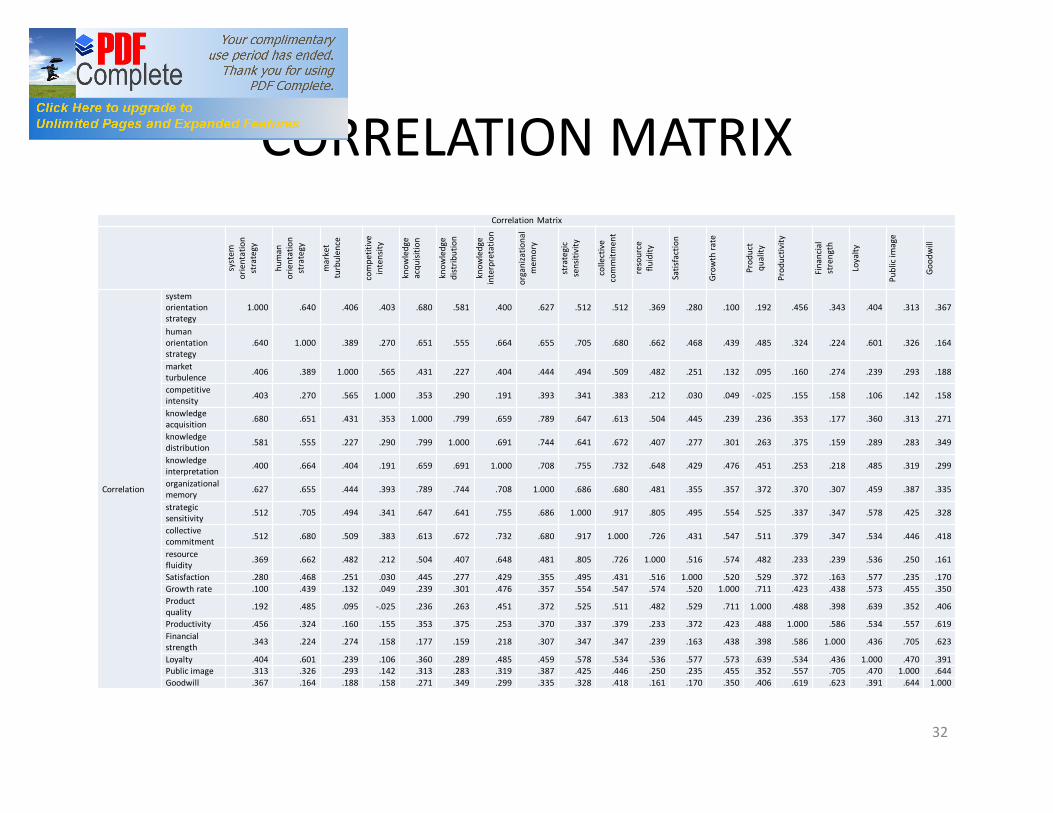
CORRELATION MATRIXCorrelation Matrix
syst
em
orie
ntat
ion
stra
tegy
hum
an
orie
ntat
ion
stra
tegy
mar
ket
turb
ulen
ce
com
petit
ive
inte
nsity
know
ledg
e ac
quisi
tion
know
ledg
e di
strib
utio
n
know
ledg
e in
terp
reta
tion
orga
niza
tiona
l m
emor
y
stra
tegi
c se
nsiti
vity
colle
ctiv
e co
mm
itmen
t
reso
urce
flu
idity
Satis
fact
ion
Grow
th ra
te
Prod
uct
qual
ity
Prod
uctiv
ity
Fina
ncia
l st
reng
th
Loya
lty
Publ
ic im
age
Good
will
Correlation
system orientation strategy
1.000 .640 .406 .403 .680 .581 .400 .627 .512 .512 .369 .280 .100 .192 .456 .343 .404 .313 .367
human orientation strategy
.640 1.000 .389 .270 .651 .555 .664 .655 .705 .680 .662 .468 .439 .485 .324 .224 .601 .326 .164
market turbulence .406 .389 1.000 .565 .431 .227 .404 .444 .494 .509 .482 .251 .132 .095 .160 .274 .239 .293 .188
competitive intensity .403 .270 .565 1.000 .353 .290 .191 .393 .341 .383 .212 .030 .049 -.025 .155 .158 .106 .142 .158
knowledge acquisition .680 .651 .431 .353 1.000 .799 .659 .789 .647 .613 .504 .445 .239 .236 .353 .177 .360 .313 .271
knowledge distribution .581 .555 .227 .290 .799 1.000 .691 .744 .641 .672 .407 .277 .301 .263 .375 .159 .289 .283 .349
knowledge interpretation .400 .664 .404 .191 .659 .691 1.000 .708 .755 .732 .648 .429 .476 .451 .253 .218 .485 .319 .299
organizational memory .627 .655 .444 .393 .789 .744 .708 1.000 .686 .680 .481 .355 .357 .372 .370 .307 .459 .387 .335
strategic sensitivity .512 .705 .494 .341 .647 .641 .755 .686 1.000 .917 .805 .495 .554 .525 .337 .347 .578 .425 .328
collective commitment .512 .680 .509 .383 .613 .672 .732 .680 .917 1.000 .726 .431 .547 .511 .379 .347 .534 .446 .418
resource fluidity .369 .662 .482 .212 .504 .407 .648 .481 .805 .726 1.000 .516 .574 .482 .233 .239 .536 .250 .161
Satisfaction .280 .468 .251 .030 .445 .277 .429 .355 .495 .431 .516 1.000 .520 .529 .372 .163 .577 .235 .170Growth rate .100 .439 .132 .049 .239 .301 .476 .357 .554 .547 .574 .520 1.000 .711 .423 .438 .573 .455 .350Product quality .192 .485 .095 -.025 .236 .263 .451 .372 .525 .511 .482 .529 .711 1.000 .488 .398 .639 .352 .406
Productivity .456 .324 .160 .155 .353 .375 .253 .370 .337 .379 .233 .372 .423 .488 1.000 .586 .534 .557 .619Financial strength .343 .224 .274 .158 .177 .159 .218 .307 .347 .347 .239 .163 .438 .398 .586 1.000 .436 .705 .623
Loyalty .404 .601 .239 .106 .360 .289 .485 .459 .578 .534 .536 .577 .573 .639 .534 .436 1.000 .470 .391Public image .313 .326 .293 .142 .313 .283 .319 .387 .425 .446 .250 .235 .455 .352 .557 .705 .470 1.000 .644Goodwill .367 .164 .188 .158 .271 .349 .299 .335 .328 .418 .161 .170 .350 .406 .619 .623 .391 .644 1.000
32

Test of HypothesesHypothesis 1
Ho: There is no main and interactive effect of perceived environmental uncertainty and organizational learning on organizational performance.
Variable
Pearson
Correlation
Sub-variables F- Ratio T Sig of P Canonical
Correlation
R2 Pearson
Correlation
Perceived Environmental
Uncertainty .196**
Market Turbulence7.755 2.297 .000
.71613 .557
.278**
Compeititve Intensity 10.617
-4.494 .000
.130**
Organizational Learning
.527**
Knowlegdge Acquisition 11.038
-3.400 .000
.404**
Knowlegdge Distribution 13.532-.378 .000
.387**
Knowlegdge
Interpretation
17.5534.063 .000
.499**
Organizational Memory 15.6934.320 .000
.498**
Table 4 : Showing main and interactive effect of Perceived Environmental Uncertainty and Organizational Learning on Organizational Performance.
33

Hypothesis 2There is no significant relationship between strategic agility and organizational
performance.
Table 5: Showing Pearson’s Correlation between Strategic Agility and Organizational Performance.
Variable Pearson
R
Sub-variables Mean Std. Dev. N Pear
son
R
P Remark
Strategic Agility
Organizational
Performance
.623**Strategic Sensitivity
4.092498 .6768752391 .610
**
.000 Sig
Collective
Commitment4.043052 .6787847
.614
**
.000 Sig
Resource Fluidity 3.965899 .7800774 .511
**
.000 Sig
4.53101 .850691
34

Hypothesis 3There is no significant relationship between knowledge management strategy and organizational
performance.Table 6: Showing Pearson’s Correlation between Knowledge Management Strategy and
Organizational Performance.
Variable Pearson
R
Sub-variables Mean Std. Dev. N Pearson R P Remark
Knowledge
Management
Strategy
Organizational
Performance
.519**System
Orientation
Strategy
4.0965 .69068
391 .412 ** .000 Sig
Human
Orientation
Strategy
3.8664 .84441
.513** .000 Sig
4.53101 .850691
35
** Sig. at .01 level

Hypothesis 4Perceived environmental uncertainty, strategic agility, organizational learning and
knowledge management strategy cannot jointly and independently predict organizationalperformance.
Table 7: Showing Multiple Regression of Perceived Environmental Uncertainty, Strategic Agility, Organizational Learning andKnowledge Management Strategy on Organizational Performance.
Variables Sub-variables F- Ratio Sig of P R R2 Adj
R2
B T P Remark
Knowledge
Management
Strategy
System
Orientation
Strategy
28.311 .000 .897 .804 .801
.196 3.174 .002 Sig
Human
Orientation
Strategy
.016 1.994 .001 Sig
Perceived
Environmental
Uncertainty
Market
Turbulence-.090 -3.554 .021 Sig
Compeititve
Intensity-.137 -2.727 .007 Sig
Organizational
Learning
Knowlegdge
Acquisition-.066 -1.789 .056 Sig
Knowlegdge
Distribution-.237 -2.814 .005 Sig
Knowlegdge
Interpretation.057 .773 .440 Not Sig
Organizational
Memory.225 3.019 .003 Sig
Strategic Agility Strategic
Sensitivity.150 5.289 .018 Sig
Collective
Commitment.431 4.057 .000 Sig
Resource
Fluidity.051 .692 .489 Not Sig 36

CONCLUSION AND RECOMMENDATIONS
CONCLUSIONIt is obvious from the findings of this study thatstrategic management tools and mechanisms alonecannot account for organizational efficiency,effectiveness and economies. This is becauseorganizational performance is also determined by otherfactors and variables. Therefore, it is concluded thatalthough strategic factors contribute significantly toorganizational success, non-strategic variables alsoaffect organizational performance.
37

• It is evident from this study that organizations must adapt appropriately to the environmental exigencies in order to achieve superior organizational performance and gain sustainable competitive advantage.
• From the empirical tests carried out in this study, it is apparent that organizational learning is critical to organizational success. Learning should be embraced by individual employees since individual learning cumulate to organizational learning. Learning should therefore be emphasized at both individual level and organizational level.
38
• Knowledge management is another very crucial variableconsidered in this study. Knowledge deployment is afundamental organizational activity. Efficient knowledgeutilization demands congruence between the knowledgedomain of the firm and its product domain. The knowledgebased approach/theory stressed the knowledgerequirements of production which lead to competitiveadvantage for the firm.
• Manufacturing firms should be strategically sensitive tothreats and opportunities as well as to prompt deploymentof organizational resources.
39

RECOMMENDATIONS
• Pragmatic emphasis of every stage of thestrategic management process (in terms of strategyformulation, strategy analysis, strategyimplementation as well as strategy evaluation andcontrol) should be encouraged.
40

• knowledge transfer/deployment should be embraced by
manufacturing firms in order to bring about innovations.
• Sub-strategic plans should be introduced because of rapid
environmental changes, market turbulence and competitive
intensity which can render appropriateness, and effectiveness of
strategic management void.
41

• That manufacturing firms should be strategically sensitive,
collectively committed, promptly and effectively allocate
resources to execute strategic management plans that can
lead to gaining a sustainable competitive advantage and
superior organizational performance.
42
