strategic report - nex/media/files/n/nex/annual reports/2015ar... · trading, clearing and...
TRANSCRIPT

Strategic
Report

Strategic report Our divisions
Connecting the world’s financial markets
60+locations
32countries
Our geographic reachWe operate in all the world’s major financial centres – with offices in 32 countries and more than 60 locations
ICAP plc Annual Report 20152
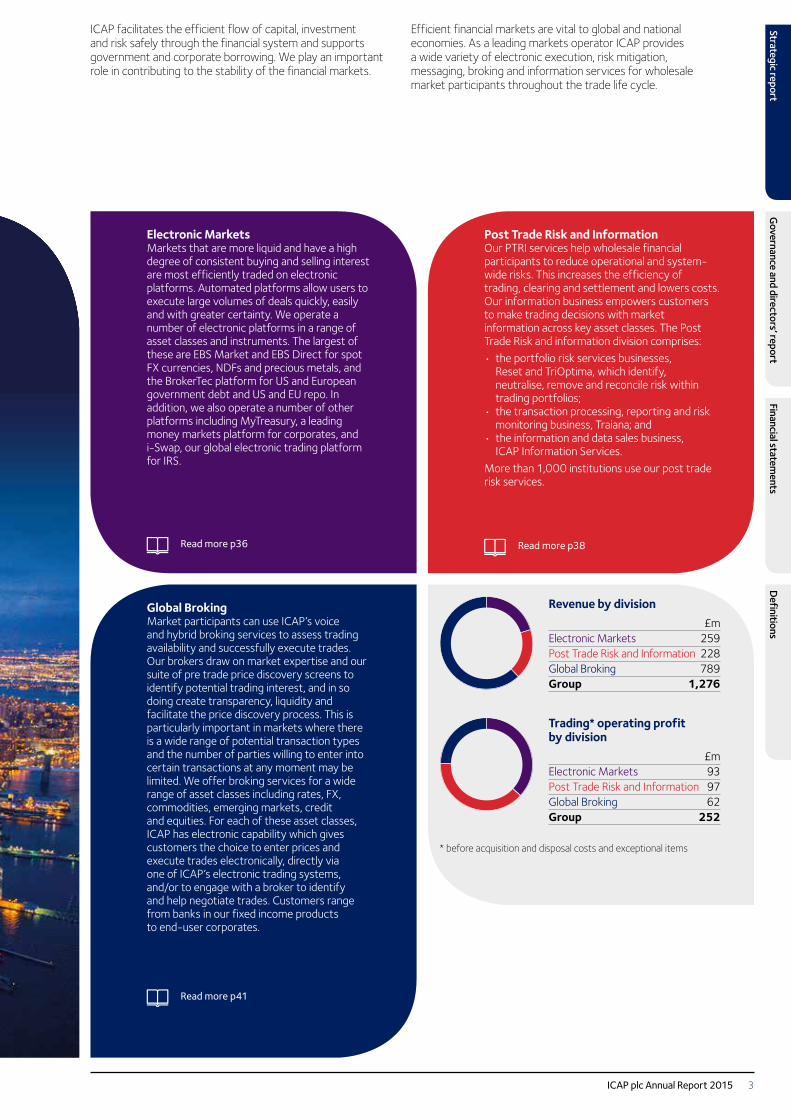
ICAP facilitates the efficient flow of capital, investment and risk safely through the financial system and supports government and corporate borrowing. We play an important role in contributing to the stability of the financial markets.
Efficient financial markets are vital to global and national economies. As a leading markets operator ICAP provides a wide variety of electronic execution, risk mitigation, messaging, broking and information services for wholesale market participants throughout the trade life cycle.
Electronic MarketsMarkets that are more liquid and have a high degree of consistent buying and selling interest are most efficiently traded on electronic platforms. Automated platforms allow users to execute large volumes of deals quickly, easily and with greater certainty. We operate a number of electronic platforms in a range of asset classes and instruments. The largest of these are EBS Market and EBS Direct for spot FX currencies, NDFs and precious metals, and the BrokerTec platform for US and European government debt and US and EU repo. In addition, we also operate a number of other platforms including MyTreasury, a leading money markets platform for corporates, and i-Swap, our global electronic trading platform for IRS.
Global BrokingMarket participants can use ICAP’s voice and hybrid broking services to assess trading availability and successfully execute trades. Our brokers draw on market expertise and our suite of pre trade price discovery screens to identify potential trading interest, and in so doing create transparency, liquidity and facilitate the price discovery process. This is particularly important in markets where there is a wide range of potential transaction types and the number of parties willing to enter into certain transactions at any moment may be limited. We offer broking services for a wide range of asset classes including rates, FX, commodities, emerging markets, credit and equities. For each of these asset classes, ICAP has electronic capability which gives customers the choice to enter prices and execute trades electronically, directly via one of ICAP’s electronic trading systems, and/or to engage with a broker to identify and help negotiate trades. Customers range from banks in our fixed income products to end-user corporates.
Post Trade Risk and InformationOur PTRI services help wholesale financial participants to reduce operational and system-wide risks. This increases the efficiency of trading, clearing and settlement and lowers costs. Our information business empowers customers to make trading decisions with market information across key asset classes. The Post Trade Risk and information division comprises:• the portfolio risk services businesses,
Reset and TriOptima, which identify, neutralise, remove and reconcile risk within trading portfolios;
• the transaction processing, reporting and risk monitoring business, Traiana; and
• the information and data sales business, ICAP Information Services.
More than 1,000 institutions use our post trade risk services.
Revenue by division £mElectronic Markets 259Post Trade Risk and Information 228Global Broking 789Group 1,276
Trading* operating profit by division £mElectronic Markets 93Post Trade Risk and Information 97Global Broking 62Group 252
* before acquisition and disposal costs and exceptional items
Read more p36 Read more p38
Read more p41
ICAP plc Annual Report 2015 3
Strategic reportG
overnance and directors’ reportFinancial statem
entsD
efinitions
Global Broking
EBS Liquidity
Optimization
ICAPInformation
Services
TraianaCreditLink
Creditchecks
Informationservices
Submission of trade data
Price to clients
Register theclient
EBS Market
Venue
Services
EBS Direct BrokerTec SEF/i-Swap
Strategic report What we do
A vital facilitator for the flow of capital through the financial system
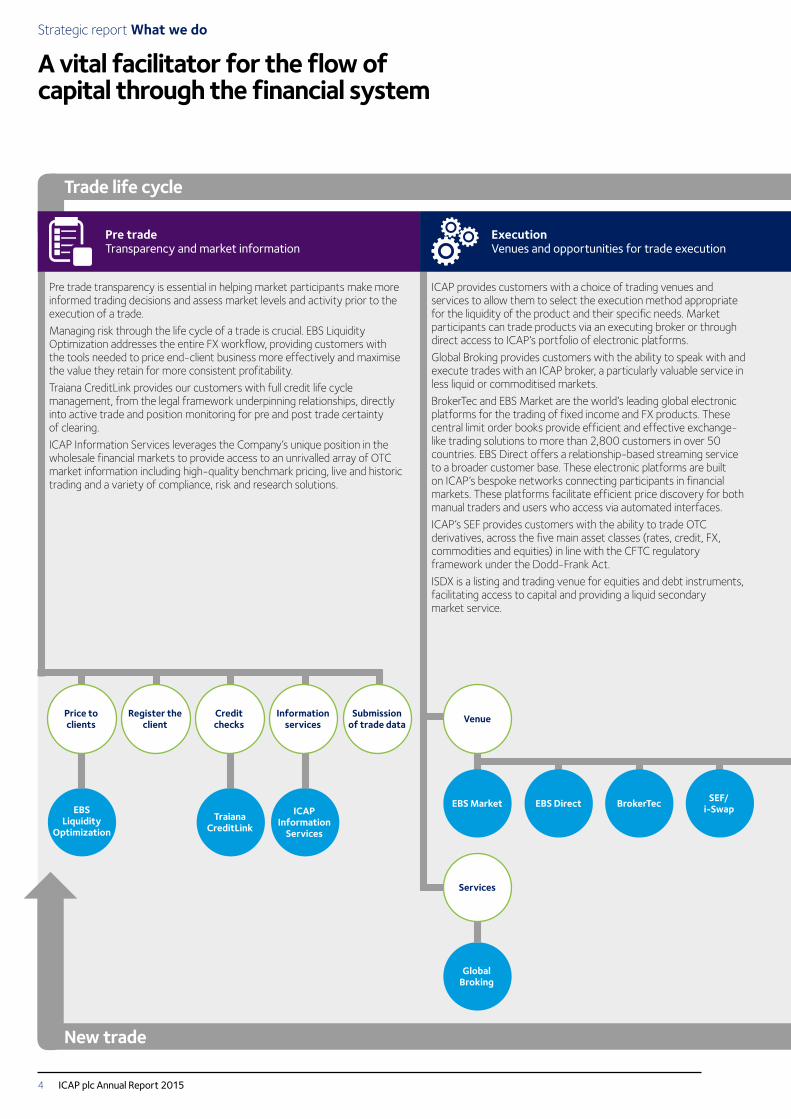
Trade life cycle
New trade
Pre trade Transparency and market information
Execution Venues and opportunities for trade execution
Post trade Support to other infrastructure/portfolio risk reduction and messaging
Pre trade transparency is essential in helping market participants make more informed trading decisions and assess market levels and activity prior to the execution of a trade.Managing risk through the life cycle of a trade is crucial. EBS Liquidity Optimization addresses the entire FX workflow, providing customers with the tools needed to price end-client business more effectively and maximise the value they retain for more consistent profitability.Traiana CreditLink provides our customers with full credit life cycle management, from the legal framework underpinning relationships, directly into active trade and position monitoring for pre and post trade certainty of clearing.ICAP Information Services leverages the Company’s unique position in the wholesale financial markets to provide access to an unrivalled array of OTC market information including high-quality benchmark pricing, live and historic trading and a variety of compliance, risk and research solutions.
ICAP provides customers with a choice of trading venues and services to allow them to select the execution method appropriate for the liquidity of the product and their specific needs. Market participants can trade products via an executing broker or through direct access to ICAP’s portfolio of electronic platforms.Global Broking provides customers with the ability to speak with and execute trades with an ICAP broker, a particularly valuable service in less liquid or commoditised markets.BrokerTec and EBS Market are the world’s leading global electronic platforms for the trading of fixed income and FX products. These central limit order books provide efficient and effective exchange-like trading solutions to more than 2,800 customers in over 50 countries. EBS Direct offers a relationship-based streaming service to a broader customer base. These electronic platforms are built on ICAP’s bespoke networks connecting participants in financial markets. These platforms facilitate efficient price discovery for both manual traders and users who access via automated interfaces.ICAP’s SEF provides customers with the ability to trade OTC derivatives, across the five main asset classes (rates, credit, FX, commodities and equities) in line with the CFTC regulatory framework under the Dodd-Frank Act.ISDX is a listing and trading venue for equities and debt instruments, facilitating access to capital and providing a liquid secondary market service.
ICAP’s collective post trade businesses help customers reduce both risk and market exposure by identifying and removing trade mismatches, unwanted exposures and transactions that no longer have a commercial purpose. TriOptima and Reset provide a host of different services to market infrastructures enabling users of derivatives and bonds to mitigate unwanted risks in their trading portfolios. In addition, TriOptima allows trading counterparties and trade repositories to reconcile trade details ensuring accurate calculation of risk.Traiana increases the efficiency of trading, clearing and settlement and reduces costs by automating links from high speed execution systems to assist in the reconciliation of transactions, thus also allowing for accurate reporting to regulators and clearing houses.
ICAP plc Annual Report 20154

triReduce triResolve
ICAP’s services ICAP’s products/businesses
ISDX MyTreasury TriOptima Reset TraianaICAP
Information Services
Portfoliocompression
Portfolioreconciliation
Riskmitigation
Tradeconfirmation
Tradeaggregation Indices Order and
trade data
ICAP plays a pivotal role in bringing buyers and sellers together in the global wholesale financial markets. We help our customers manage and mitigate their risks and provide them with a choice of trading venues and methods ranging from fully electronic to broker assisted trades. This allows them to select the most appropriate execution method depending on the liquidity of the product and their
specific needs. They also have access to an unrivalled source of financial markets data. Our risk mitigation services help customers reduce both their operational risk and market exposure.
We continue to innovate and develop new products and services as the markets and our customers’ needs evolve.
Pre trade Transparency and market information
Execution Venues and opportunities for trade execution
Post trade Support to other infrastructure/portfolio risk reduction and messaging
Pre trade transparency is essential in helping market participants make more informed trading decisions and assess market levels and activity prior to the execution of a trade.Managing risk through the life cycle of a trade is crucial. EBS Liquidity Optimization addresses the entire FX workflow, providing customers with the tools needed to price end-client business more effectively and maximise the value they retain for more consistent profitability.Traiana CreditLink provides our customers with full credit life cycle management, from the legal framework underpinning relationships, directly into active trade and position monitoring for pre and post trade certainty of clearing.ICAP Information Services leverages the Company’s unique position in the wholesale financial markets to provide access to an unrivalled array of OTC market information including high-quality benchmark pricing, live and historic trading and a variety of compliance, risk and research solutions.
ICAP provides customers with a choice of trading venues and services to allow them to select the execution method appropriate for the liquidity of the product and their specific needs. Market participants can trade products via an executing broker or through direct access to ICAP’s portfolio of electronic platforms.Global Broking provides customers with the ability to speak with and execute trades with an ICAP broker, a particularly valuable service in less liquid or commoditised markets.BrokerTec and EBS Market are the world’s leading global electronic platforms for the trading of fixed income and FX products. These central limit order books provide efficient and effective exchange-like trading solutions to more than 2,800 customers in over 50 countries. EBS Direct offers a relationship-based streaming service to a broader customer base. These electronic platforms are built on ICAP’s bespoke networks connecting participants in financial markets. These platforms facilitate efficient price discovery for both manual traders and users who access via automated interfaces.ICAP’s SEF provides customers with the ability to trade OTC derivatives, across the five main asset classes (rates, credit, FX, commodities and equities) in line with the CFTC regulatory framework under the Dodd-Frank Act.ISDX is a listing and trading venue for equities and debt instruments, facilitating access to capital and providing a liquid secondary market service.
ICAP’s collective post trade businesses help customers reduce both risk and market exposure by identifying and removing trade mismatches, unwanted exposures and transactions that no longer have a commercial purpose. TriOptima and Reset provide a host of different services to market infrastructures enabling users of derivatives and bonds to mitigate unwanted risks in their trading portfolios. In addition, TriOptima allows trading counterparties and trade repositories to reconcile trade details ensuring accurate calculation of risk.Traiana increases the efficiency of trading, clearing and settlement and reduces costs by automating links from high speed execution systems to assist in the reconciliation of transactions, thus also allowing for accurate reporting to regulators and clearing houses.
ICAP plc Annual Report 2015 5
Strategic reportG
overnance and directors’ reportFinancial statem
entsD
efinitions
Strategic report Market landscape
Regulatory change driving market structure
The market landscape for ICAP, its competitors and customers continues to be impacted by significant structural and cyclical changes. In recent years the former has been driven by regulation and technology while the latter largely takes the form of macro drivers such as volatility across different asset classes. The three biggest structural changes to impact ICAP and its customers are:
• reduction of banks’ balance sheet risk;
• requirements for improved risk management and transparency in OTC markets; and
• FICC trading becoming increasingly electronic.
Regulatory changes in recent years continue to be the key driver of market structure for ICAP’s businesses as well as ICAP’s customer base. The business models and strategic focus of ICAP’s bank customers are increasingly focused on reducing balance sheets, risks and costs to improve their return on equity. Consequently they are evolving their trading franchises to focus on customer flows rather than principal risk taking.
ICAP is well positioned to benefit from these changes having invested in technological solutions across the whole trade life cycle in pre trade, execution and post trade. Many of these innovative technology-based offerings have become industry standard market infrastructures in helping banks reduce balance sheet risk and simplify operational workflow. Moreover, 2014/15 was also characterised by the continued shift of ICAP’s profit towards electronic platforms, post trade services and data.
A variety of cyclical macro factors also had a significant impact on ICAP’s revenue during 2014/15 as well as over previous years. Record low interest rates and flat yield curves continued to be headwinds. Increasing divergence between the monetary policy stances of major central banks resulted in increased FX volatility in the latter part of 2014/15. Low medium-term interest rates also underpinned heightened levels of corporate bond issuance.
Reduction of banks’ balance sheet riskBasel III requirements around capital, balance sheet size/leverage and liquidity have driven ICAP’s traditional customer banks to shrink their balance sheets over recent years. The initial focus was on reducing risky assets that underpin risk-weighted asset calculations with a more recent focus on lower return businesses that negatively impact gross leverage ratios. Regulators have also introduced higher gross leverage ratio requirements for systemically important financial institutions which have impacted many of the banks which own leading FICC trading franchises.
These changes, as well as the Volcker Rule included in the Dodd-Frank Act, have resulted in a significant reduction of principal risk-taking by ICAP’s bank customers and an increased focus on the strength and efficiency of their client franchises. In previous years Basel III led to a significant shrinkage in the inventory of corporate bonds held by banks at the same time that asset manager inflows into bond funds surged. This resulted in a significant shrinkage of the interbank markets in credit securities and an increase in flow from banks to the buy side in that asset class. More recently, as the focus has moved to gross leverage ratios, banks have begun to shrink their rates businesses which were typically the largest part of their balance sheets. This included OTC interest rate derivatives (which have also been impacted by higher margining requirements in the US relative to interest rates futures contracts)
as well as repo books. Areas such as equities and FX (especially in cash products) have been relatively smaller users of balance sheet and capital and hence less impacted by the regulatory changes.
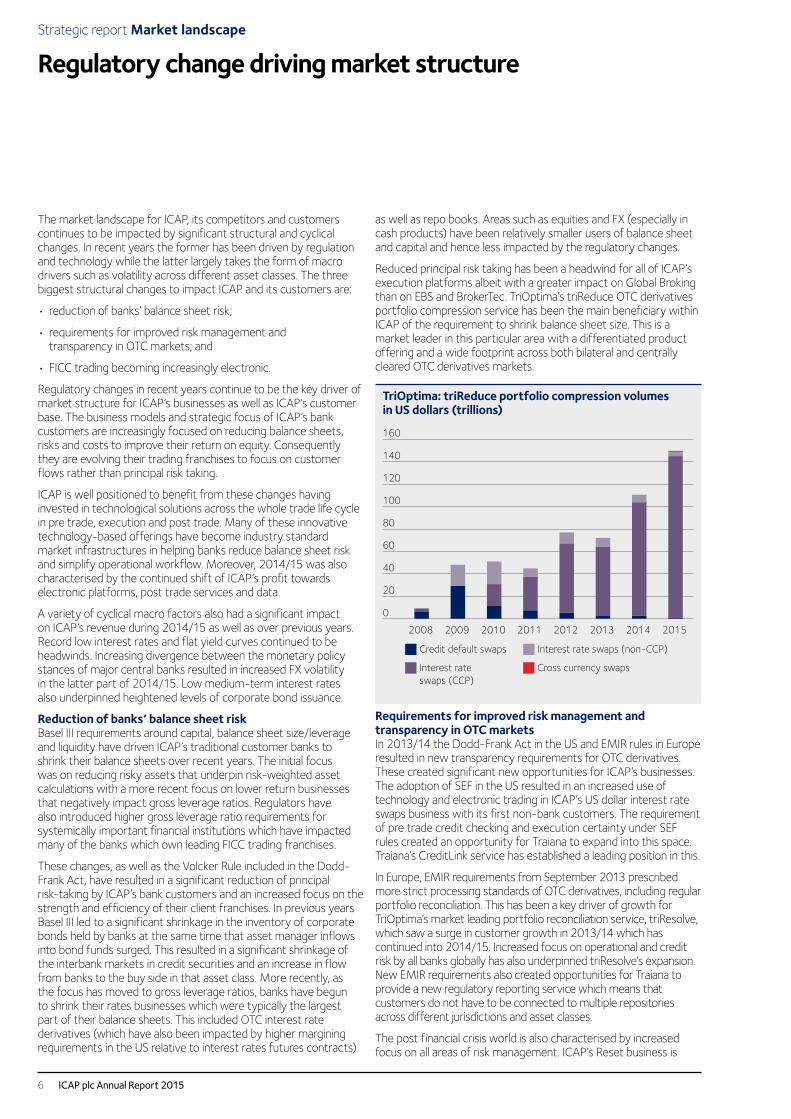
Reduced principal risk taking has been a headwind for all of ICAP’s execution platforms albeit with a greater impact on Global Broking than on EBS and BrokerTec. TriOptima’s triReduce OTC derivatives portfolio compression service has been the main beneficiary within ICAP of the requirement to shrink balance sheet size. This is a market leader in this particular area with a differentiated product offering and a wide footprint across both bilateral and centrally cleared OTC derivatives markets.
TriOptima: triReduce portfolio compression volumes in US dollars (trillions)
2008 2009 2010 2011 2012 2013 2014 2015
160
140
100
120
60
40
20
80
0
Credit default swaps Interest rate swaps (non-CCP)
Interest rate swaps (CCP)
Cross currency swaps
Requirements for improved risk management and transparency in OTC marketsIn 2013/14 the Dodd-Frank Act in the US and EMIR rules in Europe resulted in new transparency requirements for OTC derivatives. These created significant new opportunities for ICAP’s businesses. The adoption of SEF in the US resulted in an increased use of technology and electronic trading in ICAP’s US dollar interest rate swaps business with its first non-bank customers. The requirement of pre trade credit checking and execution certainty under SEF rules created an opportunity for Traiana to expand into this space. Traiana’s CreditLink service has established a leading position in this.
In Europe, EMIR requirements from September 2013 prescribed more strict processing standards of OTC derivatives, including regular portfolio reconciliation. This has been a key driver of growth for TriOptima’s market leading portfolio reconciliation service, triResolve, which saw a surge in customer growth in 2013/14 which has continued into 2014/15. Increased focus on operational and credit risk by all banks globally has also underpinned triResolve’s expansion. New EMIR requirements also created opportunities for Traiana to provide a new regulatory reporting service which means that customers do not have to be connected to multiple repositories across different jurisdictions and asset classes.
The post financial crisis world is also characterised by increased focus on all areas of risk management. ICAP’s Reset business is
ICAP plc Annual Report 20156
a market leader in the reduction of basis risk in OTC derivatives portfolios resulting from mismatches of exposures.
FICC trading becoming increasingly electronicA post Basel III world of higher capital requirements as well as increased transparency requirements and compliance costs has resulted in an increased focus by banks on the strength and efficiency of their customer flow businesses. Banks are increasing their proportion of electronic trading in both interbank and bank to customer markets. In addition to the benefits that anonymous central order books have traditionally provided in terms of ‘risk transfer’, electronic trading is becoming increasingly attractive because of the cost benefits in the form of reduced sales forces as well as the clearly auditable trail which is beneficial from a compliance perspective. Many leading banks are also using electronic distribution and automated/algorithmic trading to differentiate themselves.
Electronic trading is more established in the equities and spot FX markets but is now gathering in pace across liquid FICC markets. In the interbank markets this typically takes the form of anonymous central order books albeit there is an increasing penetration of matching sessions and request-for-quote (RFQ) technology in some less liquid markets. In the bank to customer markets (where the customer side can range from traditional asset managers to hedge funds, regional banks and corporates) banks are increasingly connecting with their customers through electronic disclosed liquidity models including RFQ and streaming technology. These can take the form of the banks’ own single dealer platform or a third party multi-dealer platform through which customers are able to access many bank liquidity providers.
ICAP’s electronic trading franchises are increasingly expanding from the central order book interbank market to the bank to customer market. The most notable example is EBS Direct which has leveraged the desktop real estate and connectivity of EBS to regional and smaller banks and offered an executable streaming price service initially connecting bank liquidity providers to bank liquidity consumers but also to an increasing number of non-bank liquidity consumers such as hedge funds. Volume growth over the financial year 2014/15 has been extremely strong and ICAP plans to expand EBS Direct to FX swaps/forwards, corporates (leveraging MyTreasury) and fixed income (leveraging BrokerTec) in 2015/16. Moreover i-Swap, ICAP’s interest rate swap joint venture with leading banks, has expanded recently from a central order book only to a streaming offering in euro interest rate swaps. ICAP’s Global Broking business has also continued to expand its use of technology. As well as the buildout of the i-Swap offerings, the Fusion front-end is being used to distribute an increasing number of broker-assisted matching sessions in products with more episodic liquidity.
New regulatory landscapeMiFID II, which is likely to come into force in early 2016, aims to normalise competition between trading venues (exchanges, MTFs and the newly created OTF category) in the EU and to increase price transparency in financial markets for both market users and regulators. There is potential in due course for direct competition with the derivatives exchanges in listed futures.
MiFID II is likely to have a meaningful impact on the ICAP Group. Our business objectives are aligned with those of MiFID II as we support the move of liquid instruments to electronic venues and
a greater emphasis on both pre and post trade transparency. We have witnessed how volumes have already started to migrate from our OTC infrastructure to our established venues where product standardisation and liquidity allow. Irrespective of the venue, a key role for ICAP continues to be the fostering of transparency by continually providing pre trade information to the market, whether through pre trade price screens or order book type structures. The demand for such solutions, against the background of the regulatory standards, stands to increase significantly over the coming year as the industry gears up to MiFID II implementation.
A key challenge for ICAP, as for the rest of the industry, is the scale of change required by new regulation. The organisational structures, alongside the implementation of some of the transparency and microstructural requirements, will impact all areas of ICAP. It will be interesting to see how the UK government’s initiative around fair and effective markets will complement the MiFID II rules in these areas.
Cyclical macro trendsGiven that the vast majority of ICAP’s revenue is derived from transaction fees from trading entities such as banks, cyclical drivers such as macro-economic events that drive volatility and directional moves in asset classes can have a huge impact on ICAP’s performance. Higher levels of market volatility, especially when driven by macro-economic developments, are typically positive for ICAP’s revenue, not only because overall industry volume increases but also as banks look to offset risk in the interbank market rather than warehouse it and match against other customer flows (i.e. internalise flows).
The greatest drivers of macro volatility are government intervention or changes in direction of economic data. The former has taken the shape of central bank action influencing interest rates, both overnight rates by direct policy changes and medium-term interest rates through the aggressive use of quantitative easing (i.e. central bank purchases of their own sovereign debt). In the post financial crisis world of relatively conservative government policy, central banks have been increasingly focused on using interest rates to drive growth as well as control inflation. The US Federal Reserve, ECB and Bank of Japan have all been aggressive in this space in recent years. These clearly impact local fixed income markets but where there is a divergence in the extent of interest rate changes/monetary easing this of course also results in increased FX volatility and directional moves in FX rates.
The structural reduction in bank balance sheets outlined earlier has two additional consequences which are relevant when discussing cyclical drivers. Firstly, in times of higher macro driven volatility this will underpin less internalisation with customer flow being offset in the interbank markets. Secondly, the structural changes have also resulted in higher volatility which is not always accompanied by higher trading volumes. Volatility is typically only positive when it is driven by macro-economic developments and in this case is the consequence of the reduced market making capacity of banks and the resulting lower liquidity and wider spreads.
ICAP plc Annual Report 2015 7
Strategic reportG
overnance and directors’ reportFinancial statem
entsD
efinitions

Strategic report Group CEO’s review
A year of refocus and investment
The past year has been one marked by dynamic and challenging opportunities across many of our businesses.
Group performance highlights
• Double digit Post Trade Risk and Information revenue growth, on a constant currency basis, driven by TriOptima and Traiana
• Significant new business momentum at EBS
• Group full-year trading profit before tax down 15% to £229 million; second half trading profit before tax up 8% on the prior year second half to £143 million
• Global Broking restructuring substantially completed; Group annualised cost saving target exceeded £70 million achieved with £41 million realised in the year
• Targeted investment in growth areas – £43 million investment in new initiatives (2013/14 – £42 million)
• Strong cash conversion – 106% (2013/14 – 75%)
• Proposed final dividend maintained at 15.4p; full-year dividend 22.0p
ICAP’s total shareholder return for 2014/15 was 48%
Year ended 31 March
2015 £m
Year ended 31 March
2014(restated)
£mChange
%
Revenue 1,276 1,378 (7)
Trading operating profit 252 290 (13)
Trading profit before tax 229 271 (15)
Profit before tax 95 121 (21)
pence penceChange
%
Trading EPS (basic) 28.7 33.2 (14)
EPS (basic) 13.0 15.7 (17)
Dividend per share 22.0 22.0 –2013/14 results were restated to reflect the adoption of new accounting standards on joint ventures. See basis of preparation statement on page 103.
Trading results are before acquisition and disposal costs and exceptional items.
Read more p35 and 44
Michael SpencerGroup Chief Executive Officer
ICAP plc Annual Report 20158
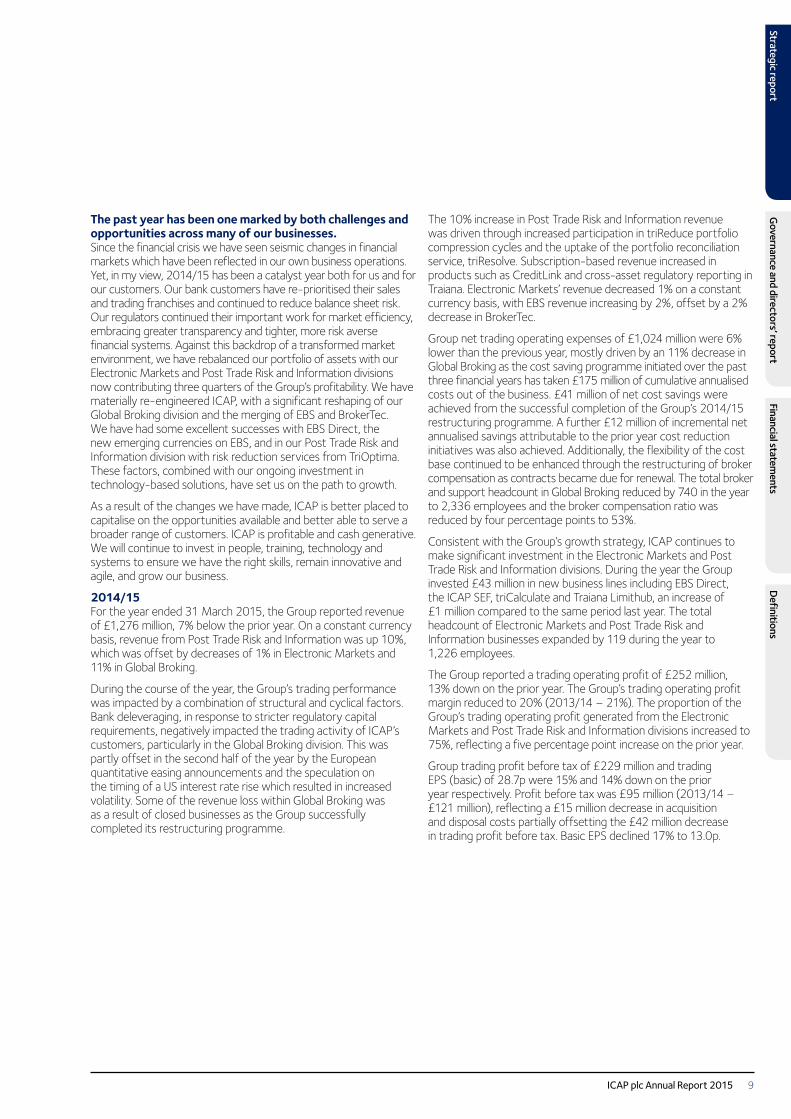
The past year has been one marked by both challenges and opportunities across many of our businesses. Since the financial crisis we have seen seismic changes in financial markets which have been reflected in our own business operations. Yet, in my view, 2014/15 has been a catalyst year both for us and for our customers. Our bank customers have re-prioritised their sales and trading franchises and continued to reduce balance sheet risk. Our regulators continued their important work for market efficiency, embracing greater transparency and tighter, more risk averse financial systems. Against this backdrop of a transformed market environment, we have rebalanced our portfolio of assets with our Electronic Markets and Post Trade Risk and Information divisions now contributing three quarters of the Group’s profitability. We have materially re-engineered ICAP, with a significant reshaping of our Global Broking division and the merging of EBS and BrokerTec. We have had some excellent successes with EBS Direct, the new emerging currencies on EBS, and in our Post Trade Risk and Information division with risk reduction services from TriOptima. These factors, combined with our ongoing investment in technology-based solutions, have set us on the path to growth.
As a result of the changes we have made, ICAP is better placed to capitalise on the opportunities available and better able to serve a broader range of customers. ICAP is profitable and cash generative. We will continue to invest in people, training, technology and systems to ensure we have the right skills, remain innovative and agile, and grow our business.
2014/15For the year ended 31 March 2015, the Group reported revenue of £1,276 million, 7% below the prior year. On a constant currency basis, revenue from Post Trade Risk and Information was up 10%, which was offset by decreases of 1% in Electronic Markets and 11% in Global Broking.
During the course of the year, the Group’s trading performance was impacted by a combination of structural and cyclical factors. Bank deleveraging, in response to stricter regulatory capital requirements, negatively impacted the trading activity of ICAP’s customers, particularly in the Global Broking division. This was partly offset in the second half of the year by the European quantitative easing announcements and the speculation on the timing of a US interest rate rise which resulted in increased volatility. Some of the revenue loss within Global Broking was as a result of closed businesses as the Group successfully completed its restructuring programme.
The 10% increase in Post Trade Risk and Information revenue was driven through increased participation in triReduce portfolio compression cycles and the uptake of the portfolio reconciliation service, triResolve. Subscription-based revenue increased in products such as CreditLink and cross-asset regulatory reporting in Traiana. Electronic Markets’ revenue decreased 1% on a constant currency basis, with EBS revenue increasing by 2%, offset by a 2% decrease in BrokerTec.
Group net trading operating expenses of £1,024 million were 6% lower than the previous year, mostly driven by an 11% decrease in Global Broking as the cost saving programme initiated over the past three financial years has taken £175 million of cumulative annualised costs out of the business. £41 million of net cost savings were achieved from the successful completion of the Group’s 2014/15 restructuring programme. A further £12 million of incremental net annualised savings attributable to the prior year cost reduction initiatives was also achieved. Additionally, the flexibility of the cost base continued to be enhanced through the restructuring of broker compensation as contracts became due for renewal. The total broker and support headcount in Global Broking reduced by 740 in the year to 2,336 employees and the broker compensation ratio was reduced by four percentage points to 53%.
Consistent with the Group’s growth strategy, ICAP continues to make significant investment in the Electronic Markets and Post Trade Risk and Information divisions. During the year the Group invested £43 million in new business lines including EBS Direct, the ICAP SEF, triCalculate and Traiana Limithub, an increase of £1 million compared to the same period last year. The total headcount of Electronic Markets and Post Trade Risk and Information businesses expanded by 119 during the year to 1,226 employees.
The Group reported a trading operating profit of £252 million, 13% down on the prior year. The Group’s trading operating profit margin reduced to 20% (2013/14 – 21%). The proportion of the Group’s trading operating profit generated from the Electronic Markets and Post Trade Risk and Information divisions increased to 75%, reflecting a five percentage point increase on the prior year.
Group trading profit before tax of £229 million and trading EPS (basic) of 28.7p were 15% and 14% down on the prior year respectively. Profit before tax was £95 million (2013/14 – £121 million), reflecting a £15 million decrease in acquisition and disposal costs partially offsetting the £42 million decrease in trading profit before tax. Basic EPS declined 17% to 13.0p.
ICAP plc Annual Report 2015 9
Strategic reportG
overnance and directors’ reportFinancial statem
entsD
efinitions
DividendThe directors recommend a final dividend of 15.4p per share which will result in a full-year dividend of 22.0p (2013/14 – 22.0p). This reflects the Group’s strong cash generation and the board’s confidence in the medium-term prospects for the business.
Expanding our addressable marketAn important development this year has been the combination of the EBS and BrokerTec businesses. Our aim is to build a truly world leading electronic OTC transaction platform with a multi-product offering. Our EBS and BrokerTec businesses are both flagship electronic platforms that provide trading solutions across FX and fixed income products. Bringing EBS and BrokerTec together will allow us to scale our technology assets and leverage our sales capability. This will deliver new products and we will reach new client segments. We demonstrated that we are able to deliver successful new trading solutions with the launch of EBS Direct in November 2013, which has experienced exceptional volume growth. We plan to continue to expand our addressable market with the launch of innovative products into other asset classes.
Seizing the strategic and business opportunities created by regulatory changeThe Post Trade Risk and Information division benefited from increased demand for its variety of pre trade, post trade and information products and services. The performance of TriOptima was particularly notable, reflecting its position as a provider of product and technological solutions that address customer needs in the new regulatory environment. Our triReduce service reduces risk and provides OTC derivatives trade compression. It has capitalised on and benefited significantly from the requirements of new capital rules and leverage ratios. The introduction of new regulatory requirements such as portfolio reconciliation, cross asset reporting and certainty of clearing has increased demand for TriOptima’s triResolve and Traiana’s products including CCP Connect and Creditlink.
Strategic report Group CEO’s review continued
Reshaping Global BrokingComing into 2014/15 the Global Broking division was experiencing an extremely challenging trading environment. Volumes in the first half continued to decline amid bank deleveraging, low volatility and new regulatory requirements that make it more onerous for our core bank clients to trade at the levels we had seen historically. We took some difficult but necessary decisions to take into account this new reality, proceeding on the basis that some of these changes are permanent.
We therefore implemented a restructuring programme. We reviewed all of the geographies and asset classes in which we operate and exited those that are not core to our strategy. This delivered net annualised savings of £70 million in 2014/15, exceeding the target of £60 million. The savings were derived from headcount reduction in the broking population and related infrastructure roles and the reduction of broker compensation as a percentage of revenue. These savings are in addition to the £125 million of annualised cost savings delivered in the three years to 2013/14. The benefit of these savings is a Global Broking business with stronger profitability which has adapted successfully to the market environment and is fit for purpose for the future. While the restructuring is essentially complete, we continue to focus on the cost base of Global Broking.
Global Broking is now well positioned to look to the future to invest in technology and in its electronic capability in areas such as Fusion and its SEF. We will push forward with the development of hybrid and electronic trading offerings such as i-Swap and other matching platforms. Another area of focus will be those businesses where we have market leading franchises and which have benefited from rising volatility, such as in OTC European Interest Rate Derivatives. This is how we will continue to differentiate ourselves from our traditional broking competitors.
Looking forwardWe aim to be at the forefront of product and technological innovation. We remain focused on driving the future growth of the business through the development of new products and services and expansion into new markets. We continue to invest in all aspects of our business especially the ongoing development of electronic trading platforms and post trade services.
We will use our scale and breadth to master the complexity of the new landscape. We are investing in people, training, technology and systems to ensure we have the right skills, maintain our innovative market edge, share expertise and best practice around the world and grow our business.
ICAP plc Annual Report 201510

ICAP’s world class businesses are led by an experienced team, the Global Executive Management Group, seen here in March 2015 at ICAP’s New Jersey office.
From left to right: Gil Mandelzis, Ken Pigaga, Duncan Wales, Michael Spencer, John Nixon, Seth Johnson, Hugh Gallagher, David Casterton, Laurent Paulhac, David Ireland
Read more p68
ICAP plc Annual Report 2015 11
Strategic reportG
overnance and directors’ reportFinancial statem
entsD
efinitions
ICAP’s culture and Charity DayICAP’s success has always been based on its people. That’s not just about our skills but about the way we do things, about what we value and what we believe in. Our culture matters and it sets us apart.
As a business we have adapted and evolved. We are reviewing our culture and where it may need to change. Our Chairman, Charles Gregson, outlines in his statement the many steps we have taken to ensure we are doing the right things, ranging from continuing to improve our approach to risk and compliance to strengthening our governance framework and ensuring we have the right leadership from the top.
Led by the Group Head of HR we have launched an initiative specifically focused on the important issue of our corporate culture, looking at how we define, embed and measure the right culture throughout ICAP. This initiative will continue into 2015 and 2016, along with a senior leadership development programme, a more rigorous approach to internal communications, a focus on talent management and an exercise to benchmark the ICAP brand.
Taken together, these activities will help strengthen our organisation and make sure we take steps to change where we need to.
Strategic report Group CEO’s review continued
By far the single most important manifestation of the ICAP culture and the engagement of our employees is our annual Charity Day which this year took place on 3 December 2014. We are incredibly proud that together we raised £8 million. It brings the total amount donated by ICAP to charities worldwide since 1993 to £120 million. This is a fantastic achievement which would not have been made possible without the ongoing support of our customers, employees, suppliers and our distinguished guests who work hard to make a tangible difference to hundreds of charities around the world. This year ICAP supported 200 charities globally and has supported nearly 2,000 charities since the first Charity Day in 1993.
OutlookSince the start of the financial year the external environment has been mixed and we continue to expect near term headwinds as the pick up in market activity remains episodic. The restructuring programme has delivered on its target, the benefits of which will be to contribute to funding our continuing investment in new initiatives.
Ultimately, we are and will continue to build a stronger, leaner organisation, thereby enhancing our profitability and providing a solid base for future business growth with all the benefits which that entails for us, our employees and customers alike.
I would like to thank all our employees for their hard work and commitment during the past 12 months. Without their unstinting efforts we would not be facing the future with such confidence, knowing that we are well positioned to maximise the opportunities that lie ahead.
Michael SpencerGroup Chief Executive Officer
ICAP plc Annual Report 201512
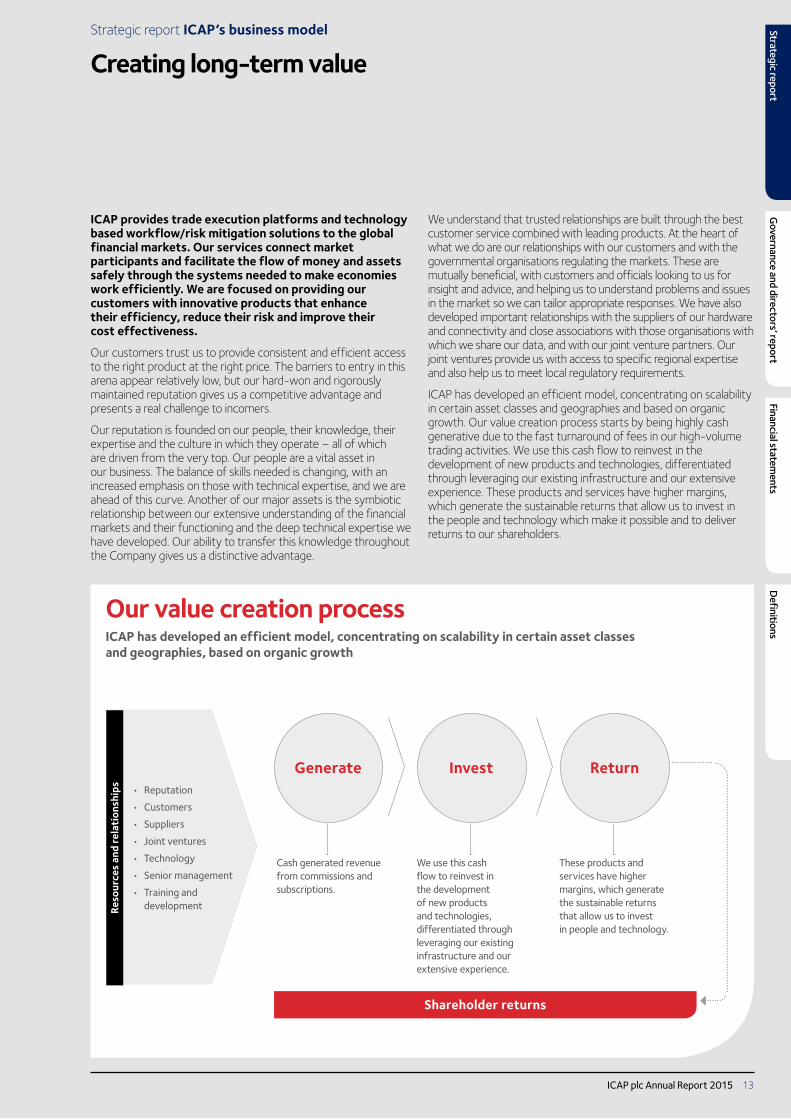
Our value creation processICAP has developed an efficient model, concentrating on scalability in certain asset classes and geographies, based on organic growth
Generate
Reso
urce
s an
d re
lati
onsh
ips
Invest Return• Reputation
• Customers
• Suppliers
• Joint ventures
• Technology
• Senior management
• Training and development
Shareholder returns
Cash generated revenue from commissions and subscriptions.
We use this cash flow to reinvest in the development of new products and technologies, differentiated through leveraging our existing infrastructure and our extensive experience.
These products and services have higher margins, which generate the sustainable returns that allow us to invest in people and technology.
Strategic report ICAP’s business model
Creating long-term value
ICAP provides trade execution platforms and technology based workflow/risk mitigation solutions to the global financial markets. Our services connect market participants and facilitate the flow of money and assets safely through the systems needed to make economies work efficiently. We are focused on providing our customers with innovative products that enhance their efficiency, reduce their risk and improve their cost effectiveness.
Our customers trust us to provide consistent and efficient access to the right product at the right price. The barriers to entry in this arena appear relatively low, but our hard-won and rigorously maintained reputation gives us a competitive advantage and presents a real challenge to incomers.
Our reputation is founded on our people, their knowledge, their expertise and the culture in which they operate – all of which are driven from the very top. Our people are a vital asset in our business. The balance of skills needed is changing, with an increased emphasis on those with technical expertise, and we are ahead of this curve. Another of our major assets is the symbiotic relationship between our extensive understanding of the financial markets and their functioning and the deep technical expertise we have developed. Our ability to transfer this knowledge throughout the Company gives us a distinctive advantage.
We understand that trusted relationships are built through the best customer service combined with leading products. At the heart of what we do are our relationships with our customers and with the governmental organisations regulating the markets. These are mutually beneficial, with customers and officials looking to us for insight and advice, and helping us to understand problems and issues in the market so we can tailor appropriate responses. We have also developed important relationships with the suppliers of our hardware and connectivity and close associations with those organisations with which we share our data, and with our joint venture partners. Our joint ventures provide us with access to specific regional expertise and also help us to meet local regulatory requirements.
ICAP has developed an efficient model, concentrating on scalability in certain asset classes and geographies and based on organic growth. Our value creation process starts by being highly cash generative due to the fast turnaround of fees in our high-volume trading activities. We use this cash flow to reinvest in the development of new products and technologies, differentiated through leveraging our existing infrastructure and our extensive experience. These products and services have higher margins, which generate the sustainable returns that allow us to invest in the people and technology which make it possible and to deliver returns to our shareholders.
ICAP plc Annual Report 2015 13
Strategic reportG
overnance and directors’ reportFinancial statem
entsD
efinitions

Strategic report Strategy and performance
A clear strategy for growth
Strategic priorities Our performance during the year Future outlook Strategic risks
Expanding our addressable market
• EBS Direct spot FX continues to grow having been launched in November 2013. Average daily volume reached a monthly record of $19 billion by September 2014 with $17 billion in March 2015.
• i-Swap continues to expand its offering including first non-bank participants in US$ order book and disclosed streaming offering in euro.
• EBS Direct to be expanded to FX swaps/forwards and corporates in coming financial year.
• BrokerTec Direct to be in beta testing by the end of the coming financial year.
• Expansion of i-Swap to wider group of customers including more non-bank participants in the US and more regional banks in Europe.
• Increased competition from existing single bank and multi-bank electronic platforms.
• Time to market of technology/functionality to support new product offerings.
• A lack of post trade anonymity in US swaps markets.
Read more p16
Seizing opportunities created by regulatory change
• TriOptima delivered constant FX 34% revenue growth with significant growth in both triReduce (compression) and triResolve (reconciliation). triReduce compressed $150.0 trillion in 2014/15 compared to $112.1 trillion in the prior year.
• triResolve’s number of customers has increased from 987 during 2013/14 to more than 1,380 in 2014/15.
• Banks looking to reduce balance sheet and operational risk are likely to continue to show strong demand for portfolio compression and portfolio reconciliation tools.
• triReduce is being expanded to new clearing houses (for example CME, Japan Securities Clearing Corporation) and new asset classes (for example CLS FX forwards).
• triCalculate counterparty credit valuation product to move from beta testing to commercial launch.
• A shift to futures shrinking swaps inventory significantly. • Competition from clearing house coupon blending
compression offerings. • Ability to compete with banks own in-house valuation tools
or other third party vendors.
Read more p17
Leveraging into growth markets
• EBS NDF and CNH reported average daily volume of $2.9 billion (+102%) and $3.8 billion (+528%) over 12-month period, both ending the year strongly: March average daily volume was $4.2 billion for NDFs and $6.4 billion for CNH.
• Global Broking continues to see better revenue trends in Asia Pacific relative to other geographies. Key drivers include significant year-on-year growth in renminbi products both onshore and offshore.
• Expecting continued growth in EBS emerging markets currencies in coming financial year.
• SGX joint venture – EBS plans to offer customers access to SGX listed FX futures in block sizes via the EBS platforms.
• Competitive pressure and macro/volatility outlook. Pace of financial liberalisation also key to structural growth of markets.
Read more p18
Focusing on market leading franchises
• Global Broking reshaped to focus on market leading franchises with several business lines exited as well as desk closures. Cost savings achieved of £70 million during 2014/15 with £41 million positive impact to 2014/15 and a further £29 million annualised effect in 2015/16. Global Broking reported operating profit margin rose from 4% in the first half to 12% in the second half.
• Continued to protect/grow market share in core products such as EBS Market G7 pairs, BrokerTec UST/repos and Global Broking G7 IRS.
• Global Broking operating profit margins continue to improve in line with the levels in the second half of 2014/15 driven by lower broker compensation ratio and cost savings in infrastructure costs.
• Full annualised effect of the 2014/15 £70 million cost savings will come through in 2015/16. Costs will continue to be an area of focus.
• Further bank deleveraging results in declining interdealer broker industry revenues.
• Competitive threats from other interdealer brokers, electronic platforms and exchange groups.
Read more p19
Evolving culture • Emphasis on managing people as a key asset, including significant change in the way we communicate with all employees.
• Group-wide leadership programmes were attended by more than 60 senior managers and over 200 desk heads, increasing cross-divisional relationships and strengthening alignment and collaboration.
• Culture to be reviewed to ensure it aligns with and reinforces our brand and inspires and aligns our people to achieve outstanding performance.
• Renewed emphasis on performance feedback and talent development.
• Continuing competition for specialist skills may result in higher turnover and additional challenges in integrating new staff into the culture.
• Increased remuneration regulation originally designed for financial services firms with much higher risk profiles may impact on ICAP’s ability to attract and retain staff in a global market.
• Rogue behaviour from employees despite zero tolerance policy.
Read more p20
ICAP plc Annual Report 201514

Strategic priorities Our performance during the year Future outlook Strategic risks
Expanding our addressable market
• EBS Direct spot FX continues to grow having been launched in November 2013. Average daily volume reached a monthly record of $19 billion by September 2014 with $17 billion in March 2015.
• i-Swap continues to expand its offering including first non-bank participants in US$ order book and disclosed streaming offering in euro.
• EBS Direct to be expanded to FX swaps/forwards and corporates in coming financial year.
• BrokerTec Direct to be in beta testing by the end of the coming financial year.
• Expansion of i-Swap to wider group of customers including more non-bank participants in the US and more regional banks in Europe.
• Increased competition from existing single bank and multi-bank electronic platforms.
• Time to market of technology/functionality to support new product offerings.
• A lack of post trade anonymity in US swaps markets.
Read more p16
Seizing opportunities created by regulatory change
• TriOptima delivered constant FX 34% revenue growth with significant growth in both triReduce (compression) and triResolve (reconciliation). triReduce compressed $150.0 trillion in 2014/15 compared to $112.1 trillion in the prior year.
• triResolve’s number of customers has increased from 987 during 2013/14 to more than 1,380 in 2014/15.
• Banks looking to reduce balance sheet and operational risk are likely to continue to show strong demand for portfolio compression and portfolio reconciliation tools.
• triReduce is being expanded to new clearing houses (for example CME, Japan Securities Clearing Corporation) and new asset classes (for example CLS FX forwards).
• triCalculate counterparty credit valuation product to move from beta testing to commercial launch.
• A shift to futures shrinking swaps inventory significantly. • Competition from clearing house coupon blending
compression offerings. • Ability to compete with banks own in-house valuation tools
or other third party vendors.
Read more p17
Leveraging into growth markets
• EBS NDF and CNH reported average daily volume of $2.9 billion (+102%) and $3.8 billion (+528%) over 12-month period, both ending the year strongly: March average daily volume was $4.2 billion for NDFs and $6.4 billion for CNH.
• Global Broking continues to see better revenue trends in Asia Pacific relative to other geographies. Key drivers include significant year-on-year growth in renminbi products both onshore and offshore.
• Expecting continued growth in EBS emerging markets currencies in coming financial year.
• SGX joint venture – EBS plans to offer customers access to SGX listed FX futures in block sizes via the EBS platforms.
• Competitive pressure and macro/volatility outlook. Pace of financial liberalisation also key to structural growth of markets.
Read more p18
Focusing on market leading franchises
• Global Broking reshaped to focus on market leading franchises with several business lines exited as well as desk closures. Cost savings achieved of £70 million during 2014/15 with £41 million positive impact to 2014/15 and a further £29 million annualised effect in 2015/16. Global Broking reported operating profit margin rose from 4% in the first half to 12% in the second half.
• Continued to protect/grow market share in core products such as EBS Market G7 pairs, BrokerTec UST/repos and Global Broking G7 IRS.
• Global Broking operating profit margins continue to improve in line with the levels in the second half of 2014/15 driven by lower broker compensation ratio and cost savings in infrastructure costs.
• Full annualised effect of the 2014/15 £70 million cost savings will come through in 2015/16. Costs will continue to be an area of focus.
• Further bank deleveraging results in declining interdealer broker industry revenues.
• Competitive threats from other interdealer brokers, electronic platforms and exchange groups.
Read more p19
Evolving culture • Emphasis on managing people as a key asset, including significant change in the way we communicate with all employees.
• Group-wide leadership programmes were attended by more than 60 senior managers and over 200 desk heads, increasing cross-divisional relationships and strengthening alignment and collaboration.
• Culture to be reviewed to ensure it aligns with and reinforces our brand and inspires and aligns our people to achieve outstanding performance.
• Renewed emphasis on performance feedback and talent development.
• Continuing competition for specialist skills may result in higher turnover and additional challenges in integrating new staff into the culture.
• Increased remuneration regulation originally designed for financial services firms with much higher risk profiles may impact on ICAP’s ability to attract and retain staff in a global market.
• Rogue behaviour from employees despite zero tolerance policy.
Read more p20
ICAP plc Annual Report 2015 15
Strategic reportG
overnance and directors’ reportFinancial statem
entsD
efinitions
Strategic report Strategy in action
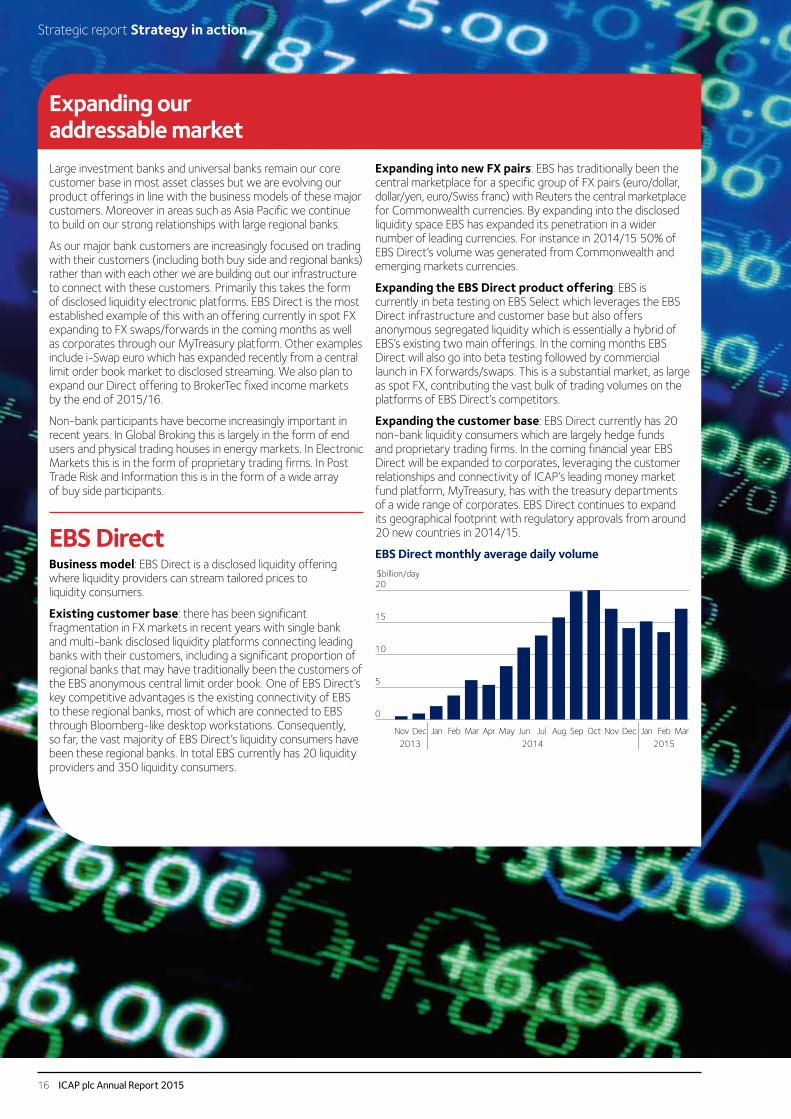
Expanding our addressable marketLarge investment banks and universal banks remain our core customer base in most asset classes but we are evolving our product offerings in line with the business models of these major customers. Moreover in areas such as Asia Pacific we continue to build on our strong relationships with large regional banks.
As our major bank customers are increasingly focused on trading with their customers (including both buy side and regional banks) rather than with each other we are building out our infrastructure to connect with these customers. Primarily this takes the form of disclosed liquidity electronic platforms. EBS Direct is the most established example of this with an offering currently in spot FX expanding to FX swaps/forwards in the coming months as well as corporates through our MyTreasury platform. Other examples include i-Swap euro which has expanded recently from a central limit order book market to disclosed streaming. We also plan to expand our Direct offering to BrokerTec fixed income markets by the end of 2015/16.
Non-bank participants have become increasingly important in recent years. In Global Broking this is largely in the form of end users and physical trading houses in energy markets. In Electronic Markets this is in the form of proprietary trading firms. In Post Trade Risk and Information this is in the form of a wide array of buy side participants.
EBS DirectBusiness model: EBS Direct is a disclosed liquidity offering where liquidity providers can stream tailored prices to liquidity consumers.
Existing customer base: there has been significant fragmentation in FX markets in recent years with single bank and multi-bank disclosed liquidity platforms connecting leading banks with their customers, including a significant proportion of regional banks that may have traditionally been the customers of the EBS anonymous central limit order book. One of EBS Direct’s key competitive advantages is the existing connectivity of EBS to these regional banks, most of which are connected to EBS through Bloomberg-like desktop workstations. Consequently, so far, the vast majority of EBS Direct’s liquidity consumers have been these regional banks. In total EBS currently has 20 liquidity providers and 350 liquidity consumers.
Expanding into new FX pairs: EBS has traditionally been the central marketplace for a specific group of FX pairs (euro/dollar, dollar/yen, euro/Swiss franc) with Reuters the central marketplace for Commonwealth currencies. By expanding into the disclosed liquidity space EBS has expanded its penetration in a wider number of leading currencies. For instance in 2014/15 50% of EBS Direct’s volume was generated from Commonwealth and emerging markets currencies.
Expanding the EBS Direct product offering: EBS is currently in beta testing on EBS Select which leverages the EBS Direct infrastructure and customer base but also offers anonymous segregated liquidity which is essentially a hybrid of EBS’s existing two main offerings. In the coming months EBS Direct will also go into beta testing followed by commercial launch in FX forwards/swaps. This is a substantial market, as large as spot FX, contributing the vast bulk of trading volumes on the platforms of EBS Direct’s competitors.
Expanding the customer base: EBS Direct currently has 20 non-bank liquidity consumers which are largely hedge funds and proprietary trading firms. In the coming financial year EBS Direct will be expanded to corporates, leveraging the customer relationships and connectivity of ICAP’s leading money market fund platform, MyTreasury, has with the treasury departments of a wide range of corporates. EBS Direct continues to expand its geographical footprint with regulatory approvals from around 20 new countries in 2014/15.
EBS Direct monthly average daily volume
Nov Dec Jan Feb Mar Apr May Jun Jul Aug Sep Oct Nov Dec Jan2014 20152013
Feb Mar
20$billion/day
15
10
5
0
ICAP plc Annual Report 201516

Seizing opportunities created by regulatory changeThe pace of regulatory change has been unprecedented in recent years. This includes the direct impact of regulatory changes with the Dodd-Frank Act driven requirements for SEF trading in the US and EMIR driven requirements for regular portfolio reconciliation in Europe. Even more profound has been the indirect impact of new capital/leverage ratio requirements for our bank customers. We believe our post trade services play well into the trend of banks looking to reduce balance sheet and operational risk as well as to improve efficiency and returns. These include our industry standard offerings in portfolio reconciliation (triResolve), portfolio compression (triReduce), basis risk mitigation (Reset), pre trade SEF credit checks (CreditLink) and Traiana trading reporting.
triResolveBusiness model: triResolve provides proactive counterparty exposure management which reduces operational and credit risk for its customers. Operational risk is reduced by providing a central hub where market participants can reconcile their portfolios and resolve trade disputes and valuation discrepancies between counterparties as well as CCPs, trade repositories and/or fund administrators. Counterparty credit risk is reduced by preventing margin call disputes and further allowing for efficient and transparent tracking of collateral posted by counterparties through the central platform.
Regulatory tailwind: with the adoption of the Dodd-Frank Act in the US and EMIR in Europe, the majority of OTC derivatives market participants have to reconcile their portfolios proactively and resolve disputes within established timeframes. This resulted in triResolve seeing a steep surge in customer numbers in the latter part of calendar year 2013 and more frequent reconciling of positions by existing customers.
Growing customer base: the number of customers using triResolve has increased from 987 in 2013/14 to 1,380 in 2014/15. This includes a broad range of institutions including banks, the buyside, energy companies, end user/corporates and insurance companies. These are in turn roughly evenly split across three different types of customer offering: direct customers, indirect customers through aggregators such as custody banks, and customers that are on a basic free service.
Products covered: triResolve covers all asset classes, product structures and types of derivatives including collateralised, uncollateralised and exchange-traded. The main asset classes reconciled are OTC Interest rate and FX derivatives. triResolve reconciles more than 75% of all bilateral OTC derivatives trades globally.
Functionality: new services and value added functionality are constantly being added to the triResolve platform. This includes triResolve trade repository reconciliations which align parties’ portfolios to data recorded in the various trade repositories. More than 70 subscribers are already using the repository reconciliation service.
.
ICAP plc Annual Report 2015 17
Strategic reportG
overnance and directors’ reportFinancial statem
entsD
efinitions

Strategic report Strategy in action continued
Leveraging into growth marketsEmerging markets and Asian capital markets continue to grow at a faster pace than the more developed European and US capital markets especially in the FICC space. Moreover emerging markets and local Asian banks have not been impacted as much by bank de-leveraging as some global players. EBS has seen significant growth in volumes in Asian currencies in recent years which is discussed in the case study below. The businesses which form part of our post trade services continue to expand in emerging markets products with triReduce successfully adding several new IRS markets such as Mexico and Turkey and triResolve expanding its customer base in Asia Pacific.
ICAP’s Global Broking business in Asia Pacific continues to show better trends than the overall Global Broking business with significant year-on-year growth in RMB products both onshore in our associate CFETS-ICAP and in offshore markets. In addition ICAP’s dry bulk commodities with an emphasis on iron ore continue to improve with volumes up significantly year-on-year. Australasia remains a key component of Global Broking’s strategy and a number of the smaller regional emerging market centres have outperformed the prior year. The Global Broking emerging markets offshore business in New York and London continues to grow. Moreover ICAP has stakes in several leading local interdealer brokers in Japan (Totan), China (CFETS), Mexico and other emerging markets.
Asian NDFs and CNH on EBSRising market volumes: faster economic growth than Western economies, coupled with growing capital markets penetration and financial market liberalisation has resulted in the rapid growth of FX trading volumes in emerging Asia. Geopolitical changes as well as interest rate movements have driven a surge in offshore activity in Indian rupee, the most liquid Asian NDF currency. The widening of the trading band by the People’s Bank of China for onshore renminbi also underpinned the structural growth in offshore CNH traded largely in Hong Kong.
Shift from voice to electronic: there has been a significant shift of trading activity in Asian emerging markets from voice broking to pure electronic trading in 2014/15. ICAP estimates 40% of Asian NDF and 95% of CNH volumes are traded on electronic interbank platforms rather than voice brokered which compares with around 20% and 80% respectively a year ago. This has also resulted in a diversification of EBS Asian NDF volumes from largely Indian rupee to a broad range of currencies including Korean won, Malaysian ringgitt, Philippine peso and Taiwan dollar.
Growing market share: EBS has gained market share across most Asian emerging markets pairs and also very noticeably in CNH. ICAP estimates EBS’s market share in Asian NDFs at over 40% in 2014/15 which compares with 20-25% in 2013/14.
NDF average daily volume
Apr May Jun Jul Aug Sep Oct Nov Dec Jan Feb Mar
4.54.0
$billion/day
3.5
2.53.0
2.01.51.00.50
2014 2015
CNH average daily volume
7.0
6.0
$billion/day
5.0
4.0
3.0
2.0
1.0
0
Apr May Jun Jul Aug Sep Oct Nov Dec Jan Feb Mar2014 2015
ICAP plc Annual Report 201518
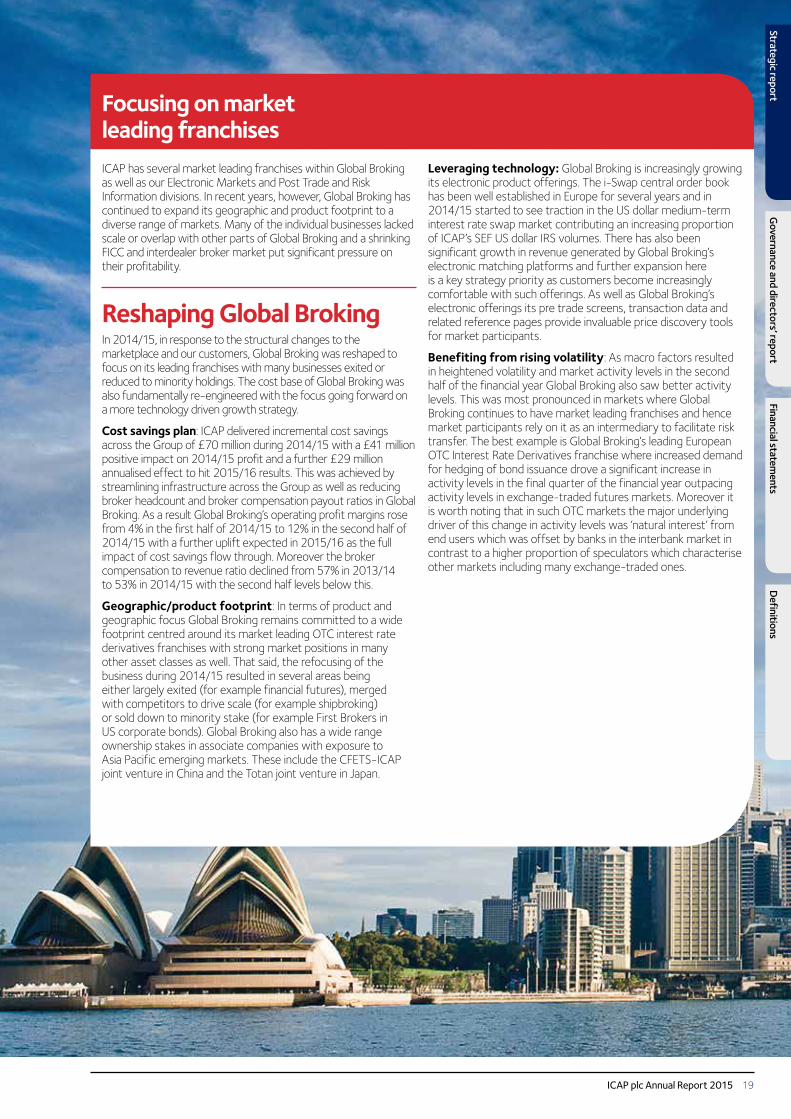
Focusing on market leading franchisesICAP has several market leading franchises within Global Broking as well as our Electronic Markets and Post Trade and Risk Information divisions. In recent years, however, Global Broking has continued to expand its geographic and product footprint to a diverse range of markets. Many of the individual businesses lacked scale or overlap with other parts of Global Broking and a shrinking FICC and interdealer broker market put significant pressure on their profitability.
Reshaping Global BrokingIn 2014/15, in response to the structural changes to the marketplace and our customers, Global Broking was reshaped to focus on its leading franchises with many businesses exited or reduced to minority holdings. The cost base of Global Broking was also fundamentally re-engineered with the focus going forward on a more technology driven growth strategy.
Cost savings plan: ICAP delivered incremental cost savings across the Group of £70 million during 2014/15 with a £41 million positive impact on 2014/15 profit and a further £29 million annualised effect to hit 2015/16 results. This was achieved by streamlining infrastructure across the Group as well as reducing broker headcount and broker compensation payout ratios in Global Broking. As a result Global Broking’s operating profit margins rose from 4% in the first half of 2014/15 to 12% in the second half of 2014/15 with a further uplift expected in 2015/16 as the full impact of cost savings flow through. Moreover the broker compensation to revenue ratio declined from 57% in 2013/14 to 53% in 2014/15 with the second half levels below this.
Geographic/product footprint: In terms of product and geographic focus Global Broking remains committed to a wide footprint centred around its market leading OTC interest rate derivatives franchises with strong market positions in many other asset classes as well. That said, the refocusing of the business during 2014/15 resulted in several areas being either largely exited (for example financial futures), merged with competitors to drive scale (for example shipbroking) or sold down to minority stake (for example First Brokers in US corporate bonds). Global Broking also has a wide range ownership stakes in associate companies with exposure to Asia Pacific emerging markets. These include the CFETS-ICAP joint venture in China and the Totan joint venture in Japan.
Leveraging technology: Global Broking is increasingly growing its electronic product offerings. The i-Swap central order book has been well established in Europe for several years and in 2014/15 started to see traction in the US dollar medium-term interest rate swap market contributing an increasing proportion of ICAP’s SEF US dollar IRS volumes. There has also been significant growth in revenue generated by Global Broking’s electronic matching platforms and further expansion here is a key strategy priority as customers become increasingly comfortable with such offerings. As well as Global Broking’s electronic offerings its pre trade screens, transaction data and related reference pages provide invaluable price discovery tools for market participants.
Benefiting from rising volatility: As macro factors resulted in heightened volatility and market activity levels in the second half of the financial year Global Broking also saw better activity levels. This was most pronounced in markets where Global Broking continues to have market leading franchises and hence market participants rely on it as an intermediary to facilitate risk transfer. The best example is Global Broking’s leading European OTC Interest Rate Derivatives franchise where increased demand for hedging of bond issuance drove a significant increase in activity levels in the final quarter of the financial year outpacing activity levels in exchange-traded futures markets. Moreover it is worth noting that in such OTC markets the major underlying driver of this change in activity levels was ‘natural interest’ from end users which was offset by banks in the interbank market in contrast to a higher proportion of speculators which characterise other markets including many exchange-traded ones.
ICAP plc Annual Report 2015 19
Strategic reportG
overnance and directors’ reportFinancial statem
entsD
efinitions

Strategic report Strategy in action continued
Evolving cultureICAP’s culture has been key to our success and must continue to evolve as our business changes. Culture is a differentiating factor between success and failure when it comes to commercial performance, employee engagement and good conduct. We have defined culture in a broad sense as ‘what we value as an organisation’, ‘how we get things done’ and ‘how we behave’. Our ability to adapt to new markets and opportunities is a direct result of each employee’s ability and willingness to contribute and influence how we conduct our business. The board and our senior leadership play a critical role in setting the tone from the top.
Leadership development In an effort to strengthen the skills, commitment and alignment of our organisation’s leaders, more than 60 of our senior managers were selected to attend a two-day leadership development programme that ran between November 2014 and April 2015. The programme was designed with input from the board and the GEMG. It focused on equipping our senior managers to lead a culture that places the right emphasis on controls and values, drives performance and great execution, is externally orientated and innovative, and develops talent at all levels.
As well as having the chance to learn and build skills, the programme gave our top leaders an opportunity to reflect on the implications of ICAP’s current and future context for their leadership responsibilities. By discussing everything from culture, values and ethics to business strategy, performance and reputation, in mixed groups, the programme also had the very positive effect of encouraging greater cross-functional and cross-business collaboration. This two-day programme forms part of our continued investment into ongoing leadership development and, in addition to providing continued development support to those who attended the programme, the learnings and insights from this initiative are being used to shape our activities on culture and to define further work on talent development throughout the organisation.
ICAP’s leadership programme forms part of ICAP’s continued investment in leadership development and cultural evolution. From left to right: Garry Stewart - Executive Managing Director and Deputy Chief Executive Officer, EMEA Broking, Vanessa Cruwys - Group Head of HR, Mireille Dryberg - Chief Operating Officer, TriOptima, Rupak Ghose - Group Strategy Director.
ICAP plc Annual Report 201520

Strategic report ICAP Charity Day
ICAP Charity Day demonstrates our strong culture
ICAP Charity DayAs an integral part of the financial markets we believe that ICAP contributes to the economies in which we operate; we recognise the impact we have and how our behaviours and activities can have a positive effect.
Our annual ICAP Charity Day event demonstrates this and reflects ICAP’s strong culture. It unites our employees globally, our customers and suppliers. It has a positive impact on our employees and the public’s awareness not only of ICAP, but of the broader financial services community of which we are a member.
ICAP Charity Day has had an enormous impact. By donating all our revenue on one day each year, we have positively changed the lives of thousands of people around the world. Thanks to the efforts of our customers, suppliers and employees, on 3 December 2014, an incredible £8 million/US$12.5 million was raised bringing the total amount over 22 years to £120 million.
This special occasion is one of the most important days of ICAP’s year. Charity Day is something of which employees are tremendously proud of – that they are part of an organisation that takes its charitable giving very seriously. Every division of ICAP around the globe unites and the entire revenue and commissions on the day are donated directly to 200 chosen charities around the world.
The whole Company channels energy and enthusiasm into Charity Day. Read more about the projects we have supported and the incredible ‘Success Stories’ at www.icapcharityday.com/success-stories.
£120million raised since 1993
www.facebook.com/ICAPCharityDay
www.twitter.com/ICAPCharityDay
www.icapcharityday.com Watch our latest movie about ICAP Charity Day www.icapcharityday.com/2014-video
ICAP plc Annual Report 2015 21
Strategic reportG
overnance and directors’ reportFinancial statem
entsD
efinitions
Strategic report Key performance indicators
Measuring our performance
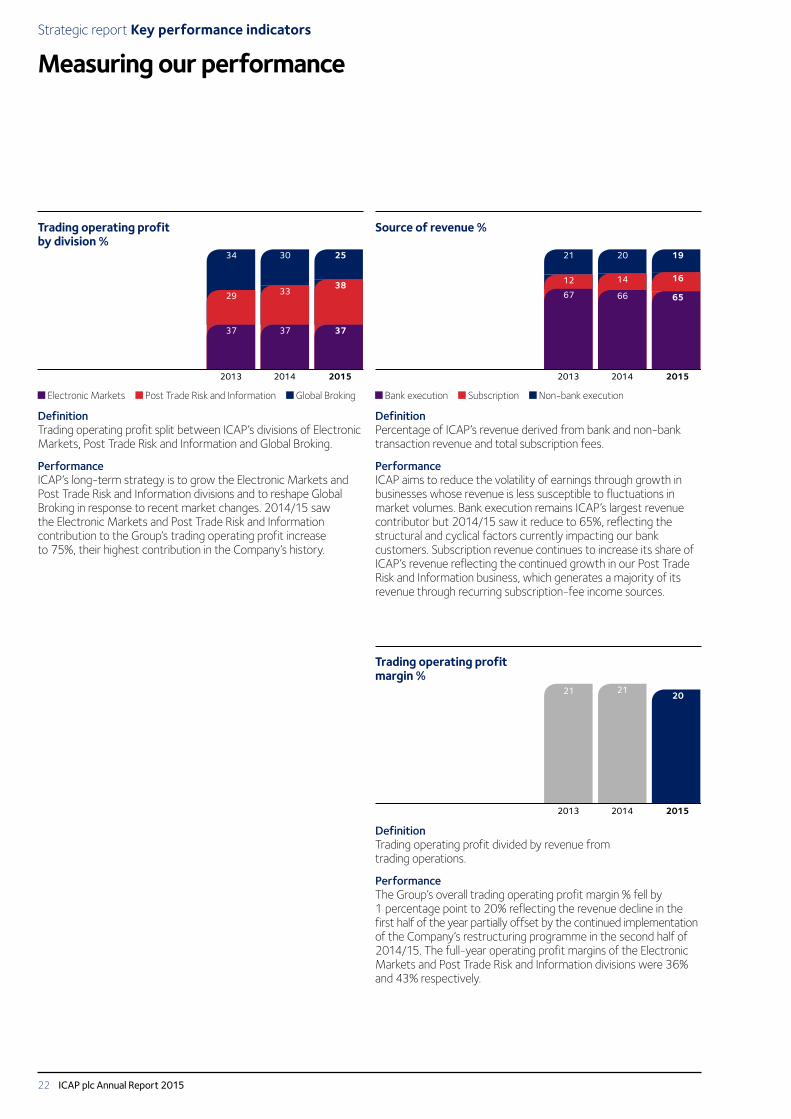
Trading operating profit by division %
Source of revenue % Growth in trading EPS (basic) pence
Conversion of trading profit to cash %
2013 2014 2015
37
29
34
37
33
30
37
38
25
2013 2014 2015
67
12
21
66
14
20
65
16
19
2013 2014 2015
33.0 33.2
28.7
2013 2014 2015
130
75
106
Electronic Markets Post Trade Risk and Information Global Broking Bank execution Subscription Non-bank execution
DefinitionTrading operating profit split between ICAP’s divisions of Electronic Markets, Post Trade Risk and Information and Global Broking.
PerformanceICAP’s long-term strategy is to grow the Electronic Markets and Post Trade Risk and Information divisions and to reshape Global Broking in response to recent market changes. 2014/15 saw the Electronic Markets and Post Trade Risk and Information contribution to the Group’s trading operating profit increase to 75%, their highest contribution in the Company’s history.
DefinitionPercentage of ICAP’s revenue derived from bank and non-bank transaction revenue and total subscription fees.
PerformanceICAP aims to reduce the volatility of earnings through growth in businesses whose revenue is less susceptible to fluctuations in market volumes. Bank execution remains ICAP’s largest revenue contributor but 2014/15 saw it reduce to 65%, reflecting the structural and cyclical factors currently impacting our bank customers. Subscription revenue continues to increase its share of ICAP’s revenue reflecting the continued growth in our Post Trade Risk and Information business, which generates a majority of its revenue through recurring subscription-fee income sources.
DefinitionTrading EPS (basic) is the profit after tax attributable to the equity holders of the Group divided by the weighted average number of shares in issue during the year, excluding shares held to satisfy employee share plans and shares purchased by the Group and held as Treasury Shares.
PerformanceICAP aims to deliver superior EPS growth for our investors. Trading EPS fell this year to 28.7p, the fall largely reflecting a trading operating profit decline in the first half of the year partially offset by a second half of 2014/15 trading EPS of 18.6p. Given the prospects of ICAP’s business strategy we remain confident superior EPS growth is achievable over the medium term.
DefinitionConversion of trading profit to cash is calculated as cash generated from trading operations, excluding acquisition and disposal costs and exceptional items, less cash flows from operations relating to non-controlling interests, interest, tax and capital expenditure, plus dividends received from associates and investments, measured as a percentage of trading profit.
PerformanceThe Group’s business model efficiently converts trading profit into cash and we expect a 100% conversion over the medium to long term. The 75% achieved in 2013/14 was unusually low, principally reflecting the reversal of prior year working capital timing differences and increased capital investment in new product initiatives. 2014/15 has seen the Group return to above expected levels, converting 106% of its profit into cash.
Trading operating profit margin %
Broker compensation as a percentage of revenue
Technology spend as a percentage of revenue
2013 2014 2015
21 21 20
2013 2014 2015
57 5753
2013 2014 2015
13
16
14
DefinitionTrading operating profit divided by revenue from trading operations.
PerformanceThe Group’s overall trading operating profit margin % fell by 1 percentage point to 20% reflecting the revenue decline in the first half of the year partially offset by the continued implementation of the Company’s restructuring programme in the second half of 2014/15. The full-year operating profit margins of the Electronic Markets and Post Trade Risk and Information divisions were 36% and 43% respectively.
DefinitionTotal employee costs (including salary, commission and other benefits) for brokers employed in the Group’s Global Broking division divided by Global Broking revenue.
PerformanceICAP aims to ensure that broker remuneration is aligned with the strategy and objectives of the Group as a whole. Broker compensation as a percentage of revenue has fallen as a result of the restructuring exercise which, in addition to exiting brokers, also included a review of broker employment contracts to reduce or remove certain fixed elements of compensation and reduce payout ratios.
DefinitionExpenditure on the maintenance and development of information technology as a percentage of total revenue.
PerformanceFollowing a spike last year, technology spend as a percentage of revenue was 14% in 2015, in line with the Company’s long-term trend. The spike in 2014 reflected increased investment in new products including ICAP SEF, EBS Direct, triOptima’s triResolve and Traiana’s CreditLink services.
ICAP plc Annual Report 201522
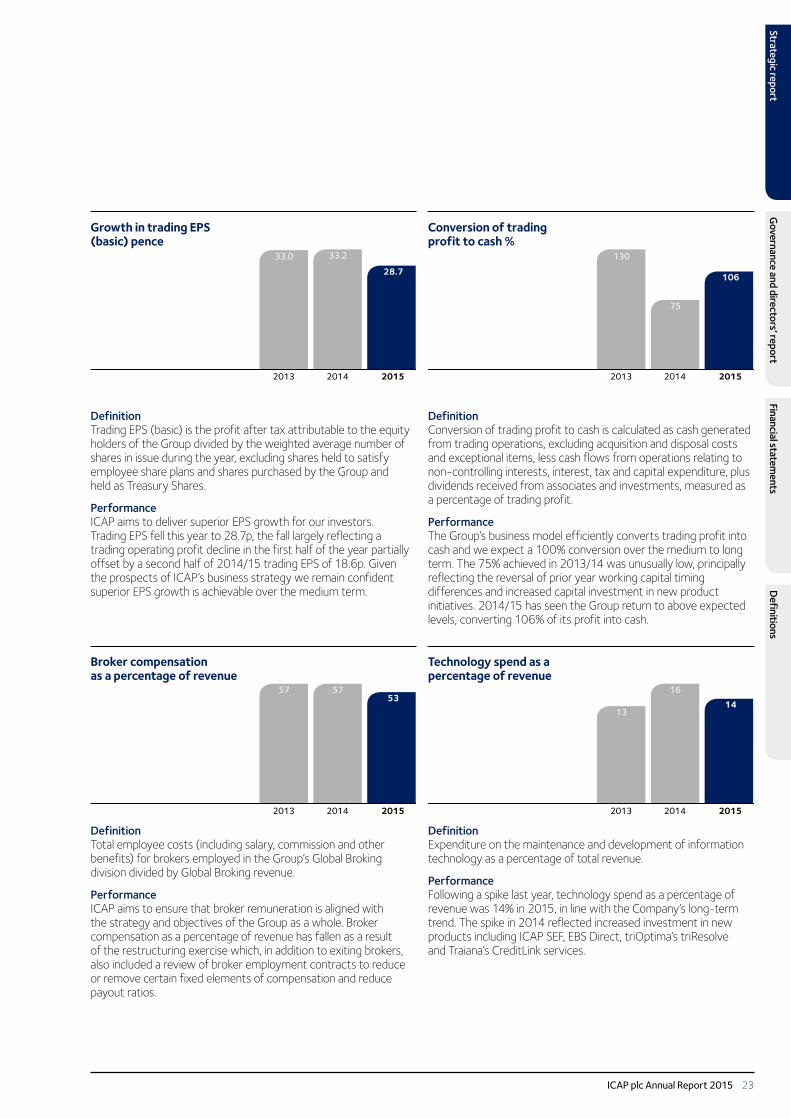
Trading operating profit by division %
Source of revenue % Growth in trading EPS (basic) pence
Conversion of trading profit to cash %
2013 2014 2015
37
29
34
37
33
30
37
38
25
2013 2014 2015
67
12
21
66
14
20
65
16
19
2013 2014 2015
33.0 33.2
28.7
2013 2014 2015
130
75
106
Electronic Markets Post Trade Risk and Information Global Broking Bank execution Subscription Non-bank execution
DefinitionTrading operating profit split between ICAP’s divisions of Electronic Markets, Post Trade Risk and Information and Global Broking.
PerformanceICAP’s long-term strategy is to grow the Electronic Markets and Post Trade Risk and Information divisions and to reshape Global Broking in response to recent market changes. 2014/15 saw the Electronic Markets and Post Trade Risk and Information contribution to the Group’s trading operating profit increase to 75%, their highest contribution in the Company’s history.
DefinitionPercentage of ICAP’s revenue derived from bank and non-bank transaction revenue and total subscription fees.
PerformanceICAP aims to reduce the volatility of earnings through growth in businesses whose revenue is less susceptible to fluctuations in market volumes. Bank execution remains ICAP’s largest revenue contributor but 2014/15 saw it reduce to 65%, reflecting the structural and cyclical factors currently impacting our bank customers. Subscription revenue continues to increase its share of ICAP’s revenue reflecting the continued growth in our Post Trade Risk and Information business, which generates a majority of its revenue through recurring subscription-fee income sources.
DefinitionTrading EPS (basic) is the profit after tax attributable to the equity holders of the Group divided by the weighted average number of shares in issue during the year, excluding shares held to satisfy employee share plans and shares purchased by the Group and held as Treasury Shares.
PerformanceICAP aims to deliver superior EPS growth for our investors. Trading EPS fell this year to 28.7p, the fall largely reflecting a trading operating profit decline in the first half of the year partially offset by a second half of 2014/15 trading EPS of 18.6p. Given the prospects of ICAP’s business strategy we remain confident superior EPS growth is achievable over the medium term.
DefinitionConversion of trading profit to cash is calculated as cash generated from trading operations, excluding acquisition and disposal costs and exceptional items, less cash flows from operations relating to non-controlling interests, interest, tax and capital expenditure, plus dividends received from associates and investments, measured as a percentage of trading profit.
PerformanceThe Group’s business model efficiently converts trading profit into cash and we expect a 100% conversion over the medium to long term. The 75% achieved in 2013/14 was unusually low, principally reflecting the reversal of prior year working capital timing differences and increased capital investment in new product initiatives. 2014/15 has seen the Group return to above expected levels, converting 106% of its profit into cash.
Trading operating profit margin %
Broker compensation as a percentage of revenue
Technology spend as a percentage of revenue
2013 2014 2015
21 21 20
2013 2014 2015
57 5753
2013 2014 2015
13
16
14
DefinitionTrading operating profit divided by revenue from trading operations.
PerformanceThe Group’s overall trading operating profit margin % fell by 1 percentage point to 20% reflecting the revenue decline in the first half of the year partially offset by the continued implementation of the Company’s restructuring programme in the second half of 2014/15. The full-year operating profit margins of the Electronic Markets and Post Trade Risk and Information divisions were 36% and 43% respectively.
DefinitionTotal employee costs (including salary, commission and other benefits) for brokers employed in the Group’s Global Broking division divided by Global Broking revenue.
PerformanceICAP aims to ensure that broker remuneration is aligned with the strategy and objectives of the Group as a whole. Broker compensation as a percentage of revenue has fallen as a result of the restructuring exercise which, in addition to exiting brokers, also included a review of broker employment contracts to reduce or remove certain fixed elements of compensation and reduce payout ratios.
DefinitionExpenditure on the maintenance and development of information technology as a percentage of total revenue.
PerformanceFollowing a spike last year, technology spend as a percentage of revenue was 14% in 2015, in line with the Company’s long-term trend. The spike in 2014 reflected increased investment in new products including ICAP SEF, EBS Direct, triOptima’s triResolve and Traiana’s CreditLink services.
ICAP plc Annual Report 2015 23
Strategic reportG
overnance and directors’ reportFinancial statem
entsD
efinitions
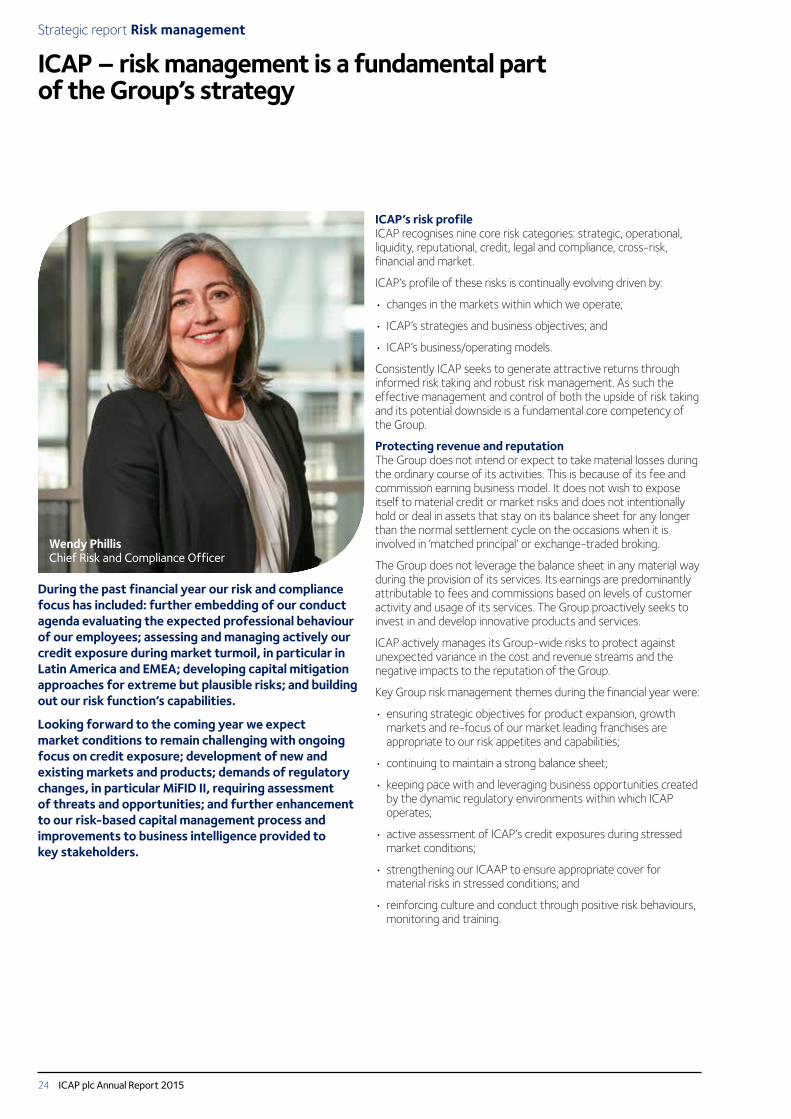
Strategic report Risk management
ICAP – risk management is a fundamental part of the Group’s strategy
ICAP’s risk profileICAP recognises nine core risk categories: strategic, operational, liquidity, reputational, credit, legal and compliance, cross-risk, financial and market.
ICAP’s profile of these risks is continually evolving driven by:
• changes in the markets within which we operate;
• ICAP’s strategies and business objectives; and
• ICAP’s business/operating models.
Consistently ICAP seeks to generate attractive returns through informed risk taking and robust risk management. As such the effective management and control of both the upside of risk taking and its potential downside is a fundamental core competency of the Group.
Protecting revenue and reputationThe Group does not intend or expect to take material losses during the ordinary course of its activities. This is because of its fee and commission earning business model. It does not wish to expose itself to material credit or market risks and does not intentionally hold or deal in assets that stay on its balance sheet for any longer than the normal settlement cycle on the occasions when it is involved in ‘matched principal’ or exchange-traded broking.
The Group does not leverage the balance sheet in any material way during the provision of its services. Its earnings are predominantly attributable to fees and commissions based on levels of customer activity and usage of its services. The Group proactively seeks to invest in and develop innovative products and services.
ICAP actively manages its Group-wide risks to protect against unexpected variance in the cost and revenue streams and the negative impacts to the reputation of the Group.
Key Group risk management themes during the financial year were:
• ensuring strategic objectives for product expansion, growth markets and re-focus of our market leading franchises are appropriate to our risk appetites and capabilities;
• continuing to maintain a strong balance sheet;
• keeping pace with and leveraging business opportunities created by the dynamic regulatory environments within which ICAP operates;
• active assessment of ICAP’s credit exposures during stressed market conditions;
• strengthening our ICAAP to ensure appropriate cover for material risks in stressed conditions; and
• reinforcing culture and conduct through positive risk behaviours, monitoring and training.
During the past financial year our risk and compliance focus has included: further embedding of our conduct agenda evaluating the expected professional behaviour of our employees; assessing and managing actively our credit exposure during market turmoil, in particular in Latin America and EMEA; developing capital mitigation approaches for extreme but plausible risks; and building out our risk function’s capabilities.
Looking forward to the coming year we expect market conditions to remain challenging with ongoing focus on credit exposure; development of new and existing markets and products; demands of regulatory changes, in particular MiFID II, requiring assessment of threats and opportunities; and further enhancement to our risk-based capital management process and improvements to business intelligence provided to key stakeholders.
Wendy PhillisChief Risk and Compliance Officer
ICAP plc Annual Report 201524

Governance and the risk management frameworkThe board has overall responsibility for the governance of ICAP’s risk management and ensures there are adequate and effective internal systems of control with clear responsibilities for the setting of risk appetites, the identification and assessment of risks, their monitoring, reporting and mitigation. During 2014/15, focus has included risk appetite development, risk-based capital adequacy, culture and conduct risk.
Risk appetiteThe board sets and monitors risk appetite through the nine risk categories: strategic, operational, liquidity, reputational, credit, legal and compliance, cross-risk, financial and market.
Each year ICAP’s risk appetite statements and respective limits are set alongside its strategic plans, recognising the key drivers of the risks ICAP expects to face as a Group in the coming 12 months.
Risk management frameworkICAP’s risk management framework is designed to identify, assess, monitor, report and mitigate the risks that could impact the ability to execute our strategy and meet our stakeholders’ expectations. To ensure a consistent risk management approach globally, the framework is used across all risk disciplines with the following pillars:
• Governance – in addition to appropriate governance at all levels of the Group as detailed in the corporate governance statement, this pillar incorporates risk appetite responsibilities, the completeness of our risk taxonomy, roles and responsibilities within three lines of defence and the continued fostering of the corporate risk management culture.
• Policy and methodologies – clear principle-based policies for our key risks reflecting the board’s risk appetite, supported by clear standards for the identification, evaluation and treatment of risk.
• Operating requirements – include the procedural guidance for the effective execution of our risk policies, organisational responsibilities, design and use of our risk management systems and reporting and escalation of risk.
Stressed markets –first and second line working togetherGlobal events and deteriorating economic conditions in the eurozone and Latin America have led to ICAP executing additional due diligence in respect of stressed market conditions during 2014/15. Argentina experienced its second sovereign default within the past 20 years; both Brazil and Venezuela were downgraded by nationally recognised statistical rating organisations, while in Europe the decoupling of the Swiss franc from the euro led to significant market volatilities, and the threat of a Greek exit from the European single currency had financial institutions refreshing their contingency plans.
Under these stressed market conditions, for all of the above countries and factoring in potential contagion consequences, ICAP’s risk management team has worked in step with business heads globally to target ICAP’s risks, providing additional evaluation of the exposure by leveraging market intelligence in the liquidity and volatilities in underlying instruments, and support mitigation strategies by the provision of accurate business intelligence. Working together, both first and second lines of defence helped maintain a stable environment during these uncertain conditions.
ICAP plc Annual Report 2015 25
Strategic reportG
overnance and directors’ reportFinancial statem
entsD
efinitions

Respect for control
Our current and future targets
How we operate
Our strategies and goals
Our values
Risk appetites
Risk management framework
Governance
Risks we face (external)
Risks we face (internal) Risks we take
Operating requirements: roles and responsibilities, supervision, procedures, systems and controls
ICAP’s risk management framework
Policies and methodologies
Second line of defence
First line of defence
Policy standards, guidance and training
Third line of defence
Three lines of defenceThe Group’s governance structure is designed such that the business is the first line of defence, the risk management and compliance departments the second line of defence with internal audit representing the third line of defence.
First line of defence: the business is responsible for the identification, control and management of its own risks.
Second line of defence: the risk management and compliance departments ensure that well designed risk and compliance frameworks are in place for the first line to facilitate its risk management responsibilities and provide independent oversight and challenge of the execution and risk profile of the business.
Third line of defence: internal audit provides independent testing and verification of business line compliance as well as assurance that the risk management process is functioning as designed.
A key aspect of the three lines of defence model is that senior management, in particular those with the responsibility for front office, support functions and Group functions, have full accountability for the management of the risks in their specific businesses. This is done within the limits and the control environment established by the Group. All staff and managers are required to take a prudent approach to risk taking and to review regularly the effectiveness of their control environment and compliance with the Group’s risk appetite. The Group’s risk management processes must be dynamic, reflecting changes in the Group’s strategies and the external risk drivers in the global market in which it operates.
The following areas have been of particular focus for the Group and continue to be so:
• active ‘market’ threat management, including both discrete and macro-wide analysis to support the business, for example Greek/euro, Argentinian defaults, Ukraine/Russia sanctions;
• supporting the evaluation and application of the new regulatory requirements on the Group’s business and operating strategies;
• embedding the Group’s culture and conduct agenda through development of a compliance framework and testing;
• continuing to enhance stress testing capabilities across all risk disciplines, particularly focusing on Group-wide risks and strengthening the Internal Capital Adequacy Assessment Process,
• strengthening the risk function with subject matter expertise supporting the Group’s three divisions to enhance understanding of divisional risk profiles;
• enhancing the measurement of Group risks by development of an enterprise risk framework, including refining risk appetite statements and measures across and into the businesses;
• operational risk framework enhancements to improve analysis of risks and provide enhanced business intelligence for tactical and strategic decision making.
Strategic report Risk management continued
ICAP plc Annual Report 201526

The following table summarises those risks of principal importance to ICAP over the financial period, their key drivers, Group appetite and key mitigating actions.
Principal Group risks Importance to ICAP Key drivers Mitigation
Strategic risk
The risk arising from inappropriate strategic decisions that fail to reflect the full business operating environments, and full impacts on execution, or fail to adequately or timely identify changes to the business model.
To ensure ICAP remains competitive in its chosen strategic markets, identifying and optimising commercial opportunities requires ICAP to assess the risks, rewards and costs associated with each.
Strategic risks generally manifest over a medium timeframe allowing corrective proactive management.
AppetiteICAP will innovate and grow through considered initiatives and acquisitions that are scalable, experience positive switching/network effects or show a competitive advantage.
Regulatory landscape impacting our business or our customers’ businesses.
Commercial/market conditions.
Internal business/operating model.
Business case and risk assessment of significant business initiatives.
Defined product, country, client strategies.
Surveillance of market, regulatory landscape and customer demand.
Risk scenario contingency planning.
Operational risk
The risk of loss resulting from inadequate or failed internal processes, people and systems, or from external events.
ICAP’s reputation is built on strong execution of service. ICAP actively identifies, monitors and controls the risk that its people, process or systems fails leading to a reduction in the quality of service to our customers and an increase in our operating costs.
Operational risks could manifest themselves across any timeframe.
AppetiteICAP will take measures to identify and proportionally manage operational risk to a desired level through mitigating systems, processes and controls, but recognises operational risk is inherent in its business activities.
Internal business/ operating model.
External threats.
Market conditions.
ICAP maintains an operational risk framework, with independent risk function oversight.
Timely escalation and mitigation of risk events.
Provision of training and guidance.
Information security breach monitoring.
Critical technology performance monitoring.
Risk scenario contingency planning.
Liquidity risk
The risk that the Group or any of its entities does not have sufficient liquid resources or is unable to deploy such resources to meet its actual or potential obligations in a timely manner as they fall due.
ICAP has short-term liquidity requirements arising from settlement and clearing arrangements, in the form of collateral and margin requirements for clearing houses or financial institutions providing clearing access. It is possible large liquidity demands can arise on the same or next day, due to reasons beyond ICAP’s direct control. The Group ensures adequate liquidity resources are maintained to meet these requirements in support of its trading activities.
Longer-term requirements arise in relation to the timing of the Group’s operating cash inflows against outflows, principally for capital expenditure and dividends. The Group maintains a diversified funding base with sufficient committed headroom to forecast requirements.
AppetiteICAP will have sufficient and accessible financial resources so as to meet financial obligations as they fall due.
Operational risk.
Credit risk (events).
Internal business/ operating model.
Periodic reviews including going concern assessments.
Use of financial institutions for clearing access.
$250 million of committed liquidity held centrally for same and next day utilisation.
Contingency funding arrangements and procedures in place.
ICAP plc Annual Report 2015 27
Strategic reportG
overnance and directors’ reportFinancial statem
entsD
efinitions

Principal Group risks Importance to ICAP Key drivers Mitigation
Reputational risk
The risk that the Group fails to meet expectations of stakeholders, is unable to build or sustain relationships with customers, incurs regulatory censure or experiences more costly access to funding sources.
ICAP remains focused on maintaining and constantly strengthening relationships with shareholders, customers, regulators, lenders, clearing and settlement providers, market infrastructure providers and employees.
Reputation risk can manifest over the near term with long-term impacts.
AppetiteICAP will adhere to its core values and fulfil its corporate responsibilities by ensuring it acts responsibly, ethically and with integrity.
Operational risk.
Regulatory risk – conduct risk.
Strategic risk.
Active assessment via investor relationship surveys, media surveys, employee statistics.
Culture and conduct training and monitoring.
Credit risk
The risk of a financial loss due to the failure of a customer to meet its obligation to settle outstanding amounts.
While ICAP enters into transactions only when executing on behalf of customers, providing customer access to clearing or provides additional fee-based services, there does exist short-term credit exposure prior to clearing and settlements, and outstanding receivables risk that ICAP manages.
AppetiteICAP will engage only in activities which it believes will not result in loss due to credit risk.
Market conditions.
Counterparty credit worthiness.
Counterparty due diligence.
Credit limits.
Risk scenario and stress contingency planning.
Legal and compliance risk
Legal risk arises from defective transactions, failing to take appropriate measures to protect assets, changes in law and/or breach of law or acceptable practice and claims resulting in a liability or loss to a company/ies within the Group.
Compliance risk is the risk of material loss, regulatory sanctions or reputational damage arising from the failure to comply with relevant regulatory requirements.
ICAP operates in multiple jurisdictions and remains focused on ensuring they recognise and respect the rules and laws to which they are held. ICAP also recognises that the conduct of the Group and its employees is of paramount importance to its strategic aims and reputation.
Legal and compliance risk can manifest over the near and long term.
AppetiteICAP will ensure it has in place the necessary processes, controls and frameworks in order to comply with legal and regulatory requirements; ICAP will use appropriate external legal advisors for contentious matters and litigation. For the avoidance of doubt, ICAP has no appetite for legal or regulatory breaches.
Multiple and dynamic regulatory regimes.
Regulatory risks – conduct risk.
ICAP has internal legal and compliance departments which act as independent advisory and investigation functions to enable and defend the Group’s strategic aims. Both legal policies and compliance risk management frameworks strengthen this defence.
Advice is regularly taken from appropriately qualified external advisors and professionals.
Training is provided to staff on an ongoing basis.
Culture and conduct training and monitoring.
Strategic report Risk management continued
ICAP plc Annual Report 201528

In addition to the principal risks the Group also recognises and actively manages the following Group risks:
Other Group risks Importance to ICAP Key drivers Mitigation
Cross-risk
The risk that the Group and its divisions fails to maintain its commercial targets due to either internal or external factors.
In support of achieving its commercial targets, ICAP works diligently with all stakeholders to identify all threats and opportunities.
AppetiteICAP will monitor its internal and external environment in order to maintain stable and robust financial performance over the long term.
ICAP’s credit worthiness.
Market competition.
Predictability of earnings – discipline is applied to existing performance and new business proposals.
Maintenance of ICAP’s external credit rating.
Financial risk
The risk that the Group is exposed to significant losses due to adverse movements in interest and exchange rates.
Interest rate risk from the Group’s exposure to rate fluctuations on cash balances and borrowings.
Currency translation risk arising from the conversion of foreign currency needed to pound sterling for the preparation of ICAP plc’s consolidated financial statements.
Currency risk for the Group’s entities arising from transactions, assets or liabilities denominated in a foreign currency for an individual entity.
AppetiteICAP will manage its financial risks in accordance with approved policies for the Group.
Market rates.
Trading volume.
Geographic profile.
Regulatory and working capital requirements.
Details of the Group’s management of interest rate and currency risks are contained in notes 9 and 28 to the financial statements.
Established Group policies for the management of interest rate and currency exposures.
Long-term debt raised with fixed rates with the option to swap to variable rates.
Quarterly review of currency exposures and hedging levels.
Market risk
Risk of losses in on and off-balance sheet positions arising from adverse movements in market prices.
ICAP does not actively take market risk. Where it does arise this is due to failures in our expected business processes, systems or human error. As such it is identified and treated as operational risk.
AppetiteICAP will not engage in proprietary trading or actively seek market exposure and will actively reduce any incidental market exposure resulting from its activities as soon as reasonably practicable.
Volume and complexity of trade booking.
Market movements/liquidity.
Monitoring and timely mitigation of unmatched positions.
Exposure modelling.
ICAP plc Annual Report 2015 29
Strategic reportG
overnance and directors’ reportFinancial statem
entsD
efinitions

While facing the same inherent risks to which the Group as a whole is exposed, the business models, markets and risk profiles of the divisions are unique. ICAP’s risk management and governance frameworks are designed to support the top down assessment of risk for the Group, as well as supporting relevant business decision making and risk management of the revenue generating entities.
Each division is responsible for the management of its risks. The risk and compliance functions provide independent oversight and subject matter challenge to the first line in support of its risk management responsibilities.
The key risks faced by each division in the 2014/15 financial year are set out below:
Division risk drivers Key changes Risks
Electronic Markets
• Relationships – customers, employees.
• Infrastructure (including for clearing and settlement, IT).
• Regulatory licences.
• Short-term credit exposure to customers prior to clearing.
• Liquidity to settle trades and meet margin calls.
• New products/hybrid/exchanges.
• Stressed market conditions.
• Regulatory landscape.
• Protect and grow market share.
Strategic/reputation risk – failure to deliver existing or new products, competition.
Operational risk – failure in its provision of technology service to clients.
Credit/liquidity risk – material intra-day liquidity demands for settlement/margin.
Regulatory risk – maintaining and receiving licence to operate in chosen jurisdictions.
Post Trade Risk and Information
• Relationships – customers, employees.
• Infrastructure (including IT).
• Regulatory licences.
• Volume and customer growth.
• New product development.
• Regulatory landscape – MiFID II.
Regulatory risk – upstream requirements e.g. MiFID II.
Reputation risk.
Operational risk – failure to manage market and client data integrity and run processes completely, accurately and in a timely fashion.
Global Broking
• Relationships – customers, employees.
• Infrastructure (including for clearing and settlement, IT).
• Regulatory licences.
• Short-term credit exposure to customers in the settlement cycle (typically <T+3 days).
• Liquidity to settle trades and meet margin calls.
• Market data infrastructure.
• Stressed market conditions.
• Focus on leading franchises.
• Cost management.
• Internal consolidation.
Regulatory risk – upstream requirements e.g. MiFID II, conduct risk.
Strategic risk – market consolidation, reducing margin.
Credit risk – stressed market conditions.
Strategic report Risk management continued
ICAP plc Annual Report 201530
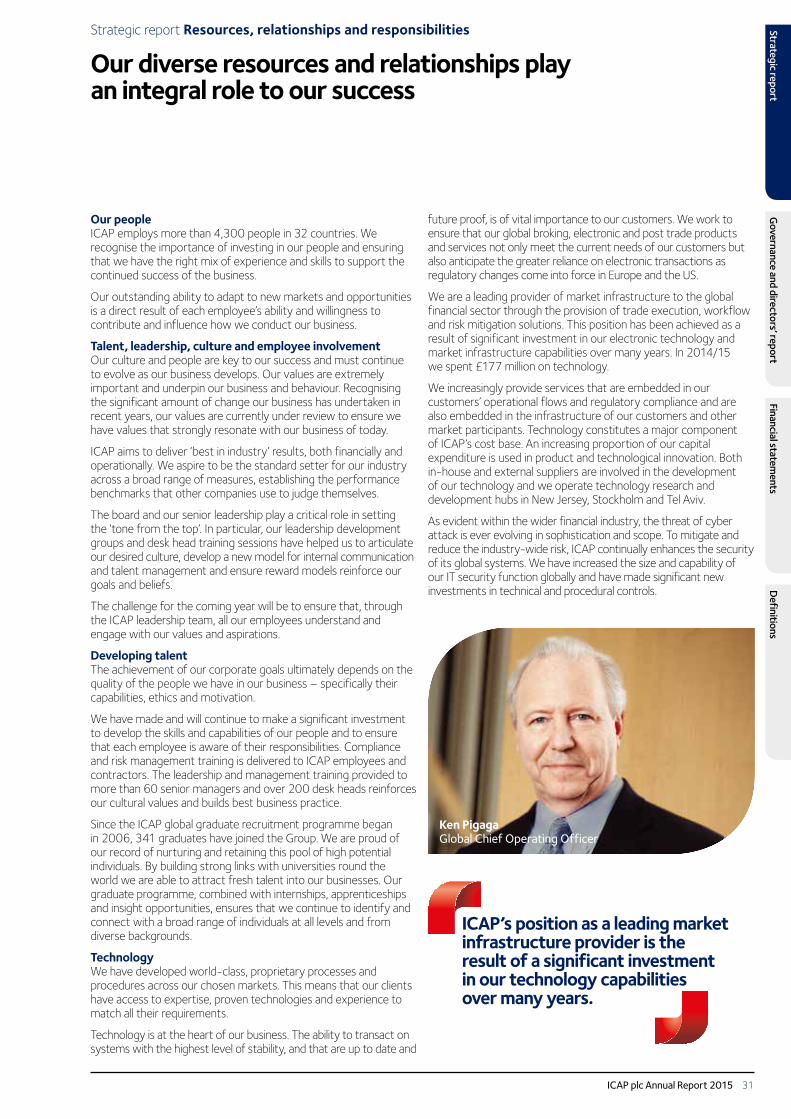
Strategic report Resources, relationships and responsibilities
Our diverse resources and relationships play an integral role to our success
Our peopleICAP employs more than 4,300 people in 32 countries. We recognise the importance of investing in our people and ensuring that we have the right mix of experience and skills to support the continued success of the business.
Our outstanding ability to adapt to new markets and opportunities is a direct result of each employee’s ability and willingness to contribute and influence how we conduct our business.
Talent, leadership, culture and employee involvementOur culture and people are key to our success and must continue to evolve as our business develops. Our values are extremely important and underpin our business and behaviour. Recognising the significant amount of change our business has undertaken in recent years, our values are currently under review to ensure we have values that strongly resonate with our business of today.
ICAP aims to deliver ‘best in industry’ results, both financially and operationally. We aspire to be the standard setter for our industry across a broad range of measures, establishing the performance benchmarks that other companies use to judge themselves.
The board and our senior leadership play a critical role in setting the ‘tone from the top’. In particular, our leadership development groups and desk head training sessions have helped us to articulate our desired culture, develop a new model for internal communication and talent management and ensure reward models reinforce our goals and beliefs.
The challenge for the coming year will be to ensure that, through the ICAP leadership team, all our employees understand and engage with our values and aspirations.
Developing talentThe achievement of our corporate goals ultimately depends on the quality of the people we have in our business – specifically their capabilities, ethics and motivation.
We have made and will continue to make a significant investment to develop the skills and capabilities of our people and to ensure that each employee is aware of their responsibilities. Compliance and risk management training is delivered to ICAP employees and contractors. The leadership and management training provided to more than 60 senior managers and over 200 desk heads reinforces our cultural values and builds best business practice.
Since the ICAP global graduate recruitment programme began in 2006, 341 graduates have joined the Group. We are proud of our record of nurturing and retaining this pool of high potential individuals. By building strong links with universities round the world we are able to attract fresh talent into our businesses. Our graduate programme, combined with internships, apprenticeships and insight opportunities, ensures that we continue to identify and connect with a broad range of individuals at all levels and from diverse backgrounds.
TechnologyWe have developed world-class, proprietary processes and procedures across our chosen markets. This means that our clients have access to expertise, proven technologies and experience to match all their requirements.
Technology is at the heart of our business. The ability to transact on systems with the highest level of stability, and that are up to date and
future proof, is of vital importance to our customers. We work to ensure that our global broking, electronic and post trade products and services not only meet the current needs of our customers but also anticipate the greater reliance on electronic transactions as regulatory changes come into force in Europe and the US.
We are a leading provider of market infrastructure to the global financial sector through the provision of trade execution, workflow and risk mitigation solutions. This position has been achieved as a result of significant investment in our electronic technology and market infrastructure capabilities over many years. In 2014/15 we spent £177 million on technology.
We increasingly provide services that are embedded in our customers’ operational flows and regulatory compliance and are also embedded in the infrastructure of our customers and other market participants. Technology constitutes a major component of ICAP’s cost base. An increasing proportion of our capital expenditure is used in product and technological innovation. Both in-house and external suppliers are involved in the development of our technology and we operate technology research and development hubs in New Jersey, Stockholm and Tel Aviv.
As evident within the wider financial industry, the threat of cyber attack is ever evolving in sophistication and scope. To mitigate and reduce the industry-wide risk, ICAP continually enhances the security of its global systems. We have increased the size and capability of our IT security function globally and have made significant new investments in technical and procedural controls.
ICAP’s position as a leading market infrastructure provider is the result of a significant investment in our technology capabilities over many years.
Ken PigagaGlobal Chief Operating Officer
ICAP plc Annual Report 2015 31
Strategic reportG
overnance and directors’ reportFinancial statem
entsD
efinitions
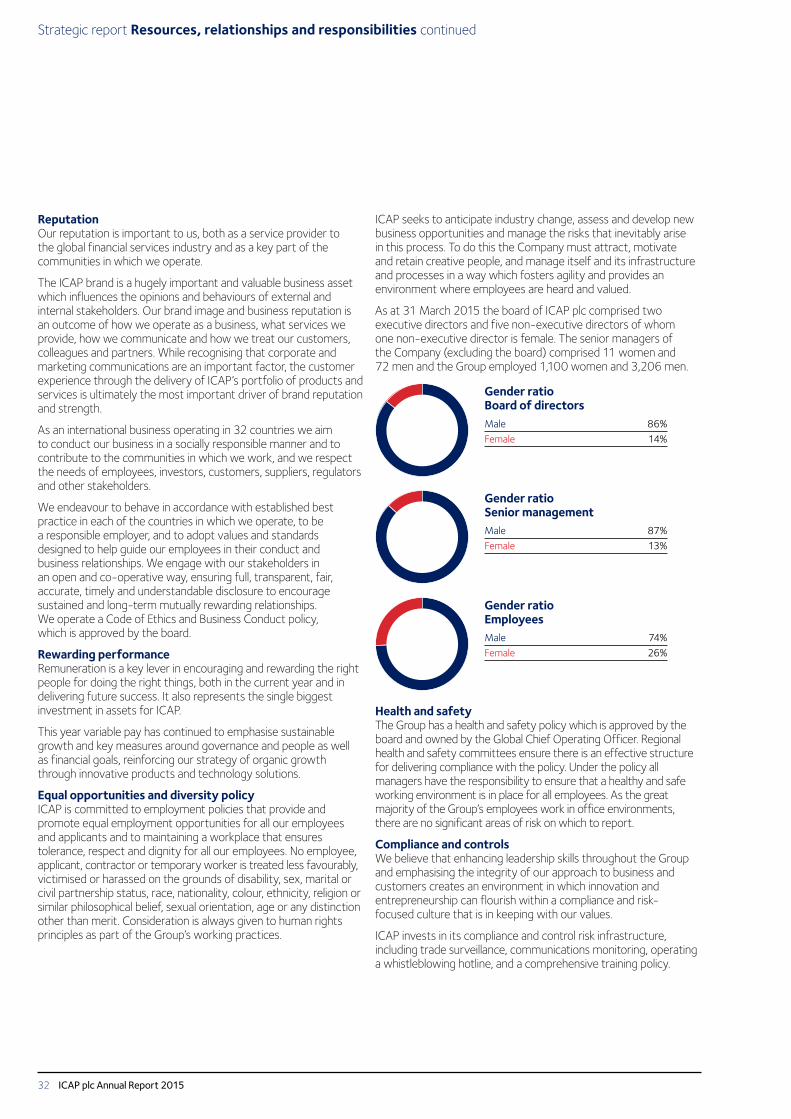
ReputationOur reputation is important to us, both as a service provider to the global financial services industry and as a key part of the communities in which we operate.
The ICAP brand is a hugely important and valuable business asset which influences the opinions and behaviours of external and internal stakeholders. Our brand image and business reputation is an outcome of how we operate as a business, what services we provide, how we communicate and how we treat our customers, colleagues and partners. While recognising that corporate and marketing communications are an important factor, the customer experience through the delivery of ICAP’s portfolio of products and services is ultimately the most important driver of brand reputation and strength.
As an international business operating in 32 countries we aim to conduct our business in a socially responsible manner and to contribute to the communities in which we work, and we respect the needs of employees, investors, customers, suppliers, regulators and other stakeholders.
We endeavour to behave in accordance with established best practice in each of the countries in which we operate, to be a responsible employer, and to adopt values and standards designed to help guide our employees in their conduct and business relationships. We engage with our stakeholders in an open and co-operative way, ensuring full, transparent, fair, accurate, timely and understandable disclosure to encourage sustained and long-term mutually rewarding relationships. We operate a Code of Ethics and Business Conduct policy, which is approved by the board.
Rewarding performanceRemuneration is a key lever in encouraging and rewarding the right people for doing the right things, both in the current year and in delivering future success. It also represents the single biggest investment in assets for ICAP.
This year variable pay has continued to emphasise sustainable growth and key measures around governance and people as well as financial goals, reinforcing our strategy of organic growth through innovative products and technology solutions.
Equal opportunities and diversity policyICAP is committed to employment policies that provide and promote equal employment opportunities for all our employees and applicants and to maintaining a workplace that ensures tolerance, respect and dignity for all our employees. No employee, applicant, contractor or temporary worker is treated less favourably, victimised or harassed on the grounds of disability, sex, marital or civil partnership status, race, nationality, colour, ethnicity, religion or similar philosophical belief, sexual orientation, age or any distinction other than merit. Consideration is always given to human rights principles as part of the Group’s working practices.
ICAP seeks to anticipate industry change, assess and develop new business opportunities and manage the risks that inevitably arise in this process. To do this the Company must attract, motivate and retain creative people, and manage itself and its infrastructure and processes in a way which fosters agility and provides an environment where employees are heard and valued.
As at 31 March 2015 the board of ICAP plc comprised two executive directors and five non-executive directors of whom one non-executive director is female. The senior managers of the Company (excluding the board) comprised 11 women and 72 men and the Group employed 1,100 women and 3,206 men.
Gender ratio Board of directorsMale 86%Female 14%
Gender ratio Senior managementMale 87%Female 13%
Gender ratio EmployeesMale 74%Female 26%
Health and safetyThe Group has a health and safety policy which is approved by the board and owned by the Global Chief Operating Officer. Regional health and safety committees ensure there is an effective structure for delivering compliance with the policy. Under the policy all managers have the responsibility to ensure that a healthy and safe working environment is in place for all employees. As the great majority of the Group’s employees work in office environments, there are no significant areas of risk on which to report.
Compliance and controlsWe believe that enhancing leadership skills throughout the Group and emphasising the integrity of our approach to business and customers creates an environment in which innovation and entrepreneurship can flourish within a compliance and risk-focused culture that is in keeping with our values.
ICAP invests in its compliance and control risk infrastructure, including trade surveillance, communications monitoring, operating a whistleblowing hotline, and a comprehensive training policy.
Strategic report Resources, relationships and responsibilities continued
ICAP plc Annual Report 201532
ICAP is committed to employment policies that provide and promote equal employment opportunities for all our employees and applicants and to maintaining a workplace that ensures tolerance, respect and dignity for all our employees.
Vanessa CruwysGroup Head of HR
As a key part of the global financial infrastructure, ICAP respects both the spirit and the letter of the control, compliance and assurance environment within which the Group operates worldwide.
IntegrityICAP endeavours to build and maintain a relationship of openness and trust with our customers, partners, investors and regulators. To do this the Company and our employees are expected to behave consistently and within standards of ethical and professional conduct at all times.
ICAP plc Annual Report 2015 33
Strategic reportG
overnance and directors’ reportFinancial statem
entsD
efinitions
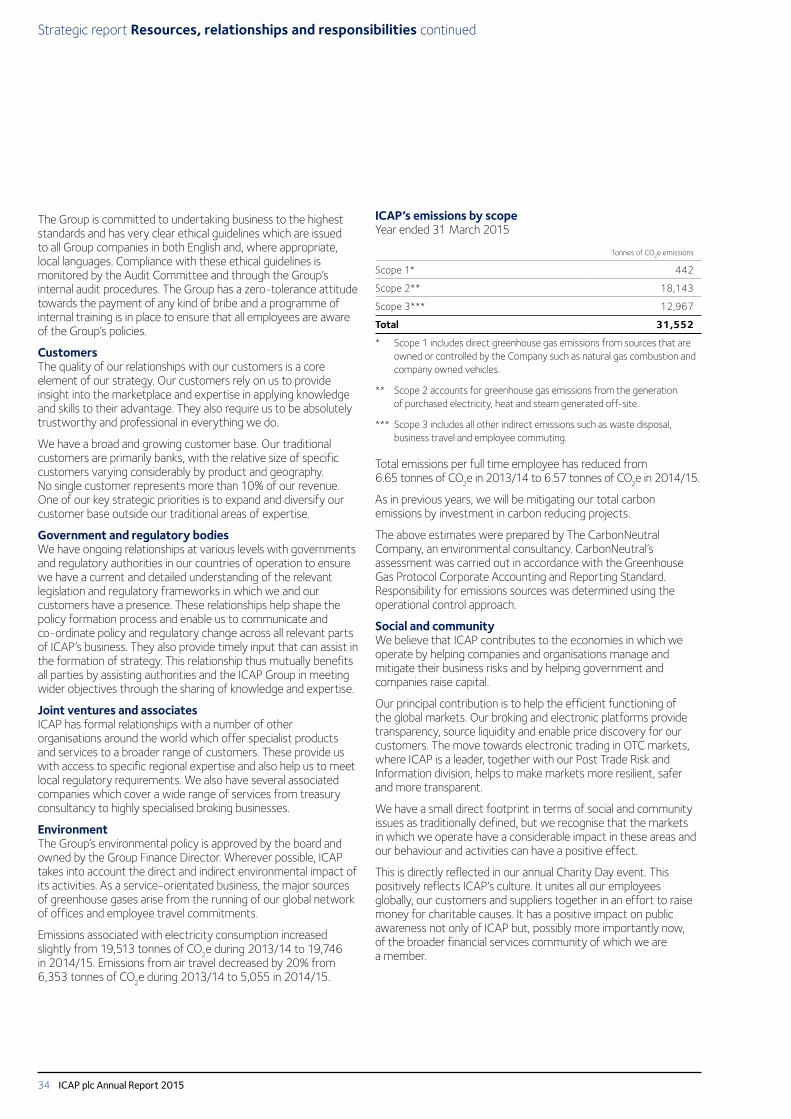
The Group is committed to undertaking business to the highest standards and has very clear ethical guidelines which are issued to all Group companies in both English and, where appropriate, local languages. Compliance with these ethical guidelines is monitored by the Audit Committee and through the Group’s internal audit procedures. The Group has a zero-tolerance attitude towards the payment of any kind of bribe and a programme of internal training is in place to ensure that all employees are aware of the Group’s policies.
CustomersThe quality of our relationships with our customers is a core element of our strategy. Our customers rely on us to provide insight into the marketplace and expertise in applying knowledge and skills to their advantage. They also require us to be absolutely trustworthy and professional in everything we do.
We have a broad and growing customer base. Our traditional customers are primarily banks, with the relative size of specific customers varying considerably by product and geography. No single customer represents more than 10% of our revenue. One of our key strategic priorities is to expand and diversify our customer base outside our traditional areas of expertise.
Government and regulatory bodiesWe have ongoing relationships at various levels with governments and regulatory authorities in our countries of operation to ensure we have a current and detailed understanding of the relevant legislation and regulatory frameworks in which we and our customers have a presence. These relationships help shape the policy formation process and enable us to communicate and co-ordinate policy and regulatory change across all relevant parts of ICAP’s business. They also provide timely input that can assist in the formation of strategy. This relationship thus mutually benefits all parties by assisting authorities and the ICAP Group in meeting wider objectives through the sharing of knowledge and expertise.
Joint ventures and associatesICAP has formal relationships with a number of other organisations around the world which offer specialist products and services to a broader range of customers. These provide us with access to specific regional expertise and also help us to meet local regulatory requirements. We also have several associated companies which cover a wide range of services from treasury consultancy to highly specialised broking businesses.
EnvironmentThe Group’s environmental policy is approved by the board and owned by the Group Finance Director. Wherever possible, ICAP takes into account the direct and indirect environmental impact of its activities. As a service-orientated business, the major sources of greenhouse gases arise from the running of our global network of offices and employee travel commitments.
Emissions associated with electricity consumption increased slightly from 19,513 tonnes of CO
2e during 2013/14 to 19,746 in 2014/15. Emissions from air travel decreased by 20% from 6,353 tonnes of CO2e during 2013/14 to 5,055 in 2014/15.
ICAP’s emissions by scopeYear ended 31 March 2015
Tonnes of CO2e emissions
Scope 1* 442
Scope 2** 18,143
Scope 3*** 12,967
Total 31,552
* Scope 1 includes direct greenhouse gas emissions from sources that are owned or controlled by the Company such as natural gas combustion and company owned vehicles.
** Scope 2 accounts for greenhouse gas emissions from the generation of purchased electricity, heat and steam generated off-site.
*** Scope 3 includes all other indirect emissions such as waste disposal, business travel and employee commuting.
Total emissions per full time employee has reduced from 6.65 tonnes of CO2e in 2013/14 to 6.57 tonnes of CO2e in 2014/15.
As in previous years, we will be mitigating our total carbon emissions by investment in carbon reducing projects.
The above estimates were prepared by The CarbonNeutral Company, an environmental consultancy. CarbonNeutral’s assessment was carried out in accordance with the Greenhouse Gas Protocol Corporate Accounting and Reporting Standard. Responsibility for emissions sources was determined using the operational control approach.
Social and communityWe believe that ICAP contributes to the economies in which we operate by helping companies and organisations manage and mitigate their business risks and by helping government and companies raise capital.
Our principal contribution is to help the efficient functioning of the global markets. Our broking and electronic platforms provide transparency, source liquidity and enable price discovery for our customers. The move towards electronic trading in OTC markets, where ICAP is a leader, together with our Post Trade Risk and Information division, helps to make markets more resilient, safer and more transparent.
We have a small direct footprint in terms of social and community issues as traditionally defined, but we recognise that the markets in which we operate have a considerable impact in these areas and our behaviour and activities can have a positive effect.
This is directly reflected in our annual Charity Day event. This positively reflects ICAP’s culture. It unites all our employees globally, our customers and suppliers together in an effort to raise money for charitable causes. It has a positive impact on public awareness not only of ICAP but, possibly more importantly now, of the broader financial services community of which we are a member.
Strategic report Resources, relationships and responsibilities continued
ICAP plc Annual Report 201534
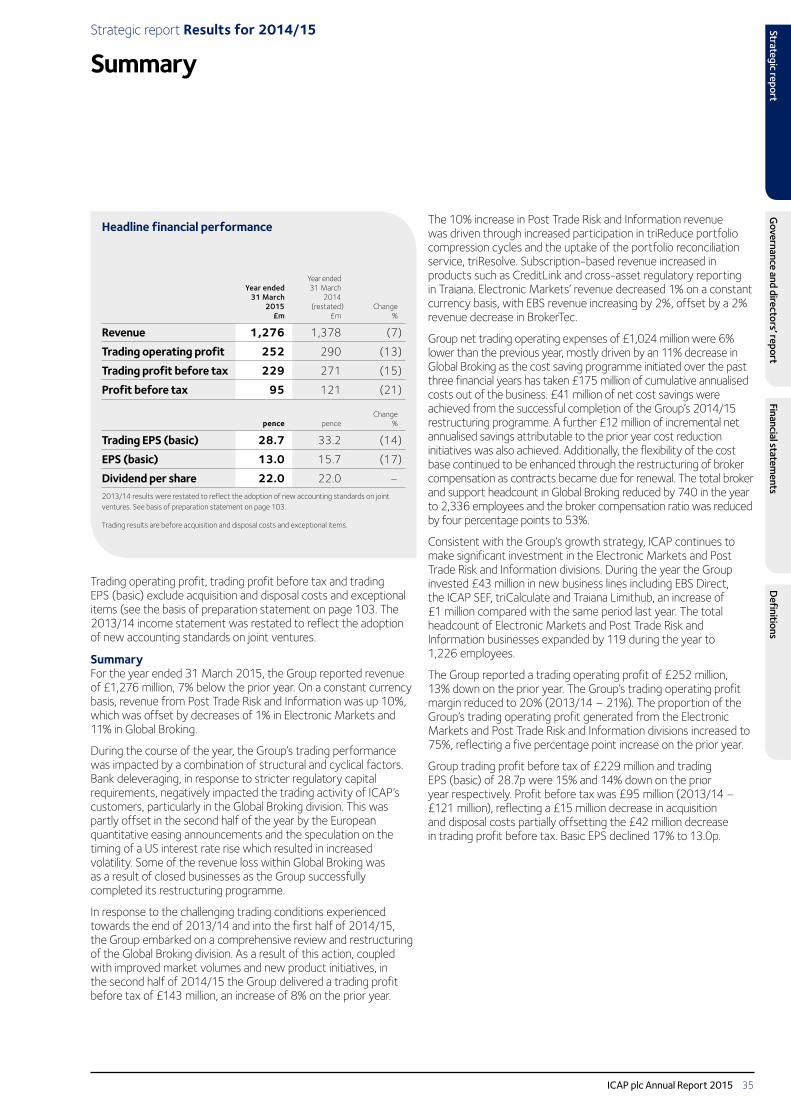
Strategic report Results for 2014/15
Summary
Trading operating profit, trading profit before tax and trading EPS (basic) exclude acquisition and disposal costs and exceptional items (see the basis of preparation statement on page 103. The 2013/14 income statement was restated to reflect the adoption of new accounting standards on joint ventures.
SummaryFor the year ended 31 March 2015, the Group reported revenue of £1,276 million, 7% below the prior year. On a constant currency basis, revenue from Post Trade Risk and Information was up 10%, which was offset by decreases of 1% in Electronic Markets and 11% in Global Broking.
During the course of the year, the Group’s trading performance was impacted by a combination of structural and cyclical factors. Bank deleveraging, in response to stricter regulatory capital requirements, negatively impacted the trading activity of ICAP’s customers, particularly in the Global Broking division. This was partly offset in the second half of the year by the European quantitative easing announcements and the speculation on the timing of a US interest rate rise which resulted in increased volatility. Some of the revenue loss within Global Broking was as a result of closed businesses as the Group successfully completed its restructuring programme.
In response to the challenging trading conditions experienced towards the end of 2013/14 and into the first half of 2014/15, the Group embarked on a comprehensive review and restructuring of the Global Broking division. As a result of this action, coupled with improved market volumes and new product initiatives, in the second half of 2014/15 the Group delivered a trading profit before tax of £143 million, an increase of 8% on the prior year.
Headline financial performance
Year ended 31 March
2015 £m
Year ended 31 March
2014(restated)
£mChange
%
Revenue 1,276 1,378 (7)
Trading operating profit 252 290 (13)
Trading profit before tax 229 271 (15)
Profit before tax 95 121 (21)
pence pence Change
%
Trading EPS (basic) 28.7 33.2 (14)
EPS (basic) 13.0 15.7 (17)
Dividend per share 22.0 22.0 –2013/14 results were restated to reflect the adoption of new accounting standards on joint ventures. See basis of preparation statement on page 103.
Trading results are before acquisition and disposal costs and exceptional items.
The 10% increase in Post Trade Risk and Information revenue was driven through increased participation in triReduce portfolio compression cycles and the uptake of the portfolio reconciliation service, triResolve. Subscription-based revenue increased in products such as CreditLink and cross-asset regulatory reporting in Traiana. Electronic Markets’ revenue decreased 1% on a constant currency basis, with EBS revenue increasing by 2%, offset by a 2% revenue decrease in BrokerTec.
Group net trading operating expenses of £1,024 million were 6% lower than the previous year, mostly driven by an 11% decrease in Global Broking as the cost saving programme initiated over the past three financial years has taken £175 million of cumulative annualised costs out of the business. £41 million of net cost savings were achieved from the successful completion of the Group’s 2014/15 restructuring programme. A further £12 million of incremental net annualised savings attributable to the prior year cost reduction initiatives was also achieved. Additionally, the flexibility of the cost base continued to be enhanced through the restructuring of broker compensation as contracts became due for renewal. The total broker and support headcount in Global Broking reduced by 740 in the year to 2,336 employees and the broker compensation ratio was reduced by four percentage points to 53%.
Consistent with the Group’s growth strategy, ICAP continues to make significant investment in the Electronic Markets and Post Trade Risk and Information divisions. During the year the Group invested £43 million in new business lines including EBS Direct, the ICAP SEF, triCalculate and Traiana Limithub, an increase of £1 million compared with the same period last year. The total headcount of Electronic Markets and Post Trade Risk and Information businesses expanded by 119 during the year to 1,226 employees.
The Group reported a trading operating profit of £252 million, 13% down on the prior year. The Group’s trading operating profit margin reduced to 20% (2013/14 – 21%). The proportion of the Group’s trading operating profit generated from the Electronic Markets and Post Trade Risk and Information divisions increased to 75%, reflecting a five percentage point increase on the prior year.
Group trading profit before tax of £229 million and trading EPS (basic) of 28.7p were 15% and 14% down on the prior year respectively. Profit before tax was £95 million (2013/14 – £121 million), reflecting a £15 million decrease in acquisition and disposal costs partially offsetting the £42 million decrease in trading profit before tax. Basic EPS declined 17% to 13.0p.
ICAP plc Annual Report 2015 35
Strategic reportG
overnance and directors’ reportFinancial statem
entsD
efinitions
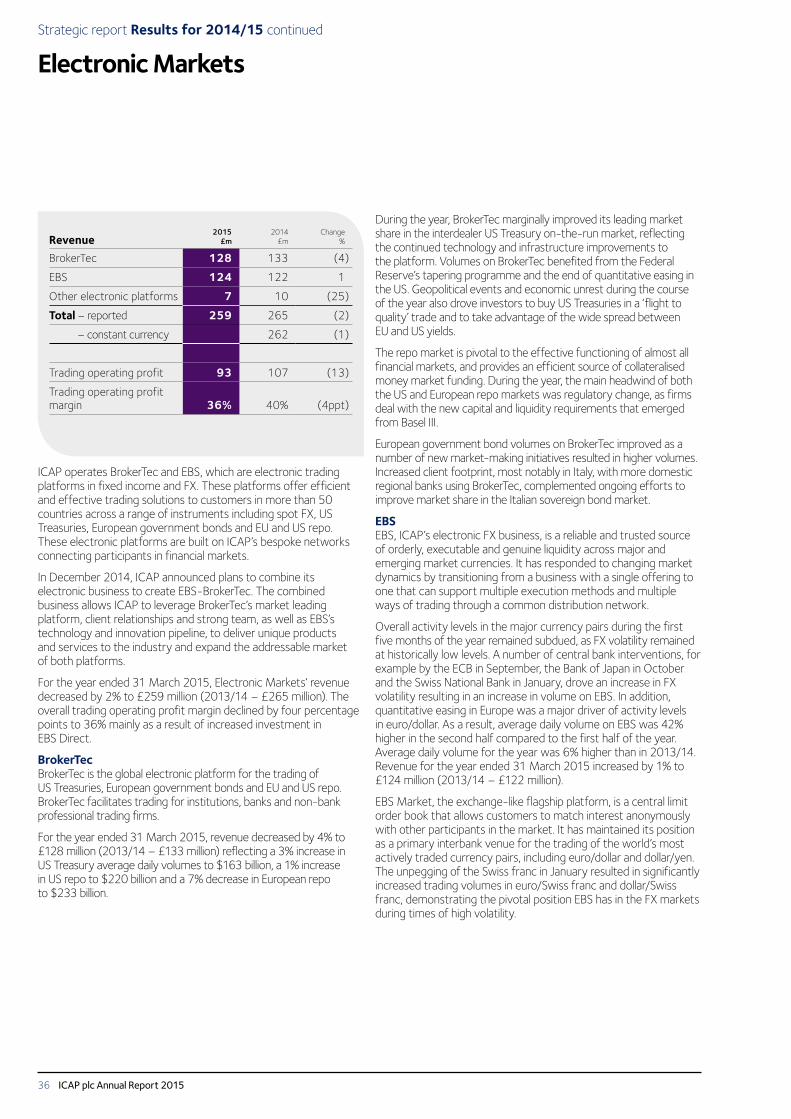
Strategic report Results for 2014/15 continued
Electronic Markets
During the year, BrokerTec marginally improved its leading market share in the interdealer US Treasury on-the-run market, reflecting the continued technology and infrastructure improvements to the platform. Volumes on BrokerTec benefited from the Federal Reserve’s tapering programme and the end of quantitative easing in the US. Geopolitical events and economic unrest during the course of the year also drove investors to buy US Treasuries in a ‘flight to quality’ trade and to take advantage of the wide spread between EU and US yields.
The repo market is pivotal to the effective functioning of almost all financial markets, and provides an efficient source of collateralised money market funding. During the year, the main headwind of both the US and European repo markets was regulatory change, as firms deal with the new capital and liquidity requirements that emerged from Basel III.
European government bond volumes on BrokerTec improved as a number of new market-making initiatives resulted in higher volumes. Increased client footprint, most notably in Italy, with more domestic regional banks using BrokerTec, complemented ongoing efforts to improve market share in the Italian sovereign bond market.
EBSEBS, ICAP’s electronic FX business, is a reliable and trusted source of orderly, executable and genuine liquidity across major and emerging market currencies. It has responded to changing market dynamics by transitioning from a business with a single offering to one that can support multiple execution methods and multiple ways of trading through a common distribution network.
Overall activity levels in the major currency pairs during the first five months of the year remained subdued, as FX volatility remained at historically low levels. A number of central bank interventions, for example by the ECB in September, the Bank of Japan in October and the Swiss National Bank in January, drove an increase in FX volatility resulting in an increase in volume on EBS. In addition, quantitative easing in Europe was a major driver of activity levels in euro/dollar. As a result, average daily volume on EBS was 42% higher in the second half compared to the first half of the year. Average daily volume for the year was 6% higher than in 2013/14. Revenue for the year ended 31 March 2015 increased by 1% to £124 million (2013/14 – £122 million).
EBS Market, the exchange-like flagship platform, is a central limit order book that allows customers to match interest anonymously with other participants in the market. It has maintained its position as a primary interbank venue for the trading of the world’s most actively traded currency pairs, including euro/dollar and dollar/yen. The unpegging of the Swiss franc in January resulted in significantly increased trading volumes in euro/Swiss franc and dollar/Swiss franc, demonstrating the pivotal position EBS has in the FX markets during times of high volatility.
ICAP operates BrokerTec and EBS, which are electronic trading platforms in fixed income and FX. These platforms offer efficient and effective trading solutions to customers in more than 50 countries across a range of instruments including spot FX, US Treasuries, European government bonds and EU and US repo. These electronic platforms are built on ICAP’s bespoke networks connecting participants in financial markets.
In December 2014, ICAP announced plans to combine its electronic business to create EBS-BrokerTec. The combined business allows ICAP to leverage BrokerTec’s market leading platform, client relationships and strong team, as well as EBS’s technology and innovation pipeline, to deliver unique products and services to the industry and expand the addressable market of both platforms.
For the year ended 31 March 2015, Electronic Markets’ revenue decreased by 2% to £259 million (2013/14 – £265 million). The overall trading operating profit margin declined by four percentage points to 36% mainly as a result of increased investment in EBS Direct.
BrokerTecBrokerTec is the global electronic platform for the trading of US Treasuries, European government bonds and EU and US repo. BrokerTec facilitates trading for institutions, banks and non-bank professional trading firms.
For the year ended 31 March 2015, revenue decreased by 4% to £128 million (2013/14 – £133 million) reflecting a 3% increase in US Treasury average daily volumes to $163 billion, a 1% increase in US repo to $220 billion and a 7% decrease in European repo to $233 billion.
Revenue2015
£m2014
£mChange
%
BrokerTec 128 133 (4)
EBS 124 122 1
Other electronic platforms 7 10 (25)
Total – reported 259 265 (2)
– constant currency 262 (1)
Trading operating profit 93 107 (13)
Trading operating profit margin 36% 40% (4ppt)
ICAP plc Annual Report 201536
Consistent with the strategy to expand into growth markets, volume traded in emerging market currency pairs saw a significant growth of 101% on 2013/14. The dollar/offshore Chinese renminbi remains one of the most actively traded currency pairs on EBS Market, and volumes have grown by more than 400% during 2014/15. NDFs also experienced both positive growth and broader customer interest, with a 102% increase in volume on the previous year.
EBS Direct, which launched in November 2013, is a fully disclosed relationship-based platform that allows liquidity providers to stream tailored prices directly to liquidity consumers. It has continued to grow steadily following a hiatus to allow for a technology upgrade at the end of 2014. Average daily volume increased from $5 billion in April 2014 to $17 billion in March 2015. The platform now has 20 liquidity providers and over 350 liquidity consumers using the service. Interest in EBS Direct continues to grow, with an additional 200 new customers in the pipeline in addition to 20 new liquidity providers.
EBS Direct, which launched in November 2013, is a fully disclosed relationship-based platform that allows liquidity providers to stream tailored prices direct to liquidity consumers.
Jeff WardGlobal Head of EBS Direct
ICAP plc Annual Report 2015 37
Strategic reportG
overnance and directors’ reportFinancial statem
entsD
efinitions

Post Trade Risk and Information
The Post Trade Risk and Information division operates market infrastructure for post trade processing and risk management across asset classes and enables users of financial products to reduce operational, second order financial and system-wide risks. The services offered by Post Trade Risk and Information enable customers to increase the efficiency of trading, clearing and settlement and facilitate the effective management of capital and risk weighted assets and associated cost.
The portfolio risk services businesses comprise TriOptima and Reset, which identify, neutralise, remove and reconcile risk within portfolios of derivatives transactions; Traiana, which provides pre trade risk and post trade processing solutions; and the information and data sales business.
During the year, Post Trade Risk and Information invested more than £18 million in development in order to offer new products and enhance the functionality of existing services.
For the year ended 31 March 2015, revenue increased by 10% on a constant currency basis and by 8% on a reported basis to £228 million (2013/14 – £212 million) reflecting strong revenue growth in both TriOptima and Traiana. Trading operating profit increased by 1% reflecting an increase in investment in new products and a reduction in revenue from higher margin products.
Revenue2015
£m2014
£mChange
%
TriOptima 67 54 24
Traiana 53 47 11
Reset 39 41 (5)
Information Services 69 70 (1)
Total – reported 228 212 8
– constant currency 207 10
Trading operating profit 97 96 1
Trading operating profit margin 43% 45% (2ppt)
EBS Direct is expected to remain in an investment phase in 2015/16 as new functionality, services and products are added to the platform, including the launch of FX swaps and outright forwards and the integration of MyTreasury, a service for corporate customers. During the year £23 million has been invested in EBS Direct, of which £7 million has been capitalised.
In March 2015, a new global liquidity platform, EBS Select, went live with a beta launch to complement the existing multi-product offerings. EBS Select will provide customers with the option of trading in a non-disclosed environment using a multi-prime broker model. 30 liquidity consumers and six liquidity providers are participating in the beta roll-out.
EBS Hedge, a new innovative product, was designed for systematically driven risk management, allowing e-FX trading desks to match with other e-FX desks when interests cross. Having launched the beta phase in December 2014, it has experienced exceptional support from the EBS community, with seven customers currently live and another six customers connecting to the test lab environment, and a further 20 customers have expressed a strong interest to participate in the product in the coming year.
i-Swapi-Swap, ICAP’s global electronic trading platform for IRS, has continued to build on its market position and has brought increased transparency, greater efficiency and lower transaction costs to the world’s largest OTC derivative market. i-Swap is central to ICAP’s SEF strategy and is the trading platform utilised for required and permitted interest rate derivative transactions. Electronic momentum in dollar interest rate swaps is building on the i-Swap platform as banks transition liquidity from voice to electronic venues to take advantage of lower execution costs, enhanced trade opportunities and post trade efficiencies.
In Europe, while there is consistent liquidity on the platform at the two, five and ten-year points, activity levels are conditional on the levels of market volatility. Targeted streaming has been introduced recently with five liquidity providers actively providing tiered pricing to a subset of platform users. As the MiFID II requirements unfold over the coming months, this is likely to be a further catalyst to increase the transition to electronic trading.
Strategic report Results for 2014/15 continued
Electronic Marketscontinued
ICAP plc Annual Report 201538

TriOptimaTriOptima, through triReduce and triResolve, is a leader in risk mitigation solutions for OTC derivatives, primarily through the elimination and reconciliation of outstanding transactions. It continues to benefit from the strategic alignment of its offerings with the G20 policy objectives of transparency and risk reduction in the financial system.
For the year ended 31 March 2015, revenue increased by 34% on a constant currency basis and by 24% on a reported basis to £67 million (2013/14 – £54 million) driven by increased participation in triReduce portfolio compression cycles and the uptake of the portfolio reconciliation service, triResolve.
During the year triReduce terminated $150 trillion of gross notional outstanding (2013/14 – $112 trillion). The more stringent leverage ratio included within the Basel III rules continues to drive demand from banks for the triReduce compression service. Since its launch in 2003, triReduce has eliminated more than $609 trillion in total notional volume from the OTC derivatives market for more than 251 legal entities, including both bank and non-bank institutions. triReduce is working with multiple clearing houses to facilitate portfolio compression for cleared trades. In December, triReduce announced that it had completed the first compression cycle for Japanese yen interest rates swaps at the Japanese Securities Clearing Corporation and, in March 2015, announced that it had entered into an agreement with the CME to offer multilateral compression services.
triReduce continues to offer new services, including cross-currency swaps, in which it has already successfully run compression cycles in currencies such as the Mexican peso, the South African rand and the Turkish lira. triReduce recently announced plans to collaborate with CLS to deliver an FX forward compression service.
Strong demand for triResolve continues to be driven by the introduction of regulatory requirements for regular reconciliation of derivative portfolios. The number of customers using the triResolve service has increased from 987 during 2013/14 to more than 1,380 who participate in 330,000 party-to-party reconciliations each month (2013/14 – 283,000). triResolve recently announced its first customer in Taiwan as market participants in the Asia Pacific region have begun to reconcile regularly to accommodate their US and European counterparties. A further offering born out of the new rules is repository reconciliation where triResolve supports interfaces to both European and US trade repositories.
triCalculate, the counterparty credit risk analytics service based on an innovative new methodology, is now in its pilot phase and is expected to go into commercial launch in 2015/16. New regulatory requirements under the Basel III framework will introduce the need for further new products.
Peter WeibelChief Executive Officer, triReduce
TriOptima, through triReduce and triResolve, is the market leader in risk mitigation solutions for OTC derivatives, primarily through the elimination and reconciliation of outstanding transactions.
ICAP plc Annual Report 2015 39
Strategic reportG
overnance and directors’ reportFinancial statem
entsD
efinitions
TraianaTraiana operates the leading market infrastructure for pre and post trade risk management and post trade processing across multiple asset classes. Its robust and proven product suite automates trade processing across the life cycle for FX, cash equities, equity swaps, futures, OTC derivatives and fixed income. Traiana’s Harmony network connects more than 750 global banks, broker/dealers, buy side firms and trading platforms.
For the year ended 31 March 2015, revenue increased by 10% on a constant currency basis and by 11% on a reported basis to £53 million (2013/14 – £47 million). The increase is primarily attributable to subscription-based revenue in products such as CreditLink, the real-time platform for pre and post trade certainty of clearing and cross-asset regulatory reporting, specifically CCP Connect and Trade Reporting. The Harmony platform saw a decline in the number of FX transactions processed as a result of low FX volatility during the first half of the year.
While FX remains its largest revenue segment, Traiana continues to innovate, grow and diversify its business into other asset classes, delivering network based solutions for all financial market participants, while also continuing to innovate in FX. There has been a focus on investment in real-time credit management and allocation systems and the expansion of regulatory reporting into multiple jurisdictions. Regulatory approval was recently received from three separate regulatory bodies and three pan-European clearing houses for the launch of Equity CCP Connect, a clearing service which provides banks with immediate expense and risk reduction through the netting and clearing of OTC equity transactions.
ResetReset is a provider of services that reduce the basis risk within portfolios from fixings in the interest rate, FX and inflation derivatives and bonds markets. Basis risk results from the structure of the instruments traded and unintended mismatches of exposure over time.
Reset’s revenue is largely correlated to the movement in both actual and forecast short-term interest rates. For the year ended 31 March 2015, revenue decreased by 2% on a constant currency basis and by 5% on a reported basis to £39 million (2014/15 – £41 million). Minimal interest rate volatility and flat short-term yield curves continued to constrain activity levels. Reset remains well positioned to benefit from a return to normalised levels of interest rate volatility.
ICAP Information ServicesIIS delivers independent data solutions to financial market participants, generating subscription-based fees from a suite of products and services. ICAP Indices charges licence fees based on financial instruments linked to proprietary indices as well as licensing other index administrators for the use of ICAP data in their indices.
For the year ended 31 March 2015, revenue increased by 1% on a constant currency basis and marginally decreased on a reported basis to £69 million (2013/14 – £70 million). The IIS product offering and development strategy have expanded to meet the evolution in market demand. IIS has continued to broaden its distribution options based on customer demand.
IIS has expanded its offering within its interest rate derivatives suite, most recently with the launch of real-time, end of day and historical tick data services. IIS continues to leverage its collaborative relationships with third party data, analytics and technology providers to improve its offerings, expand its customer base and enter new markets. For example, its partnership with industry specialists Prism Valuations widens the addressable market for IIS’s services.
Other Post Trade Risk and Information investmentsICAP’s Post Trade Risk and Information division invests in new companies developing innovative technology-led offerings via Euclid Opportunities. Euclid identifies and provides investment to emerging financial technology firms providing new platforms, business models and technologies that have the potential to drive efficiency, transparency and scale across the post transaction life cycle. Example investments are Duco, a rapidly growing reconciliation on-demand provider, OpenGamma, an award winning risk analytics provider, and Enso Financial, a portfolio analytics provider to asset managers and hedge funds. Further investments are anticipated in the forthcoming financial year.
Strategic report Results for 2014/15 continued
Post Trade Risk and Information continued
ICAP plc Annual Report 201540
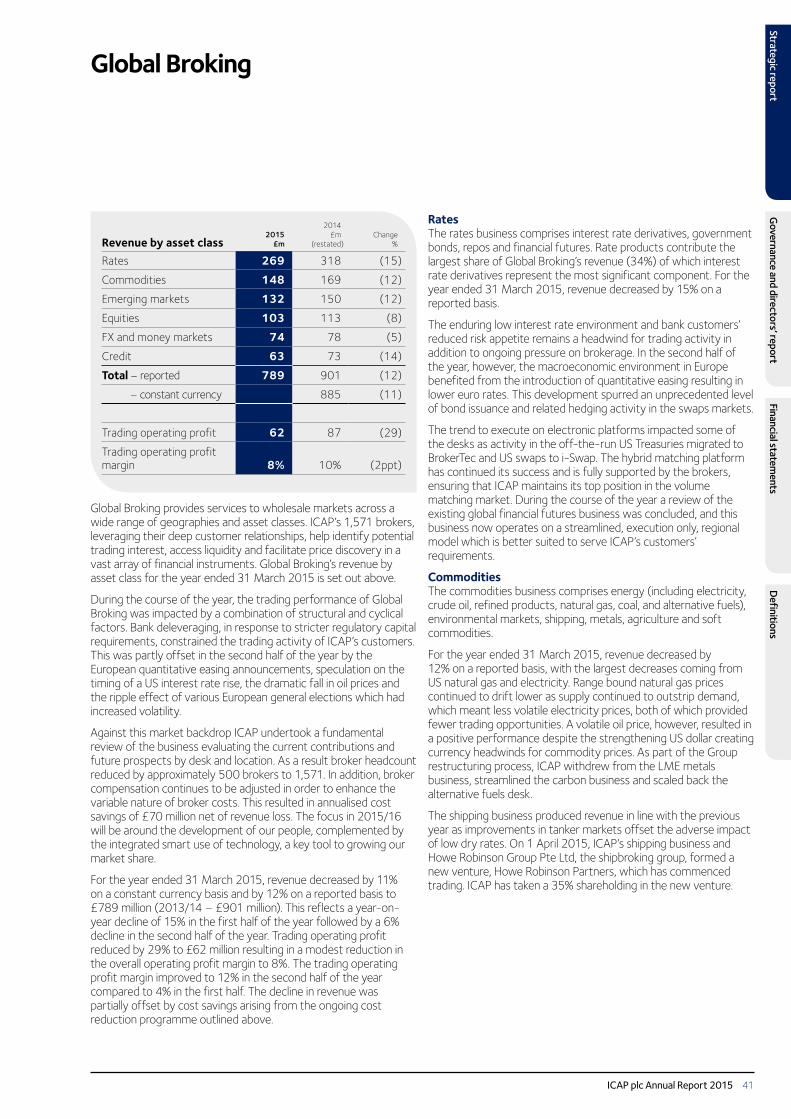
Global Broking
RatesThe rates business comprises interest rate derivatives, government bonds, repos and financial futures. Rate products contribute the largest share of Global Broking’s revenue (34%) of which interest rate derivatives represent the most significant component. For the year ended 31 March 2015, revenue decreased by 15% on a reported basis.
The enduring low interest rate environment and bank customers’ reduced risk appetite remains a headwind for trading activity in addition to ongoing pressure on brokerage. In the second half of the year, however, the macroeconomic environment in Europe benefited from the introduction of quantitative easing resulting in lower euro rates. This development spurred an unprecedented level of bond issuance and related hedging activity in the swaps markets.
The trend to execute on electronic platforms impacted some of the desks as activity in the off-the-run US Treasuries migrated to BrokerTec and US swaps to i-Swap. The hybrid matching platform has continued its success and is fully supported by the brokers, ensuring that ICAP maintains its top position in the volume matching market. During the course of the year a review of the existing global financial futures business was concluded, and this business now operates on a streamlined, execution only, regional model which is better suited to serve ICAP’s customers’ requirements.
CommoditiesThe commodities business comprises energy (including electricity, crude oil, refined products, natural gas, coal, and alternative fuels), environmental markets, shipping, metals, agriculture and soft commodities.
For the year ended 31 March 2015, revenue decreased by 12% on a reported basis, with the largest decreases coming from US natural gas and electricity. Range bound natural gas prices continued to drift lower as supply continued to outstrip demand, which meant less volatile electricity prices, both of which provided fewer trading opportunities. A volatile oil price, however, resulted in a positive performance despite the strengthening US dollar creating currency headwinds for commodity prices. As part of the Group restructuring process, ICAP withdrew from the LME metals business, streamlined the carbon business and scaled back the alternative fuels desk.
The shipping business produced revenue in line with the previous year as improvements in tanker markets offset the adverse impact of low dry rates. On 1 April 2015, ICAP’s shipping business and Howe Robinson Group Pte Ltd, the shipbroking group, formed a new venture, Howe Robinson Partners, which has commenced trading. ICAP has taken a 35% shareholding in the new venture.
Global Broking provides services to wholesale markets across a wide range of geographies and asset classes. ICAP’s 1,571 brokers, leveraging their deep customer relationships, help identify potential trading interest, access liquidity and facilitate price discovery in a vast array of financial instruments. Global Broking’s revenue by asset class for the year ended 31 March 2015 is set out above.
During the course of the year, the trading performance of Global Broking was impacted by a combination of structural and cyclical factors. Bank deleveraging, in response to stricter regulatory capital requirements, constrained the trading activity of ICAP’s customers. This was partly offset in the second half of the year by the European quantitative easing announcements, speculation on the timing of a US interest rate rise, the dramatic fall in oil prices and the ripple effect of various European general elections which had increased volatility.
Against this market backdrop ICAP undertook a fundamental review of the business evaluating the current contributions and future prospects by desk and location. As a result broker headcount reduced by approximately 500 brokers to 1,571. In addition, broker compensation continues to be adjusted in order to enhance the variable nature of broker costs. This resulted in annualised cost savings of £70 million net of revenue loss. The focus in 2015/16 will be around the development of our people, complemented by the integrated smart use of technology, a key tool to growing our market share.
For the year ended 31 March 2015, revenue decreased by 11% on a constant currency basis and by 12% on a reported basis to £789 million (2013/14 – £901 million). This reflects a year-on-year decline of 15% in the first half of the year followed by a 6% decline in the second half of the year. Trading operating profit reduced by 29% to £62 million resulting in a modest reduction in the overall operating profit margin to 8%. The trading operating profit margin improved to 12% in the second half of the year compared to 4% in the first half. The decline in revenue was partially offset by cost savings arising from the ongoing cost reduction programme outlined above.
Revenue by asset class2015
£m
2014 £m
(restated)Change
%
Rates 269 318 (15)
Commodities 148 169 (12)
Emerging markets 132 150 (12)
Equities 103 113 (8)
FX and money markets 74 78 (5)
Credit 63 73 (14)
Total – reported 789 901 (12)
– constant currency 885 (11)
Trading operating profit 62 87 (29)
Trading operating profit margin 8% 10% (2ppt)
ICAP plc Annual Report 2015 41
Strategic reportG
overnance and directors’ reportFinancial statem
entsD
efinitions
Emerging marketsICAP is active in emerging markets across Asia Pacific, Latin America, Central and Eastern Europe and Africa. Emerging market revenue includes domestic activity in local markets and cross-border activity in globally traded emerging market money and interest rate products.
For the year ended 31 March 2015, revenue decreased by 12% on a reported basis. The majority of the reduction came in the first half with the second half revenue 2% above that recorded in the second half of 2013/14. The return of volatility relating to geopolitical factors, a falling oil price as well as some specific local factors helped to improve performance in the second half of the year, especially on the Asian desks. NDF volumes have grown on the back of the implementation of matching sessions as well as market driven increases. Liberalisation of the renminbi as a settlement currency continues to drive growth in related products.
EquitiesThe equities business principally comprises equity derivatives. For the year ended 31 March 2015, revenue decreased by 8% as a number of bank customers downsized their desks, restricted balance sheets and internalised trades. During the second half of 2014/15 macroeconomic developments in the Eurozone contributed to an uptick in trading activity. There has been a steady flow of small boutique hedge funds replacing the bank flow.
FX and money marketsThe FX and money markets business comprises spot, forwards and cash products. For the year ended 31 March 2015 revenue fell by 5% on a reported basis. After a period of low exchange rate volatility in the first half of the year, central banks’ actions and geopolitical developments drove increased volatility and trading activity in FX markets. Cash products performed well, especially in the Americas, as customers used the product to manage short-term funding requirements.
CreditThe credit business comprises corporate bonds and credit derivatives, and contributes the smallest share of Global Broking’s revenue (8%). The credit business has been restructured and product offerings have been streamlined, with 13 desk closures and the reduction of ICAP’s stake in the First Brokers business (down to 40%).
Revenue for the year ended 31 March 2015 is 14% below the prior year on a reported basis. The remaining business benefited from a pick up in recent bond issuance following Eurozone quantitative easing as participants look to lock in low funding costs. In January 2015, Scrapbook was launched, an anonymous, session-based e-solution for the corporate bond market. Accessed via ICAP’s e-Commerce portal, Scrapbook helps corporate bond traders identify opportunities and manage their positions more efficiently.
Strategic report Results for 2014/15 continued
Global Broking continued
ICAP plc Annual Report 201542
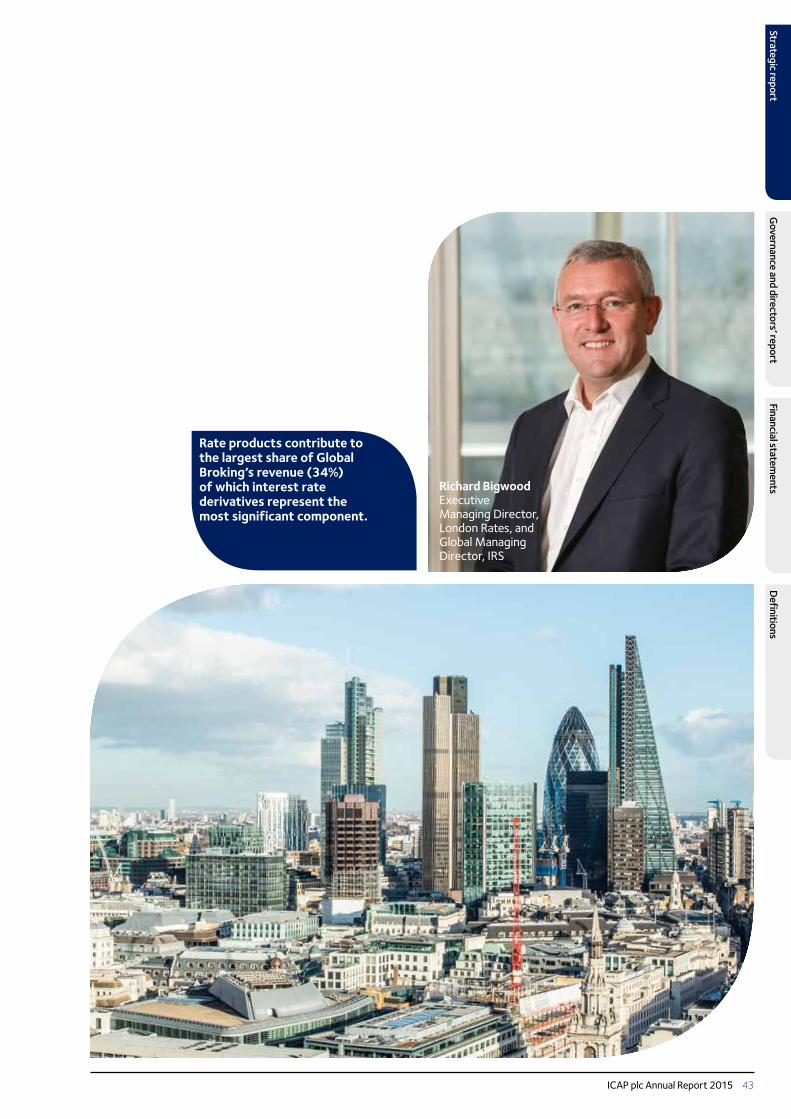
Rate products contribute to the largest share of Global Broking’s revenue (34%) of which interest rate derivatives represent the most significant component.
Richard BigwoodExecutive Managing Director, London Rates, and Global Managing Director, IRS
ICAP plc Annual Report 2015 43
Strategic reportG
overnance and directors’ reportFinancial statem
entsD
efinitions

Strategic report Results for 2014/15 continued
Maintained dividend reflecting strong cash conversion
Trading profit before taxThe results for 2014/15 section of the strategic report (pages 35 to 47) focus on the Group’s divisional revenue and trading operating profit as management plans and reviews the financial performance of the business using trading results that exclude acquisition and disposal costs and exceptional items (see the basis of preparation statement).
We choose to focus on trading profit as we believe that it provides a clearer view of business performance and in particular is expected to convert fully into cash over the medium term.
On page 45, we provide a reconciliation between the Group’s trading profit for the year and the reported Group profit.
Year ended31 March
2015£m
Year ended31 March
2014£m
(restated)
Trading operating profit 252 290
Net finance costs (31) (27)
Share of profit of joint ventures after tax 4 4
Share of profit of associates after tax 4 4
Trading profit before tax 229 271
Tax (44) (59)
Trading profit for the year 185 212
The Group’s £252 million trading operating profit (2013/14 – £290 million) converted to a trading profit before tax of £229 million (2013/14 – £271 million) after deducting net finance costs of £31 million (2013/14 – £27 million) and recording a share of profit of joint ventures and associates after tax of £8 million (2013/14 – £8 million).
Trading net finance costs were £4 million higher than the prior year. Interest payable and similar charges were £3 million lower this year, primarily benefiting from the lower charges on the new eurobond. Excluding the adverse effect from the double running of the bonds in 2014/15, the annualised savings in finance costs from the new eurobond will be £6 million. The double running of the bonds until July 2014 also resulted in a £1 million increase in interest income. The £4 million benefit to 2014/15 trading net finance costs from lower charges and higher interest income was more than offset as no dividends were received from the available-for-sale investments in the current year (2013/14 – £3 million). Additionally, the prior year included certain one-off credits of £5 million.
Movements in exchange rates had a £32 million adverse impact on year-on-year revenue and a £14 million adverse impact on trading profit before tax. These impacts were primarily driven by the strengthening of the US dollar against sterling.
Tax on trading profitThe Group’s tax charge of £44 million on trading profit before tax represents an effective tax rate (ETR) of 19% (2013/14 –22%), as shown in the chart below. The ETR primarily reflects the various statutory tax rates applied to taxable profits in territories in which the Group operates.
201519%
201422%
201326%
The trading ETR is three percentage points lower this year, driven by a decrease in the UK statutory tax rate from 22% to 21% and certain one-off prior year adjustments. In the absence of one-off prior year adjustments, the underlying ETR is in the range of 23% to 25%.
The Group manages its tax affairs in accordance with its tax strategy. The tax strategy was presented to the Audit Committee during the year (see the Audit Committee report in the Governance section on pages 60 to 62).
Trading EPS and dividendTrading EPS (basic) is calculated based on the trading profit for the year.
We believe that trading EPS (basic) is the most appropriate EPS measurement ratio for the Group as this most closely reflects the ongoing generation of cash attributable to shareholders and in turn the Group’s ability to fund sustainable dividends. In line with this, the Remuneration Committee considers trading EPS (basic) in its review of management performance and uses that metric in the remuneration of the executive directors. A reconciliation between trading EPS (basic) and the reported EPS (basic) is presented in note 5 to the financial statements.
Year ended31 March
2015pence
Year ended31 March
2014pence
Trading EPS (basic) 28.7 33.2
Full-year dividend per share 22.0 22.0
The Group reported a trading EPS of 28.7p per share, a decrease of 14% on the prior year. This reflects a 15% decrease in the trading profit before tax, which was partially offset by a three percentage point reduction in the ETR.
The directors recommend a final dividend of 15.4p per share, reflecting strong cash generation and the board’s confidence in the medium term prospects for the business. If approved, the final dividend will be paid on 24 July 2015 to shareholders on the register at the close of business on 3 July 2015. The shares will be quoted ex-dividend from 2 July 2015.
ICAP plc Annual Report 201544
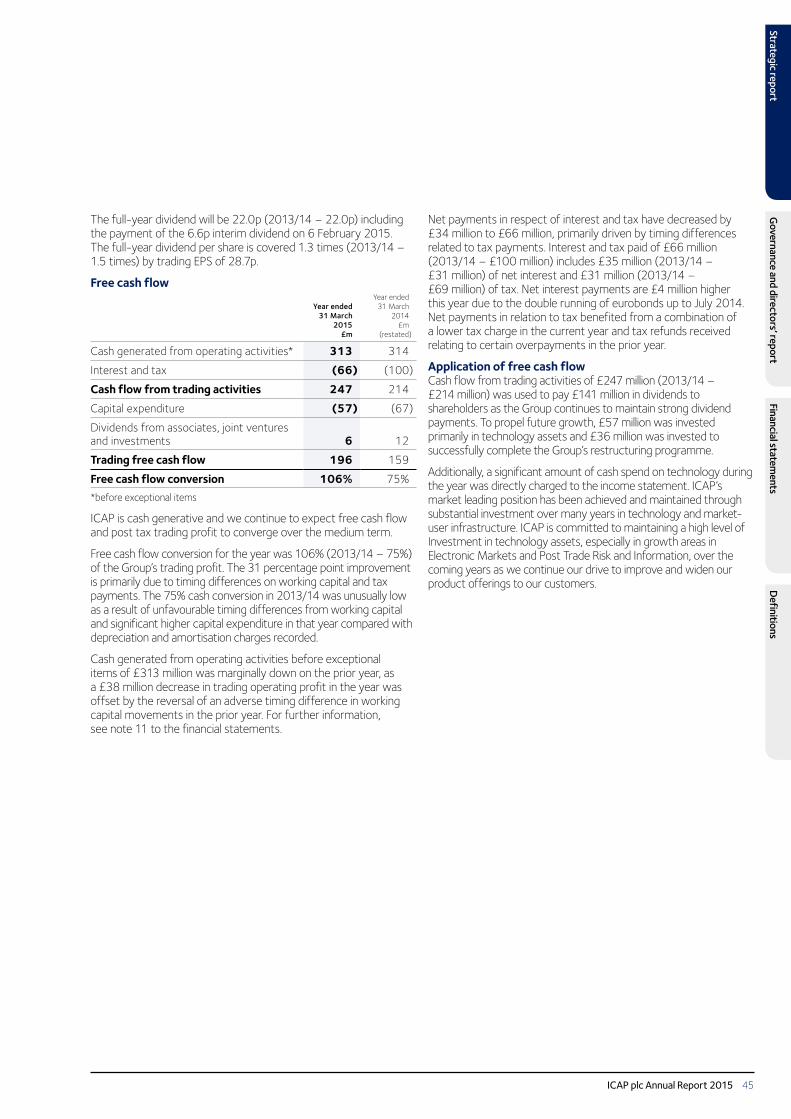
The full-year dividend will be 22.0p (2013/14 – 22.0p) including the payment of the 6.6p interim dividend on 6 February 2015. The full-year dividend per share is covered 1.3 times (2013/14 – 1.5 times) by trading EPS of 28.7p.
Free cash flow
Year ended31 March
2015£m
Year ended31 March
2014£m
(restated)
Cash generated from operating activities* 313 314
Interest and tax (66) (100)
Cash flow from trading activities 247 214
Capital expenditure (57) (67)
Dividends from associates, joint ventures and investments 6 12
Trading free cash flow 196 159
Free cash flow conversion 106% 75%
*before exceptional items
ICAP is cash generative and we continue to expect free cash flow and post tax trading profit to converge over the medium term.
Free cash flow conversion for the year was 106% (2013/14 – 75%) of the Group’s trading profit. The 31 percentage point improvement is primarily due to timing differences on working capital and tax payments. The 75% cash conversion in 2013/14 was unusually low as a result of unfavourable timing differences from working capital and significant higher capital expenditure in that year compared with depreciation and amortisation charges recorded.
Cash generated from operating activities before exceptional items of £313 million was marginally down on the prior year, as a £38 million decrease in trading operating profit in the year was offset by the reversal of an adverse timing difference in working capital movements in the prior year. For further information, see note 11 to the financial statements.
Net payments in respect of interest and tax have decreased by £34 million to £66 million, primarily driven by timing differences related to tax payments. Interest and tax paid of £66 million (2013/14 – £100 million) includes £35 million (2013/14 – £31 million) of net interest and £31 million (2013/14 – £69 million) of tax. Net interest payments are £4 million higher this year due to the double running of eurobonds up to July 2014. Net payments in relation to tax benefited from a combination of a lower tax charge in the current year and tax refunds received relating to certain overpayments in the prior year.
Application of free cash flowCash flow from trading activities of £247 million (2013/14 – £214 million) was used to pay £141 million in dividends to shareholders as the Group continues to maintain strong dividend payments. To propel future growth, £57 million was invested primarily in technology assets and £36 million was invested to successfully complete the Group’s restructuring programme.
Additionally, a significant amount of cash spend on technology during the year was directly charged to the income statement. ICAP’s market leading position has been achieved and maintained through substantial investment over many years in technology and market-user infrastructure. ICAP is committed to maintaining a high level of Investment in technology assets, especially in growth areas in Electronic Markets and Post Trade Risk and Information, over the coming years as we continue our drive to improve and widen our product offerings to our customers.
ICAP plc Annual Report 2015 45
Strategic reportG
overnance and directors’ reportFinancial statem
entsD
efinitions

Profit for the yearYear ended
31 March2015
£m
Year ended31 March
2014£m
Trading profit for the year 185 212
Acquisition and disposal costs after tax (44) (48)
Exceptional items after tax (57) (64)
Profit for the year 84 100
Acquisition and disposal costsAcquisition and disposal costs in the year were £59 million (2013/14 – £74 million) before a tax credit of £15 million (2013/14 – £26 million). The acquisition and disposal costs in the year primarily represent amortisation of acquired intangibles. See notes 3 and 14 to the financial statements for a more detailed breakdown of the Group’s acquisition and disposal costs.
The £15 million decrease in acquisition and disposal costs reflects an £11 million impairment charge recorded in 2013/14. There was no impairment charge recorded in 2014/15.
Exceptional itemsThe Group discloses separately items that are non-recurring and material in terms of both size and nature. This allows appropriate visibility of these items and reflects how information is reviewed by management. It allows focus on the Group’s trading performance, as well as due attention specifically on the exceptional matters.
For the year to 31 March 2015 exceptional items were £75 million (2013/14 – £76 million) before a tax credit of £18 million (2013/14 – £12 million).
The Group has now completed its restructuring programme. The Group recorded a £60 million charge during the year to implement the restructuring programme, of which £24 million is non-cash expense, comprising property related provisions and other accruals.
The remaining £15 million relates to regulatory matters including a £11 million provision relating to a €14.9 million fine imposed by the European Commission for alleged competition violations in relation to yen Libor, in respect of the same underlying matters that ICAP Europe Limited, a subsidiary of ICAP’s Global Broking division, settled with the Financial Conduct Authority (FCA) and the US Commodity Futures Trading Commission (CFTC) in September 2013. ICAP has appealed and is seeking a full annulment of the Commission’s decision.
For further information, see note 4 to the financial statements.
Strategic report Results for 2014/15 continued
Balance sheet highlights
As at31 March
2015£m
As at31 March
2014£m
(restated)
Net assetsIntangible assets arising on consolidation 930 933
Cash and cash equivalents 481 698
Borrowings (549) (787)
Other net assets 156 139
Total net assets 1,018 983
The Group’s net assets as at 31 March 2015 were £35 million higher at £1,018 million (31 March 2014 – £983 million). The retained deficit in the year of £57 million (net of £141 million dividend payments) was offset by a £91 million favourable FX movement, principally as a result of a stronger US dollar on the net assets, including goodwill, on our US businesses.
The significant balance sheet line items, including intangible assets arising on consolidation, cash and cash equivalents and borrowings are discussed below.
Intangible assets arising on consolidation
£m Electronic Markets 523 Post Trade Risk and Information 318 Global Broking 89
Total 930
The Group’s goodwill and other intangible assets arising from consolidation as at 31 March 2015 was £930 million (2013/14 – £933 million), with 90% of the balance represented by the Electronic Markets and Post Trade Risk and Information divisions.
Other intangible assets were amortised by £55 million (2013/14 – £64 million) during the year. Additionally, £15 million of goodwill and other intangible assets were transferred to disposal group as the sale of the Group’s shipbroking business was classified as held for sale as at 31 March 2015, see note 10 to the financial statements.
This £70 million combined decrease was partially offset by a £67 million favourable movement in FX. Strengthening of the US dollar resulted in an increase of £76 million in the balance during the year, which was partially offset by a £9 million decrease in euro-denominated assets resulting from the weakening of the euro against sterling in the year. These currencies represented 77% of the Group’s goodwill and other intangibles.
ICAP plc Annual Report 201546
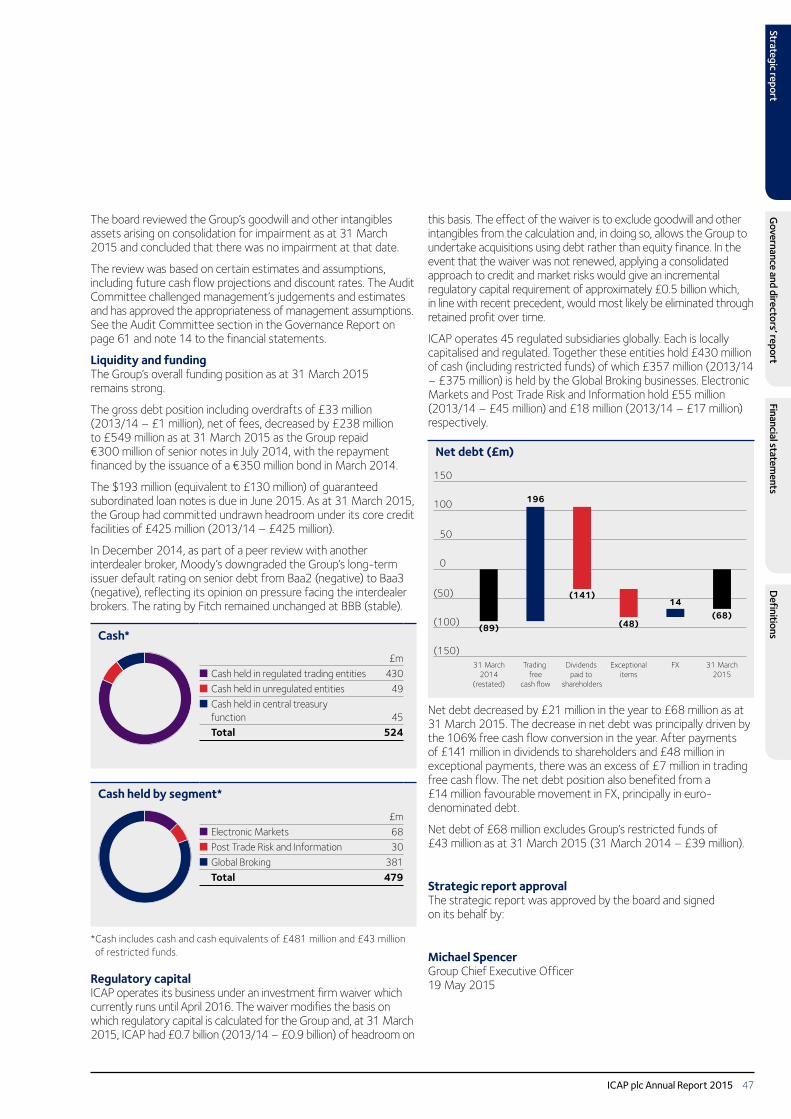
The board reviewed the Group’s goodwill and other intangibles assets arising on consolidation for impairment as at 31 March 2015 and concluded that there was no impairment at that date.
The review was based on certain estimates and assumptions, including future cash flow projections and discount rates. The Audit Committee challenged management’s judgements and estimates and has approved the appropriateness of management assumptions. See the Audit Committee section in the Governance Report on page 61 and note 14 to the financial statements.
Liquidity and fundingThe Group’s overall funding position as at 31 March 2015 remains strong.
The gross debt position including overdrafts of £33 million (2013/14 – £1 million), net of fees, decreased by £238 million to £549 million as at 31 March 2015 as the Group repaid €300 million of senior notes in July 2014, with the repayment financed by the issuance of a €350 million bond in March 2014.
The $193 million (equivalent to £130 million) of guaranteed subordinated loan notes is due in June 2015. As at 31 March 2015, the Group had committed undrawn headroom under its core credit facilities of £425 million (2013/14 – £425 million).
In December 2014, as part of a peer review with another interdealer broker, Moody’s downgraded the Group’s long-term issuer default rating on senior debt from Baa2 (negative) to Baa3 (negative), reflecting its opinion on pressure facing the interdealer brokers. The rating by Fitch remained unchanged at BBB (stable).
Cash*
£m Cash held in regulated trading entities 430 Cash held in unregulated entities 49 Cash held in central treasury function 45
Total 524
Cash held by segment*
£m Electronic Markets 68 Post Trade Risk and Information 30 Global Broking 381
Total 479
* Cash includes cash and cash equivalents of £481 million and £43 million of restricted funds.
Regulatory capitalICAP operates its business under an investment firm waiver which currently runs until April 2016. The waiver modifies the basis on which regulatory capital is calculated for the Group and, at 31 March 2015, ICAP had £0.7 billion (2013/14 – £0.9 billion) of headroom on
this basis. The effect of the waiver is to exclude goodwill and other intangibles from the calculation and, in doing so, allows the Group to undertake acquisitions using debt rather than equity finance. In the event that the waiver was not renewed, applying a consolidated approach to credit and market risks would give an incremental regulatory capital requirement of approximately £0.5 billion which, in line with recent precedent, would most likely be eliminated through retained profit over time.
ICAP operates 45 regulated subsidiaries globally. Each is locally capitalised and regulated. Together these entities hold £430 million of cash (including restricted funds) of which £357 million (2013/14 – £375 million) is held by the Global Broking businesses. Electronic Markets and Post Trade Risk and Information hold £55 million (2013/14 – £45 million) and £18 million (2013/14 – £17 million) respectively.
Net debt (£m)
(150)
(100)
(50)
0
50
100
150
196
(89)
(141)
(48)(68)
14
31 March2014
(restated)
Trading free
cash flow
Dividends paid to
shareholders
Exceptionalitems
FX 31 March2015
Net debt decreased by £21 million in the year to £68 million as at 31 March 2015. The decrease in net debt was principally driven by the 106% free cash flow conversion in the year. After payments of £141 million in dividends to shareholders and £48 million in exceptional payments, there was an excess of £7 million in trading free cash flow. The net debt position also benefited from a £14 million favourable movement in FX, principally in euro-denominated debt.
Net debt of £68 million excludes Group’s restricted funds of £43 million as at 31 March 2015 (31 March 2014 – £39 million).
Strategic report approvalThe strategic report was approved by the board and signed on its behalf by:
Michael SpencerGroup Chief Executive Officer 19 May 2015
ICAP plc Annual Report 2015 47
Strategic reportG
overnance and directors’ reportFinancial statem
entsD
efinitions