strategic resource plan 2020-2024 - city of kingston
TRANSCRIPT
TRIM 20/170224
Strategic Resource Plan 2020-2024
CITY OF KINGSTON

Strategic Resource Plan 2020-2024
CITY OF KINGSTON
PAGE 2 CITY OF KINGSTON STRATEGIC RESOURCE PLAN
DOCUMENT INFORMATION
Date Status
25/05/2020 Draft approved by Council subject to any changes to the final adopted
budget.
13/07/2020 Adopted by Council
Strategic Resource Plan 2020-2024
CITY OF KINGSTON
CITY OF KINGSTON STRATEGIC RESOURCE PLAN PAGE 3
Introduction .................................................................................................... 4
Objectives of the Plan .................................................................................... 4
Planning and Accountability Framework......................................................... 5
How the Plan was developed ......................................................................... 6
Developing Forecasts - Significant matters impacting the plan....................... 6
Assessment of Council’s current and forecast financial position..................... 7
Key assumptions underlying the development of the forecasts ...................... 8
General Operating.......................................................................................... 8
Service Delivery ........................................................................................... 10
Balance Sheet .............................................................................................. 11
Statement of Cash Flows ............................................................................. 13
Capital Works ............................................................................................... 13
Human Resources ....................................................................................... 14
Financial Outcomes ..................................................................................... 14
Achievements of the SRP objectives ............................................................ 15
Conclusion ................................................................................................... 17
Appendix: The Financial Statements ............................................................ 18
Strategic Resource Plan 2020-2024
CITY OF KINGSTON
PAGE 4 CITY OF KINGSTON STRATEGIC RESOURCE PLAN
Strategic Resource Plan The Four Year Outlook
INTRODUCTION
The Strategic Resource Plan 2020-2024 is a key medium-term financial plan. It is a rolling four year plan
that summarises the resourcing forecasts required to deliver the Council Plan. This resource plan ensures
that Kingston remains sustainable in the long term.
This high level, medium term outlook demonstrates how Council will best employ its resources both
financial and non-financial to achieve the Council Plan’s goals and deliver on the Key Directions and
Objectives outcomes, as set out in the Council Plan 2017-2021 which can be downloaded from our
website kingston.vic.gov.au.
This Strategic Resource Plan (SRP) is updated annually with the development of the Annual Budget and
meets the legislative requirements as specified in the Local Government Act 1989 and Local Government
(Planning and Reporting) Regulations 2014. The proposed 2020/21 Budget details the first year of the
SRP.
OBJECTIVES OF THE PLAN
The key objective, which underlines the development of the SRP, is financial sustainability in the medium
to long term, while still achieving Council’s strategic objectives as specified in the Council Plan. The key
financial objectives, which underpin the SRP, are:
• Maintain existing service levels;
• Maintain financial sustainability;
• Maintain a sustainable capital expenditure program; and
• Achieve a balanced budget on a cash basis.
In preparing the SRP, Council has also been mindful of the need to comply with the following Principles of
Sound Financial Management as contained in the Act:
• Manage financial risks faced by Council prudently, having regard to economic circumstances;
• Pursue spending and rating policies that are consistent with a reasonable degree of stability in
the level of the rates burden;
• Ensure that decisions are made and actions are taken having regard to their financial effects on
future generations; and
• Ensure full, accurate and timely disclosure of financial information.
The SRP is updated annually through a rigorous process of consultation with Council service providers
followed by a detailed sensitivity analysis to achieve the key financial objectives.

Strategic Resource Plan 2020-2024
CITY OF KINGSTON
CITY OF KINGSTON STRATEGIC RESOURCE PLAN PAGE 5
PLANNING AND ACCOUNTABILITY FRAMEWORK
The integrated planning framework is set out below and demonstrates the linkages to the Annual Budget
and Council Plan. This framework guides the Council in identifying community needs and aspirations over
the long term (Vision 2035), medium term (Council Plan) and short term (Annual Budget) and then
holding itself accountable (Audited Statements).
The diagram below depicts the planning and accountability framework that applies to Local Government
in Victoria. The diagram shows the relationships between the key planning and reporting documents. It
also demonstrates opportunities for the community and stakeholders to provide feedback and have input
at each stage of the planning and reporting cycle.
Planning and Accountability Framework
Source: Department of Transport, Planning and Local Infrastructure
Strategic Resource Plan 2020-2024
CITY OF KINGSTON
PAGE 6 CITY OF KINGSTON STRATEGIC RESOURCE PLAN
HOW THE PLAN WAS DEVELOPED
Kingston has adopted a robust and integrated approach to financial planning for all Council’s activities.
This integrated approach avoids the risk of committing future resources that are unaffordable in the
context of the Strategic Resource Plan and which could place an added burden on future generations.
This plan has been developed to reflect the priorities of the Council and having had regard to the annual
business planning processes of Council departments. This ensures a clear connection between the
objectives of the Council Plan and the development of departmental business plans and budgets.
The departmental business plans identify the changing operating environment, any impacts on service
levels and identify savings and efficiencies. This enables a bottom up approach to developing forecasts
for the long term financial plan. The strategic context takes into account:
• Population growth
• Demographics (changes to the structure of households, the age profile of the population, etc.)
• Development forecasts (increase in high density living)
• Activity Centre development
• New technologies
• Changing community expectations
• Changing economic climate
• Industry restructures (job losses)
• Competition from private providers
• Legislation changes
• Local Government Performance Reporting Framework
• Infrastructure grants
• COVID-19 impact
This long term financial forecasting is driven from priorities set in the four year Council Plan with input
from the service providers along with the application of financial assumptions and key organisational
strategies such as the rating strategy, the borrowing strategy, the asset management strategy and the
fees and charges strategy.
DEVELOPING FORECASTS - SIGNIFICANT MATTERS IMPACTING THE PLAN
Whilst this Strategic Resource Plan is for the four year term, the forecasting is extended for a ten year
period to take into account the long lived assets such as road and drainage infrastructure. All services
and any new initiatives contained in any plan adopted or proposed to be adopted by Council requiring
additional funding are identified. Strategies, plans and initiatives that have been approved have had their
ongoing implementation costs included in this SRP including:
• Asset management plans
• Capital Works Program including projects approved through master plans and strategies
• Operating projections for service areas
• Approved Plans and Strategy implementation that may include service growth

Strategic Resource Plan 2020-2024
CITY OF KINGSTON
CITY OF KINGSTON STRATEGIC RESOURCE PLAN PAGE 7
ASSESSMENT OF COUNCIL’S CURRENT AND FORECAST FINANCIAL POSITION
The following table summarises the key financial indicators for budget 2019/20 and 2020/21 as set out in
the Long Term Financial Plan. The Appendix includes a more detailed analysis of the financial resources
to be used over the four year outlook period.
INDICATOR
BUDGET BUDGET FORECAST FORECAST FORECAST
TREND +/=/- 2019/20 2020/21 2021/22 2022/23 2023/24
$'000 $'000 $'000 $'000 $'000
Operating Surplus / (Deficit) 27,993 15,416 26,714 25,178 14,580 -
Cash Increase / (Decrease) (24,306) (26,515) (20,716) (9,353) (4,785) +
Debt Outstanding (at end of year) 1,741 - - - - +
Total Capital Expenditure 81,656 65,909 72,811 60,409 45,545 -
Key to Forecast Trend:
+ Forecasts an improvement in Council’s Financial Performance / Indicator
= Forecasts that Council’s Financial Performance / Indicator will be steady
- Forecasts deterioration in Council’s Financial Performance / Indicator
The key outcomes of the Strategic Resource Plan are as follows:
Service Delivery – Service levels have been maintained throughout the four year period. Years 2020/21
to 2023/24 are forecast operating surplus results.
Rating Strategy – Consistent with the adopted long term financial strategy rates and charges, average
increases are forecast to be 2.0% for 2020/21, 2.25% for 2021/22 and 2.50 % for 2022/23 and 2023/24,
which recognises the state government rate-capping policy and Treasury and Finance forecasts of CPI as
far as they have been provided into the future. Forecasts are then based on a Council assessment
projected within the Reserve Bank of Australia’s target for CPI to be between 2.0% per annum and 3.0%
per annum.
Borrowing Strategy – Debt outstanding at 30 June 2021 is expected to be zero. There will be no new
borrowings in 2020/21 and Council is forecast to be debt free in July 2021.
Asset Management Strategy – Capital Expenditure over the four year period will total $244.7 million at an
annual average of $61.2 million.
Fees & Charges Strategy – Existing fees and charges to be increased by approximately 3.0% or market
levels unless set by other levels of government.
COVID-19 Community and Business Support Package – Council has introduced the following initiatives
to support its community during COVID-19:
a) $118 waste rebate for residential bin services – Total cost approximately $7.5 million.
b) $112.20 rebate to residents on JobSeeker and businesses on JobKeeper.
c) No interest on overdue rates until July 2021.
d) The ability to defer rates until June 2021.
Strategic Resource Plan 2020-2024
CITY OF KINGSTON
PAGE 8 CITY OF KINGSTON STRATEGIC RESOURCE PLAN
e) Refunds to traders for Health and Food Premises registrations.
f) Refund to traders for Footpath trading fees.
g) No rents for community/sporting groups for 12 months.
KEY ASSUMPTIONS UNDERLYING THE DEVELOPMENT OF THE FORECASTS
Some of the key assumptions underlying the development of the forecasts are:
GENERAL OPERATING
• Average rate increases 2.0% for 2020/21; 2.25% for 2021/22 and 2.5% for 2022/23 and 2023/24
• Grants +1.5%
• Fees and Charges +3.0%
• Materials +2.8%
• Employee Costs +2.3% as per Enterprise Agreement.
Once the resources are identified, a number of different financial scenarios are modelled by changing the
assumptions underlying forecasts for income, expenditure, assets, liabilities, equity, cash and capital
works expenditure. This enables Council to identify the option that best achieves the Council Plan Key
Directions and Objectives while remaining financially sustainable in the long term.
This plan will ensure a financially strong and independent organisation over the outlook period of the next
decade.
Rates
The 2020/21 Budget is based on an average rate increase forecast to be 2.0% for 2020/21, 2.25% for
2021/21 and 2.5% for 2022/23 and 2023/24, which recognises the state government rate-capping policy
and Treasury and Finance forecasts of CPI as far as they have been provided into the future. Forecasts
are then based on a Council assessment projected within the Reserve Bank of Australia’s target for CPI
to be between 2.0% per annum and 3.0% per annum.
Given the impact of COVID-19, these assumptions will be revisited for the 2021/22 Budget.
Kingston’s average rates and charges per assessment are below the average of many other metropolitan
councils. This position is again expected to be achieved in 2020/21.
Government Grants / Grants Commission
The assumed escalation factor of 1.5% per annum reflects the nominal growth experienced in grants over
recent times. They do not assume a change to fund further service delivery as this would have associated
costs, nor further changes in the Grants Commission formula.
Capital Grants / Contributions
Capital grants and contributions include all monies received from State, Federal and community sources
for the purposes of funding the capital works program. Capital grants are expected to total $ 8.5 million in
2020/21. For subsequent years in the plan we have included only known, both in timing and quantum,
capital grant funding and have only included capital works that are funded from Council’s own source
revenue.
Strategic Resource Plan 2020-2024
CITY OF KINGSTON
CITY OF KINGSTON STRATEGIC RESOURCE PLAN PAGE 9
User Fees and Charges
Overall User Fees and Charges are projected to remain at prior year levels with general increases offset
by reduced fees due to Don Tatnell leisure centre closure. An average increase of approximately 3% per
annum over the period of the four year plan, excluding rental income has been allowed. This allowance
recognises both increased utilisation of Council services and price increases in both the charges set by
the State Government as well as those controlled by Council.
Other Income
Other income relates to a range of mixed items of miscellaneous income. It also includes interest revenue
on investments and rate arrears.
Employee Costs
Employee costs include all labour related expenditure such as wages and salaries and on-costs such as
allowances, leave entitlements, employer superannuation, etc. As staff vacancies are expected
throughout the year, Council has budgeted for 98% of the cost of permanent staff which is recognised as
a productivity measure.
Depreciation & Amortisation
This brings to account the decrease in value of Council’s assets through use in accordance with
Australian Accounting Standards and is a non-cash entry. The increase over the outlook period reflects
the revaluation of assets over time and new assets being developed by Council.
Based on the accounting standard AASB 16 – Leases which becomes applicable to 2020/21 budget,
Council has identified assets which include vehicles, equipment, property pertaining to long-term
contracts with exclusive use of the assets. In accordance with the standard, Council has recognised the
amortisation of those assets.
Interest Expense
Borrowing costs relate to interest charged by financial institutions on funds borrowed in accordance with
loan agreements.
Operating Result
This is the net result of Council’s operations for the year.
Materials, Contracts and Other
An allowance of 2.8% per annum has been made to allow for inflation over the plan period. Any increase
in goods and services above this figure will need to be matched by additional funding. Included in this
category is an allowance for items of expenditure on non-recurrent projects e.g. Software, Strategic
Studies, Master Plan Development etc., and this too forms part of Council’s Capital Budget. Also included
is expenditure which recognises the required accounting treatment for maintenance of Council’s road
infrastructure assets.
Asset Sales / Written Down Value of Assets Sold
The financial plan includes a small program of sales of operational plant each year. For the purposes of
the financial plan, Council has assumed that this value is equal to the proceeds from the sale, that is no
profit or loss on the sale is derived.
Strategic Resource Plan 2020-2024
CITY OF KINGSTON
PAGE 10 CITY OF KINGSTON STRATEGIC RESOURCE PLAN
SERVICE DELIVERY
The assumptions affecting specific services provided by Council are set out below.
Waste management
There will be a steady change in demand with population changes and increasing multi-unit dwellings
which may require a service change within activity centres, for example large common bins or smaller
collection trucks for basement collections. Whilst Council continues to seek cost efficiencies, the actual
effects of uncertainties in recycling have been considered in the outlook period.
Aged Care
The Living Longer Living Better aged care reforms will continue to be introduced as the Commonwealth
move to a more consumer driven model of service delivery. The State Government continues to fund
Home and Community Care (HACC) for people under 65 and not eligible for the National Disability
Scheme (NDIS). Commonwealth Community Home Support Program funding received for people over 65
is secured until 30 June 2022, however there will be ongoing policy development in this space as the
Commonwealth Government continues to work towards a single nationwide aged care system.
Unique land use issues for Kingston
Foreshore - Protecting and enhancing the foreshore from storm damage and the ongoing impacts of
climate change. Investment in coastal adaptation and asset protection is required with an investment for
2020/21 of more than $8.0 million invested in a range of projects including:
• $0.8 million Parkdale Yacht Club redevelopment
• $2.9 million Mentone Life Saving Club and Foreshore Precinct
• $1.3 million Aspendale Life Saving Club
• $1.1 million Chelsea Yacht Club refurbishment
• $0.5 million Carrum Life Saving Club expansion
Green Wedge - Supporting the transition away from landfill use in Kingston’s Green Wedge requires a
committed investment. Council continues to advocate for funding from the State Government. The
2020/21 Budget includes a $0.3 million investment to remediate and landscape former landfill sites.
Council Plan
A new Council was elected in October 2016 for the four year period to October 2020. Council has
developed a Council Plan 2017-2021 which is fully funded in this Strategic Resource Plan.

Strategic Resource Plan 2020-2024
CITY OF KINGSTON
CITY OF KINGSTON STRATEGIC RESOURCE PLAN PAGE 11
BALANCE SHEET
In preparing the budgeted balance sheet for the year ending 30 June 2021, it was necessary to make a
number of assumptions about assets, liabilities and equity balances. The key assumptions are as follows:
• A total of 95% of total rates and charges raised will be collected in each year
• Trade creditors to be based on total capital and operating expenditure
• Other debtors and creditors to remain consistent with historic levels
• Employee entitlements are increased by Enterprise Bargaining Agreements
• Employees will continue to take Annual Leave at the current rate
• Repayment of loan principal to be $1.5 million in 2020/21 with plan of debt free in July 2021
• Total amount to be capitalised in 2019/20 is approximately $65.9 million
Current Assets
Cash and cash equivalents include cash and investments such as cash held in the bank and in petty cash
and the value of investments in deposits or other highly liquid investments with short term maturities
between one to twelve months.
Trade and other receivables are monies owed to Council by ratepayers and others. Short term debtors
are not expected to change significantly in the budget.
Other assets are prepaid expenditure and accrued income which are kept at a relatively constant and low
value each year.
Non-Current Assets
Non-current assets include fixed assets, right of use assets and investment property. These are expected
to remain relatively constant over the plan period which is the net result of the capital works program that
will be taken to the Statement of Financial Position and the depreciation of non-current assets.
Current Liabilities
Current liabilities are obligations Council must pay within the next year. This includes trade and other
payables, trust funds and deposits, and provisions for accrued annual and long service leave owing to
employees.
Amounts owed to suppliers are expected to change in proportion to total capital and goods and services
expenditure. Amounts due to our bankers are as per the contracted loan repayment agreements. The
employee entitlements are only expected to decrease by $0.03 million in budget 2020/21, with the
ongoing active management of entitlements after allowing for annual salary increases. This is offset by
the reduction in interest bearing loans of $1.5 million in 2020/21 after Council had an early repayment of
the loan for 1230 Nepean Highway in 2019/20. There is a $0.5 million allocation to the Lease liabilities as
a result of recognising the new accounting standard, AASB 16 Leases
Non-Current Liabilities
Non-current liabilities (that is, obligations Council must pay beyond the next year) consists mainly of
recognition of the lease liability. No new borrowings are forecast in the Strategic Resource Plan. The
2020/21 budget includes an $8.7 million liability in non-current lease liabilities as a result of recognising
vehicles, equipment and property from right of use assets in accordance with AASB 16-Leases.

Strategic Resource Plan 2020-2024
CITY OF KINGSTON
PAGE 12 CITY OF KINGSTON STRATEGIC RESOURCE PLAN
Equity
The net movement in equity (or net assets) results directly from the Plan’s operating deficits/surpluses
and the net movement in reserves. Reserves include amounts collected from developers in lieu of open
space, asset replacement reserve transfers and the drawdown of reserves to fund capital works e.g.
Open Space/Recreation facilities.

Strategic Resource Plan 2020-2024
CITY OF KINGSTON
CITY OF KINGSTON STRATEGIC RESOURCE PLAN PAGE 13
STATEMENT OF CASH FLOWS
Operating Activities
Operating activities refer to the cash generated or used in the normal service delivery functions of
Council. The net cash flows from operating activities does not equal the surplus or the deficit for the year
as the expected revenues and expenses of the Council include non-cash items which have been
excluded from the Cash Flow Statement.
Investing Activities
Investing activities refer to cash generated or used in the enhancement or creation of infrastructure or
other assets. These activities can also include the acquisition and sale of other assets such as vehicles,
property or equipment. Council’s planned expenditure on capital renewal, upgrade or expansion works is
$65.9 million. It also assumes that all capital works expenditure will be spent in 2020/21.
Financing Activities
Financing activities refer to cash generated or used in the financing of Council functions and can include
borrowings from financial institutions and advancing of repayable loans to other organisations.
Cash at End of Year
This is the net result of all financial activities of Council and we expect it to reduce by a net $34.8 million
over the next 4 years. Overall, total cash and investments are forecast to increase by $3.2 million to $72.7
million as at 30 June 2021 comparatively to last year’s budget. This is consistent with Council’s
expectations.
CAPITAL WORKS
Council manages more than $2.4 billion in assets and infrastructure such as land, buildings, roads,
footpaths, and drainage systems on behalf of the community. These assets support the services that
Council delivers to the community such as aged care, leisure and culture, child, family and youth
services, libraries, major festivals and events, parks and open space, planning, governance, waste
management and recycling. The Capital Works Statement outlines the level of expenditure that will add to
Council’s asset base or renew existing assets for which Council has responsibility.
The assumptions affecting asset renewal, expansion, upgrade and new assets are:
Asset renewal
Council has developed an Asset Management Strategy based on the knowledge provided by the asset
management plan, which sets out the capital expenditure requirements of Council for the next 10 years
by class of asset. The Strategy predicts infrastructure consumption, renewal needs, and other
infrastructure needs to meet future community service expectations. A key objective of the strategy is to
renew existing assets in line with asset management plans to ensure they are maintained at the desired
condition levels.
Asset renewal modelling based on best currently available information is indicating Kingston has
sustainable funding (with grant incomes) in the short term (next 5 years) and continues on track over the
next ten years. However, beyond year ten a continuation of rate capping will cause ever increasing
pressure on ongoing management of sustainable asset renewal practises.

Strategic Resource Plan 2020-2024
CITY OF KINGSTON
PAGE 14 CITY OF KINGSTON STRATEGIC RESOURCE PLAN
Capital expenditure program
Kingston is committed to optimising its infrastructure and community assets and recognises their
importance in achieving better services to meet the social, economic and environmental needs of the
community now, while sustaining resources for future generations.
HUMAN RESOURCES
Our people are our most valued resource. At the City of Kingston, we are committed to governing
Kingston in a way that is well informed, responsible, accountable, and transparent and involves and
draws inspiration from the community. Our responsible stewardship of the community’s resources is
inherent in everything we do. We foster a corporate culture that promotes service excellence and
community inspired leadership.
The outlook period includes allowances for the following factors:
• An allowance for the Enterprise Bargaining Agreement (EBA);
• anticipated near full employment rates at Council;
• estimated full time equivalent (FTE) staffing levels.
FINANCIAL OUTCOMES
The following financial indicators summarise the key financial outcomes for the next four years as set out
in the SRP for the 2020-2024 period. The attached Appendix includes the financial statements and other
financial disclosures required by the Act and Regulations.
Key to Forecast Trend:
+ Forecasts an improvement in Council’s Financial Performance / Indicator
= Forecasts that Council’s Financial Performance / Indicator will be steady
- Forecasts deterioration in Council’s Financial Performance / Indicator
Budget Budget Trend
2019/20 2020/21 2021/22 2022/23 2023/24 +/o/-
Adjusted underlying resultAdjusted underlying surplus (deficit) / Adjusted
underlying revenue1 8.5% 3.2% 7.1% 6.6% 5.7% -
Liquidity
Working Capital Current assets / current liabilities 2 203.6% 251.1% 218.8% 214.7% 222.5% -
Unrestricted cash Unrestricted cash / current liabilities 3 161.4% 167.9% 114.8% 90.2% 77.3% -
Obligations
Loans and borrowings Interest bearing loans and borrowings / rate revenue 4 1.2% 0.0% 0.0% 0.0% 0.0% +
Loans and borrowingsInterest and principal repayments on interest bearing
loans and borrowings / rate revenue2.6% 1.1% 0.0% 0.0% 0.0% +
Indebtedness Non-current liabilities / own source revenue 1.1% 5.5% 4.9% 4.5% 4.2% +
Asset renewal Asset renewal expenses / Asset depreciation 5 142.3% 127.1% 153.2% 125.2% 113.8% -
Stability
Rates concentration Rate revenue / adjusted underlying revenue 6 68.6% 66.9% 68.4% 68.7% 68.9% =
Rates effortRate revenue / CIV of rateable properties in the
municipality0.2% 0.2% 0.2% 0.2% 0.2% =
Efficiency
Expenditure level Total expenses/ no. of property assessments $2,568 $2,736 $2,762 $2,818 $2,881 -
Revenue levelResidential rate revenue / no. of residential property
assessments$1,924 $1,887 $2,029 $2,070 $2,103 -
Workforce turnoverNo. of permanent staff resignations & terminations /
average no. of permanent staff for the financial year10.2% 11.6% 11.6% 11.6% 11.6% =
Indicator Measure
No
tes Strategic Resource Plan
Projections
Operating position
Strategic Resource Plan 2020-2024
CITY OF KINGSTON
CITY OF KINGSTON STRATEGIC RESOURCE PLAN PAGE 15
Notes to indicators
1 Adjusted underlying result – An indicator of the sustainable operating result required to enable
Council to continue to provide core services and meet its objectives. Financial performance is
slowly decreasing over the period.
2 Working Capital – The proportion of current liabilities represented by current assets. Working
capital is forecast to decrease over the period of the Strategic Resource Plan.
3 Unrestricted Cash – An indicator of Council’s ability to pay its short term liabilities using cash and
cash equivalents other than restricted cash (identified for specific purpose). Council’s unrestricted
cash is declining over the period.
4 Debt compared to rates – Trend indicates Council's reducing reliance on debt against its annual
rate revenue through redemption of long-term debt.
5 Asset renewal – This percentage indicates the extent of Council's renewals against its
depreciation charge (an indication of the decline in value of its existing capital assets). A
percentage greater than 100 indicates Council is adequately maintaining its existing assets, while a
percentage less than 100 means its assets are deteriorating faster than they are being renewed
and future capital expenditure will be required to renew assets.
6 Rates concentration – Reflects extent of reliance on rate revenues to fund all of Council's on-
going services. Trend indicates Council will remain reliant on rate revenue when compared to all
other revenue sources.
ACHIEVEMENTS OF THE SRP OBJECTIVES
The overall objective of the SRP is financial sustainability in the medium to long term, while still providing
sufficient resources to achieve the Council Plan strategic objectives. The financial outcomes of the SRP
are set out below under each of the key objectives which underpin the SRP over the next four years.
1. Maintain existing service levels (objective: achieved)
Service levels have been maintained throughout the four year period after allowing for the
impact of inflation and other cost indexation.
2. Maintain operating financial sustainability (objective: achieved)
Financial performance is slowly decreasing over the period. To maintain the long term
financial sustainability, Council continues to monitor increased operating costs by maintaining
staff levels at prior year unless justified by a business case or alternative source of funding,
by increasing efficiencies through technology, and by maintaining materials and services
expenditure at prior year unless due to a contracted cost escalation clause whilst increasing
or maintaining the existing fees and charges at market levels unless set by the other levels of
government.
3. Maintain a sustainable capital expenditure program (objective: achieved)
Kingston is a participant and supporter of the MAV STEP Program for continuous
improvement of Asset Management capability. Kingston has achieved the milestone goal of
reaching “Core Maturity” in the National Asset Management Assessment Framework
Strategic Resource Plan 2020-2024
CITY OF KINGSTON
PAGE 16 CITY OF KINGSTON STRATEGIC RESOURCE PLAN
(NAMAF) and is committed to achieving best practise outcomes for the management of its
community assets.
4. Achieve a balanced budget on a cash basis (objective: not achieved)
The net change in cash is forecast to reduce by $34.8 million over the next 4 years. This is
because Council is utilizing its cash reserves to fund a robust and extensive capital works
program in each of the 4 years of the SRP.

Strategic Resource Plan 2020-2024
CITY OF KINGSTON
CITY OF KINGSTON STRATEGIC RESOURCE PLAN PAGE 17
CONCLUSION
Overall the SRP shows that Council is financially sustainable in the medium to long term, while still
providing sufficient resource to achieve the Council Plan strategic objectives.
.

Strategic Resource Plan 2020-2024
CITY OF KINGSTON
PAGE 18 CITY OF KINGSTON STRATEGIC RESOURCE PLAN
APPENDIX: THE FINANCIAL STATEMENTS
The following pages include the financial statements and other financial disclosures required by the Act
and Regulations. It includes:
• Comprehensive Income Statement;
• Balance Sheet;
• Statement of Changes in Equity;
• Statement of Cash Flows;
• Statement of Capital Works;
• Statement of Human Resources;
• Budgeted Summary of Planned Human Resource Expenditure;
• Budgeted Summary of Planned Human Resource Full Time Equivalent; and
• Four year Capital Works program by asset expenditure type and funding sources.
Detailed explanations of movements in the items shown in these statements can be found in Council’s Draft
2020/21 Budget.
Strategic Resource Plan 2020-2024
CITY OF KINGSTON
CITY OF KINGSTON STRATEGIC RESOURCE PLAN PAGE 19
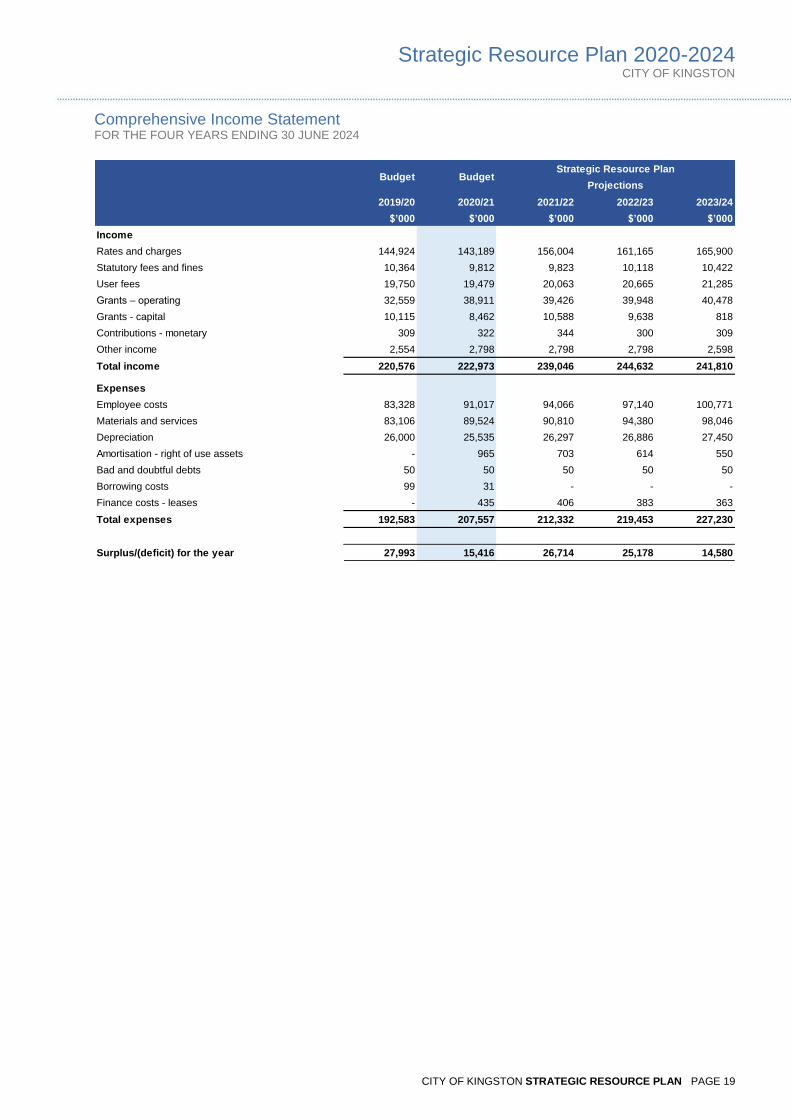
Comprehensive Income Statement FOR THE FOUR YEARS ENDING 30 JUNE 2024
2019/20 2020/21 2021/22 2022/23 2023/24
$’000 $’000 $’000 $’000 $’000
Income
Rates and charges 144,924 143,189 156,004 161,165 165,900
Statutory fees and fines 10,364 9,812 9,823 10,118 10,422
User fees 19,750 19,479 20,063 20,665 21,285
Grants – operating 32,559 38,911 39,426 39,948 40,478
Grants - capital 10,115 8,462 10,588 9,638 818
Contributions - monetary 309 322 344 300 309
Other income 2,554 2,798 2,798 2,798 2,598
Total income 220,576 222,973 239,046 244,632 241,810
Expenses
Employee costs 83,328 91,017 94,066 97,140 100,771
Materials and services 83,106 89,524 90,810 94,380 98,046
Depreciation 26,000 25,535 26,297 26,886 27,450
Amortisation - right of use assets - 965 703 614 550
Bad and doubtful debts 50 50 50 50 50
Borrowing costs 99 31 - - -
Finance costs - leases - 435 406 383 363
Total expenses 192,583 207,557 212,332 219,453 227,230
Surplus/(deficit) for the year 27,993 15,416 26,714 25,178 14,580
Budget BudgetStrategic Resource Plan
Projections
G9

Strategic Resource Plan 2020-2024
CITY OF KINGSTON
PAGE 20 CITY OF KINGSTON STRATEGIC RESOURCE PLAN
Balance Sheet FOR THE FOUR YEARS ENDING 30 JUNE 2024
2019/20 2020/21 2021/22 2022/23 2023/24
$’000 $’000 $’000 $’000 $’000
Assets
Current assets
Cash and cash equivalents 69,546 72,711 51,995 42,642 37,857
Trade and other receivables 8,066 24,922 33,419 42,197 51,235
Other assets - 1,652 1,652 1,652 1,652
Total current assets 77,612 99,285 87,066 86,491 90,744
Non-current assets
Trade and other receivables 20 - - - -
Property, infrastructure, plant &
equipment2,521,036 2,456,720 2,496,134 2,522,557 2,533,552
Right-of-use assets - 8,858 8,155 7,541 6,992
Investment property - 4,473 4,473 4,473 4,473
Intangible assets - 882 882 882 882
Total non-current assets 2,521,056 2,470,933 2,509,644 2,535,453 2,545,899
Total assets 2,598,668 2,570,218 2,596,710 2,621,944 2,636,643
Liabilities
Current liabilities
Trade and other payables 14,128 13,293 13,621 14,157 14,707
Trust funds and deposits 3,184 6,310 6,310 6,310 6,310
Provisions 19,414 19,389 19,389 19,389 19,389
Interest-bearing liabilities 1,395 - - - -
Lease liabilities - 550 480 432 382
Total current liabilities 38,121 39,542 39,800 40,288 40,788
Non-current liabilities
Provisions 1,547 1,070 1,070 1,070 1,070
Interest-bearing liabilities 346 - - - -
Lease liabilities - 8,669 8,189 7,757 7,376
Total non-current liabilities 1,893 9,739 9,259 8,827 8,446
Total liabilities 40,014 49,281 49,059 49,115 49,234
Net assets 2,558,654 2,520,937 2,547,651 2,572,829 2,587,409
Equity
Accumulated surplus 1,428,976 1,469,081 1,501,561 1,526,859 1,538,623
Asset revaluation reserve 1,105,315 1,025,000 1,025,000 1,025,000 1,025,000
Other Reserves 24,363 26,856 21,090 20,970 23,786
Total equity 2,558,654 2,520,937 2,547,651 2,572,829 2,587,409
Budget BudgetStrategic Resource Plan
Projections

Strategic Resource Plan 2020-2024
CITY OF KINGSTON
CITY OF KINGSTON STRATEGIC RESOURCE PLAN PAGE 21
Statement of Changes in Equity FOR THE FOUR YEARS ENDING 30 JUNE 2024
TotalAccumulated
Surplus
Revaluation
Reserve
Other
Reserves
2020 Forecast Actual $’000 $’000 $’000 $’000
Balance at beginning of the financial year 2,479,646 1,418,060 1,025,000 36,586
Impact of adoption of new accounting standards - - - -
Adjusted opening balance 2,479,646 1,418,060 1,025,000 36,586
Surplus/(deficit) for the year 25,875 25,875 - -
Transfers to other reserves - (3,469) - 3,469
Transfers from other reserves - 9,637 - (9,637)
Balance at end of the financial year 2,505,521 1,450,103 1,025,000 30,418
Budget 2020/21
Balance at beginning of the financial year 2,505,521 1,450,103 1,025,000 30,418
Surplus/(deficit) for the year 15,416 15,416 - -
Net asset revaluation increment/(decrement) - - - -
Transfers to other reserves - (3,519) - 3,519
Transfers from other reserves - 7,081 - (7,081)
Balance at end of the financial year 2,520,937 1,469,081 1,025,000 26,856
Budget 2021/22
Balance at beginning of the financial year 2,520,937 1,469,081 1,025,000 26,856
Surplus/(deficit) for the year 26,714 26,714 - -
Net asset revaluation increment/(decrement) - - - -
Transfers to other reserves - (3,575) - 3,575
Transfers from other reserves - 9,341 - (9,341)
Balance at end of the financial year 2,547,651 1,501,561 1,025,000 21,090
Budget 2022/23
Balance at beginning of the financial year 2,547,651 1,501,561 1,025,000 21,090
Surplus/(deficit) for the year 25,178 25,178 - -
Net asset revaluation increment/(decrement) - - - -
Transfers to other reserves - (3,640) - 3,640
Transfers from other reserves - 3,760 - (3,760)
Balance at end of the financial year 2,572,829 1,526,859 1,025,000 20,970
Budget 2023/24
Balance at beginning of the financial year 2,572,829 1,526,859 1,025,000 20,970
Surplus/(deficit) for the year 14,580 14,580 - -
Net asset revaluation increment/(decrement) - - - -
Transfers to other reserves - (3,706) - 3,706
Transfers from other reserves - 890 - (890)
Balance at end of the financial year 2,587,409 1,538,623 1,025,000 23,786

Strategic Resource Plan 2020-2024
CITY OF KINGSTON
PAGE 22 CITY OF KINGSTON STRATEGIC RESOURCE PLAN
Statement of Cash Flows FOR THE FOUR YEARS ENDING 30 JUNE 2024
Budget Budget
2019/20 2020/21 2021/22 2022/23 2023/24
$’000 $’000 $’000 $’000 $’000
Inflows Inflows Inflows Inflows Inflows
(Outflows) (Outflows) (Outflows) (Outflows) (Outflows)
Cash flows from operating activities
Rates and charges 144,789 136,030 148,203 153,106 157,605
Statutory fees and fines 10,364 9,567 9,577 9,865 10,161
User fees 19,750 18,992 19,561 20,148 20,753
Grants – operating 32,559 38,911 39,426 39,948 40,478
Grants - capital 10,115 8,462 10,588 9,638 818
Contributions - monetary 309 321 345 300 309
Other receipts 2,554 2,798 2,798 2,798 2,598
Employee costs (83,328) (91,017) (94,066) (97,140) (100,771)
Materials and services (83,156) (89,002) (90,482) (93,845) (97,496)
Net cash provided by/(used in) operating
activities 53,957 35,062 45,950 44,818 34,455
Cash flows from investing activities
Payments for property, infrastructure, plant and
equipment (74,656) (58,909) (65,809) (53,408) (38,545)
Proceeds from sale of property, infrastructure, plant
and equipment 100 100 100 100 100
Net cash provided by/ (used in) investing
activities(74,556) (58,809) (65,709) (53,308) (38,445)
Cash flows from financing activities
Finance costs (99) (31) - - -
Repayment of borrowings (3,608) (1,517) - - -
Interest paid - lease liability - (435) (407) (383) (363)
Repayment of lease liabilities - (785) (550) (480) (432)
Net cash provided by/(used in) financing
activities (3,707) (2,768) (957) (863) (795)
Net increase/(decrease) in cash & cash
equivalents(24,306) (26,515) (20,716) (9,353) (4,785)
Cash and cash equivalents at the beginning of the
financial year 93,852 99,226 72,711 51,995 42,642
Cash and cash equivalents at the end of the
financial year 69,546 72,711 51,995 42,642 37,857
Strategic Resource Plan
Projections

Strategic Resource Plan 2020-2024
CITY OF KINGSTON
CITY OF KINGSTON STRATEGIC RESOURCE PLAN PAGE 23
Statement of Capital Works FOR THE FOUR YEARS ENDING 30 JUNE 2024
Budget Budget
2019/20 2020/21 2021/22 2022/23 2023/24
$’000 $’000 $’000 $’000 $’000
Property
Land 2,000 1,460 - - -
Land improvements 1,710 305 250 265 -
Total land 3,710 1,765 250 265 -
Buildings 350 2,054 4,656 3,450 -
Building improvements 34,850 20,669 34,277 29,181 23,478
Total buildings 35,200 22,723 38,933 32,631 23,478
Total property 38,910 24,488 39,183 32,896 23,478
Plant and equipment
Plant, machinery and equipment 300 300 300 300 300
Fixtures, fittings and furniture 1,810 3,458 1,525 275 275
Computers and telecommunications 2,477 1,736 1,190 2,590 1,060
Library books 1,077 1,099 1,121 1,143 1,166
Total plant and equipment 5,664 6,592 4,136 4,308 2,801
Infrastructure
Roads 6,409 6,583 6,584 7,353 6,733
Bridges - 100 400 - -
Footpaths and cycleways 7,093 3,478 2,265 1,290 1,335
Drainage 4,255 6,259 4,970 4,475 5,000
Rec, leisure and comm facilities 10,140 10,271 5,868 3,140 1,773
Parks, open space and streetscapes 7,050 6,114 8,490 5,672 4,150
Off street car parks 1,125 1,210 600 - -
Other infrastructure 1,010 815 315 1,275 275
Total infrastructure 37,082 34,829 29,492 23,205 19,266
Total capital works expenditure 81,656 65,909 72,811 60,409 45,545
Expenditure types represented by:
New asset expenditure 17,571 13,271 12,136 6,990 950
Asset renewal expenditure 36,110 32,447 40,285 33,658 31,240
Asset expansion expenditure 5,879 2,406 3,090 6,599 495
Asset upgrade expenditure 20,786 16,844 16,268 12,731 12,445
Non asset 1,310 941 1,031 431 415
Total capital works expenditure 81,656 65,909 72,811 60,409 45,545
Funding sources represented by:
Grants 9,631 8,187 10,588 9,638 818
Contributions 484 275 - - -
Council reserves 10,669 7,081 9,341 3,760 890
Council cash 60,872 50,366 52,882 47,011 43,837
Total capital works expenditure 81,656 65,909 72,811 60,409 45,545
Strategic Resource Plan
Projections
Strategic Resource Plan 2020-2024
CITY OF KINGSTON
PAGE 24 CITY OF KINGSTON STRATEGIC RESOURCE PLAN
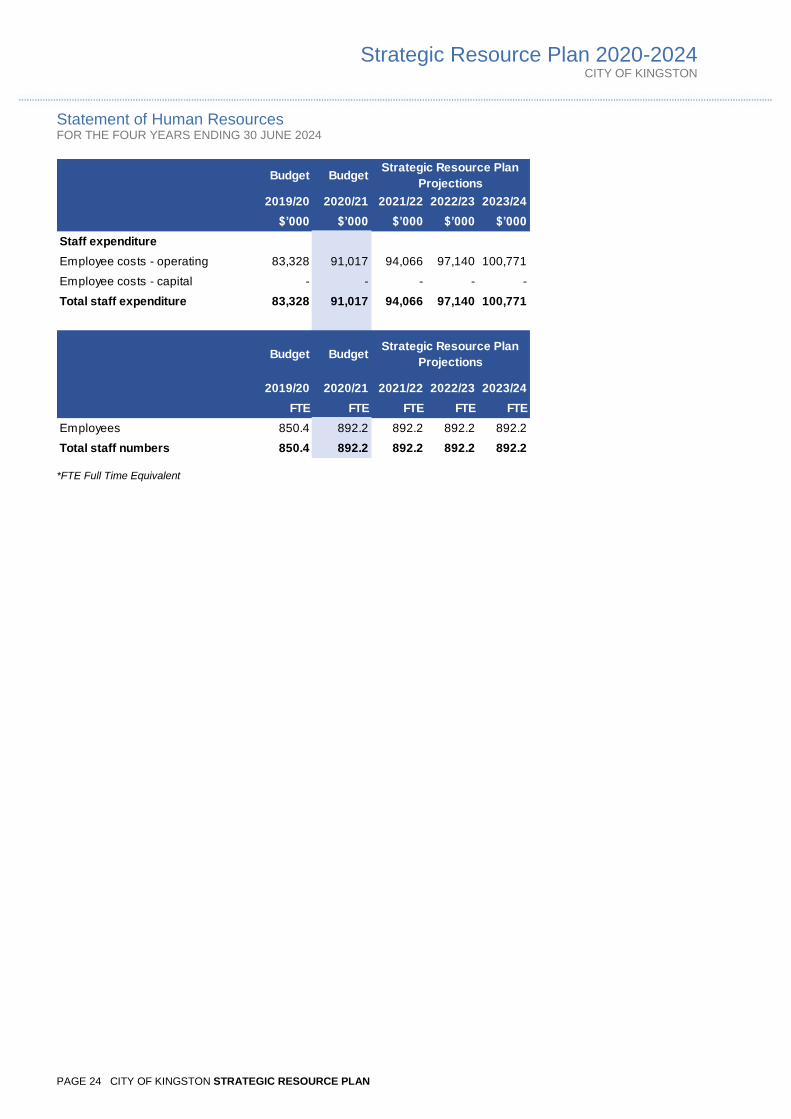
Statement of Human Resources FOR THE FOUR YEARS ENDING 30 JUNE 2024
*FTE Full Time Equivalent
Budget Budget
2019/20 2020/21 2021/22 2022/23 2023/24
$’000 $’000 $’000 $’000 $’000
Staff expenditure
Employee costs - operating 83,328 91,017 94,066 97,140 100,771
Employee costs - capital - - - - -
Total staff expenditure 83,328 91,017 94,066 97,140 100,771
Budget Budget
2019/20 2020/21 2021/22 2022/23 2023/24
FTE FTE FTE FTE FTE
Employees 850.4 892.2 892.2 892.2 892.2
Total staff numbers 850.4 892.2 892.2 892.2 892.2
Strategic Resource Plan
Projections
Strategic Resource Plan
Projections

Strategic Resource Plan 2020-2024
CITY OF KINGSTON
CITY OF KINGSTON STRATEGIC RESOURCE PLAN PAGE 25
Budgeted Summary of Planned Human Resources Expenditure FOR THE FOUR YEARS ENDING 30 JUNE 2024
Budget Budget
2019/20 2020/21 2021/22 2022/23 2023/24
Division $’000 $’000 $’000 $’000 $’000
Planning and Development
Permanent full time 10,069 12,342 12,755 13,172 13,665
Permanent part time 1,489 1,204 1,244 1,285 1,333
Total Planning and Development 11,558 13,546 14,000 14,457 14,998
Community Sustainability
Permanent full time 25,201 26,329 27,211 28,100 29,151
Permanent part time 11,759 14,967 15,468 15,974 16,571
Total Community Sustainability 36,960 41,296 42,679 44,074 45,722
Corporate Services
Permanent full time 9,384 11,794 12,189 12,587 13,058
Permanent part time 2,429 1,522 1,573 1,624 1,685
Total Corporate Services 11,812 13,316 13,762 14,212 14,743
City Assets and Environment
Permanent full time 11,044 12,225 12,635 13,047 13,535
Permanent part time 2,336 1,066 1,102 1,138 1,180
Total City Assets and Environment 13,380 13,291 13,736 14,185 14,715
Executive
Permanent full time 1,888 2,828 2,923 3,018 3,131
Permanent part time 0 0 0 0 0
Total Executive 1,888 2,828 2,923 3,018 3,131
Total Casuals and other 7,729 6,740 6,966 7,193 7,462
Total staff expenditure 83,328 91,017 94,066 97,140 100,771
Strategic Resource Plan
Projections
Strategic Resource Plan 2020-2024
CITY OF KINGSTON
PAGE 26 CITY OF KINGSTON STRATEGIC RESOURCE PLAN
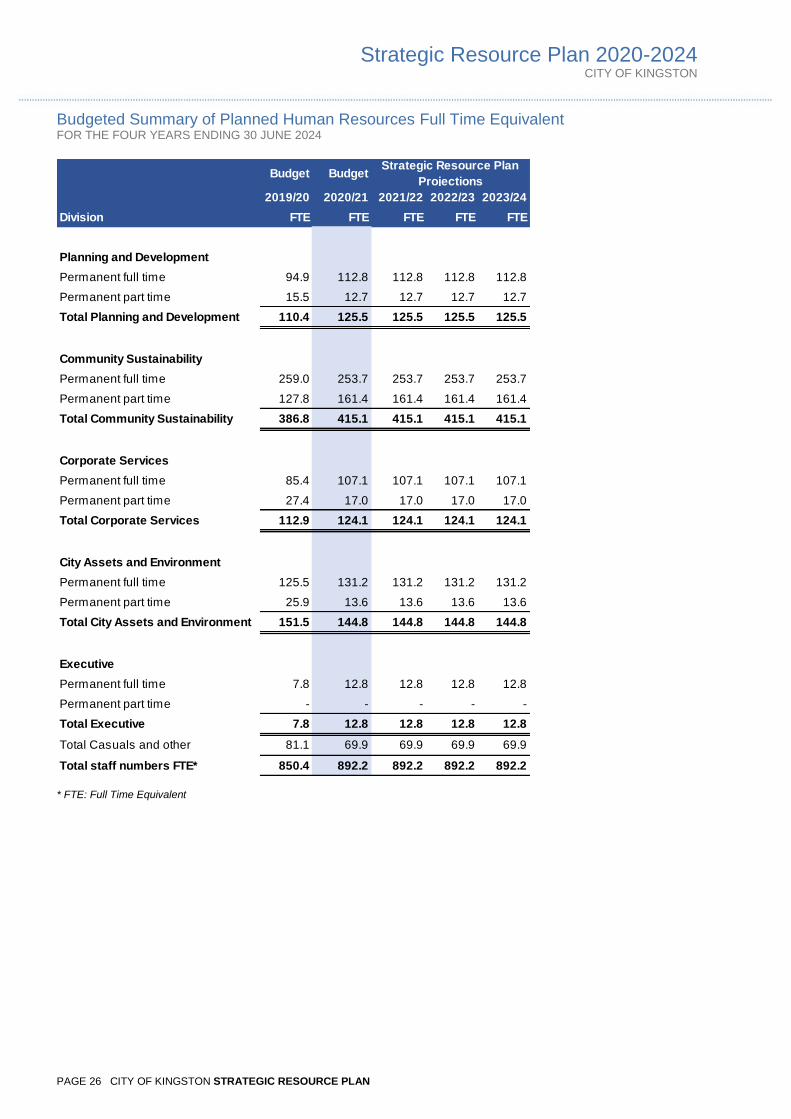
Budgeted Summary of Planned Human Resources Full Time Equivalent FOR THE FOUR YEARS ENDING 30 JUNE 2024
* FTE: Full Time Equivalent
Budget Budget
2019/20 2020/21 2021/22 2022/23 2023/24
Division FTE FTE FTE FTE FTE
Planning and Development
Permanent full time 94.9 112.8 112.8 112.8 112.8
Permanent part time 15.5 12.7 12.7 12.7 12.7
Total Planning and Development 110.4 125.5 125.5 125.5 125.5
Community Sustainability
Permanent full time 259.0 253.7 253.7 253.7 253.7
Permanent part time 127.8 161.4 161.4 161.4 161.4
Total Community Sustainability 386.8 415.1 415.1 415.1 415.1
Corporate Services
Permanent full time 85.4 107.1 107.1 107.1 107.1
Permanent part time 27.4 17.0 17.0 17.0 17.0
Total Corporate Services 112.9 124.1 124.1 124.1 124.1
City Assets and Environment
Permanent full time 125.5 131.2 131.2 131.2 131.2
Permanent part time 25.9 13.6 13.6 13.6 13.6
Total City Assets and Environment 151.5 144.8 144.8 144.8 144.8
Executive
Permanent full time 7.8 12.8 12.8 12.8 12.8
Permanent part time - - - - -
Total Executive 7.8 12.8 12.8 12.8 12.8
Total Casuals and other 81.1 69.9 69.9 69.9 69.9
Total staff numbers FTE* 850.4 892.2 892.2 892.2 892.2
Strategic Resource Plan
Projections

Strategic Resource Plan 2020-2024
CITY OF KINGSTON
CITY OF KINGSTON STRATEGIC RESOURCE PLAN PAGE 27
Capital Works Program FOR THE FOUR YEARS ENDING 30 JUNE 2024
Summary of planned capital works expenditure
Capital Works Area Project cost New Expansion Renewal UpgradeOS - Non-
Asset
Grants Rec'd
Prior
Grants To Be
Rec'd
Contrib's To
Be Rec''d
Council
Reserve'sBorrow’s Council Cash
$’000 $’000 $’000 $’000 $’000 $’000 $’000 $’000 $’000 $’000 $'000 $'000
PROPERTY
Land 500 - - - - 500 - - - - - 500
Land Improvements 305 - - - 305 - - - - - - 305
Total Land 805 - - - 305 500 - - - - - 805
Buildings 2,245 - - 1,571 673 - - - - - - 2,245
Heritage Buildings - - - - - - - - - - - -
Building Improvements 20,355 2,210 1,736 10,664 5,546 200 - 2,565 250 500 - 17,040
Leasehold Improvements - - - - - - - - - - - -
Total Buildings 22,600 2,210 1,736 12,235 6,220 200 - 2,565 250 500 - 19,285
Total Property 23,405 2,210 1,736 12,235 6,525 700 - 2,565 250 500 - 20,090
PLANT AND EQUIPMENT
Heritage Plant and Equipment - - - - - - - - - - - -
Plant, Machinery and Equipment 300 - 30 240 30 - - - - - - 300
Fixtures, Fittings and Furnniture 2,870 520 - 1,770 580 - - - - - - 2,870
Computers and TelComm 1,336 106 132 563 395 141 - - - - - 1,336
Library Books 1,099 - - 1,099 - - - - - - - 1,099
Total Plant and Equipment 5,605 626 162 3,672 1,005 141 - - - - - 5,605
INFRASTRUCTURE
Roads 6,558 915 205 5,206 232 - - 818 - - - 5,740
Bridges 100 100 - - - - - - - 100 - -
Footpaths and Cycleways 974 190 50 748 15- - - - - - - 974
Drainage 5,393 - - 2,324 3,019 50 - - - 350 - 5,043
Rec, Leisure and Comm Facillities 9,711 3,956 156 3,084 2,516 - - 2,297 - 2,840 - 4,574
Waste Management - - - - - - - - - - - -
Parks, Open Space and Streetscapes 5,412 1,655 - 2,349 1,309 100 - - - 700 - 4,712
Aerodromes - - - - - - - - - - - -
Off Street Car Parks 480 30 - 75 75 300 - - 25 - - 455
Other Infrastructure 815 215 - 450 150 - - - - - - 815
TOTAL INFRASTRUCTURE 29,442 7,061 411 14,235 7,285 450 - 3,115 25 3,990 - 22,312
TOTAL NEW CAPITAL WORKS 58,452 9,897 2,308 30,142 14,815 1,291 - 5,680 275 4,490 - 48,007
Summary of funding sources
Part 1 - New Capital Works 2020/21
Asset expenditure type

Strategic Resource Plan 2020-2024
CITY OF KINGSTON
CITY OF KINGSTON STRATEGIC RESOURCE PLAN PAGE 28
Capital Works Area Project cost New Expansion Renewal UpgradeOS - Non-
Asset
Grants Rec'd
Prior
Grants To Be
Rec'd
Contrib's To
Be Rec''d
Council
Reserve'sBorrow’s Council Cash
$’000 $’000 $’000 $’000 $’000 $’000 $’000 $’000 $’000 $’000 $'000 $'000
PROPERTY
Land 960 1,400 - - - (440) - - - - - 960
Land Improvements - - - - - - - - - - - -
Total Land 960 1,400 - - - (440) - - - - - 960
Buildings (191) - - (197) (84) 90 - 2,507 500 - (3,197)
Heritage buildings - - - - - - - - - - - -
Building Improvements 314 125 (369) 672 (115) - - - - - - 314
Leasehold Improvements - - - - - - - - - - - -
Total Buildings 123 125 (369) 475 (199) 90 - 2,507 - 500 - (2,884)
Total Property 1,083 1,525 (369) 475 (199) (350) - 2,507 - 500 - (1,924)
PLANT AND EQUIPMENT
Heritage Plant and Equipment - - - - - - - - - - - -
Plant, Machinery and Equipment - - - - - - - - - - - -
Fixtures, Fittings and Furniture 588 (433) - 782 239 - - - - - - 588
Computers and TelComm 400 - 40 200 160 - - - - - - 400
Library Books - - - - - - - - - - - -
TOTAL PLANT AND EQUIP 988 (433) 40 982 399 - - - - - - 988
INFRASTRUCTURE
Roads 25 25 - - - - - - - - - 25
Bridges - - - - - - - - - - - -
Footpaths and Cycleways 2,504 1,826 - 152 526 - - - - - - 2,504
Drainage 866 - - 206 660 - - - - - - 866
Rec, Leisure and Comm Facillities 560 (347) 426 113 368 - - - - 2,091 - (1,531)
Waste Management - - - - - - - - - - - -
Parks, Open Space and Streetscapes 701 47 - 378 276 - - - - - - 701
Aerodromes - - - - - - - - - - - -
Off Street Car Parks 730 730 - - - - - - - - - 730
Other Infrastructure - - - - - - - - - - - -
TOTAL INFRASTRUCTURE 5,386 2,281 426 849 1,830 - - - - 2,091 - 3,295
TOTAL CARRIED OVER 2019/20 7,457 3,374 98 2,305 2,030 (350) - 2,507 - 2,591 - 2,359
TOTAL CAPITAL WORKS 2020/21 65,909 13,271 2,406 32,447 16,844 941 - 8,187 275 7,081 - 50,366
Summary of funding sources
Part 1 - CARRY OVER WORKS 2019/20
Asset expenditure type

Strategic Resource Plan 2020-2024
CITY OF KINGSTON
CITY OF KINGSTON STRATEGIC RESOURCE PLAN PAGE 29
Capital Works Area Project cost New Expansion Renewal UpgradeOS - Non-
Asset
Grants Rec'd
Prior
Grants To Be
Rec'd
Contrib's To
Be Rec''d
Council
Reserve'sBorrow’s Council Cash
$’000 $’000 $’000 $’000 $’000 $’000 $’000 $’000 $’000 $’000 $'000 $'000
PROPERTY
Land - - - - - - - - - - - -
Land Improvements 250 - - - 250 - - - - - - 250
Total Land 250 - - - 250 - - - - - - 250
Buildings 4,656 3,600 - 740 317 - - - - 1,500 - 3,156
Heritage Buildings - - - - - - - - - - - -
Building Improvements 34,277 2,235 2,174 22,519 7,150 200 - 9,270 - - - 25,007
Leasehold Improvements - - - - - - - - - - - -
Total Buildings 38,933 5,835 2,174 23,258 7,466 200 - 9,270 - 1,500 - 28,163
Total Property 39,183 5,835 2,174 23,258 7,716 200 - 9,270 - 1,500 - 28,413
PLANT AND EQUIPMENT
Heritage Plant and Equipment - - - - - - - - - - - -
Plant, Machinery and Equipment 300 - 30 240 30 - - - - - - 300
Fixtures, Fittings and Furnniture 1,525 125 - 1,075 325 - - - - - - 1,525
Computers and TelComm 1,190 20 132 563 395 81 - - - - - 1,190
Library Books 1,121 - - 1,121 - - - - - - - 1,121
Total Plant and Equipment 4,136 145 162 2,999 750 81 - - - - - 4,136
INFRASTRUCTURE
Roads 6,584 1,206 205 4,968 205 - - 818 - - - 5,766
Bridges 400 400 - - - - - - - 400 - -
Footpaths and Cycleways 2,265 1,190 50 888 138 - - - - - - 2,265
Drainage 4,970 - - 2,329 2,591 50 - - - 850 - 4,120
Rec, Leisure and Comm Facillities 5,868 1,800 500 1,579 1,989 - - 500 - 4,591 - 777
Waste Management - - - - - - - - - - - -
Parks, Open Space and Streetscapes 8,490 1,345 - 4,265 2,781 100 - - - 2,000 - 6,490
Aerodromes - - - - - - - - - - - -
Off Street Car Parks 600 - - - - 600 - - - - - 600
Other Infrastructure 315 215 - - 100 - - - - - - 315
TOTAL INFRASTRUCTURE 29,492 6,156 755 14,029 7,802 750 - 1,318 - 7,841 - 20,333
TOTAL NEW CAPITAL WORKS 72,811 12,136 3,090 40,285 16,268 1,031 - 10,588 - 9,341 - 52,882
Summary of funding sources
Part 1 - New Capital Works 2021/22
Asset expenditure type
Strategic Resource Plan 2020-2024
CITY OF KINGSTON
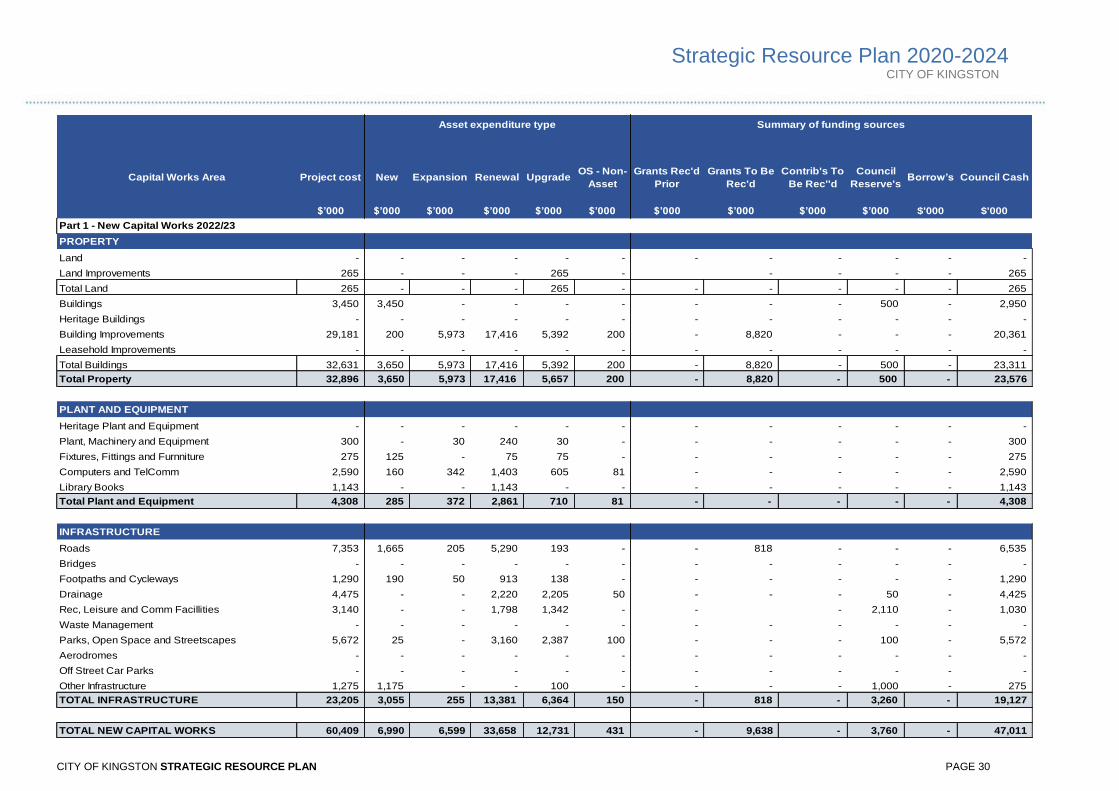
CITY OF KINGSTON STRATEGIC RESOURCE PLAN PAGE 30
Capital Works Area Project cost New Expansion Renewal UpgradeOS - Non-
Asset
Grants Rec'd
Prior
Grants To Be
Rec'd
Contrib's To
Be Rec''d
Council
Reserve'sBorrow’s Council Cash
$’000 $’000 $’000 $’000 $’000 $’000 $’000 $’000 $’000 $’000 $'000 $'000
PROPERTY
Land - - - - - - - - - - - -
Land Improvements 265 - - - 265 - - - - - 265
Total Land 265 - - - 265 - - - - - - 265
Buildings 3,450 3,450 - - - - - - - 500 - 2,950
Heritage Buildings - - - - - - - - - - - -
Building Improvements 29,181 200 5,973 17,416 5,392 200 - 8,820 - - - 20,361
Leasehold Improvements - - - - - - - - - - - -
Total Buildings 32,631 3,650 5,973 17,416 5,392 200 - 8,820 - 500 - 23,311
Total Property 32,896 3,650 5,973 17,416 5,657 200 - 8,820 - 500 - 23,576
PLANT AND EQUIPMENT
Heritage Plant and Equipment - - - - - - - - - - - -
Plant, Machinery and Equipment 300 - 30 240 30 - - - - - - 300
Fixtures, Fittings and Furnniture 275 125 - 75 75 - - - - - - 275
Computers and TelComm 2,590 160 342 1,403 605 81 - - - - - 2,590
Library Books 1,143 - - 1,143 - - - - - - - 1,143
Total Plant and Equipment 4,308 285 372 2,861 710 81 - - - - - 4,308
INFRASTRUCTURE
Roads 7,353 1,665 205 5,290 193 - - 818 - - - 6,535
Bridges - - - - - - - - - - - -
Footpaths and Cycleways 1,290 190 50 913 138 - - - - - - 1,290
Drainage 4,475 - - 2,220 2,205 50 - - - 50 - 4,425
Rec, Leisure and Comm Facillities 3,140 - - 1,798 1,342 - - - 2,110 - 1,030
Waste Management - - - - - - - - - - - -
Parks, Open Space and Streetscapes 5,672 25 - 3,160 2,387 100 - - - 100 - 5,572
Aerodromes - - - - - - - - - - - -
Off Street Car Parks - - - - - - - - - - - -
Other Infrastructure 1,275 1,175 - - 100 - - - - 1,000 - 275
TOTAL INFRASTRUCTURE 23,205 3,055 255 13,381 6,364 150 - 818 - 3,260 - 19,127
TOTAL NEW CAPITAL WORKS 60,409 6,990 6,599 33,658 12,731 431 - 9,638 - 3,760 - 47,011
Summary of funding sources
Part 1 - New Capital Works 2022/23
Asset expenditure type
Strategic Resource Plan 2020-2024
CITY OF KINGSTON
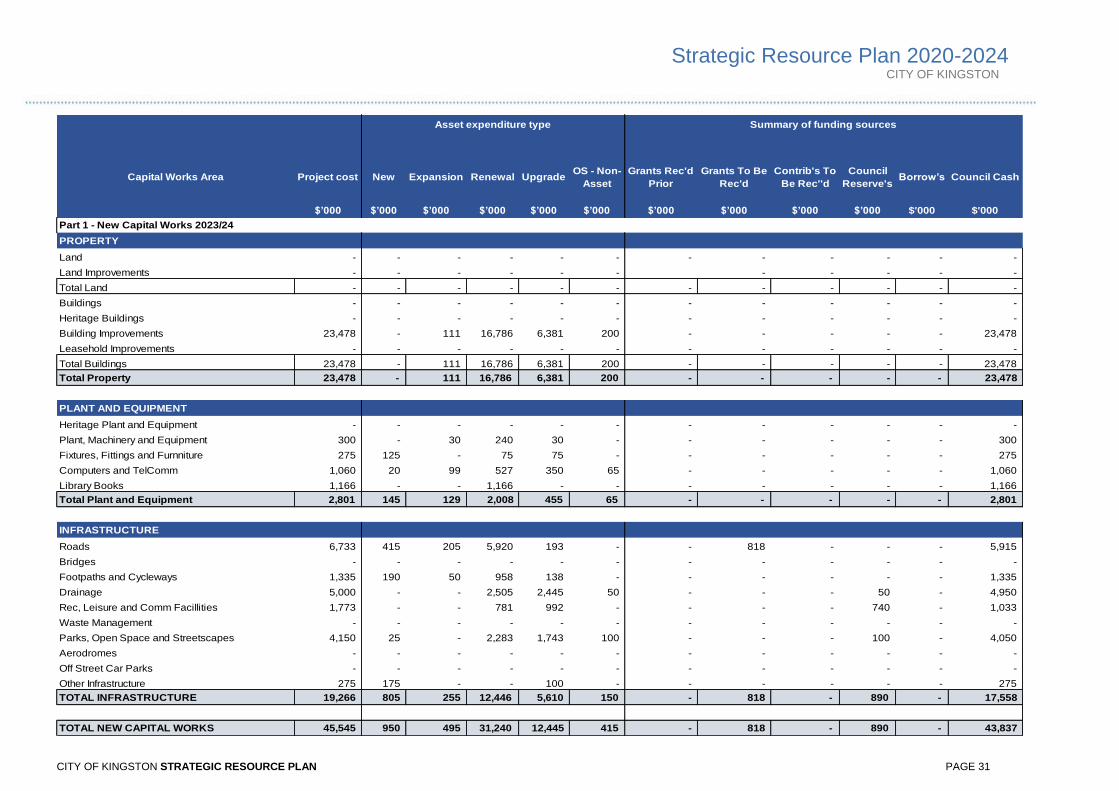
CITY OF KINGSTON STRATEGIC RESOURCE PLAN PAGE 31
Capital Works Area Project cost New Expansion Renewal UpgradeOS - Non-
Asset
Grants Rec'd
Prior
Grants To Be
Rec'd
Contrib's To
Be Rec''d
Council
Reserve'sBorrow’s Council Cash
$’000 $’000 $’000 $’000 $’000 $’000 $’000 $’000 $’000 $’000 $'000 $'000
PROPERTY
Land - - - - - - - - - - - -
Land Improvements - - - - - - - - - - -
Total Land - - - - - - - - - - - -
Buildings - - - - - - - - - - - -
Heritage Buildings - - - - - - - - - - - -
Building Improvements 23,478 - 111 16,786 6,381 200 - - - - - 23,478
Leasehold Improvements - - - - - - - - - - - -
Total Buildings 23,478 - 111 16,786 6,381 200 - - - - - 23,478
Total Property 23,478 - 111 16,786 6,381 200 - - - - - 23,478
PLANT AND EQUIPMENT
Heritage Plant and Equipment - - - - - - - - - - - -
Plant, Machinery and Equipment 300 - 30 240 30 - - - - - - 300
Fixtures, Fittings and Furnniture 275 125 - 75 75 - - - - - - 275
Computers and TelComm 1,060 20 99 527 350 65 - - - - - 1,060
Library Books 1,166 - - 1,166 - - - - - - - 1,166
Total Plant and Equipment 2,801 145 129 2,008 455 65 - - - - - 2,801
INFRASTRUCTURE
Roads 6,733 415 205 5,920 193 - - 818 - - - 5,915
Bridges - - - - - - - - - - - -
Footpaths and Cycleways 1,335 190 50 958 138 - - - - - - 1,335
Drainage 5,000 - - 2,505 2,445 50 - - - 50 - 4,950
Rec, Leisure and Comm Facillities 1,773 - - 781 992 - - - - 740 - 1,033
Waste Management - - - - - - - - - - - -
Parks, Open Space and Streetscapes 4,150 25 - 2,283 1,743 100 - - - 100 - 4,050
Aerodromes - - - - - - - - - - - -
Off Street Car Parks - - - - - - - - - - - -
Other Infrastructure 275 175 - - 100 - - - - - - 275
TOTAL INFRASTRUCTURE 19,266 805 255 12,446 5,610 150 - 818 - 890 - 17,558
TOTAL NEW CAPITAL WORKS 45,545 950 495 31,240 12,445 415 - 818 - 890 - 43,837
Summary of funding sources
Part 1 - New Capital Works 2023/24
Asset expenditure type

Strategic Resource Plan 2020-2024
CITY OF KINGSTON
PAGE 32 CITY OF KINGSTON STRATEGIC RESOURCE PLAN
[Intentionally blank]
Strategic Resource Plan 2020-2024
CITY OF KINGSTON
CITY OF KINGSTON STRATEGIC RESOURCE PLAN PAGE 33