strategies and guidelines for the cleansing and … · click to edit master title style strategies...
TRANSCRIPT

Click To Edit Master
Title Style
Strategies and Guidelines
for Cleansing and Analysis
of Building Energy Data
5/27/15

Panelists
Andrea Hessenius, Massachusetts Department
of Energy Resources
Tony O’Donnell, Sustainability Institute at the
College of New Jersey
Christine Liaukus, New Jersey Institute of
Technology
Scott Wagner, Consortium for Building Energy
Innovation

Select DOE Resources
WIP’s State and Local Solution Center
Data Cleansing Tutorial Tips and guidelines on techniques for identifying errors in benchmarking
data
Use methods from this tutorial to cleanse your dataset prior to analysis
energy.gov/eere/slsc/downloads/benchmarking-data-cleansing-rite-passage-along-benchmarking-journey
A Guide to Building Benchmarking Data Analysis Introductory level guide providing essentials for performing an analysis of
building benchmarking data
Use it to cleanse, parse and evaluate energy performance and costs of benchmarked building stock
Forthcoming on the State and Local Solution Center
Visit the State and Local Solution Center
energy.gov/eere/slsc
Sign up for TAP alerts: [email protected]

Andrea Hessenius
Massachusetts Dept. of Energy Resources
Creating A Cleaner Energy Future For the Commonwealth
Massachusetts Leading by Example’sStrategies and Methods for the
Cleansing DataBetter Buildings Challenge Summit
May 26, 2015
Andrea HesseniusGreen Communities Analyst, Leading by Example Program
Massachusetts Dept. of Energy Resources

Creating A Cleaner Energy Future For the Commonwealth
Key Discussion Points
• Leading by Example Program
• Snapshot of LBE’s Data
• Data Collecting & Cleaning
• Stories from the Datasets
• Analysis & Graphs
• Reporting & Benchmarking
• Key Takeaways
6

Creating A Cleaner Energy Future For the Commonwealth
Executive Order No. 484
• Sets short, medium, and long-term goals for state agencies:
– GHG emission reductions
– Energy reductions
– Renewable energy
– Water conservation
• Requires all new construction to meet Mass. LEED Plus Standard
• Includes executive agencies, authorities, community colleges and university campuses, Trial Court
Leading by Example—Clean Energy and Efficient Buildings
0% 25% 50% 75% 100%
GHG EmissionsReduction
Energy UseReductions
Use ofRenewable
Energy
EO
48
4 T
arg
ets
2012 2020 2050
Creating A Cleaner Energy Future For the Commonwealth
LBE Data Set in a Snapshot
• We worked closely with over 49 agencies, campuses, and authorities
• Data encompasses over 80 million square feet, includes office buildings, camp grounds, colleges and universities, treatment plants, correctional facilities
• Track over 40 different fuel types at various time intervals (annual, quarterly, monthly)
• Track multiple associated metrics including LEED certification, energy projects, on-site generation installations, weather data, student enrollment, etc
8

Creating A Cleaner Energy Future For the Commonwealth
Our Data Sources in a Snapshot
• LBE Tracking Forms
• Statewide Fuel Contracts
• MassEnergyInsight (MEI)
• Enterprise Energy Management System (EEMS)
• Fiscal data from the state accounting system
• Production Tracking System (PTS)
• Weather Normalized data set
• Clean Energy Results Program (CERP)
• Energy Project Database
• Capital Asset Management Information System (CAMIS)
• And many more!
9

Creating A Cleaner Energy Future For the Commonwealth
What type of metrics do we collect?• Greenhouse Gas Emissions
• Energy Use Intensity (EUI – kBtu/SF)
• Renewable % of total electricity
• Fuel consumption
• On-site generation (clean CHP and renewable), REC/ AEC accounting
• # of renewable installations
• # of LEED certified buildings by level
• LEED Building actual vs. projected
• Impacts of energy efficiency projects
• Clean energy investments
• Avoided costs
• Square Footage, Location
• Property Types & Uses
• Weather Degree Days
10
Statewide
By Secretariat
By Agency
By facility
By building (if possible)
Buildings vs. vehicles

Creating A Cleaner Energy Future For the Commonwealth
Collecting data
• There is no single solution, you need multiple approaches to solve many data needs
• Specify up front what you need to track
• Cross-checking data from different sources
• Very difficult to completely automate process
• Find the right system to store and collect data
• Staffing consistency is critical
11

Creating A Cleaner Energy Future For the Commonwealth
What is our data cleansing process?
Clean
Analyze
Collect
12
Collect
Clean
Analyze
1. Format data in a useful manner
• Data labeled and organized?
• Can we access the data?
• Do we have all the information?
2. Verify consistency both within data points and formulas/ calculations
• Is there consistency with site names and municipalities among datasets?
• Are we calculating baselines, weather normalization, energy rates?

Creating A Cleaner Energy Future For the Commonwealth
What is our data cleansing process?
Clean
Analyze
Collect
13
Collect
Clean
Analyze
3. Search for potential anomalies
• Is there a large discrepancy year to year that can’t be accounted for in the data?
• Are sites performing in similar patterns?
• Did we follow up, make edits, & revisit the data?
• Did we look at the whole picture or did we get lots in making the data perfect?
4. Document methodology
• Did we track our changes?
• Did we document our process?

Creating A Cleaner Energy Future For the Commonwealth
Stories from the Data
An easy place to start once the data is “clean” is to check the percentage change between years and between similar data sources. Being able to ground truth information is key in knowing that the dataset is valid
14
Comparing Datasets

Creating A Cleaner Energy Future For the Commonwealth
Stories from the Data
Watch out! Entering data in the wrong unit (barrels instead of gallons, dekatherms instead of therms, mlbs instead of kBtu) can drastically change numbers... Just like putting the comma or decimal in the wrong spot. A quick check some times is to see what the fuel rate ($/Usage) is in relation to the market?
15
Silly Fingers, Wrong Units, Extra Digits

Creating A Cleaner Energy Future For the Commonwealth
Stories from the Data
Building reports that can track errors are also very helpful. A computer system might provide a duplicate reading for an account or data might be lost. A simple percent difference report between past data in a system helps flag errors.
16
Machines also make mistakes

Creating A Cleaner Energy Future For the Commonwealth
Stories from the Data
Tracking fuels may go beyond building consumption for some partners. We’ve come across LNG use for fire trainings, #6 oil on marine training vessels, diesel for boating. We find it very helpful to know how fuels are consumed at state facilities as it affects some of our calculations.
17
You’re using that fuel to do what?

Creating A Cleaner Energy Future For the Commonwealth
Some Specific Data Challenges in MA data
• Annual Tracking forms provide annual data, not granular
– Not all agencies are capable of tracking own usage; frequent human errors
– Requires follow-up and corrections
• Tracking usage through utility accounts only gets to grid electricity & natural gas
– Lack of complete utility account data – how do we know what we don’t have
– Account numbers change, new accounts might be missing
– Don’t always know what buildings are on what accounts
– Multiple buildings on one account make it impossible to determine building performance
– Getting data from Municipal Light Plants may be difficult
18

Creating A Cleaner Energy Future For the Commonwealth
Some Specific Data Challenges in MA data
• Real time data through meters is restricted to individual locations
– Data quality issues, particularly for thermal meters
– Tracking implemented measures and cost-effectiveness can be difficult
– How to make real-time data useful and actionable
• Statewide Contracts provide limited information
– Oil data only loaded once a year and only provide delivery
– Competitive supply cost data not always available/ delayed
19

Creating A Cleaner Energy Future For the Commonwealth
Data Analysis• Compare data sets with annual information if available,
search for patterns or trends
• Different types of data allow for varied analysis (building vs. agency info)
• Multiple data sources may provide different, but still useful information
• Linking different data sources to provide insightful trends
• Continuously updating and verifying data set
20
6% 2%
-2%-4%
-8%
-14% -15%
-25% -24% -22% -
200
400
600
800
1,000
1,200
1,400
1,600
Baseline 2005 2006 2007 2008 2009 2010 2011 2012 2013 2014
Tho
usa
nd
s
GHG Emissions Reductions (metric tons)

Creating A Cleaner Energy Future For the Commonwealth
Graphs & Data Visualization
21
Platinum 1
Gold 25
Silver 10
Certified 1
State LEED Buildings -
200
400
600
800
1,000
1,200
1,400
1,600
Consumed (kWh) Generated (kWh)
Mill
ion
s Electricity Consumption (kWh)
Renewable Energy Credits (additional)
Total CHP generation
Renewable Energy (Solar, Wind, AD, Hydro)
total electricity consumption
LBE RE Target for FY2020
-
2,000
4,000
6,000
8,000
10,000
12,000
Inst
alle
d C
apac
ity
(kW
)
Solar PV Installations FY06-15
Creating A Cleaner Energy Future For the Commonwealth
Graphs & Data Visualization
22
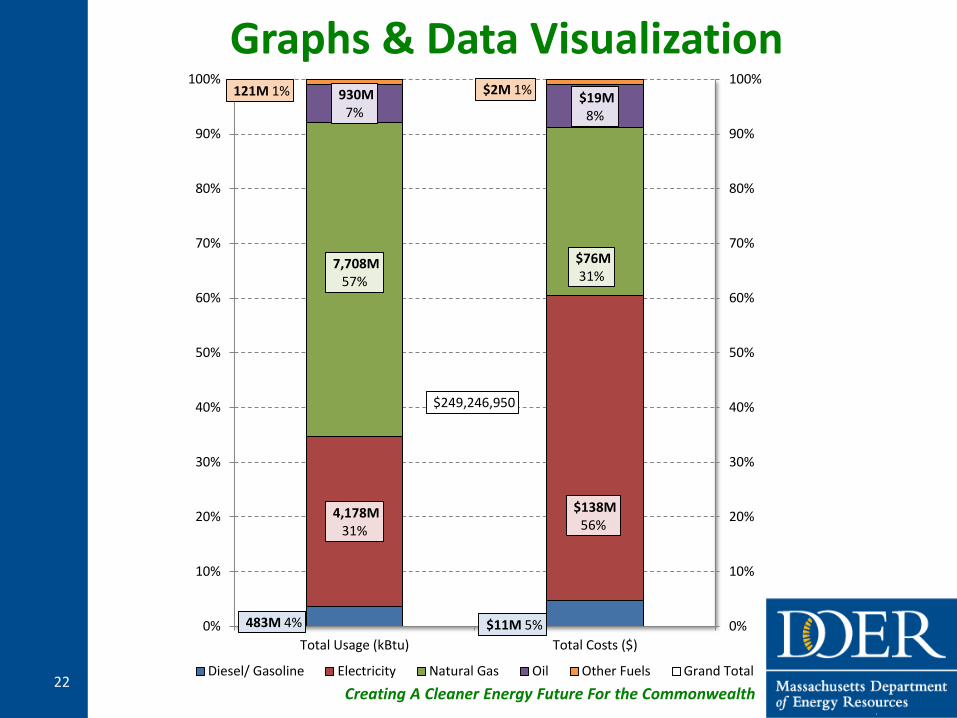
483M 4% $11M 5%
4,178M31%
$138M 56%
7,708M57%
$76M31%
930M7%
$19M8%
121M 1% $2M 1%
$249,246,950
0%
10%
20%
30%
40%
50%
60%
70%
80%
90%
100%
0%
10%
20%
30%
40%
50%
60%
70%
80%
90%
100%
Total Usage (kBtu) Total Costs ($)
Diesel/ Gasoline Electricity Natural Gas Oil Other Fuels Grand Total

Creating A Cleaner Energy Future For the Commonwealth
Graphs & Data Visualization
23
$200
$220
$240
$260
$280
$300
$320
FY2006 P2007 P2008 P2009 P2010 P2011 P2012 P2013 P2014
Mill
ion
s
Avoided Costs
Historic Fuel Trends 2006 ISO-NE Forecasting & Historic Fuel Trends Actual Expenditures

Creating A Cleaner Energy Future For the Commonwealth
Our Data Reporting & Benchmarking
1. Progress Reporting for LBE
Measure progress against executive order
Track other progress not required
2. Report to Better Buildings Challenge
Provide US DOE progress reports on EUI reduction
3. Track Agency Performance
Provide feedback to encourage participation
4. Provide Feedback at Facility Level
Compare performance inter- and intra-agency
5. Promote Targeted Building Level Efforts
Use building EUI to compare and prioritize
Promote better day-to-day operations
24

Creating A Cleaner Energy Future For the Commonwealth
Be Proactive Regarding Data Challenges!
• Identify the goals and metrics of the data analysis
• Specify up front what is needed to track
• Remember that multiple sources and solutions may be necessary, however high level data can still be useful
• Make sure to have a way of verifying data
• Use consistent baselines, retain flexibility to adjust (e.g. 3 year rolling averages)
• Keep track of your data source and any adjustments
• Hire/appoint dedicated staff with necessary skills
25
Key Takeaways

Creating A Cleaner Energy Future For the Commonwealth
Contact Information for Leading by Example
Andrea Hessenius, Green Communities Analyst617-626-7375/ [email protected]
Eric Friedman, Deputy Director, Green Communities DivisionDirector, Leading by Example Program
617-626-1034 / [email protected]
26

Tony O’Donnell, TCNJ
Christine Liaukus, NJIT

Data Cleansing and Analysis for
The New Jersey Public BuildingEnergy Efficiency Program
May 27, 2015
Tony O’Donnell, TCNJChristine Liaukus, NJIT
NJP BEEP
28

The New Jersey Public Buildings Energy Efficiency Program (NJP BEEP)
aims to reduce energy use public buildings by increasing thenumber of energy efficiency projects among
school districts and municipalities
NJP BEEP
29

Advantages• Mature program (since 2001) with great depth of
program offerings• Provides access statewide across all major utilitiesDrawbacks• Data is cost-oriented for management. As such, there
exists a poor connection between the absolute # of transactions and each individual customer
• Data is touched by many hands and is subject to significant variation in title
New Jersey Clean Energy Program (NJCEP)
30
NJ is fortunate to have a robust Clean Energy Program, but for local government units…• there is not a single point of entry
or• an easily identified path
NJP BEEP
31
• NJP BEEP is designed to create the framework for local government units to use the Clean Energy Program tailored to their building portfolio.
• This framework is based on data from current program users.
NJP BEEP
32
The foundation for NJP BEEP is the Local Government Energy Audit program (LGEA). The LGEAs included critical information on:• Which LGU’s* have participated• What their building inventory is• What energy conservation measures (ECMs) have
been recommended per entity and per building* - Local Government Units, defined as municipalities, school districts, and a variety of other entities in NJ with the power to own and operate facilities.
NJP BEEP
33
Other Clean Energy Program sources provided:
• What ECM’s have been implemented
Publicly available tax assessment data provided:
• Estimate of global public building inventory(the majority of which have not had an LGEA
done)
NJP BEEP
34

Data Cleansing and Analysis
For NJ this has been a three step process
35
Data Acquisition
Data Alignment
Data Analysis
36
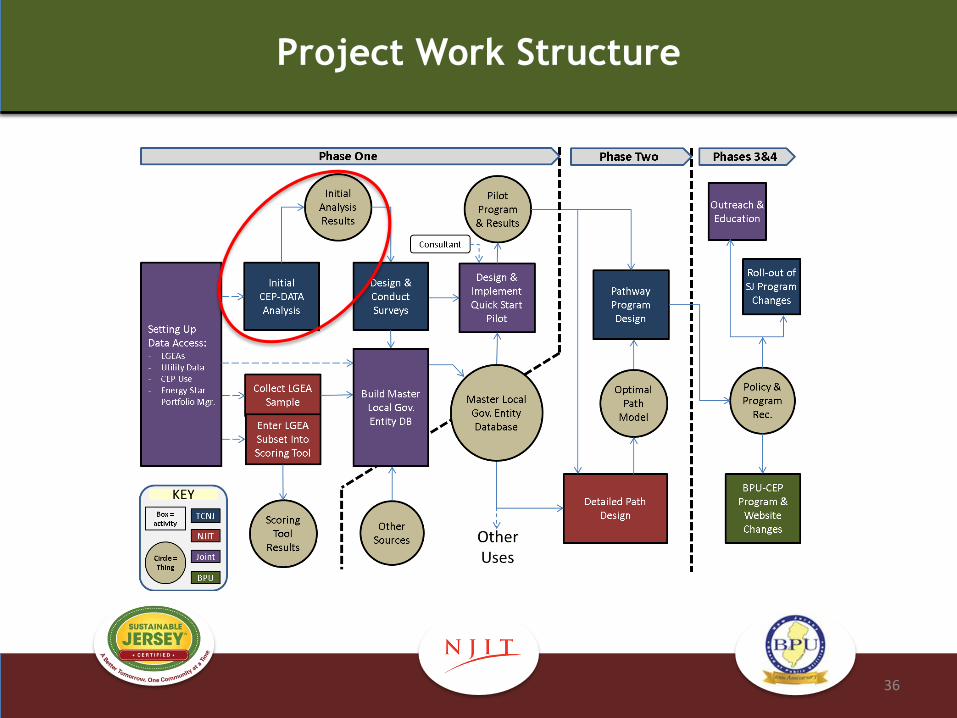
Project Work Structure

NJ-CEP Program Usage Analysis
37
186,909DetailedRecords
46,311SummaryRecords
34,254(74%)
Non-LGURecords
4,305(36%)
Rejected or CancelledRecords
12,059(26%)
LGU Only(Indexed)
7,754(64%)Active
Records
1,011Unique
Participants(58%)
Filter & Index
Filter “Roll-up”Matching
Unique Participants:Municipal 502Schools 383Other 126
Total: 1,011
Note: Data Sample Represents CEP Usage Between November 2000 and October 6th, 2014.
QASampleReview
QASampleReview
LGU Inventory:+ 565 Municipal+ 663 School Districts+ 508 Other
1,756 Unique LGUs
Usage Scenario Distribution:LGEA Only 129LGEA & Other CEP Usage 310CEP Usage Only (no LGEA) 572No LGEA or CEP Usage 745
Total: 1,756
(*) May not reflect utility program usage
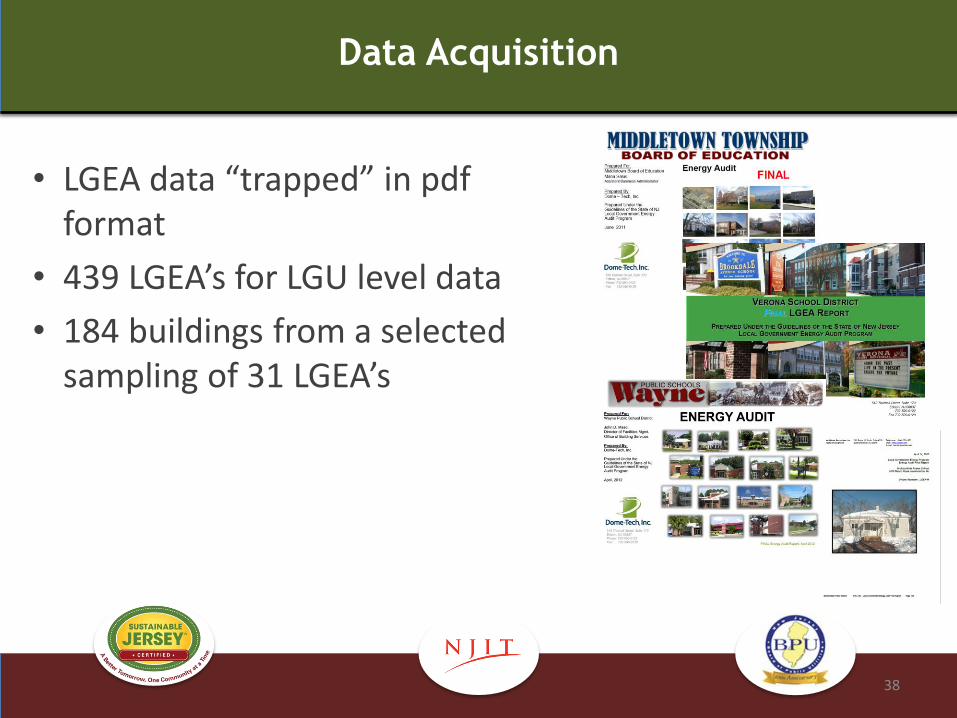
Data Acquisition
• LGEA data “trapped” in pdf format
• 439 LGEA’s for LGU level data
• 184 buildings from a selected sampling of 31 LGEA’s
38
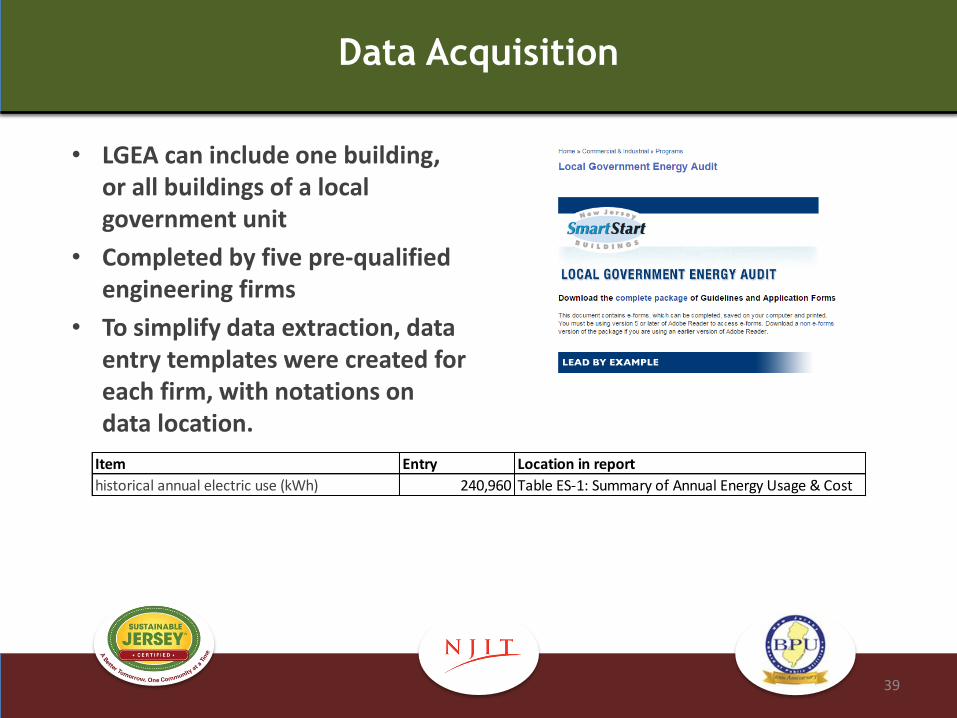
Data Acquisition
• LGEA can include one building, or all buildings of a local government unit
• Completed by five pre-qualified engineering firms
• To simplify data extraction, data entry templates were created for each firm, with notations on data location.
39
Item Entry
historical annual electric use (kWh) 240,960 Table ES-1: Summary of Annual Energy Usage & Cost
Location in report

Critical Data Points
• Which data points are most valuable
• Not all LGEA’s are created equal
• The data is being used for several purposes:
• Asset Scoring Tool (AST)
• Building Performance Database (BPD)
• NJP BEEP data needs• Comparison of BPD priority fields and LGEA content
40

Collected Building Level Data Points
• Buildings Data
• Year of construction
• Square footage
• Heating fuel
• HVAC: equipment, distribution
• HVAC terminal equipment
• DHW: equipment, fuel
• Control System (general)
• Historic kWh and Therms
• EUI – existing
• EUI - projected
• ECM’s• Overall savings• Most Common ECMs • Most Common packages of
ECMs
• CEP data and LGEA Data• Implemented ECM from CEP
data cross checked with recommended ECM’s from LGEA’s
41
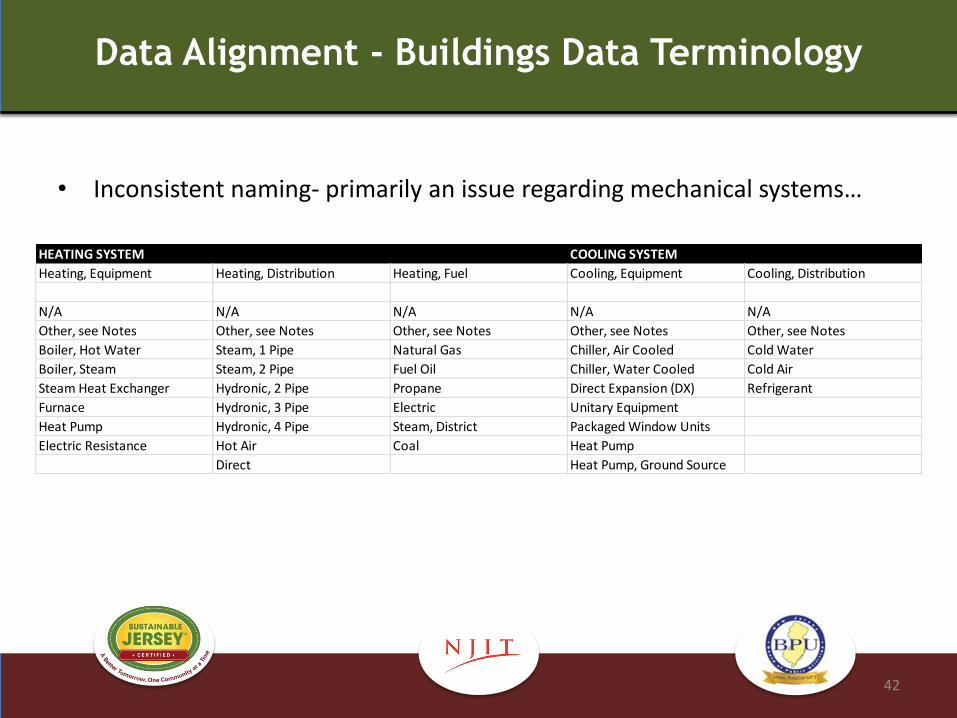
Data Alignment - Buildings Data Terminology
• Inconsistent naming- primarily an issue regarding mechanical systems…
42
Heating, Equipment Heating, Distribution Heating, Fuel Cooling, Equipment Cooling, Distribution
N/A N/A N/A N/A N/A
Other, see Notes Other, see Notes Other, see Notes Other, see Notes Other, see Notes
Boiler, Hot Water Steam, 1 Pipe Natural Gas Chiller, Air Cooled Cold Water
Boiler, Steam Steam, 2 Pipe Fuel Oil Chiller, Water Cooled Cold Air
Steam Heat Exchanger Hydronic, 2 Pipe Propane Direct Expansion (DX) Refrigerant
Furnace Hydronic, 3 Pipe Electric Unitary Equipment
Heat Pump Hydronic, 4 Pipe Steam, District Packaged Window Units
Electric Resistance Hot Air Coal Heat Pump
Direct Heat Pump, Ground Source
HEATING SYSTEM COOLING SYSTEM

Data Analysis – Local Government Units
• For all 310 entities that have done both LGEAs and CEP projects:
Complete map into “sequence type”
Complete LGEA profile for each (at measure level)
Historical baseline for electricity and fuel
Recommended measures by class (# ECMs, projected savings)
Complete CEP-usage profile
By program
# ECMs implemented (by ECM class), projected savings
Complete entry of related demographic data per LGU
• Complete LGEA Profiles for remaining 129 LGEA-only entities
• Complete CEP-usage profile for 572 CEP-only entities
• Incorporate utility program data as appropriate
• Begin comparison analysis, characterization (especially usage scenarios), and scaling
• Begin “Archetype and Pathway” identification
43

Results Preview (An Appetizer)
44
For 310 Entities That Have Done LGEAs AND Used The NJ-CEP:
• 1,792 buildings, totaling 90,418,602 square feet
• 1,110,550,579 kWh 12-mo electricity usage
• 50,601,229 therms 12-mo natural gas usage (some oil and propane as well)
• Projected Savings (if all LGEA ECMs implemented) (*):
245,880,432 kWh in electricity savings (22.1% reduction)
9,699,353 therms in heat savings (19.2% reduction)
(*) LGEAs are suspected to under-represent potential savings, but measure impacts can’t be simply added
Data Analysis - Buildings
• Existing conditions for schools and municipal complexes
• Recommended ECMs
• Completed work
45

Buildings Recommended Energy Conservation
Measures
46
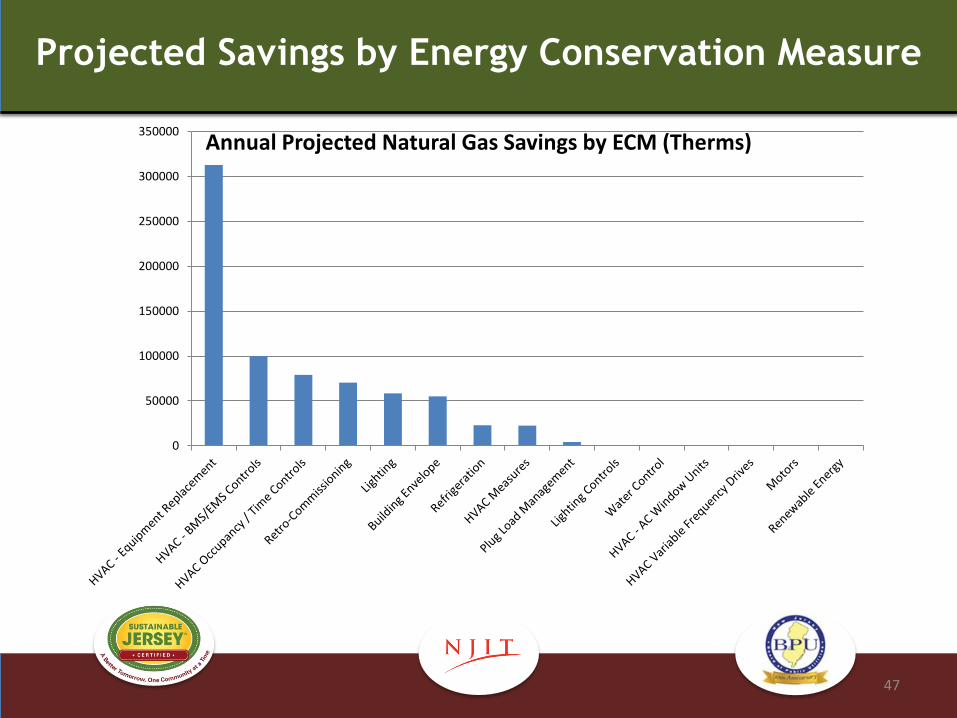
Projected Savings by Energy Conservation Measure
47
0
50000
100000
150000
200000
250000
300000
350000Annual Projected Natural Gas Savings by ECM (Therms)

Electricity Savings by Energy Conservation Measure
48

Existing and Projected Site Energy Use Intensity
49
AVG Existing EUI = 83 AVG Projected EUI = 69 17% reduction
0
50
100
150
200
250
300
350Existing and Projected site kBtu/sf/yr
for 88 K-12 Schools
Exisiting EUI
Projected EUI
Average Existing EUI
Average Projected EUI

50

51

52

Scott Wagner
CBEI

Better Buildings Summit
Strategies and Guidelines for the
Cleansing and Analysis of Building Energy Benchmarking Data
May 27, 2015
54

Benchmarking Data Quality and Analytics
Better Buildings Summit
Benchmarking Data Issues and Challenges:
1. Benchmarking data collected for a benchmarking program is typically self-reported by building owners/operators: Self-reported data can contain significant errors which negatively impact energy efficiency metrics such as the Energy Utilization Intensity (EUI) and Energy Star Portfolio Manager score.
2. Typically, all benchmarking data submitted to a benchmarking program is made transparent to the public: This means both “good” and “bad” data is provided to the public as reported.
3. Even after data “cleansing,” benchmarking datasets can still contain incorrect data: However, it is very difficult to identify and remove this incorrect data.
Opportunities:
1. Improve quality of raw data: Provide feedback to the building owners/operators that supplied “bad” data to minimize it in future reporting; require Energy Star “certification” to input data into benchmarking program.
2. Analysis of benchmarking data: Geared to generate “actionable” information from benchmarking data to drive energy efficiency retrofits .
55

Benchmarking Data Quality and Analytics
Better Buildings Summit
General Benchmarking Data Quality Cleansing Criteria:
Type of Data Quality Issue:Cleanse for
Analysis:
Use for
Feedback
Purposes:
Criteria: Impact:
Duplicate Property Entries or
“dummy data” entries: X
-
More than one data entry for a specific property;
municipality used “dummy” buildings to test
benchmarking system Increases potential error in analysis
Too Small Building Square
Footage: X X
Property's square footage is below minimum
program requirement.
Building square footage may be
incorrect
No Property Type X X
Property type was reclassified to “Not Available”
as defined in ESPM’s Primary Property Type – EPA
Calculated field.
Property does not have building gross
floor area defined for complete
timeframe
No EUI X X Property did not report an EUI. No information about energy use
No ESPM Benchmark Score for
Property Type That Should Have
Received a Score
-
X
Refer to ESPM’s list of 21 property types eligible
to receive an Energy Star score. No information about energy efficiency
Extremely High or Low ESPM
Benchmark Score X X Remove properties with score of 100, 99, 2, or 1.
Total energy use or building square
footage may be too high or too low for
property
Extremely High or Low EUI X X
In general, Properties with site EUIs less than 2
kBtu/sf/yr or greater than 800 kBtu/sf/yr, except
for Industrial/Manufacturing or Waste Water
Treatment properties.
Total energy use or building square
footage may be too high or too low for
property
Zero Electric Use X X
Virtually all buildings in the U.S. use some amount
of electrical energy; total energy use is incorrect.
Total energy use of property was not
accounted for properly
Default Data Use - X
ESPM indicates which properties have default
data, instead of actual data, for regression
equation.
Although Benchmark score may not
have been calculated correctly, EUI can
be used for analysis. 56

Benchmarking Data Quality and Analytics
Better Buildings Summit
Flow Chart for Parsing Benchmarking Data
57
Use to improve data acquisition for cleaner data in the future
All Properties Submitted in Benchmarking Program
Data Cleansing
Properties Eligible to Receive an ESPM Score
Will Have: EUI and Possibly an ESPM ScoreProperties Not Eligible to Receive an ESPM Score
Will Have: EUI Only
Properties that Received an ESPM Score
Will Have: EUI and ESPM Score
Properties that Didn't Receive an ESPM Score
Will Have: EUI only
Properties that Didn't Use Default Data
Will Have: EUI and ESPM Score(Most Reliable Data about Energy
Efficiency Level of Property)
Properties that Used Default Data
Will Have: EUI and ESPM Score
Cleansed Dataset of All Properties
Submitted in Benchmarking ProgramFlagged Dataset to be Removed
Keep for Feedback Purposes
Understanding Basic Energy Performance and Associate Energy CostsSelect Property Types
Most “reliable” benchmarking information; Can be used to generate actionable information for driving retrofits
Will have energy use information, but limited energy efficiency information for comparison to other properties

Benchmarking Data Quality and Analytics
Better Buildings Summit
Benchmarking Data Parsing
Default Data and No ESPM Score
58* Example Benchmarking Data - Philadelphia 2013
Can be an indication property owners are having difficulty getting actual data for ESPM inputs
Can be an indication property owners are having difficulty with ESPM

Benchmarking Data Quality and Analytics
Better Buildings Summit
Benchmarking Data Analytics
All Property Types Combined
Typical First Cut Analysis of Total Building Stock
Quantity and Square Footage*
59* Example Benchmarking Data - Philadelphia 2013

Benchmarking Data Quality and Analytics
Better Buildings Summit
Benchmarking Data Analytics
All Property Types Combined
Typical First Cut Analysis of Total Building Stock
Total Energy Consumption and Fuel Shares*
60* Example Benchmarking Data - Philadelphia 2013
Electric Fuel Share is of importance since it can drive $/sf and changes in ESPM score

Benchmarking Data Quality and Analytics
Better Buildings Summit
Benchmarking Data Analytics
Three Important Benchmarking Indicators for Properties with ESPM Scores*
61
1 2
3 Indicator:1. Median ESPM score
indicates overall efficiency of total building stock.
2. Distribution of gross floor area by ESPM score indicates larger properties tend to be more efficient.
3. The larger the difference between site and source EUI indicates higher electric fuel share.
* Example Benchmarking Data - Philadelphia 2013

Benchmarking Data Quality and Analytics
Better Buildings Summit
Benchmarking Data Analytics
$/sf for Offices and K-12 Schools*
62
Offices: Large electric fuel share gives higher $/sf;K-12 Schools: Small electric fuel share gives smaller $/sf
At same EUI, $/sf for K-12 Schools are typically lower than for Offices
For a property type as a whole, $/sf are generally smaller for properties with higher ESPM scores
* Example Benchmarking Data - Philadelphia 2013

Benchmarking Data Quality and Analytics
Better Buildings Summit
Maximizing Energy Star Score by Shifting the Electric Fraction (Share)
Offices
63
0
10
20
30
40
50
60
70
80
90
100
30% 35% 40% 45% 50% 55% 60% 65% 70% 75% 80% 85%
Ener
gy S
tar
Sco
re
% Electric Fraction of Total SiteEnergy Consumption
Energy Star Score vs Electric FractionOffice Building - 100,000 Gross Square Feet
Score @ EUI = 100 kBtu/sf/yr Score @ EUI = 80 kBtu/sf/yr
Elec -0% / Gas -50% +9
Elec - 33% / Gas - 0%+
26
pts
+1
9 p
ts
Goal of 20% Reduction in Total Site Energy Use
A
B
C
D
Basecase
Savings Scenarios

Benchmarking Data Quality and Analytics
Better Buildings Summit
Maximizing Energy Star Score by Shifting the Electric Fraction (Share)
K-12 Schools
64
0
10
20
30
40
50
60
70
80
90
100
0% 10% 20% 30% 40% 50% 60%
Ener
gy S
tar
Sco
re
% Electric Fraction of Total Site Energy Consumption
Energy Star Score vs Electric FractionK-12 School - 100,000 Gross Square Feet
Score @ EUI 80 kBtu/sf/yr Score @ EUI 64 kBtu/sf/yr
+22
pts
+37
pts
Elec - 57% / Gas - 0% Elec - 0% / Gas - 31%
+14
pts
A
B
C
D
Goal of 20% Reduction in Total Site Energy Use
Basecase
Savings Scenarios
Benchmarking Data Quality and Analytics
Better Buildings Summit
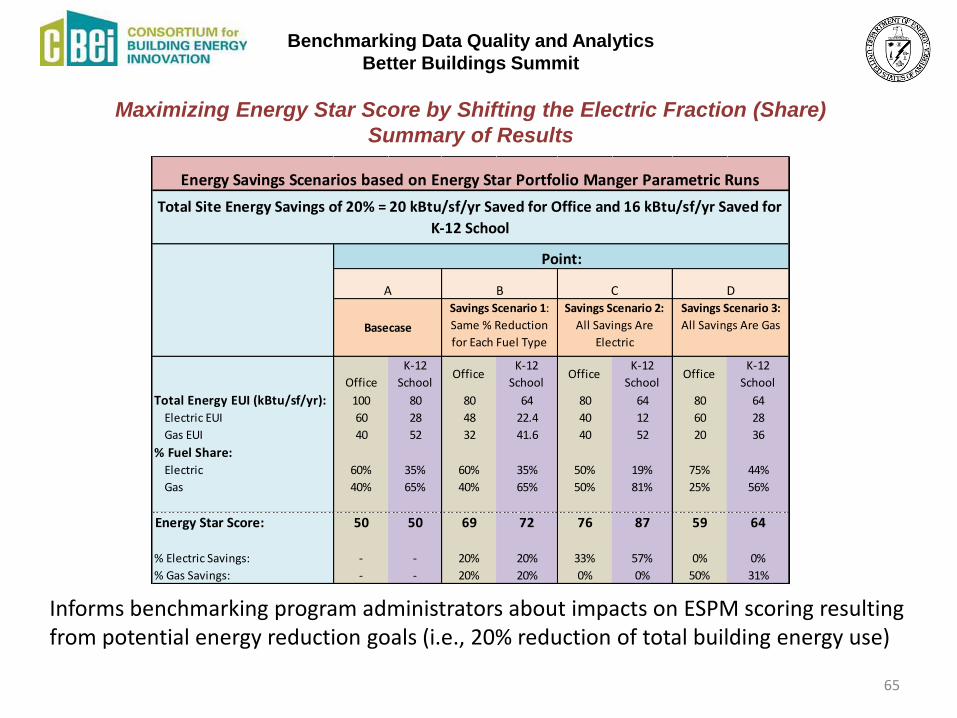
Maximizing Energy Star Score by Shifting the Electric Fraction (Share)
Summary of Results
65
Informs benchmarking program administrators about impacts on ESPM scoring resulting from potential energy reduction goals (i.e., 20% reduction of total building energy use)
Office
K-12
SchoolOffice
K-12
SchoolOffice
K-12
SchoolOffice
K-12
School
Total Energy EUI (kBtu/sf/yr): 100 80 80 64 80 64 80 64
Electric EUI 60 28 48 22.4 40 12 60 28
Gas EUI 40 52 32 41.6 40 52 20 36
% Fuel Share: Electric 60% 35% 60% 35% 50% 19% 75% 44%
Gas 40% 65% 40% 65% 50% 81% 25% 56%
Energy Star Score: 50 50 69 72 76 87 59 64
% Electric Savings: - - 20% 20% 33% 57% 0% 0%
% Gas Savings: - - 20% 20% 0% 0% 50% 31%
A B C
Point:
Energy Savings Scenarios based on Energy Star Portfolio Manger Parametric Runs
Savings Scenario 1:
Same % Reduction
for Each Fuel Type
Savings Scenario 2:
All Savings Are
Electric
Savings Scenario 3:
All Savings Are Gas
Total Site Energy Savings of 20% = 20 kBtu/sf/yr Saved for Office and 16 kBtu/sf/yr Saved for
K-12 School
Basecase
D

Benchmarking Data Quality and Analytics
Better Buildings Summit
Methodology for Selecting Properties with a High Opportunity for Retrofit
66
Want a cross-section of properties, not a grouping of properties with the largest
amount of gross floor area or largest amount of total annual energy use:
Select properties with Energy Star Score below 75 (done for each property type)
Select properties with site EUI equal to or greater than median site EUI (selection is independent of building size and total energy use)
Select properties with $/sf equal to or greater than median $/sf (selection is independent of building size and total energy use)
Step 1:
Determine median % electric fraction of total annual site energy use
Select properties with “reasonable” % electric fraction based on median value
Step 2:
Step 3:
Step 4:
Step 5:

Benchmarking Data Quality and Analytics
Better Buildings Summit
Methodology for Selecting Properties with a High Opportunity for Retrofit
67
Verification of selection of candidate properties:* Offices and K-12 Schools1. High EUI and $/sf
2. Good cross-section of properties with varying total annual energy and cost
* Example Benchmarking Data - Philadelphia 2013

Benchmarking Data Quality and Analytics
Better Buildings Summit
Methodology for Selecting Properties with a High Opportunity for Retrofit
68
Verification of selection of candidate properties:* Offices and K-12 Schools1. High $/sf and % Electric Fraction
2. Good cross-section of properties with largest $ savings and varying property size
* Example Benchmarking Data - Philadelphia 2013

Benchmarking Data Quality and Analytics
Better Buildings Summit
Summary:• Data quality cleansing criteria• Methodology for parsing benchmarking data• Typical types of data analyses
• Three important indicators
• Maximizing Energy Star score by shifting the electric fraction• Methodology for Selecting Properties with a High Opportunity for Retrofit
Next Steps:• Combining ESPM with DOE Asset Score tool• Using interval data to benchmark:
• Heating, cooling and base loads of properties (inverse modeling)• Building operation during unoccupied hours during the week and weekends (loadshape
analysis)
69