strategies for sustainable urban systems ... - uab barcelona · off of uab research park)....
TRANSCRIPT

Ilean
a C
erón
Pa
lma
Mem
òria
de
Rec
erca
20
09
Str
ateg
ies
for
sust
ain
able
urb
an
sys
tem
s: in
trod
ucin
g e
co-in
nov
atio
n in
bu
ildin
gs in
Mex
ico
an
d S
pain
Strategies for sustainable urban systems: introducing eco-innovation in buildings in Mexico and Spain
Ileana Cerón Palma
Doctoral thesis
Doc
tora
l th
esis
Supervisors: Dr. Joan Rieradevall i PonsDr. Juan Ignacio MonteroDr. Jordi Oliver i Solà
A thesis submitted in fulfilment of the requirements for theDoctoral degree in Environmental Sciences and Technology
Sostenipra research groupInstitut de Ciència i Tecnologia Ambientals (ICTA)Universitat Autònoma de Barcelona (UAB)
Bellaterra, November 2012
Strategies for sustainable
urban systems:
introducing eco-innovation in
buildings in Mexico and Spain.
By
Ileana Maria N. Cerón Palma
A thesis submitted in fulfilment of the requirements for the
PhD degree in Environmental Sciences and Technology
November 2012
This thesis was developed thanks to the Doctoral fellowship awarded by Ileana
Maria Ceron Palma from the National Council on Science and Technology
(CONACYT) of Mexico.

2
3
“Innovation distinguishes
between a leader and a follower”
Steve Jobs

4
5
This thesis entitled “Strategies for sustainable urban systems: introducing eco-
innovation in buildings in Mexico and Spain” has been carried out at the Institute of
Environmental Science and Technology (ICTA) at Universitat Autònoma de Barcelona
(UAB). It has been carried out under the supervision of Dr. Joan Rieradevall, from the
ICTA and the Department of Chemical Engineering at the UAB, Dr. Juan Ignacio Montero
from the Environmental Horticulture Unit Programme at the Institute of Agriculture and
Food Research and Technology (IRTA), and Dr. Jordi Oliver-Solà from Inèdit Innovació
(INEDIT, spin-off of UAB research park).
Bellaterra (Cerdanyola del Vallès), November 2012
Ileana Maria N. Cerón Palma
Joan Rieradevall Juan Ignacio Montero Jordi Oliver-Solà

6
7
Contents
Figures
Tables
List of acronyms, abbreviations and notation
Acknowledgments
Summary
Preface
Structure of the dissertation
Page
I
III
V
VII
IX
XI
XV
PART 1. INTRODUCTION AND FRAMEWORK
1. Introduction 3
1.1 Key features of sustainable cities 4
1.1.1 The role of cities to climate change 6
1.1.2 Sustainable cities paradigm: A general overview 9
1.1.3 The neighbourhood as a new scale for intervention for
sustainable cities. 12
1.1.4 Building: An essential sector in climate change mitigation 13
1.2 Motivation of the dissertation 16
1.3 Objectives of the dissertation 17
References for Chapter 1 19
2. Methodology 23
2.1 Assessment tools 25
2.2.1 Environmental tools 26
2.2.2 Architectural tools 28
2.2.3 Social tools 31
2.2 Study systems presentation 33
References for Chapter 2 36
PART 2. STRATEGIES TO REDUCE ENERGY AND GHG EMISSIONS IN BUILDINGS IN
MEXICO: A CASE OF SOCIAL HOUSING
3. Towards a green sustainable strategy for social neighbourhoods in 39
Latin America: Case from social housing in Merida, Yucatan, Mexico.
3.1 Introduction 41
3.1.1 Urban planning and housing sector in Mexico. 41

8
3.1.2 Initiatives in Mexico for energy efficiency and emissions 43
reduction
3.2 Definition of study 44
3.2.1 Justification and objectives 44
3.2.2 Case-study area: Social neighbourhood in Merida
(Yucatán, México) 44
3.3 Materials and methods 47
3.3.1 Characterisation of the use phase of reference system 47
3.3.2 Environmental strategies 50
3.3.3 Environmental tools 50
3.4 Results 50
3.4.1 Characterisation of energy consumption 50
3.4.2 Eco-technology 52
3.4.3 Green spaces 52
3.5 Discussion 55
3.6 Conclusions 56
References for Chapter 3 57
4. Strategies to reduce the energy requirements and CO2 emissions of
cooling demand of social housing in warm humid climates of Mexico. 61
4.1 Introduction 63
4.2 Justification and objectives 64
4.3 Definition of study system 65
4.3.1 The site. General data on geography and climate 65
4.3.2 Object of study (social housing)
4.4 Method 68
4.4.1 Step one: Bioclimatic diagnostic 68
4.4.2 Step two: Definition and selection of strategies 69
4.4.3 Step three: Energy simulation performance 71
4.4.4 Step four: Environmental assessment 72
4.5 Results 73
4.5.1 Bioclimatic factors 73
4.5.2 Incident radiation on the facades in the base case 74
4.5.3 External heat loads in the base case 76
4.5.4 Energy demand of cooling 77
4.5.5 External heat load in the proposed scenarios 79
4.5.6 Global warming potential 80
4.6 Discussion 80
4.7 Conclusions 81
References for Chapter 4 83
9
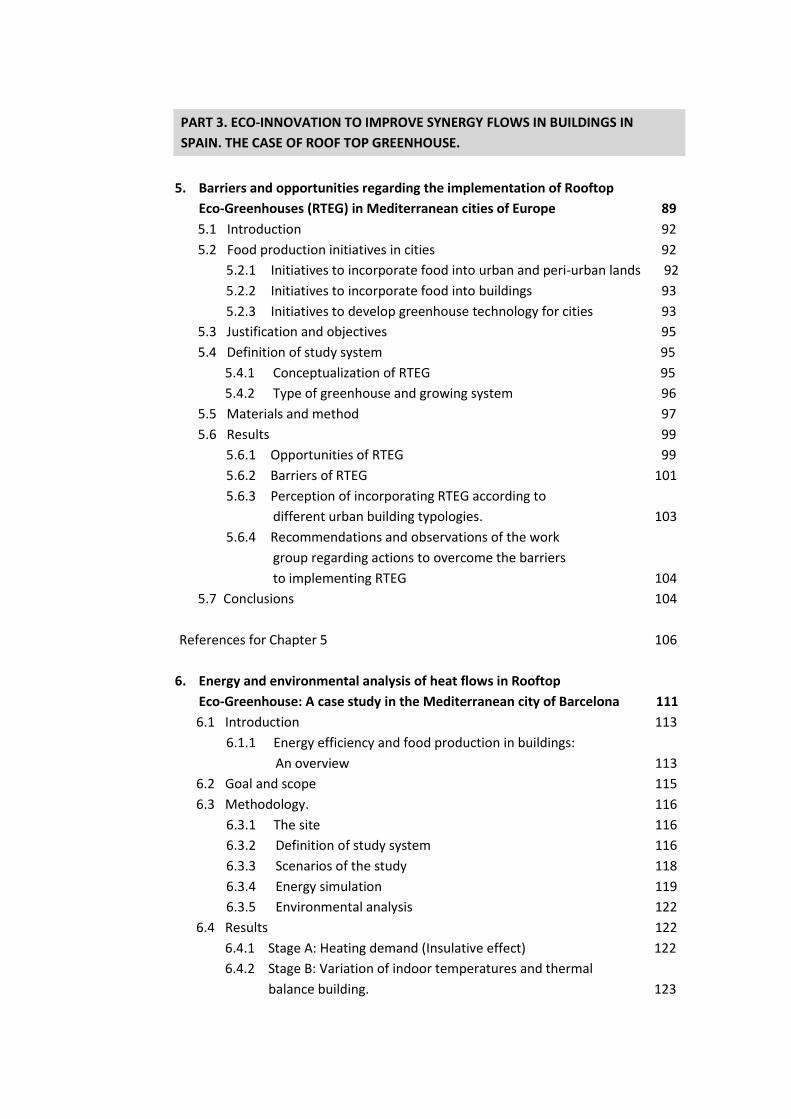
PART 3. ECO-INNOVATION TO IMPROVE SYNERGY FLOWS IN BUILDINGS IN
SPAIN. THE CASE OF ROOF TOP GREENHOUSE.
5. Barriers and opportunities regarding the implementation of Rooftop
Eco-Greenhouses (RTEG) in Mediterranean cities of Europe 89
5.1 Introduction 92
5.2 Food production initiatives in cities 92
5.2.1 Initiatives to incorporate food into urban and peri-urban lands 92
5.2.2 Initiatives to incorporate food into buildings 93
5.2.3 Initiatives to develop greenhouse technology for cities 93
5.3 Justification and objectives 95
5.4 Definition of study system 95
5.4.1 Conceptualization of RTEG 95
5.4.2 Type of greenhouse and growing system 96
5.5 Materials and method 97
5.6 Results 99
5.6.1 Opportunities of RTEG 99
5.6.2 Barriers of RTEG 101
5.6.3 Perception of incorporating RTEG according to
different urban building typologies. 103
5.6.4 Recommendations and observations of the work
group regarding actions to overcome the barriers
to implementing RTEG 104
5.7 Conclusions 104
References for Chapter 5 106
6. Energy and environmental analysis of heat flows in Rooftop
Eco-Greenhouse: A case study in the Mediterranean city of Barcelona 111
6.1 Introduction 113
6.1.1 Energy efficiency and food production in buildings:
An overview 113
6.2 Goal and scope 115
6.3 Methodology. 116
6.3.1 The site 116
6.3.2 Definition of study system 116
6.3.3 Scenarios of the study 118
6.3.4 Energy simulation 119
6.3.5 Environmental analysis 122
6.4 Results 122
6.4.1 Stage A: Heating demand (Insulative effect) 122
6.4.2 Stage B: Variation of indoor temperatures and thermal
balance building. 123

10
6.4.3 Stage C: Potential of heat flows interchange 125
6.4.4 Sensitivity analysis of environmental benefits 128
6.5 Discussion and future research 129
6.6 Conclusions 131
References for Chapter 5 132
PART 4. GENERAL CONCLUSIONS AND FUTURE RESEARCH
7. Conclusions of dissertation 137
7.1 Conclusions of methodological aspects 137
7.2 Eco-innovation in buildings as strategy for sustainable
urban systems. 139
8. Future research 143
8.1 Strategies to reduce energy and GHG emissions in social
housing in Mexico 145
8.2 Rooftop Eco-Greenhouse in mediterranean cities of Europe 145
I
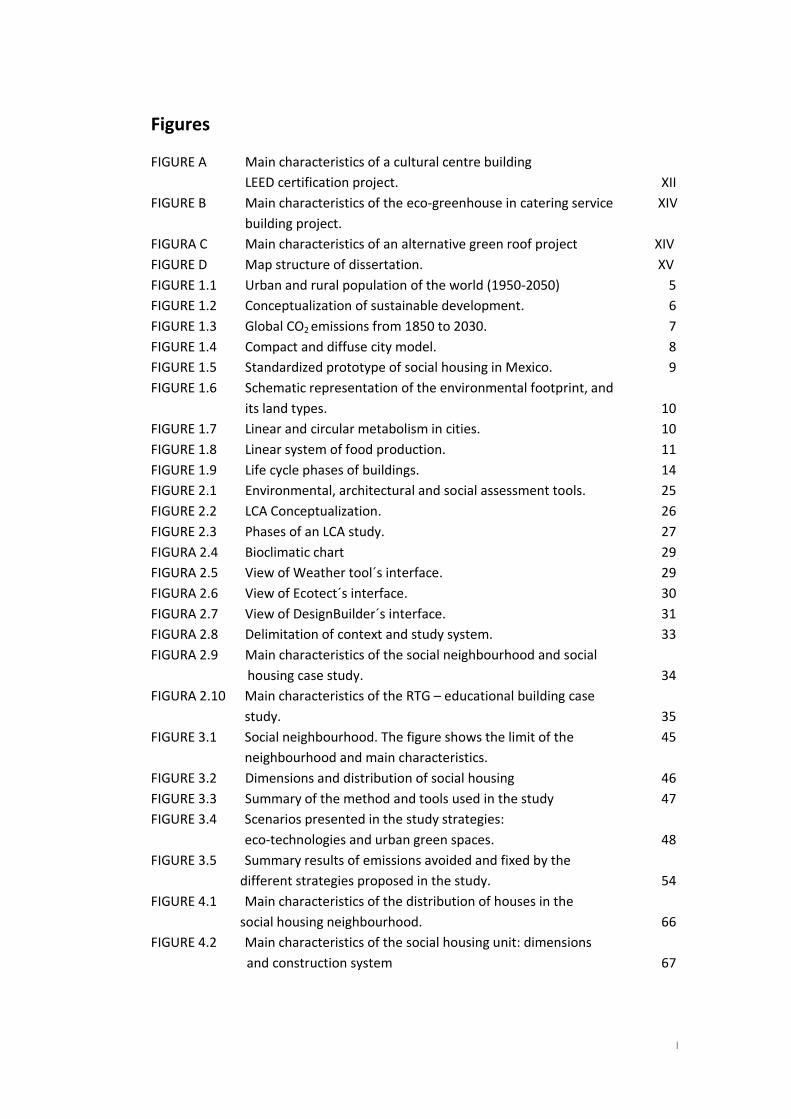
Figures
FIGURE A Main characteristics of a cultural centre building
LEED certification project. XII
FIGURE B Main characteristics of the eco-greenhouse in catering service XIV
building project.
FIGURA C Main characteristics of an alternative green roof project XIV
FIGURE D Map structure of dissertation. XV
FIGURE 1.1 Urban and rural population of the world (1950-2050) 5
FIGURE 1.2 Conceptualization of sustainable development. 6
FIGURE 1.3 Global CO2 emissions from 1850 to 2030. 7
FIGURE 1.4 Compact and diffuse city model. 8
FIGURE 1.5 Standardized prototype of social housing in Mexico. 9
FIGURE 1.6 Schematic representation of the environmental footprint, and
its land types. 10
FIGURE 1.7 Linear and circular metabolism in cities. 10
FIGURE 1.8 Linear system of food production. 11
FIGURE 1.9 Life cycle phases of buildings. 14
FIGURE 2.1 Environmental, architectural and social assessment tools. 25
FIGURE 2.2 LCA Conceptualization. 26
FIGURE 2.3 Phases of an LCA study. 27
FIGURA 2.4 Bioclimatic chart 29
FIGURA 2.5 View of Weather tool´s interface. 29
FIGURA 2.6 View of Ecotect´s interface. 30
FIGURA 2.7 View of DesignBuilder´s interface. 31
FIGURA 2.8 Delimitation of context and study system. 33
FIGURA 2.9 Main characteristics of the social neighbourhood and social
housing case study. 34
FIGURA 2.10 Main characteristics of the RTG – educational building case
study. 35
FIGURE 3.1 Social neighbourhood. The figure shows the limit of the 45
neighbourhood and main characteristics.
FIGURE 3.2 Dimensions and distribution of social housing 46
FIGURE 3.3 Summary of the method and tools used in the study 47
FIGURE 3.4 Scenarios presented in the study strategies:
eco-technologies and urban green spaces. 48
FIGURE 3.5 Summary results of emissions avoided and fixed by the
different strategies proposed in the study. 54
FIGURE 4.1 Main characteristics of the distribution of houses in the
social housing neighbourhood. 66
FIGURE 4.2 Main characteristics of the social housing unit: dimensions
and construction system 67
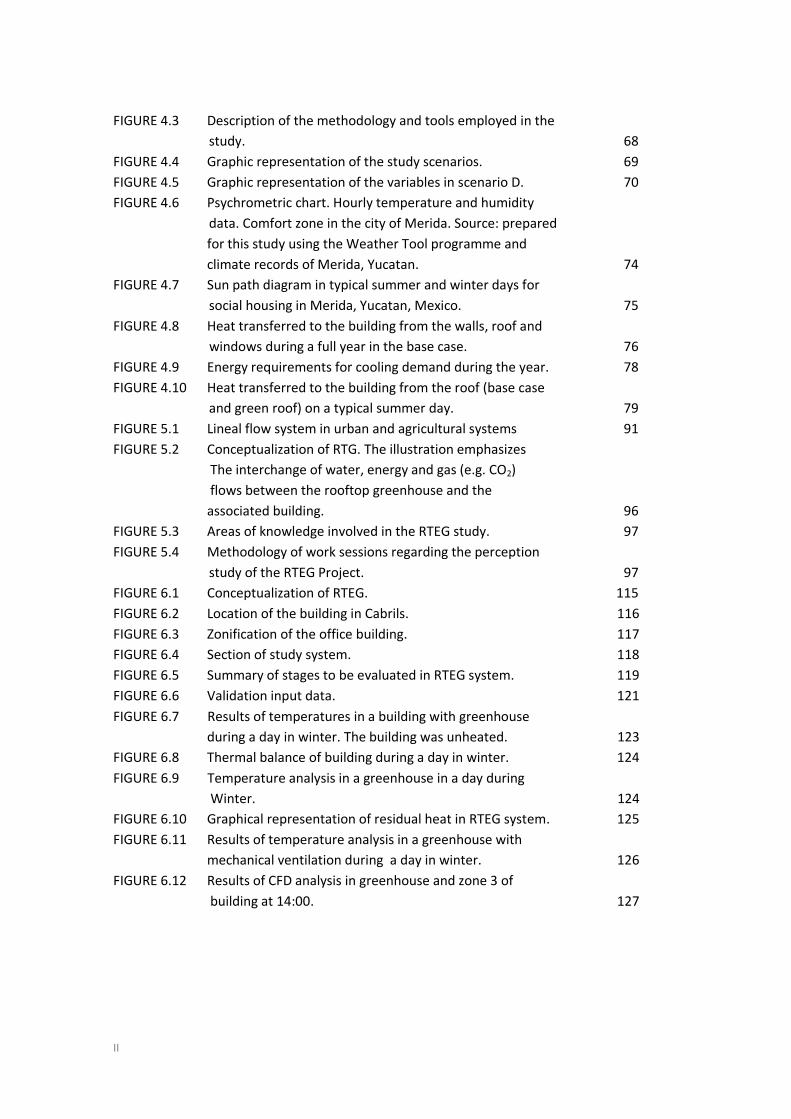
II
FIGURE 4.3 Description of the methodology and tools employed in the
study. 68
FIGURE 4.4 Graphic representation of the study scenarios. 69
FIGURE 4.5 Graphic representation of the variables in scenario D. 70
FIGURE 4.6 Psychrometric chart. Hourly temperature and humidity
data. Comfort zone in the city of Merida. Source: prepared
for this study using the Weather Tool programme and
climate records of Merida, Yucatan. 74
FIGURE 4.7 Sun path diagram in typical summer and winter days for
social housing in Merida, Yucatan, Mexico. 75
FIGURE 4.8 Heat transferred to the building from the walls, roof and
windows during a full year in the base case. 76
FIGURE 4.9 Energy requirements for cooling demand during the year. 78
FIGURE 4.10 Heat transferred to the building from the roof (base case
and green roof) on a typical summer day. 79
FIGURE 5.1 Lineal flow system in urban and agricultural systems 91
FIGURE 5.2 Conceptualization of RTG. The illustration emphasizes
The interchange of water, energy and gas (e.g. CO2)
flows between the rooftop greenhouse and the
associated building. 96
FIGURE 5.3 Areas of knowledge involved in the RTEG study. 97
FIGURE 5.4 Methodology of work sessions regarding the perception
study of the RTEG Project. 97
FIGURE 6.1 Conceptualization of RTEG. 115
FIGURE 6.2 Location of the building in Cabrils. 116
FIGURE 6.3 Zonification of the office building. 117
FIGURE 6.4 Section of study system. 118
FIGURE 6.5 Summary of stages to be evaluated in RTEG system. 119
FIGURE 6.6 Validation input data. 121
FIGURE 6.7 Results of temperatures in a building with greenhouse
during a day in winter. The building was unheated. 123
FIGURE 6.8 Thermal balance of building during a day in winter. 124
FIGURE 6.9 Temperature analysis in a greenhouse in a day during
Winter. 124
FIGURE 6.10 Graphical representation of residual heat in RTEG system. 125
FIGURE 6.11 Results of temperature analysis in a greenhouse with
mechanical ventilation during a day in winter. 126
FIGURE 6.12 Results of CFD analysis in greenhouse and zone 3 of
building at 14:00. 127

III
Tables
TABLE 2.1 Environmental impact categories during the dissertation 27
TABLE 3.1 Annual energy consumption and emissions associated
with the use stage of housing. 50
TABLE 3.2 Annual energy consumption and GHG emissions
(kgCO2eq/ year) with the Eco-technology strategy. 52
TABLE 3.3 Annual carbon dioxide emissions fixed in green spaces. 53
TABLE 3.4 Value, emission factor, total emissions and
contribution by flow of the expanded system. 53
TABLE 3.5 Projecting results of avoided GHG emissions per household
at neighbourhood and city. 54
TABLE 4.1 Description, inventory of materials, specific weight,
assumed lifetime (years) and main sources for each scenario. 73
TABLE 4.2 Incident radiation on the facades of the social
housing unit. 75
TABLE 4.3 Heat transferred to the building from the walls, roof and
windows. 76
TABLE 4.4 Energy requirements for cooling demand
TABLE 4.5 Global warming potential, GHG emissions avoided and the
total balance for each scenario and variable. 77
TABLE 5.1 Work group's initial questions. 98
TABLE 5.2 Scenarios in which RTEG can possibly be implemented. 98
TABLE 5.3 Barriers and opportunities regarding implanting RTEG in
Mediterranean cities. 102
TABLE 6.1 ANOVA Table for ceiling surface temperature by method. 121
TABLE 6.2 Electricity production mix (peak) in Spain. 122
TABLE 6.3 Comparison of the heating demand in a building with and
without a greenhouse. 123
TABLE 6.4 Results of sensitivity analysis of CO2eq avoided in the
heating system. 129

IV
V
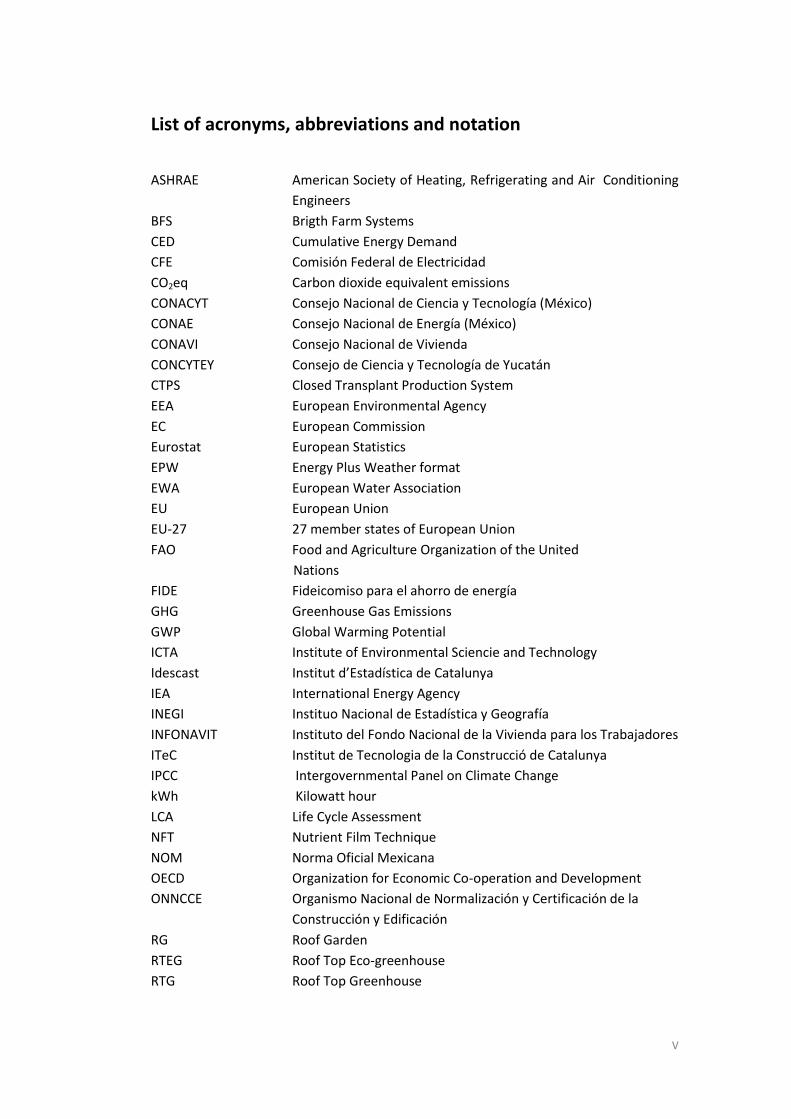
List of acronyms, abbreviations and notation
ASHRAE American Society of Heating, Refrigerating and Air Conditioning
Engineers
BFS Brigth Farm Systems
CED Cumulative Energy Demand
CFE Comisión Federal de Electricidad
CO2eq Carbon dioxide equivalent emissions
CONACYT Consejo Nacional de Ciencia y Tecnología (México)
CONAE Consejo Nacional de Energía (México)
CONAVI Consejo Nacional de Vivienda
CONCYTEY Consejo de Ciencia y Tecnología de Yucatán
CTPS Closed Transplant Production System
EEA European Environmental Agency
EC European Commission
Eurostat European Statistics
EPW Energy Plus Weather format
EWA European Water Association
EU European Union
EU-27 27 member states of European Union
FAO Food and Agriculture Organization of the United
Nations
FIDE Fideicomiso para el ahorro de energía
GHG Greenhouse Gas Emissions
GWP Global Warming Potential
ICTA Institute of Environmental Sciencie and Technology
Idescast Institut d’Estadística de Catalunya
IEA International Energy Agency
INEGI Instituo Nacional de Estadística y Geografía
INFONAVIT Instituto del Fondo Nacional de la Vivienda para los Trabajadores
ITeC Institut de Tecnologia de la Construcció de Catalunya
IPCC Intergovernmental Panel on Climate Change
kWh Kilowatt hour
LCA Life Cycle Assessment
NFT Nutrient Film Technique
NOM Norma Oficial Mexicana
OECD Organization for Economic Co-operation and Development
ONNCCE Organismo Nacional de Normalización y Certificación de la
Construcción y Edificación
RG Roof Garden
RTEG Roof Top Eco-greenhouse
RTG Roof Top Greenhouse

VI
SAGARPA Secretaría de Agricultura, Ganadería, Desarrollo Rural, Pesca y
Alimentación
SEDUMA Secretaría de Desarrollo Urbano y Medio Ambiente
SENER Secretaría de Energía México
SHF Sociedad Hipotecaria Federal
UADY Universidad Autónoma de Yucatán
UN United Nations
VSMMDF Veces salario mínimo mensual del Distrito Federal
VF Vertical Farming
VII
Acknowledgments
A lo largo de estos 3 años he recibido el apoyo invaluable de amigos, profesores, familia
y diversas personas que he conocido. Quiero agradecer especialmente a mis directores
de tesis, el Dr. Joan Rieradevall, Dr. Juan Ignacio Montero y Dr. Jordi Oliver por el apoyo
y tiempo dedicado para la realización de esta tesis así como por mi formación en el
ámbito de la investigación y la confianza que depositaron en mí desde el momento que
me acerqué y les manifesté mi interés de hacer el doctorado en sus líneas de
investigación. A la Dra. Carmen Ponce, Dr. Carlos Quintal y Dr. Germán Giacoman
quienes fueron los que me dieron el último empujón para decidirme a iniciar esta
experiencia en el extranjero y quienes no han dejado de apoyarme durante este tiempo.
También agradezco a todo el equipo de SosteniPra (ICTA-IRTA-INÉDIT) quienes me
recibieron y me adoptaron como parte del grupo desde el primer día y de quienes he
aprendido y disfrutado su compañía y amistad; hago especial énfasis a Esther Sanyé
quien a sido una pieza clave para el desarrollo de esta tesis.
A Jordi, Carles, Raúl y todos mis ahora socios que integran INÉDIT, gracias por la
confianza que depositaron en mi para continuar esta aventura en México.
A todos y cada uno de mis amigos que a pesar de la distancia siempre estuvieron cerca
de mi a través de internet y pude de esa manera estar presente en todos los momentos
importantes de su vida que me perdí.
A mis amigos AEM con quienes viví un año increible y formé una amistad que ni el
tiempo o distancia podrá romper, ¡Gracias!.
No podía dejar de agradecer a mis compañeros de piso que me han soportado estos
años, gracias Mirnita por tu paciencia conmigo y apoyo incondicional.
Por último, le doy las gracias a mi familia ya que sin su apoyo nunca hubiese estado
motivada para concluir esta etapa. A mi padre, mis hermanos, suegros, cuñados, etc.
Especialmente a mi madre de quien mas he sentido separarme estos años ¡Madre tu
espera terminó, ya voy!; y por supuesto a mi esposo Juan Carlos con quien inicié esta
aventura y quien no ha dejado de apoyarme de principio a fin. GRACIAS.
Dedico esta tesis en su totalidad a la memoria de mi abuela de quien no pude
despedirme pero que me ha servido de inspiración en cada línea.

VIII
IX
Summary
This dissertation proposes strategies for sustainable urban systems, introducing eco-
innovation in buildings and paying particular attention to energy and GHG emissions.
The study was developed in two diferent social, economical and climatic contexts.
Firstly, environmental and energy improvement of social housing in a warm-humid
climate in Merida (Mexico) is investigated, through eco-rehabilitation strategies such as
ecotechnologies (efficient equipment), shading and insulation (Above roof shade,
overhangs on walls, louvers in windows and green roof) and food production (tomato).
Energy requirements for cooling in social housing, cumulative energetic demand and
CO2 emissions associated with the materials used in shading and insulative strategies
were calculated. In food production, the expanded system is considered, in order to
determine impacts related to food logistics (distribution, packaging, retail).
Secondly, Rooftop Eco-Greenhouse (RTEG) is presented as an eco-innovative system
that incorporates agriculture into the rooftops of buildings in Mediterranean European
cities. A list of environmental, economical, technological and social barriers, as well as
opportunities for the implementation of the RTEG system, were obtained. The work
method consisted of discussion seminars involving an interdisciplinary group of experts
from different areas. In addition, the potential for synergies between buildings and
RTEG systems in terms of heat flows was identified, focusing only on heating
requirements in winter, in an office building in Barcelona (Spain).
To develop this research, multidisciplinary tools and software programs such as energy
simulation (DesignBuilder, Ecotect), flow analysis (CFD), life cycle analysis (SimaPro)
were used. Social tools, such as seminars and focus groups, were also utilised.
According to the results for social housing, eco-technologies could potentially provide
reduce annual energy consumption by 31% (35.7kWh/m2/year). The ‘Above roof shade’
strategy can provide a saving of 126kWh/m2/year. Production of tomatoes in social
housing areas in Merida (Mexico) could provide a savings of 662 gCO2eq per kg of
tomatoes produced. In descending order, the main contributors to these savings are
transport requirements (57.7%), retail phase (37.2%) and re-usable packaging (5.1%).
In respect to RTEG, we would highlight the interconnection of the building and the
greenhouse as an opportunity for RTEG, making use of water, energy and CO2 flows
between both, as well as reducing food transportation requirements. The participation
of experts helped to produce a global vision for the implementation of the project.
According to energy analysis, a total of 87 kWh/day of heat was removed from the
greenhouse, in order to reduce its temperature. This data indicates the potential

X
amount of heat that could be transferred to the building in a study day. Based on the
results generated by this research, further lines of research can be investigated, in order
to determine other energy and environmental benefits of the RTEG system.
All strategies presented in this dissertation aim to facilitate the sustainable development
of urban systems, through researching eco-innovation in the field of improvement of
social housing in Developing Countries and urban agriculture in compact cities.
XI
Preface
This thesis was developed within the research group of Sustainability and Environmental
Prevention (Sostenipra) at the Institute of Environmental Science and Technology (ICTA),
Universitat Autònoma de Barcelona (UAB), from February 2010 to November 2012.
This dissertation is the result of a multidisciplinary approach that aims to propose and
assess strategies for more sustainable systems, working mainly at a building and
neighbourhood scale; paying particular attention to energy and GHG emissions.
The dissertation is mainly based on the following papers (published and under review) in
peer-reviewed indexed journals:
Cerón-Palma I, Sanyé-Mengual E, Oliver-Solà J, Montero JI, Rieradevall J (2013).
Towards a green sustainable strategy for social neighbourhoods in Latin
America: Case from social housing in Merida, Yucatan, Mexico. Habitat
International, 38: 47-56
Cerón-Palma I, Sanyé-Mengual E, Oliver-Solà J, Rieradevall J, Montero JI.
Strategies to reduce the energy requirements and CO2 emissions of cooling
demands on social housing in warm-humid climates of Mexico. Submitted on
July 2012 to Energy and buildings.
Cerón-Palma I, Sanyé-Mengual E, Oliver-Solà J, Montero JI, Rieradevall J (2012)
Barriers and opportunities regarding the implementation of Rooftop Eco-
Greenhouses (RTEG) in Mediterranean cities of Europe. Journal of Urban
Technology, first on line ( DOI:10.1080/10630732.20).
Cerón-Palma I, Sanyé-Mengual E, Oliver-Solà J, Rieradevall J, Montero JI. Energy
Energy and environmental analysis of heat flows in Rooftop Eco-Greenhouse: A
case study in the Mediterranean City of Barcelona. Submitted on November
2012 to Building and environment.
This dissertation is also based on the following oral communications and posters
presented at conferences:
Cerón-Palma I, Sanyé-Mengual E, Oliver-Solà J, Montero JI, Rieradevall J (2011)
Strategies for reducing the carbon footprint in a social housing district in Merida,
Yucatan, Mexico. Oral communication. International Life Cycle Assessment
Conference in Latin-America. Coatzacoalcos (Mexico).
Cerón-Palma I, Sanyé-Mengual E, Oliver-Solà J, Montero JI, Rieradevall J (2011)
LCM of green food production in Mediterranean cities: environmental benefits
associated to the energy savings in the use stage of Roof Top Greenhouse (RTG)
XII
systems. A case study in Barcelona (Catalonia, Spain). Oral communication. Life
Cycle Management Congress. LCM 2011. Berlin (Germany).
Sanyé-Mengual E, Cerón-Palma I, Oliver-Solà J, Montero JI, Rieradevall J. (2011)
LCM of green food production in Mediterranean cities: environmental benefits
associated to the energy savings in the use stage of Roof Top Greenhouse (RTG)
systems. A case study in Barcelona (Catalonia, Spain). Poster. Life Cycle
Management Congress. LCM 2011. Berlin (Germany).
Ceron-Palma I, Sanyé-Mengual E, Oliver-Solà J, Montero JI, Rieradevall J (2011)
Energy saving from a roof top greenhouse in a public building of Barcelona,
Spain”. Poster. 6th International Conference on Industrial Ecology. ISIE 2011.
Berkeley (California).
Cerón-Palma I, Oliver-Solà J, Sanyé-Mengual E, Gasol C, Grau L, Montero JI,
Rieradevall J (2011) Agrourban: Food self-sufficiency in cities. Poster. Smart City
World Congress. Barcelona (Spain).
Sanyé-Mengual E, Cerón-Palma I, Oliver-Solà J, Montero JI, Rieradevall J, (2012)
Periurban and innovative agrourban production areas for food self-sufficiency in
the Metropolitan Area of Barcelona. Oral communication. 1st International
Conference on Agriculture in an urbanizing society. Wageningen (The
Netherlands).
Sanyé-Mengual E, Cerón-Palma I, Oliver-Solà J, Montero JI, Rieradevall J (2012)
Potential and benefits of Rooftop Greenhouse (RTG) systems for agriculture
production implemented in polygons of future Smart cities: a case study in Zona
Franca (Barcelona). Smart City Expo World Congress, Barcelona (Spain).
Sanyé-Mengual E, Cerón-Palma I, Oliver-Solà J, Montero JI, Rieradevall J
(2012) Potential benefits of agrourban production systems as a sustainable
strategy for food self-sufficiency in urban areas. 1st International Conference for
Urban Sustainability and Resilience. London.
Cerón-Palma I, Sanyé-Mengual E, Oliver-Solà J, Montero JI, Rieradevall J (2013)
Integrating LCA in the selection of strategies for improving thermal conditions in
Mexican social housing. Accepted to CILCA 2013, Mendoza (Argentina).
During the dissertation period, the opportunity was given to work on other projects,
from which the following papers in peer-reviewed journals (accepted or in review) have
been written:
XIII
Sanyé-Mengual E, Ceron-Palma I, Oliver-Solà J, Montero JI, Rieradevall J (2012)
Environmental analysis of the logistics of Agricultural products from Roof Top
Greenhouse (RTG) in Mediterranean urban areas. Journal of the Science of Food
and Agriculture, first on line. (DOI: 10.1002/jsfa.5736)
Sanyé-Mengual E, Cerón-Palma I, Oliver-Solà J, Montero JI, Rieradevall J (2012) A
guideline for assessing the implementation of agrourban production through
Rooftop Greenhouse (RTG) systems in industrial and logistics buildings in parks.
Submitted on October 2012 to International Journal of Agricultural
Sustainability
Part of the information necessary for the results of doctoral thesis were obtained during
the following extended periods of research:
Five month period (August – September 2010 /April-May 2011 / January 2012) at the
Department of Environmental Engineering in the Faculty of Engineering at the
Autonomous University of Yucatan (UADY). The hosting researcher was Dr. Carmen
Ponce Caballero.
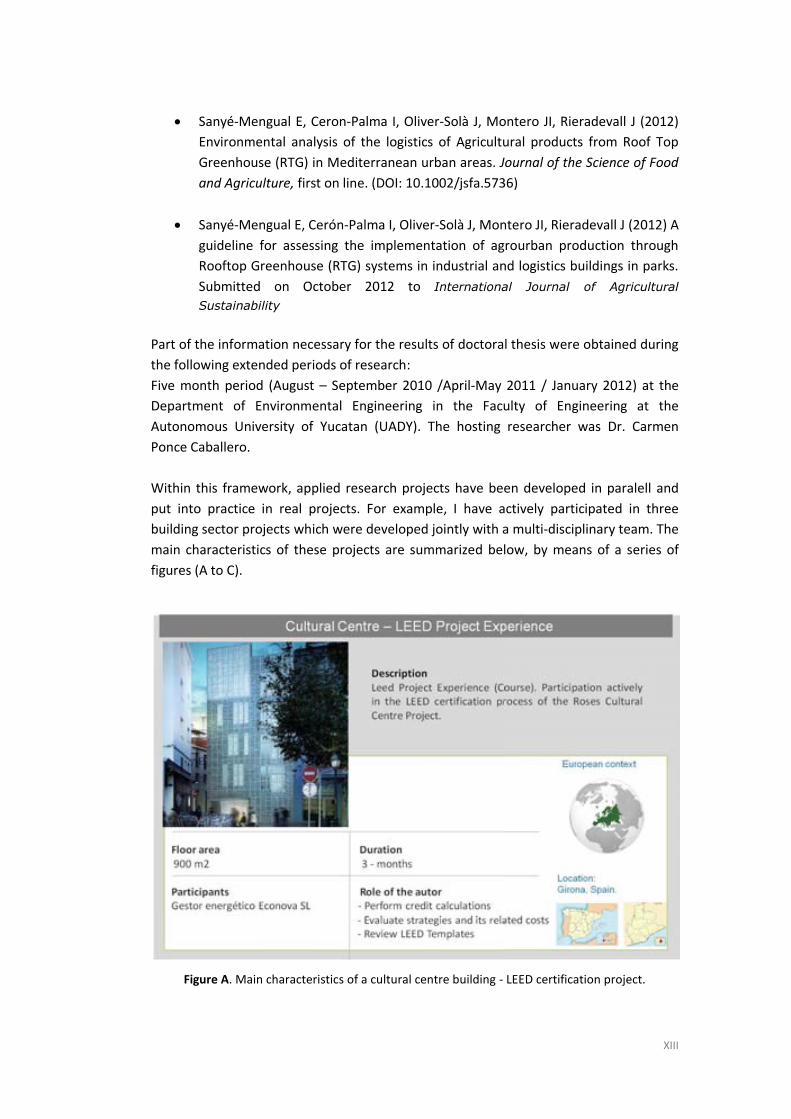
Within this framework, applied research projects have been developed in paralell and
put into practice in real projects. For example, I have actively participated in three
building sector projects which were developed jointly with a multi-disciplinary team. The
main characteristics of these projects are summarized below, by means of a series of
figures (A to C).
Figure A. Main characteristics of a cultural centre building - LEED certification project.
XIV
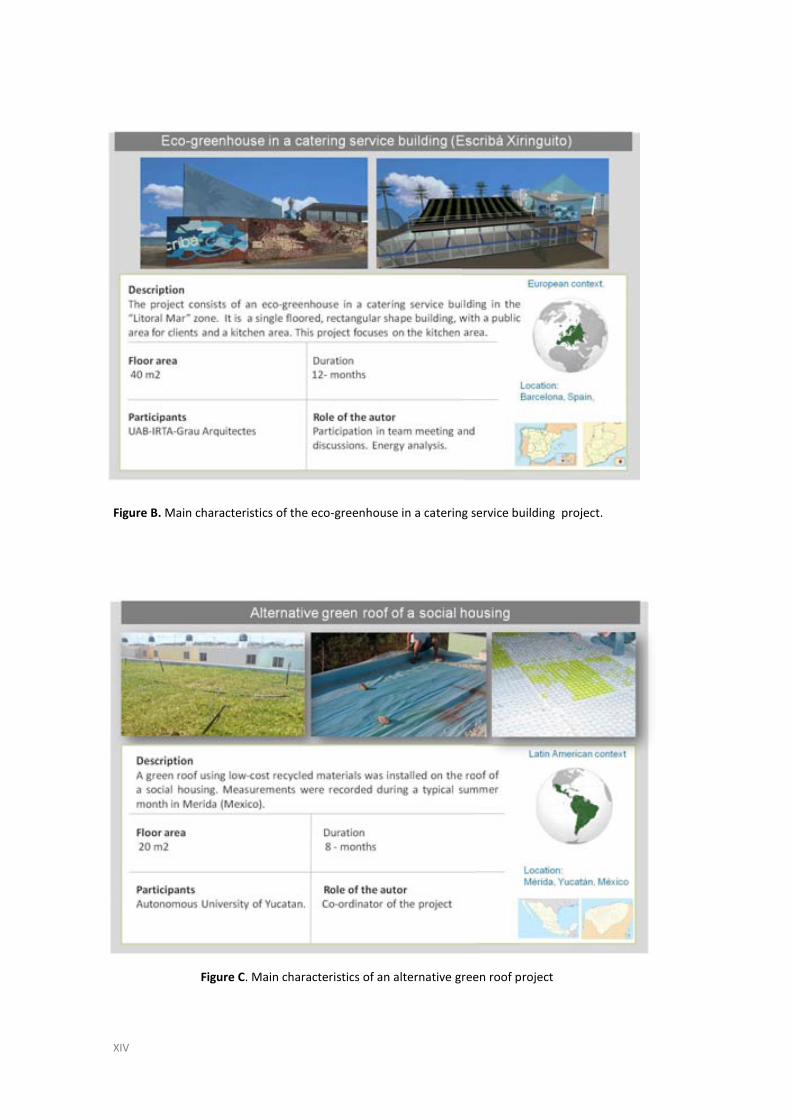
Figure B. Main characteristics of the eco-greenhouse in a catering service building project.
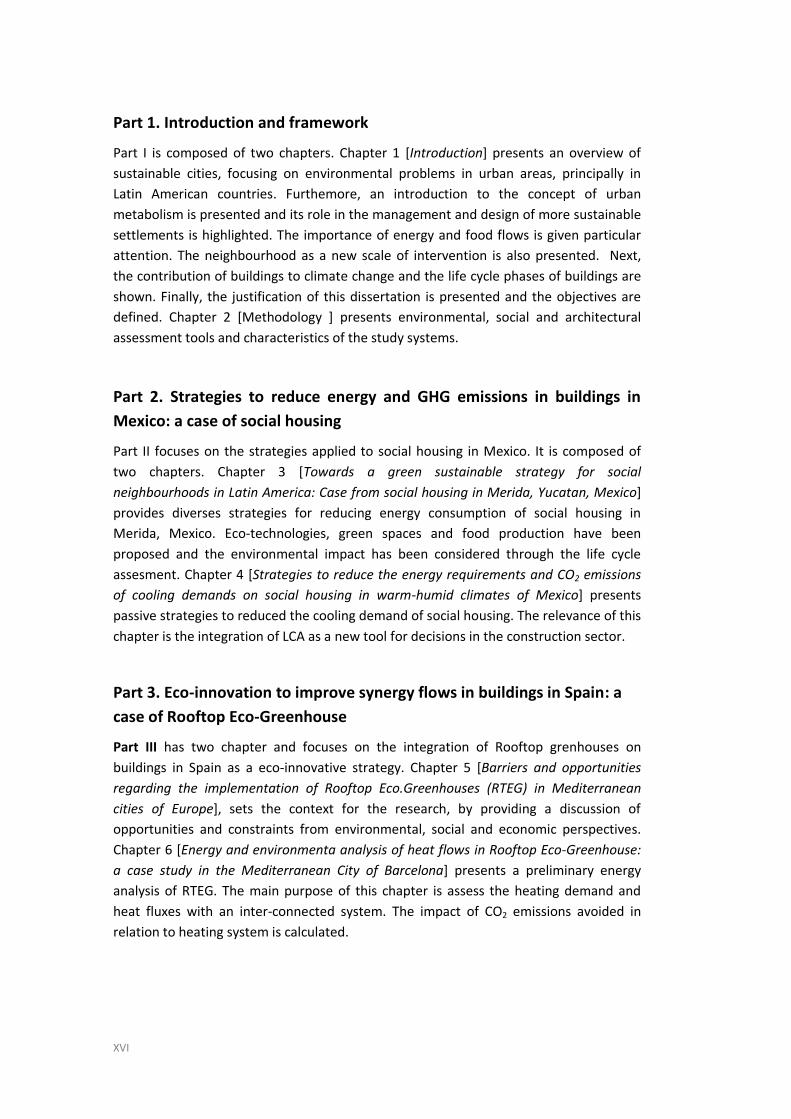
Figure C. Main characteristics of an alternative green roof project

XV
Structure of the dissertation
The structure of the dissertation is organised into four main parts and eight chapters.
For clarity, the structure of the doctoral thesis is further outlined in Figure D. This flow
chart can be used throughout the reading of this manuscript as a dissertation map.
Figure D. Map structure of dissertation
Part 1. Introduction and Framework
Introduction Material and methods
Towards a greensustainable strategy forsocial neighbourhoods inLatin America: Case fromsocial housing in Merida,Yucatan.
Strategies to reduce theenergy requirements andCO2 emissions of coolingdemands on social housingin warm-humid climates ofMexico.
Barriers and opportunitiesregarding the implementationof Rooftop Eco-Greenhouses(RTEG) in Mediterranean citiesof Europe
Part 4. General conclusions and future reserach
Conclusions of dissertation Future research
Chapter 1 Chapter 2
Chapter 3
Chapter 4
Chapter 5
Chapter 7 Chapter 8
Energy and environmentalanalysis of heat flows inRooftop Eco-Greenhouses: Acase study in theMediterranean City ofBarcelona.
Chapter6
Part 3. Eco-innovation to improvesynergy flows in buildings in Spain: a
case of Rooftop-Eco-Greenhouse
Part 2. Strategies to reduce energy and GHG emissions in buildings in
Mexico: a case of social housing
XVI
Part 1. Introduction and framework
Part I is composed of two chapters. Chapter 1 [Introduction] presents an overview of
sustainable cities, focusing on environmental problems in urban areas, principally in
Latin American countries. Furthemore, an introduction to the concept of urban
metabolism is presented and its role in the management and design of more sustainable
settlements is highlighted. The importance of energy and food flows is given particular
attention. The neighbourhood as a new scale of intervention is also presented. Next,
the contribution of buildings to climate change and the life cycle phases of buildings are
shown. Finally, the justification of this dissertation is presented and the objectives are
defined. Chapter 2 [Methodology ] presents environmental, social and architectural
assessment tools and characteristics of the study systems.
Part 2. Strategies to reduce energy and GHG emissions in buildings in
Mexico: a case of social housing
Part II focuses on the strategies applied to social housing in Mexico. It is composed of
two chapters. Chapter 3 [Towards a green sustainable strategy for social
neighbourhoods in Latin America: Case from social housing in Merida, Yucatan, Mexico]
provides diverses strategies for reducing energy consumption of social housing in
Merida, Mexico. Eco-technologies, green spaces and food production have been
proposed and the environmental impact has been considered through the life cycle
assesment. Chapter 4 [Strategies to reduce the energy requirements and CO2 emissions
of cooling demands on social housing in warm-humid climates of Mexico] presents
passive strategies to reduced the cooling demand of social housing. The relevance of this
chapter is the integration of LCA as a new tool for decisions in the construction sector.
Part 3. Eco-innovation to improve synergy flows in buildings in Spain: a
case of Rooftop Eco-Greenhouse
Part III has two chapter and focuses on the integration of Rooftop grenhouses on
buildings in Spain as a eco-innovative strategy. Chapter 5 [Barriers and opportunities
regarding the implementation of Rooftop Eco.Greenhouses (RTEG) in Mediterranean
cities of Europe], sets the context for the research, by providing a discussion of
opportunities and constraints from environmental, social and economic perspectives.
Chapter 6 [Energy and environmenta analysis of heat flows in Rooftop Eco-Greenhouse:
a case study in the Mediterranean City of Barcelona] presents a preliminary energy
analysis of RTEG. The main purpose of this chapter is assess the heating demand and
heat fluxes with an inter-connected system. The impact of CO2 emissions avoided in
relation to heating system is calculated.

XVII
Part 4. General conclusions and future research
Part IV includes Chapter 7, which provides the general conclusions of the dissertation,
and Chapter 8, which proposes future fields of research associated with the objectives of
dissertation.

XVIII

1
PART 1 INTRODUCTION AND FRAMEWORK
PAR
T
1 Introduction and Framework

2
PART 1 INTRODUCTION AND FRAMEWORK

3
PART 1 INTRODUCTION AND FRAMEWORK
Introduction and famework
Chapter 1
Introduction and framework
PHOTOGRAPHY BY ILEANA CERON
4
PART 1 INTRODUCTION AND FRAMEWORK
Chapter I defines sustainable development and shows how it can be applied to cities.
Furthemore, it presents the role of cities in climate change, including environmental
problems in developing countries. An overview of the paradigm of sustainable cities is
included, focusing on urban metabolism. Initiatives at a neighbourhood scale are also
presented. The importance of integrating Life Cycle Assessment (LCA) into the building
sector, in order to reduce energy and GHG emissions are also be presented. Finally, the
motivation of this dissertation and objectives are defined.
The chapter is structured as follows:
Key features of sustainable cities
Motivation of the dissertation
Objectives of the dissertation
5
PART 1 INTRODUCTION AND FRAMEWORK
1.1 Key features of sustainable cities
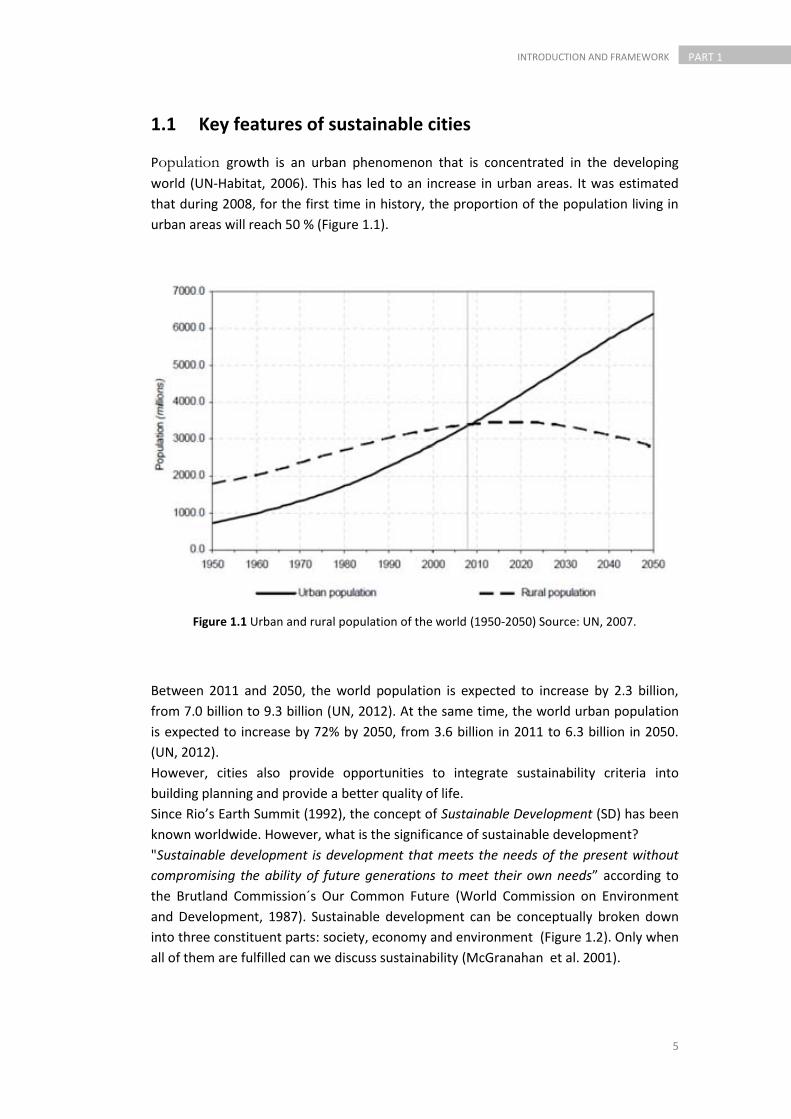
Population growth is an urban phenomenon that is concentrated in the developing
world (UN-Habitat, 2006). This has led to an increase in urban areas. It was estimated
that during 2008, for the first time in history, the proportion of the population living in
urban areas will reach 50 % (Figure 1.1).
Figure 1.1 Urban and rural population of the world (1950-2050) Source: UN, 2007.
Between 2011 and 2050, the world population is expected to increase by 2.3 billion,
from 7.0 billion to 9.3 billion (UN, 2012). At the same time, the world urban population
is expected to increase by 72% by 2050, from 3.6 billion in 2011 to 6.3 billion in 2050.
(UN, 2012).
However, cities also provide opportunities to integrate sustainability criteria into
building planning and provide a better quality of life.
Since Rio’s Earth Summit (1992), the concept of Sustainable Development (SD) has been
known worldwide. However, what is the significance of sustainable development?
"Sustainable development is development that meets the needs of the present without
compromising the ability of future generations to meet their own needs” according to
the Brutland Commission´s Our Common Future (World Commission on Environment
and Development, 1987). Sustainable development can be conceptually broken down
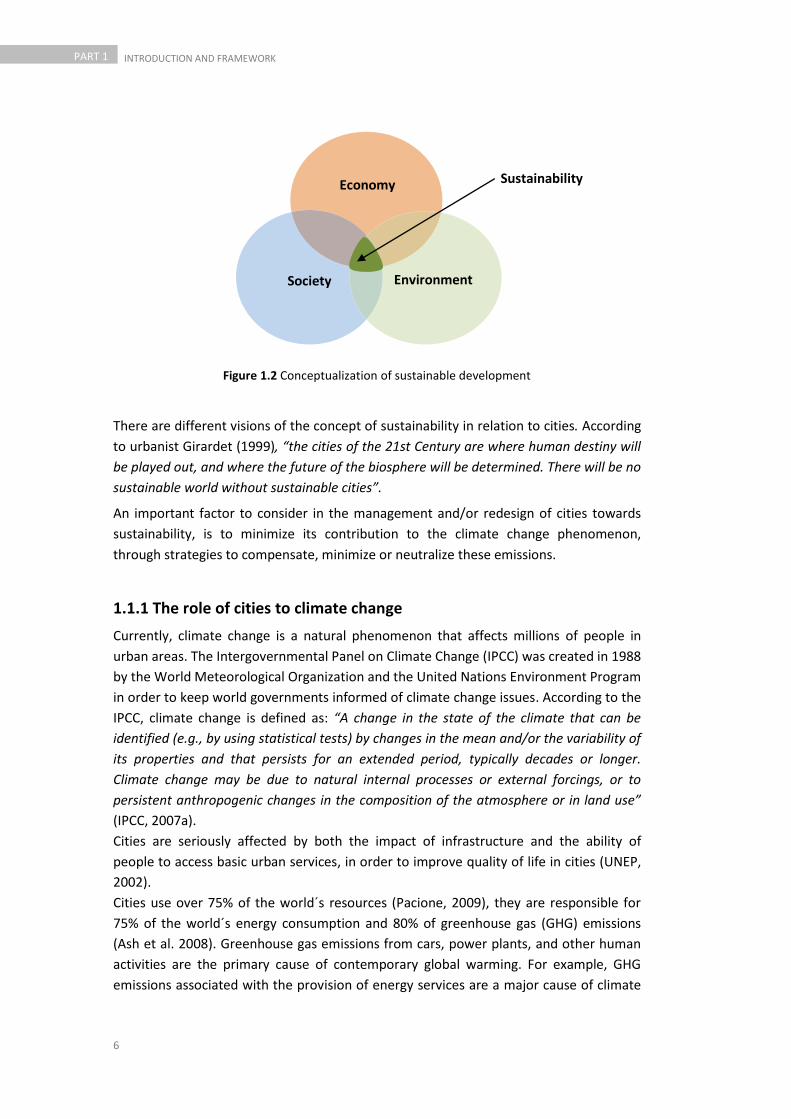
into three constituent parts: society, economy and environment (Figure 1.2). Only when
all of them are fulfilled can we discuss sustainability (McGranahan et al. 2001).
6
PART 1 INTRODUCTION AND FRAMEWORK
Figure 1.2 Conceptualization of sustainable development
There are different visions of the concept of sustainability in relation to cities. According
to urbanist Girardet (1999), “the cities of the 21st Century are where human destiny will
be played out, and where the future of the biosphere will be determined. There will be no
sustainable world without sustainable cities”.
An important factor to consider in the management and/or redesign of cities towards
sustainability, is to minimize its contribution to the climate change phenomenon,
through strategies to compensate, minimize or neutralize these emissions.
1.1.1 The role of cities to climate change
Currently, climate change is a natural phenomenon that affects millions of people in
urban areas. The Intergovernmental Panel on Climate Change (IPCC) was created in 1988
by the World Meteorological Organization and the United Nations Environment Program
in order to keep world governments informed of climate change issues. According to the
IPCC, climate change is defined as: “A change in the state of the climate that can be
identified (e.g., by using statistical tests) by changes in the mean and/or the variability of
its properties and that persists for an extended period, typically decades or longer.
Climate change may be due to natural internal processes or external forcings, or to
persistent anthropogenic changes in the composition of the atmosphere or in land use”
(IPCC, 2007a).
Cities are seriously affected by both the impact of infrastructure and the ability of
people to access basic urban services, in order to improve quality of life in cities (UNEP,
2002).
Cities use over 75% of the world´s resources (Pacione, 2009), they are responsible for
75% of the world´s energy consumption and 80% of greenhouse gas (GHG) emissions
(Ash et al. 2008). Greenhouse gas emissions from cars, power plants, and other human
activities are the primary cause of contemporary global warming. For example, GHG
emissions associated with the provision of energy services are a major cause of climate
Economy
Society Environment
Sustainability

7
PART 1 INTRODUCTION AND FRAMEWORK
change (Moomaw et al. 2011). The International Energy Agency (IEA) estimates that
urban areas currently account for more than 71% of energy-related global greenhouse
gases and this is expected to rise to 76 % by 2030 (IEA, 2011).
Since the industrial revolutions, GHG emissions from human activity have increased
rapidly and are predicted to increase further by 2030 as shown in Figure 1.3.
Figure 1.3 Global CO2 emissions from 1850 to 2030. Source: C2ES (2012)
The governments of each country have acquired a great importance in mitigation and
adaptation to climate change. Agenda 21 is a UN initiative that 178 governments at the
United Nations Conference on Environment and Development (UNCED) adopted in 1992
under the auspices of saving the environment. In the context of the current European
Climate Change policy, “Energy for a changing world”, also called 20-20-20, the
Covenant of Mayors (which involves local authorities from countries within the
European Union), was signed with the purpose of improving energy efficiency and
promoting renewable energies in services (Covenant of Mayors, 2008). The key
document of the Covenant of Mayors is the Sustainable Energy Action Plans (SEAP).
Adapting to climate change is a challenge for all countries. From a global perspective,
this challenge is probably greatest for developing countries. These countries are most
vulnerable to climate change and its effects, such as increased temperature, drought
and hurricanes. Many industries, for example, tourism, fisheries and agriculture, depend
on weather conditions.
Urban change and environmental problems in developing Countries: The case
of Latin America
Latin America and the Caribbean (LAC) is the most urbanized region in developing world
with 80% of its relatively young population living in cities (UNFPA, 2007).
8
PART 1 INTRODUCTION AND FRAMEWORK
Quality of life in these countries is affected by the rapid deterioration of the urban
environment, due to the degradation of the built environment and the contamination or
depletion of natural resources (Bolay et al. 2005). These problems are caused by urban
development and population growth. This growth is due in a large part to the
abandonment of rural areas in search of new opportunities in cities. Cities occupy
extensive areas and they cause significant loss of agricultural land and green areas. The
high rates of urban growth during the 60s and 70s produced a rapid urbanization and
various kinds of environmental problems.
A summary of important environmental data according to a study in 17 cities in Latin
America by the Economist Intelligence Unit (2010) is presented. The study includes most
major Latin American urban areas. Capital cities and leading business capitals were
selected, both for their size and importance. The principal results observed were:
Cities in Latin America face an enormous challenge due to the growth of
informal settlements and unplanned growth of urban areas. Sustainable
construction does not have a high relevance: Only 9 cities have full or partial
standards for construction and only 4 cities promote energy efficiency in
buildings.
Latin American cities generate less waste per capita than European cities: 465
Kg/year versus 511 kg/year.
Air quality is a major environmental problem. The car is the predominant mode
of transport and therefore is a major source of pollution.
On the subject of water, wastewater collection covers on average 94% of the
cities in regular residential areas. However, on average, only 52% of wastewater
is treated.
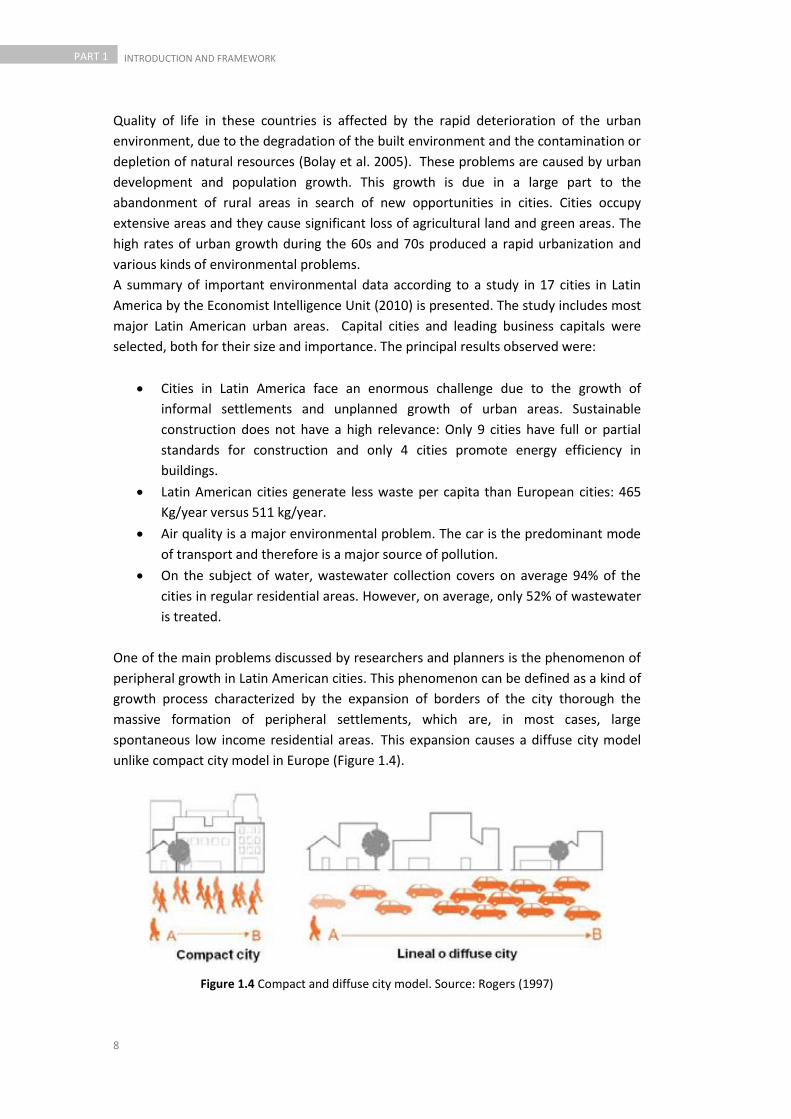
One of the main problems discussed by researchers and planners is the phenomenon of
peripheral growth in Latin American cities. This phenomenon can be defined as a kind of
growth process characterized by the expansion of borders of the city thorough the
massive formation of peripheral settlements, which are, in most cases, large
spontaneous low income residential areas. This expansion causes a diffuse city model
unlike compact city model in Europe (Figure 1.4).
Figure 1.4 Compact and diffuse city model. Source: Rogers (1997)
9
PART 1 INTRODUCTION AND FRAMEWORK
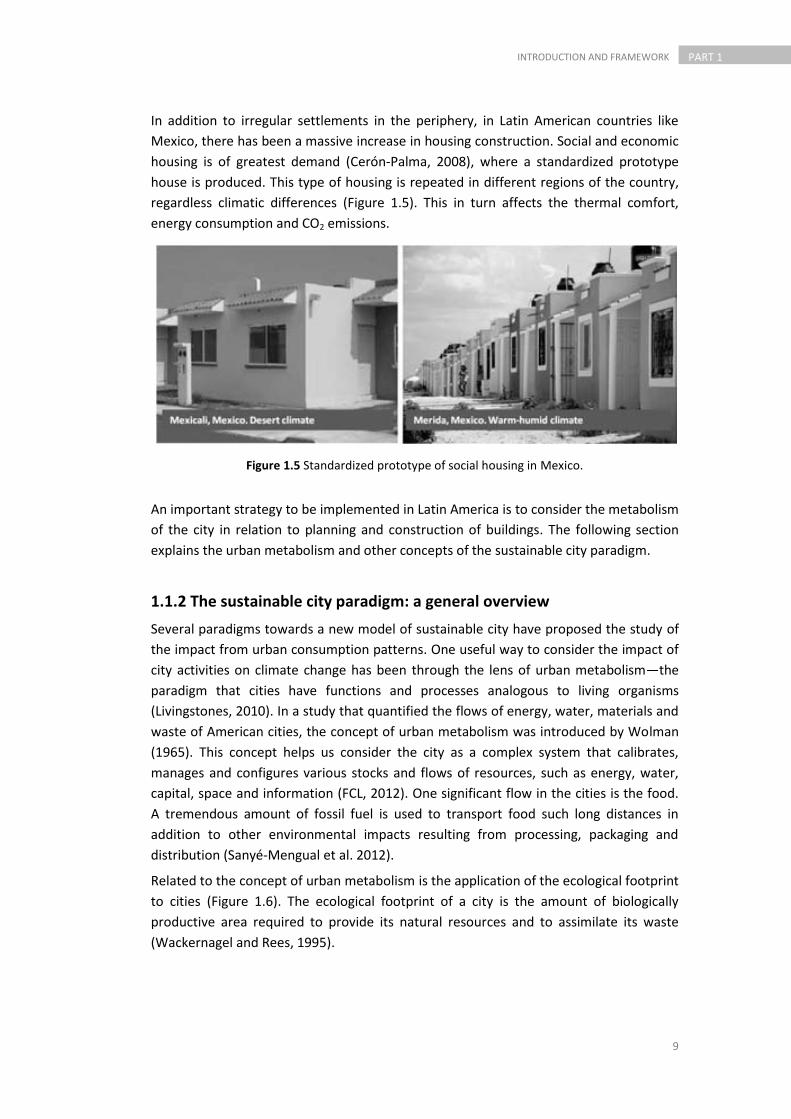
In addition to irregular settlements in the periphery, in Latin American countries like
Mexico, there has been a massive increase in housing construction. Social and economic
housing is of greatest demand (Cerón-Palma, 2008), where a standardized prototype
house is produced. This type of housing is repeated in different regions of the country,
regardless climatic differences (Figure 1.5). This in turn affects the thermal comfort,
energy consumption and CO2 emissions.
Figure 1.5 Standardized prototype of social housing in Mexico.
An important strategy to be implemented in Latin America is to consider the metabolism
of the city in relation to planning and construction of buildings. The following section
explains the urban metabolism and other concepts of the sustainable city paradigm.
1.1.2 The sustainable city paradigm: a general overview
Several paradigms towards a new model of sustainable city have proposed the study of
the impact from urban consumption patterns. One useful way to consider the impact of
city activities on climate change has been through the lens of urban metabolism—the
paradigm that cities have functions and processes analogous to living organisms
(Livingstones, 2010). In a study that quantified the flows of energy, water, materials and
waste of American cities, the concept of urban metabolism was introduced by Wolman
(1965). This concept helps us consider the city as a complex system that calibrates,
manages and configures various stocks and flows of resources, such as energy, water,
capital, space and information (FCL, 2012). One significant flow in the cities is the food.
A tremendous amount of fossil fuel is used to transport food such long distances in
addition to other environmental impacts resulting from processing, packaging and
distribution (Sanyé-Mengual et al. 2012).
Related to the concept of urban metabolism is the application of the ecological footprint
to cities (Figure 1.6). The ecological footprint of a city is the amount of biologically
productive area required to provide its natural resources and to assimilate its waste
(Wackernagel and Rees, 1995).
10
PART 1 INTRODUCTION AND FRAMEWORK
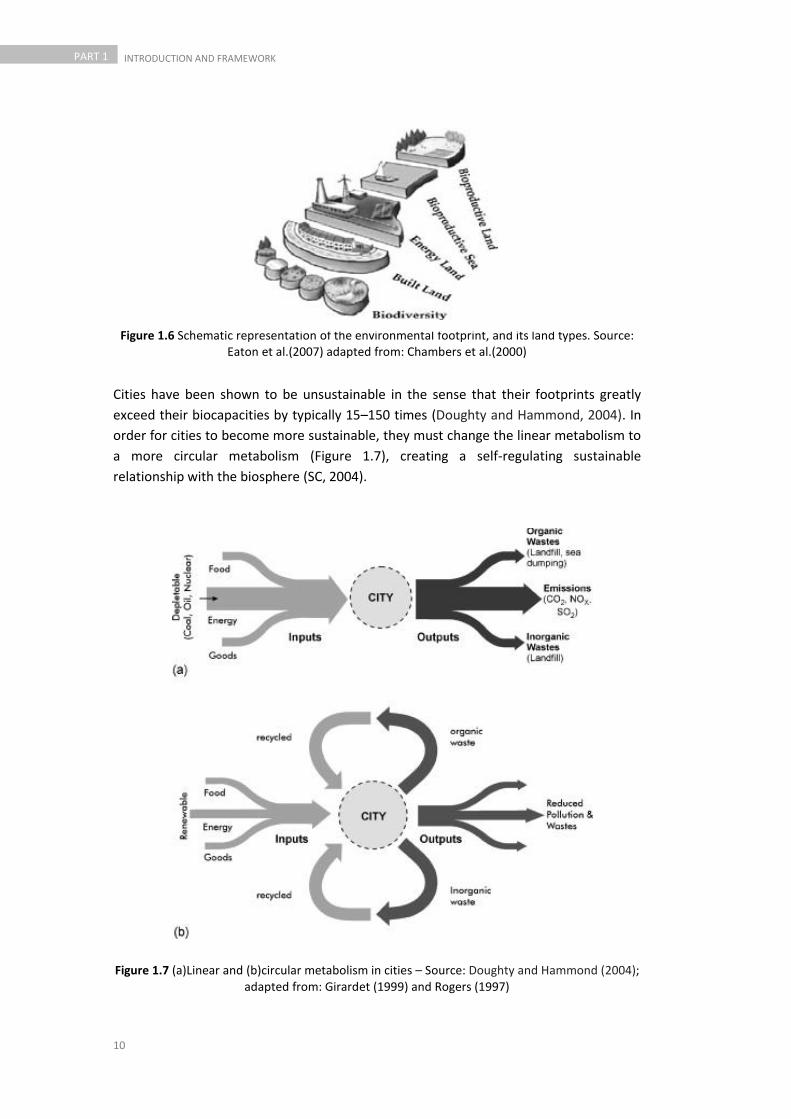
Figure 1.6 Schematic representation of the environmental footprint, and its land types. Source: Eaton et al.(2007) adapted from: Chambers et al.(2000)
Cities have been shown to be unsustainable in the sense that their footprints greatly
exceed their biocapacities by typically 15–150 times (Doughty and Hammond, 2004). In
order for cities to become more sustainable, they must change the linear metabolism to
a more circular metabolism (Figure 1.7), creating a self-regulating sustainable
relationship with the biosphere (SC, 2004).
Figure 1.7 (a)Linear and (b)circular metabolism in cities – Source: Doughty and Hammond (2004); adapted from: Girardet (1999) and Rogers (1997)

11
PART 1 INTRODUCTION AND FRAMEWORK
Addition to energy, water and goods, in the current linear metabolism in cities, food is a
significant input. The food flow model involves a tremendous amount of fossil fuels,
which is used to transport food, in addition to other environmental impacts resulting
from processing, packaging and distribution (Figure 1.8) (Sanyé-Mengual et al. 2012).
Figure 1.8 Linear system of food production. Source: Cerón-Palma et al. (2011)
Food production in isolated agricultural areas causes an increase in distance that the
food has to travel to cities, thus producing large GHG emissions. There are only a few
studies that quantify the benefits of the integration of food production in cities.
However, the introduction of food production in cities is an issue that should be
considered in future for the planning of sustainable cities.
Initiatives for sustainable cities
In cities, inhabitants are concerned about air pollution, congestion, dirty water and
waste, so authorities are pressed, in order to innovate and deliver greener, cleaner,
more pleasant places to live. Currently, there are programs and initiatives to promote
more efficient and sustainable cities through eco-innovation. This is defined as “the
systematic incorporation of life cycle considerations into the design of products,
processes or services” (Tukker et al. 2000). Previously, the concept of eco-innovation
was applied mainly to products (James, 1997). Today, eco-innovation transcends the
limits of urban sustainability and climate change. It is the development of technical and
management approaches to the challenge of reducing the environmental footprint of
human settlement.
In Latin America, Curitiba in Brazil is one of the best examples of a sustainable city, it
shows that a city can minimise its environmental impact and be attractive. Today, the
city provides about 52 m2 of green space for every inhabitant, an increase of from 1 m2
in 1970. Some 70% of all waste is recycled (European Commission Environment, 2011).
Curitiba provides the world with a model in how to integrate sustainable transport
12
PART 1 INTRODUCTION AND FRAMEWORK
considerations into business development, road infrastructure development, and local
community development.
In Europe, Copenhagen has the largest wind turbine industry in the world. Denmark is
also the leader in wind production—supplying roughly 19 percent of the country’s
power needs. As part of Copenhagen’s goal to become the world’s first carbon neutral
capital by 2025, city officials have introduced a mandatory green roof policy, requiring
all new developments to incorporate some type of provision for vegetation into the
building’s roof design (Estries, 2009).
Diverse investigations have been conducted in order to evaluate the application of new
tools from industrial ecology and eco-design at different scales, for example city,
neighborhood, building and urban elements. For instance, Rieradevall et al. (2009) focus
on environmental optimization of urban public space through LCA, Farreny et al (2009)
on ecodesign at a neighbourhood scale, Oliver-Solá et al. (2009a) on environmental
impacts of infrastructure scale. Engel-Yan et al (2005) suggest that the focus should be
on the design of sustainable neighbourhoods.
1.1.3 The neighbourhood as a new scale for intervention for sustainable
cities
Recently, several studies relating to new and rehabilitated urban areas show the
neighbourhood as a new scale for more efficient intervention for sustainable cities
Farreny et al. (2011) have applied the ecodesign methodology to plan a sustainable
neighbourhood in a greenfield area called Vallbona in Barcelona, Spain. In this work,
opportunities and constraints have been determined. It has been concluded that a
unique path to design sustainable neighbourhoods cannot be taken, because each
neighbourhood has different demands.
The first eco-district in Barcelona designed was for the municipality of Figueres in
Girona. The proposed access to the neighborhood is via peripheral streets, with no cars.
Car parks will be grouped in specific buildings and there will be spaces for bicycles and
pedestrians. The buildings will be orientated correctly for cross ventilation. Each of the
design decisions have been taken in relation to a previous study which analyzed the
flows of the neighborhood (Rueda et al. 2012).
There are also existing neighbourhoods that are referred to as green because of their
excellent environmental performance. The areas of Risefeld and Vauban in Freiburg
(Germany) are considered important references for eco-neighbourhoods in the world.
In Risefeld, all houses are built as low-energy buildings with solar panels and climatic
aspects have been considered. Green spaces, open areas, bicycle paths and other spatial
aspects were considered at the planning stage. 80% of the water comes from rain
harvesting (Beim et al. 2010).
The Vauban Quarter was created in an area of 38 hectares, located close to the city
centre. Low-energy building is obligatory in this district; zero-energy and energy-plus
building and the application of solar technology are standard for most. Parallel to private
development, infrastructure was created that encompassed schools, kindergartens,

13
PART 1 INTRODUCTION AND FRAMEWORK
youth facilities, civic meeting places, a market place, as well as spaces for recreation and
play. Vegetation-covered flat roofs store rainwater, which is collected and re-used (Field,
2010).
Other examples in Europe of sustainable neighbourhoods include Amsterdam-Ijburg,
Copenhagen-Orestad and Hammarby Sjostad in Stockholm.
In United Kinston, in BedZED, located in London, homes achieved an 84% reduction in
energy and footprints related to mobility decreased by 36%. Recycling reduced waste by
between 17% and 42% (Barrett et al. 2006). There are several other initiatives of eco-
neighborhoods in Europe and in the United States and Latin America.
There is no specific recipe for an optimal design, but it is important to include
environmental and quantification tools from the planning stage. A multi-disciplinary
team is needed to produce the design.
1.1.4 Building: An essential sector in climate change mitigation
The integration of the concept of sustainability to the building sector is one of initiatives
that have been developed during recent years. The construction sector is associated
with a number of negative environmental impacts. At the present, the sector
contributes a huge amount to the global environmental load. For example, around 40%
of total energy consumption in Europe and 60% of raw materials extracted from the
lithosphere are attributed to this sector (Zabalzan et al. 2011). In developed countries,
residential and commercial buildings account for nearly 40% of all carbon emissions and
consume as much as 73% of electricity (DAC, 2011).The Intergovernmental Panel on
Climate Change (IPCC) estimates that by 2030, greenhouse gas (GHG) emissions from
buildings will account for over one-third of total emissions (Levine et al. 2007). This data
explains the importance of implementing eco-innovative strategies and initiatives in the
construction sector.
Life cycle phases of buildings
The environmental impacts of buildings occur during all stages of its life cycle.
According to Guide to Life Cycle Assessment of Buildings published by American Institute
Architects (AIA) (Bayer et al. 2010), the Life-Cycle Stages of a building are:
Materials Manufacturing: Removal of raw materials from earth, transportation of
materials to manufacturing locations, manufacture of finished or intermediate materials
and products, and packaging and distribution of building products.
Construction: All activities relating to actual building construction.
Use and Maintenance: Building operation including energy consumption, water usage,
environmental waste generation, repair and replacement of building assemblies and
systems, and transport of equipment used for repair and replacement.
End of Life: Includes energy consumed and waste produced due to building demolition
and disposal of materials to landfills, and transport of waste materials. Recycling and
14
PART 1 INTRODUCTION AND FRAMEWORK
reuse activities related to demolition waste also can be included and have a “negative
impact.”
ISO 21930 (2007) describes the principles and framework for environmental declarations
of building products, taking into consideration the complete life cycle of a building.
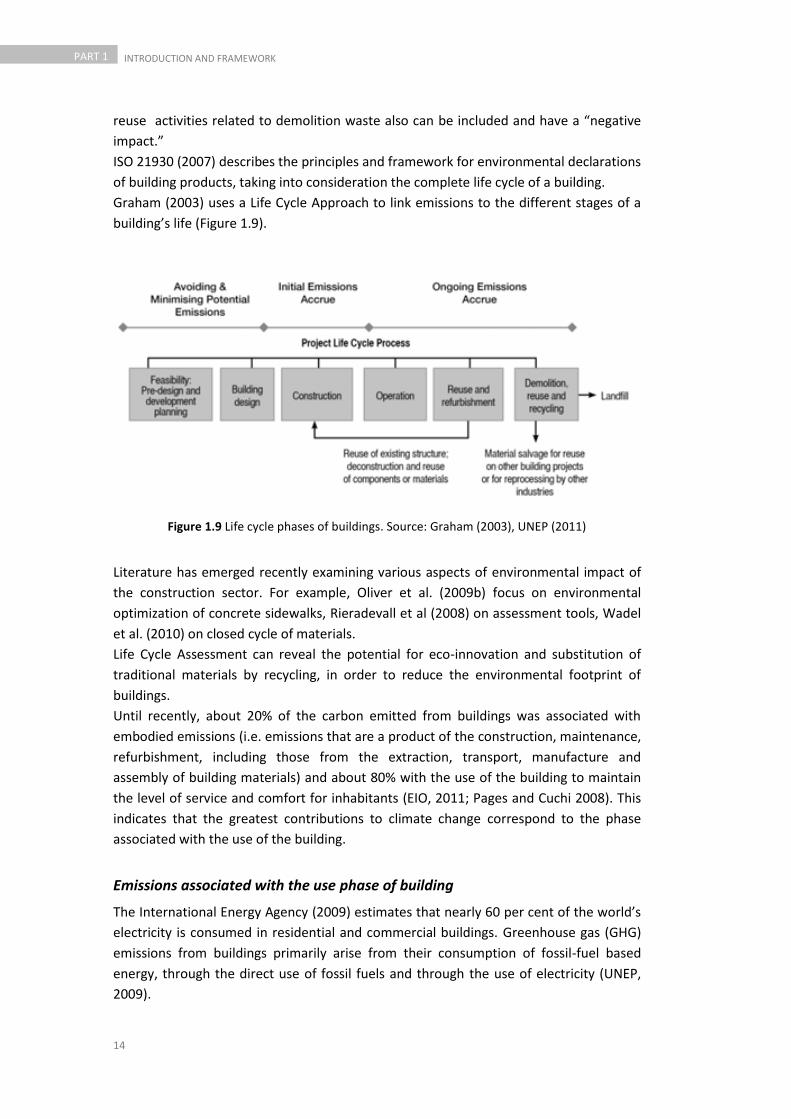
Graham (2003) uses a Life Cycle Approach to link emissions to the different stages of a
building’s life (Figure 1.9).
Figure 1.9 Life cycle phases of buildings. Source: Graham (2003), UNEP (2011)
Literature has emerged recently examining various aspects of environmental impact of
the construction sector. For example, Oliver et al. (2009b) focus on environmental
optimization of concrete sidewalks, Rieradevall et al (2008) on assessment tools, Wadel
et al. (2010) on closed cycle of materials.
Life Cycle Assessment can reveal the potential for eco-innovation and substitution of
traditional materials by recycling, in order to reduce the environmental footprint of
buildings.
Until recently, about 20% of the carbon emitted from buildings was associated with
embodied emissions (i.e. emissions that are a product of the construction, maintenance,
refurbishment, including those from the extraction, transport, manufacture and
assembly of building materials) and about 80% with the use of the building to maintain
the level of service and comfort for inhabitants (EIO, 2011; Pages and Cuchi 2008). This
indicates that the greatest contributions to climate change correspond to the phase
associated with the use of the building.
Emissions associated with the use phase of building
The International Energy Agency (2009) estimates that nearly 60 per cent of the world’s
electricity is consumed in residential and commercial buildings. Greenhouse gas (GHG)
emissions from buildings primarily arise from their consumption of fossil-fuel based
energy, through the direct use of fossil fuels and through the use of electricity (UNEP,
2009).
15
PART 1 INTRODUCTION AND FRAMEWORK
Energy is the most important factor in order to reduce GHG emissions. Measures to
reduce GHG emissions from buildings fall into one of three categories: reducing energy
consumption and embodied energy in buildings, switching to low-carbon fuels including
a higher share of renewable energy, or controlling the emissions of non-CO2 GHG gases.
This chapter devotes most attention to reduce energy consumption and GHG emissions
in existing buildings.
Energy efficiency in buildings
In relation to the design of energy-efficient buildings, three important factors are to be
considered: (a) first minimizing energy requirements through use of insulation, reducing
loads, solar analysis and other passives strategies, then (b) considering equipment that
consume less energy efficient offering the same service and, finally, (c) using renewable
energy for what cannot be resolved through passive strategies (Levine et al. 2007).
However, these strategies have to be different in each place. It is necessary to take the
climate, economics, technology and the culture into account.
One of the main measures in new or existing buildings is through the thermal envelope.
This term refers to the shell of the building as a barrier to unwanted heat or mass
transfer between the interior (Levine et al. 2007). Three important aspects of the
efficacy of the “thermal envelope” are: (a) levels of insulation and thermal bridges; (b)
thermal properties of materials, windows and doors; (c) and finally, air exchanges that
occur inside and outside of the building.
Reduce cooling loads and / or heating will improve the efficacy of the thermal envelope;
thermal comfort inside the building is another aspect to consider.
Several initiatives have been taken in Europe and Latin America to improve energy
efficiency in buildings. Further details are presented in the following chapters.
Despite the environmental and economic benefits that energy efficiency represents,
there are barriers to implementation in different countries. The Carbon Trust (2005)
suggests a classification of these barriers into four main categories: financial
costs/benefits; hidden costs/benefits; real market failures; and behavioural/
organizational non-optimalities.
It is necessary to define eco-innovative strategies to reduce energy consumption and
overcome barriers presented through research and quantification of the social,
environmental and economic benefits.

16
PART 1 INTRODUCTION AND FRAMEWORK
1.2 Motivation of the dissertation
A large percentage of the population lives in cities and this is a key contributor to
climate change. Cities and people are affected by the rapid deterioration of the urban
environment, cause by degradation of the built environment, contamination and
depletion of natural resources. Greenhouse gas emissions from cars, power plants, and
other human activities are the primary cause of global warming. It is necessary to define
strategies to reduce consumption, emissions and improve quality of life in urban
settlements. The key is in urban infrastructure: the systems of transportation, energy,
water, building, and communication that supports cities.
In addition to the current problems of cities, this dissertation is motivated by the
following specific realities:
Food and energy flows in cities:
Two important problems that we need to consider in cities, in addition to water and
emissions, are energy and food.
Energy is the most important factor in reducing GHG emissions. The
International Energy Agency (2009) estimates that nearly 60 per cent of the
world’s electricity is consumed in residential and commercial buildings. The data
indicates that there is an urgent need for new eco-innovative strategies in
order to reduce their environmental impact.
The food flow model involves energy costs and CO2 emissions in transport,
packaging and distribution. This affects the water cycle and leads to
fragmentation of the rural area and city (Arosemena, 2012). The integration of
distant areas of the city through agricultural activities gives the opportunity to
reduce the environmental footprint, which transforms spaces and leads to
degradation in productive use. However, there are only a few studies that
quantify the benefits of the integration of food production in cities.
Integrating eco-innovative strategies in the building sector is a priority in
developing countries. This is mainly due to the urban sprawl found in these
countries. There are two important issues: the uncontrolled action by the
building sector in order to meet housing demand and the high consumption by
its inhabitants in order to satisfy their basic needs. It is urgent to implement
these strategies, primarily for the rehabilitation of this sector, due to the large
number of constructed houses.
Energy and GHG emissions in buildings in Mexico
In Latin American countries such as Mexico, rapid urban growth and housing
demand, principally of social typology, presents an opportunity to propose and
evaluate strategies to reduce the environmental impact caused by the use of
the house and extrapolate these results to a neighbourhood and city scale.
17
PART 1 INTRODUCTION AND FRAMEWORK
Social housing provides one of the greatest demands for construction. However,
there is standardized prototype constructed in different regions, regardless of
differences in climate. This suggests that there is the need for studies with tools
to quantify energy saving that can be obtained using strategies for eco-
rehabilitation of these houses, or to be included at the design phase for new
houses. It is necessary to consider aspects such as location, climate, insulation
properties of materials and other factors. We should also consider strategies to
reduce GHG emissions associated with energy use in existing houses.
Energy and GHG emissions in buildings in Spain
In developed countries, reducing energy consumption and GHG emissions
remains the goal of the construction sector. However, there is a need to
investigate new eco-innovative proposals that could create synergies with
existing buildings. Investigating novel methods of food production in buildings is
a new and innovative strategy that could bring many benefits to rehabilitation.
Considering how roofs can be used as multi-use spaces, in cities such as
Barcelona (Spain), can contribute to turning gray spaces into productive spaces.
At the same time this can contribute to naturalization of the city, due to the fact
that green areas are reduced in the compact city model. However, there is a
little information about the use of roofs in urban areas for these purposes.
1.3 Objectives of the dissertation
The main objective of this dissertation is to develop strategies for sustainable urban
systems. This dissertation will focus on the assessment of eco-innovative strategies to
reduce energy consumption and GHG emissions in case studies assessing buildings in
two different contexts: Mexico and Spain.
Other objectives:
Demonstrate the benefits of integrating green spaces and food production in
cities.
Demonstrate the importance of implementing environmental and energetic
quantification tools such as LCA for decision making in the construction industry.
Integrate social, environmental and architectural tools in order to evaluate
strategies to be implemented in buildings.
Evaluate rehabilitation strategies for buildings in relation to green and eco-
technology criteria.

18
PART 1 INTRODUCTION AND FRAMEWORK
1.3.1 Specific objectives
Mexico: Eco-rehabilitation of social housing
Propose green and passive strategies for reducing GHG emissions.
Quantify the energy savings and GHG emissions saved with the implementation
of eco-technologies (efficient equipment) and green strategies (green spaces
and food production).
Estimate CO2 emissions fixed on green spaces (sedum) and food production
(tomato) on plot and roof.
Calculate the CO2eq emissions saved by not transporting the food (tomato) from
the production site to the consumer.
Assess low-cost passive and insulation strategies to reduce the cooling energy
demand and the equivalent CO2 emissions.
Quantify the cumulative energetic demand and CO2 emissions associated with
the materials used in low-cost passive strategies.
Propose the best environmental and energetic strategies as guidelines for the
eco-rehabilitation of existing social housing.
Spain: Roof Top Eco-Greenhouse (RTEG)
Examine the barriers and social, economic, environmental and technological
opportunities regarding the implementation of a new inter-connection concept
called RTEG in Mediterranean cities in Europe.
Identify barriers and opportunities for implementation in three types of
buildings: multi-household, educational and industrial.
Establish recommendations for overcoming barriers to the implementation of
the RTEG system.
Assess the energy saving potential by heating the building using a greenhouse
on the roof´s building.
Evaluate the insulating effect of using a greenhouse on the roof´s building in
relation to potential energy saving with regards to heating requirements for the
study building.
Study the internal temperature in a building and a greenhouse at different time
intervals during a single day during winter.
Assesses the energy flows of RTEG interconnect in a building during a day in
winter.
Estimate the amount of residual heat available for interchange in a building and
a greenhouse during a day in winter.
Estimate CO2 emissions avoided by minimising resource consumption generated
by heating systems (electric, gas, diesel)

19
PART 1 INTRODUCTION AND FRAMEWORK
References to Chapter 1
Arosemena, G (2012). Urban agriculture, Ed.Gustavo Gili, Spain.
Ash, C., Jasny, B.R., Roberts, L., Stone, R., Sugden, A (2008). Reimagining cities ‐ Introduction. Science. 319(5864):739‐739.
Barrett, J., Birch, R., Baiocchi, G, Minx, J. and Wiedmann, T (2006). Environmental impacts of UK consumption: Exploring links to wealth,inequality and lifestyle. IABSE Henderson Colloquium, Cambridge.
Bayer, C., Gentry, R., Joshi, S (2010). A Guide to Life Cycle Assessment of Buildings. The American Institute of Architects, Washington, DC.
Beim, M., Martin Haag (2010). Freiburg’s way to sustainability: the role of integrated urban and transport planning. In. Manfred S., Vasily V., Popovich, Zeile P (Eds) REAL CORP 2010 Proceedings/Tagungsband. Vienna
Bolay, JC., Pedrazzini, Y., Rabinovich, A., Catenazzi, A. and Garcia-Pleyan, C (2005). Innovations in the Urban Environmental and Social Disparities in Latin America: The Shift from Technical to Social Issues as the True Challenge of Change, Habitat International 29: 627–645.
Carbon Trust (2005). The UK Climate Change Programme: potential evolution for business and the public sector. Technical Report. <http://www.carbontrust.co.uk/Publications/publicationdetail.htm?productid=CTC518> Accessed 3.07.12
Cerón-Palma, I (2008). Evaluación de Factores de Confort y contaminación ambiental en la vivienda económica de clima cálido-húmedo. Master disertación. Facultad de Ingeniería. Universidad Autónoma de Yucatán.
Ceron-Palma, I., Sanyé-Mengual, E., Oliver-Solà, J., Montero, J.I., Rieradevall, J (2011). Energy saving from a roof top greenhouse in a public building of Barcelona, Spain. 6th International Conference on Industrial Ecology. ISIE 2011. Berkeley (California).
Covenant of Mayors European Union (2008). Sustainable Energy Action Plans <http://www.eumayors.eu/index_en.html> Accessed 16.08.11
C2ES (2012). Center for climate and energy solutions. Historical global CO2 emissions. <http://www.c2es.org/facts-figures/international-emissions/historical>. Accessed 11.08.12.
Chambers, M., Simmons, C., Wackernagel, M (2000). Sharing Natures Interest: Ecological Footprints as an Indicator of Sustainability. Earthscan Publications, London.
DAC (2012). Building and sustainable cities. Danish Architecture Centre, Copenhagen. <http://www.dac.dk/en/dac-cities/sustainable-cities-2/background-articles/buildings-and-sustainable-cities/>. Accessed 29.09.12
Doughty, M., Hammond, G (2004). Sustainability and the built environment at and beyond the city scale. Building and environment, 39: 223–1233

20
PART 1 INTRODUCTION AND FRAMEWORK
Eaton, R., Geoffrey, P., Hammond, JL (2007). Footprints on the landscape: An environmental appraisal of urban and rural living in the developed world, Landscape and Urban Planning, 83(1):13-28
Economist Intelligence Unit (2010). Latin American Green City Index. Siemens AG, Munich, Germany.
EIO (2011). Thematic Report: Resource-efficient construction. Ecoinnovation Observatory. <www.eco-innovation.eu> Accesed 09.07.12
Engel‐Yan, J., Kennedy, C., Saiz, S., Pressnail, K (2005). Toward sustainable neighbourhoods: the need to consider infrastructure interactions. Canadian Journal of Civil Engineering, 32(1): 45‐57.
Estries, M (2009). Top Five Most Sustainable Cities in the World <http://www.ecomagination.com/top-five-most-sustainable-cities-in-the-world> Accessed 18-07-12
European Commissioner for the Environment, 2011. Cities setting standards in eco-innovation. Eco-innovation action plan. <http://ec.europa.eu/environment/ecoap/about-eco-innovation/good-practices/eu/707_en.htm> Accessed 18.07.12
Farreny, R., Pich‐Aguilera, F., Batlle, T., Botton, J., Terrisse, A., Thorson, O., Cot, E., Gabarrell, X., Rieradevall, J., Oliver‐Solà, J., Batlle, E., Riera, P., Grau, L (2009). Concepts for a Sustainable District in Barcelona: a focus on selfsufficiency of resources. Oral Communication. 8th International EcocityConference, Ecocity World Summit, Istanbul (Turkey).
Farreny, R., Oliver-Solá, J., Montlleó M., Escriba, E., Gabarrel, X., Rieradevall, J (2011). Transition Towards Sustainable Cities: Opportunities, Constraints and Strategies in Planning. A Neighbourhood Eco-Design Case Study in Barcelona (Spain). Environment and Planning A, 43:1118-1134
FCL (2012). Future cities laboratory. Urban metabolism. <http://www.futurecities.ethz.ch/about/fcl> Accessed 3.07.12
Field, S (2009). Case study: Vauban, Freiburg. <www.itdp.or> Accessed 23-06-2012
Gabarrell, X., Frangkou, M., Rieradevall, J., Farreny, R., Villalba, G., Sendra, C., Vicent, T., Oliver‐Solà, J (2008). Strategies for a More Sustainable Urban Environment Based on Integrated Self‐Sufficiency Indices and Life Cycle Assessment. Oral Communication. 7th International Ecocity Conference, Ecocity World Summit, San Francisco (USA).
Girardet, H (1999). Creating sustainable cities. Green Books / The Schumacher Society, Totnes.
Hoornweg, D., Sugar, L. and Trejos Gomez, C. L. (2011). Cities and Greenhouse Gas Emissions: Moving Forward. Environment & Urbanization, First on line.
International Energy Agency (2009). Key World Energy Statistics. International Energy Agency, Paris. <http://www.iea.org/textbase/nppdf/free/2009/key_stats_2009.pdf> Accessed 3.08.12
21
PART 1 INTRODUCTION AND FRAMEWORK
IPCC, 2007. Climate Change (2007). Synthesis Report. Contribution of Working Groups I, II and III to the Fourth Assessment Report of the Intergovernmental Panel on Climate Change. Core Writing Team, R.K. Pachauri, and A. Reisinger (eds.), Cambridge University Press, 104 pp.
ISO (2007). International Standard ISO21930: Sustainability in building construction –Environmental declaration of building products
James, P. (1997). The Sustainability Circle: a new tool for product development and design. Journal of Sustainable Product Design, 2:52–57.
Levine, M., D. Ürge-Vorsatz, K. Blok, L. Geng, D. Harvey, S. Lang, G. Levermore, A. Mongameli Mehlwana, S. Mirasgedis, A. Novikova, J. Rilling, H. Yoshino, (2007). Residential and commercial buildings. In Climate Change 2007: Mitigation. Contribution of Working Group III to the Fourth Assessment Report of the Intergovernmental Panel on Climate Change [B. Metz, O.R. Davidson, P.R. Bosch, R. Dave, L.A. Meyer (eds)], Cambridge University Press, Cambridge, United Kingdom and New York, NY, USA. <http://www.ipcc.ch/pdf/assessment-report/ar4/wg3/ar4-wg3-chapter6.pdf> Accessed 17.05.12.
McGranahan, G., Jacobi, P., Songsore, J., Surjadi, C., Kjellen, M (2001). The Citizens at Risk. From Urban Sanitation to Sustainable Cities. Earthscan, London.
Moomaw, W., F. Yamba, F., Kamimoto, M., Maurice, L., Nyboer, J., Urama, K., Weir, T (2011). Introduction. In IPCC Special Report on Renewable Energy Sources and Climate Change Mitigation [O. Edenhofer, R., Pichs-Madruga, Y., Sokona, K., Seyboth, P,. Matschoss, S., Kadner, T., Zwickel, P., Eickemeier, G., Hansen, S., Schlömer, C.von Stechow (eds)], Cambridge University Press, Cambridge, United Kingdom and New York, NY, USA.
Oliver-Solà, J., Rieradevall, J., Gabarrell, X., (2009a). Environmental impacts of the infrastructure for district heating in urban neighbourhoods. Energy Policy, 37(11): 4711-4719.
Oliver-Solà, J., Josa, A., Rieradevall, J., Gabarrell, X (2009b). Environmental optimization of concrete sidewalks in urban areas. International Journal of Life Cycle Assessment, 14(4): 302-312
Pacione, M (2009). Urban geography. A global perspective. Oxon (UK): Routledge.
Pages, A. and Cuchi, A (2008). Moving the entire building sector towards low co2 emissions. A: "25TH PLEA INTERNATIONAL CONFERENCE". University College Dublin, 2008, p. 149.
Rieradevall, J., Gabarrell, X., Vicent, T., Villalba, G., Farreny, R., Frakgou, M., Oliver‐Solà, J., Sendra, C., Borrós, M., García‐Lozano, R (2008). Herramientas ambientales para el diseño de ciudades sostenibles. Oral Communication Congreso Internacional de Ingeniería Civil, San José (Costa Rica).
Rieradevall, J., Gabarrell, X., Farreny, R., Oliver-Solà, J (2009). Environmental optimization of urban public space through LCA. Proceedings CILCA 2009. Chile.
Rogers, R (1997). Cities for a Small Planet. Faber and Faber, London.
22
PART 1 INTRODUCTION AND FRAMEWORK
Rueda, S., De Cáceres, R., Cuchí, A., Brau, Ll (2012). El urbanismo ecológico. Su aplicación en el diseño de un ecobarrio en Figueres. Agència d'Ecología Urbana de Barcelona, Barcelona, Spain, 334p.
Sanyé, E., Cerón-Palma, I., Oliver-Solà, J., Montero, JI., Rieradevall, J (2012). Environmental analysis of the logistics of agricultural products through Roof Top Greenhouse (RTG) in Mediterranean urban areas. Journal of the Science of Food and Agriculture (online first).
SC, 2004. The Science Museum. Making the Modern World. <http://www.makingthemodernworld.org.uk/learning_modules> Accessed 23.06.12
Tukker, A., Haag, E., Eder, P (eds) (2000). Eco-design: European state of the art, IPTS Technical Report, EUR 19583 EN, IPTS, Seville, Spain.
UN Department of Economic and Social Affairs (2007). World Population Prospects: The 2006 Revision, Highlights. ESA/P/WP.202. New York: United Nations. <http://www.un.org/esa/population/publications/wpp2006/WPP2006_Highlights_rev.pdf>. Accessed 26.05.12
UN-Habitat (2006). The state of the world's cities report 2006/2007. United Nations Human Settlements Programme. London: Earthscan.
UN (2007). Urban population, Development and the Environment. 2007. <http://www.un.org/esa/population/publications/2007_PopDevt/Urban_2007.pdf>. Accessed 18.09.2012
UNEP (2002). State of the environment and policy retrospective 1972-2002, in Globlal environmental Outlook.
UNEP (2009). The contribution of building in climate change, in Building and climate change report. <http://www.unep.org/sbci/pdfs/SBCI-BCCSummary.pdf> Accessed 21.10.12
UNFPA (2007). State of the world population. <http://www.unfpa.org/swp/2007/> Accessed 29.09.12
UN (2012). Department of Economic and Social Affairs, Population Division: World Urbanization Prospects, the 2011 Revision. Final Report with Annex Tables. New York.
Wackernagel, M., Rees, W ( 1995). Our ecological footprint: Reducing human impact on Earth. Philadelphia: New Society.
Wadel, G (2010). La sostenibilidad en la arquitectura industrializada. La construcción modular ligera aplicada a la vivienda. Tesis doctoral, Universitat Politecnica de Catalunya
Wolman, A (1965). The metabolism of cities. ScientificAmerican 213(3): 179–190.
World Commission on Environment and Development ( 1987). Our common future. New York: Oxford University Press.
Zabalza, I., Valero- Capilla, A., Aranda- Usón, A (2011). Life cycle assessment of building materials: Comparative analysis of energy and environmental impacts and evaluation of the eco-efficiency improvement potential. Building and Environment, 46(5):1133-1140.
23
PART 1 INTRODUCTION AND FRAMEWORK
Chapter 2
Methodology
PHOTOGRAPHY BY ILEANA CERON

24
PART 1 INTRODUCTION AND FRAMEWORK
Chapter 2 presents the main methodological aspects that have been used in the
development of this dissertation, which will be divided into assessment tools and study
systems presentation. Further details will be given in following chapters.
The chapter is structured as follows:
Assessment tools
Systems of study
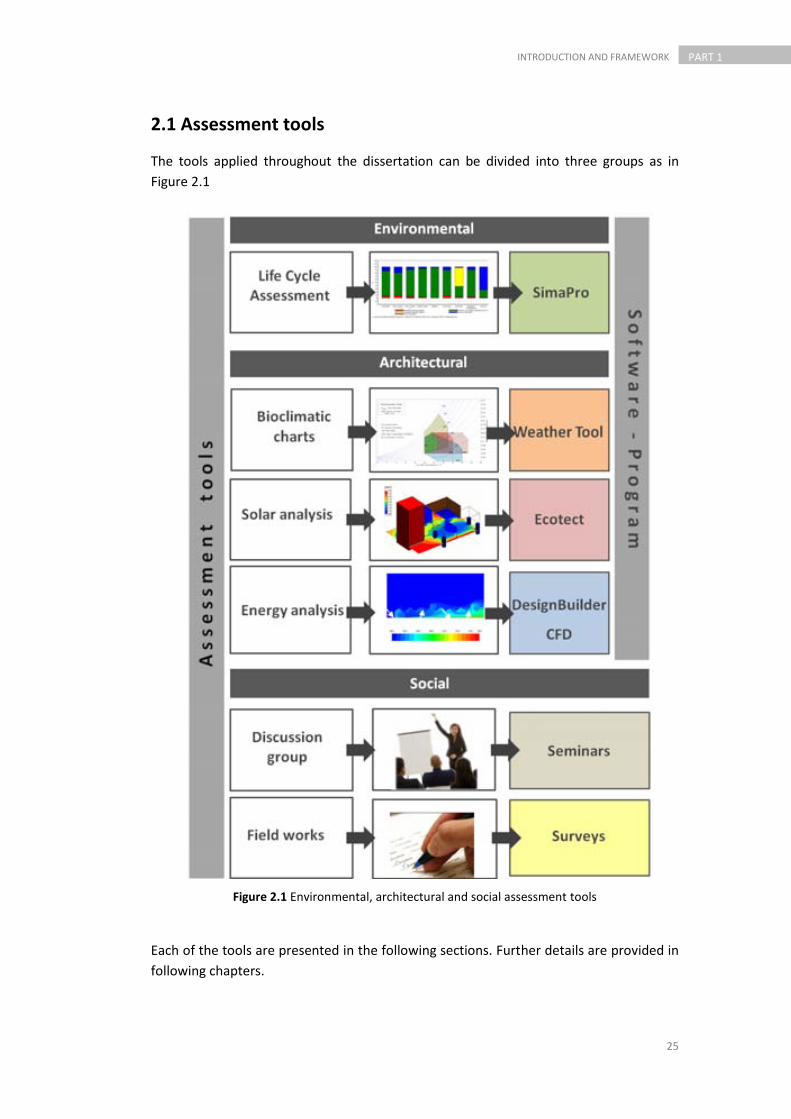
25
PART 1 INTRODUCTION AND FRAMEWORK
2.1 Assessment tools
The tools applied throughout the dissertation can be divided into three groups as in
Figure 2.1
Figure 2.1 Environmental, architectural and social assessment tools
Each of the tools are presented in the following sections. Further details are provided in
following chapters.
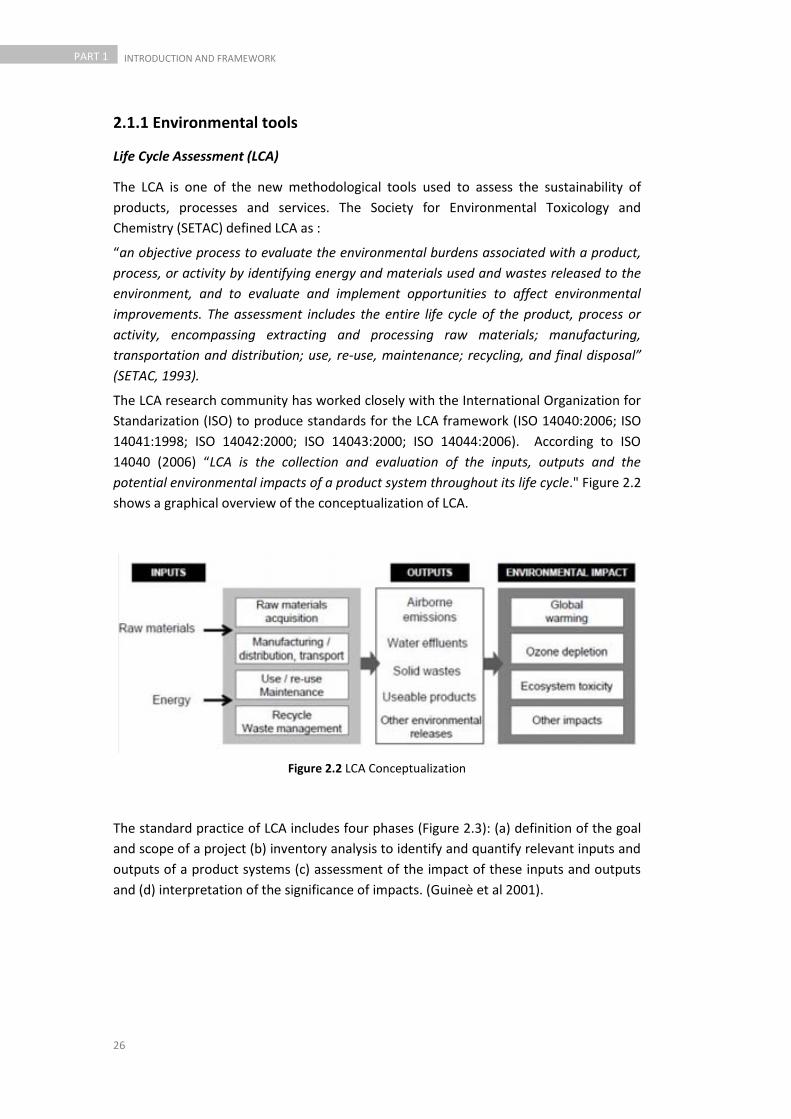
26
PART 1 INTRODUCTION AND FRAMEWORK
2.1.1 Environmental tools
Life Cycle Assessment (LCA)
The LCA is one of the new methodological tools used to assess the sustainability of
products, processes and services. The Society for Environmental Toxicology and
Chemistry (SETAC) defined LCA as :
“an objective process to evaluate the environmental burdens associated with a product,
process, or activity by identifying energy and materials used and wastes released to the
environment, and to evaluate and implement opportunities to affect environmental
improvements. The assessment includes the entire life cycle of the product, process or
activity, encompassing extracting and processing raw materials; manufacturing,
transportation and distribution; use, re‐use, maintenance; recycling, and final disposal”
(SETAC, 1993).
The LCA research community has worked closely with the International Organization for
Standarization (ISO) to produce standards for the LCA framework (ISO 14040:2006; ISO
14041:1998; ISO 14042:2000; ISO 14043:2000; ISO 14044:2006). According to ISO
14040 (2006) “LCA is the collection and evaluation of the inputs, outputs and the
potential environmental impacts of a product system throughout its life cycle." Figure 2.2
shows a graphical overview of the conceptualization of LCA.
Figure 2.2 LCA Conceptualization
The standard practice of LCA includes four phases (Figure 2.3): (a) definition of the goal
and scope of a project (b) inventory analysis to identify and quantify relevant inputs and
outputs of a product systems (c) assessment of the impact of these inputs and outputs
and (d) interpretation of the significance of impacts. (Guineè et al 2001).
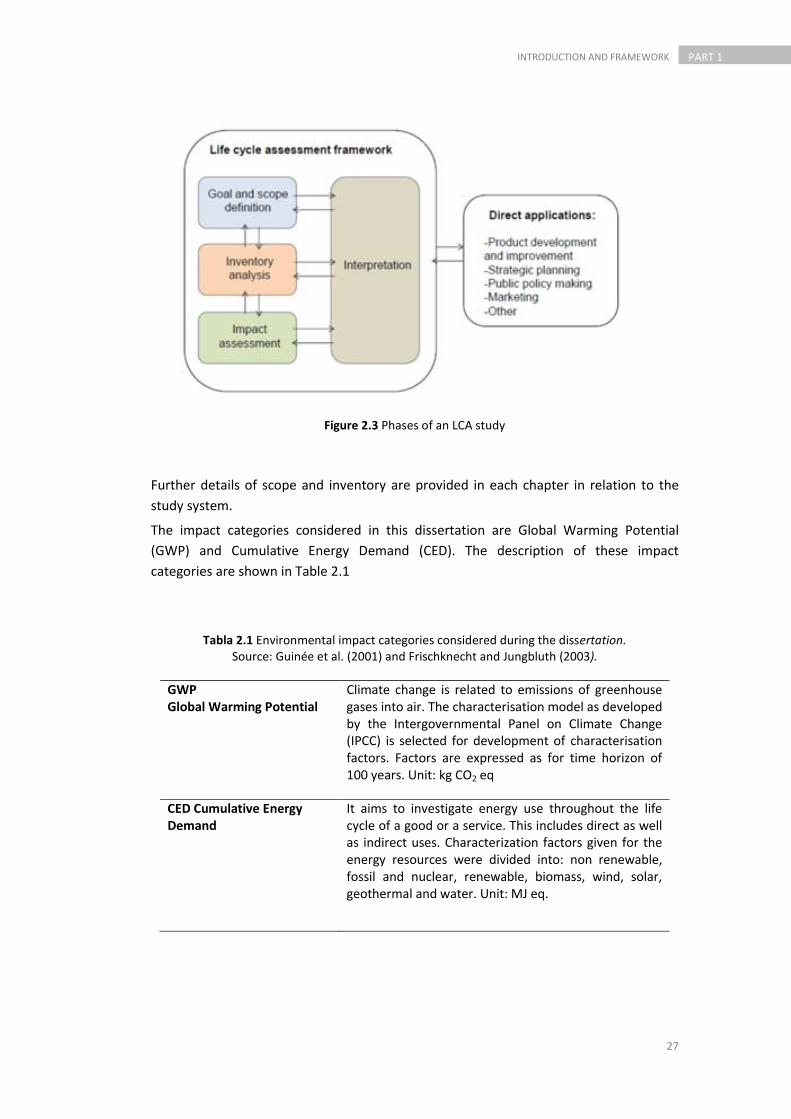
27
PART 1 INTRODUCTION AND FRAMEWORK
Figure 2.3 Phases of an LCA study
Further details of scope and inventory are provided in each chapter in relation to the
study system.
The impact categories considered in this dissertation are Global Warming Potential
(GWP) and Cumulative Energy Demand (CED). The description of these impact
categories are shown in Table 2.1
Tabla 2.1 Environmental impact categories considered during the dissertation. Source: Guinée et al. (2001) and Frischknecht and Jungbluth (2003).
GWP Global Warming Potential
Climate change is related to emissions of greenhouse gases into air. The characterisation model as developed by the Intergovernmental Panel on Climate Change (IPCC) is selected for development of characterisation factors. Factors are expressed as for time horizon of 100 years. Unit: kg CO2 eq
CED Cumulative Energy Demand
It aims to investigate energy use throughout the life cycle of a good or a service. This includes direct as well as indirect uses. Characterization factors given for the energy resources were divided into: non renewable, fossil and nuclear, renewable, biomass, wind, solar, geothermal and water. Unit: MJ eq.

28
PART 1 INTRODUCTION AND FRAMEWORK
SimaPro 6
The software program SimaPro 6 (System for Integrated environMental Assessment of
Products), developed by PRé Consultants, was used as the LCA modelling and analysis
tool (PRé, 2012). SimaPro is a well-known, internationally accepted and validated tool
and since its emergence in 1990, it has been used in a large number of LCA studies by
consultants, research institutes, and universities.
In Chapter 3, the LCA tool is applied, in order to estimate the Global Warming
Potential (GWP) of transporting food from the production site to the social
neighbourhood of the study system.
In Chapter 4, the LCA tool is applied to estimate the GWP and CED associated
with the materials of the strategies proposed.
2.1.2 Architectural tools
Climate considerations are essential dimensions in the assessment of quality of outdoor
built environments. Achieving thermal comfort of users is another goal of doing climate
studies. According to the ASHRAE (2004), thermal comfort is fundamentally a subjective
reaction or state of mind, where a person expresses satisfaction with the thermal
environment.
Tools that enable us suggest strategies with entire knowledge of the climatic
characteristics were used in this dissertation. Energy simulation programs are used to
predict the energy performance of the buildings studied.
Below, the architectural assessment tools will be introduced. Further details are
provided in each study system, in the following chapters.
Bioclimatic charts
The main objective behind the illustration of bioclimatic charts is to decide the comfort
zone and the limits of the various landscape design strategies that contribute to passive
energy building design. A comfort zone can be identified in terms of range of effective
temperatures and a humidity level, which make a specific percentage of occupants feel
comfortable (Koichi, 1996). This research applies the strategies and their application to
the psychrometric chart based on the works of Givoni (1998). This chart is based on the
linear relationship between temperature amplitude and vapor pressure of outdoor air.
Givoni’s chart identifies suitable cooling technique based on the outdoor climatic
condition. Five zones are identified on Givoni’s chart: thermal comfort, natural
ventilation, high mass, high mass with night ventilation and evaporative cooling.
Bioclimatic charts are utilized by first identifying the average monthly condition. For
each month, the average daily maximum temperature is calculated and matched (Figure
2.4).
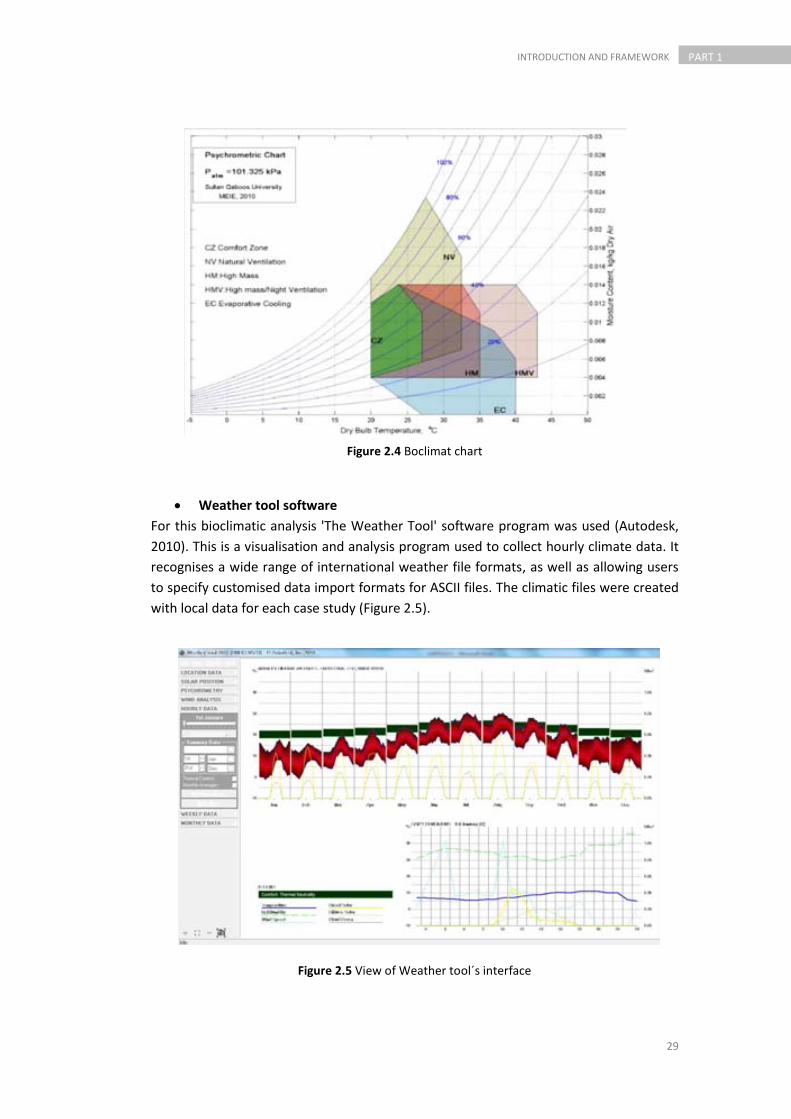
29
PART 1 INTRODUCTION AND FRAMEWORK
Figure 2.4 Boclimat chart
Weather tool software
For this bioclimatic analysis 'The Weather Tool' software program was used (Autodesk,
2010). This is a visualisation and analysis program used to collect hourly climate data. It
recognises a wide range of international weather file formats, as well as allowing users
to specify customised data import formats for ASCII files. The climatic files were created
with local data for each case study (Figure 2.5).
Figure 2.5 View of Weather tool´s interface

30
PART 1 INTRODUCTION AND FRAMEWORK
Solar analysis
The goal of solar analysis is determine the amount of radiation received on the different
surfaces of the building. This allow assessment of the best location to perform, for
example, an intervention of integrated photovoltaic or solar protection.
Ecotect
The Ecotect software program (Autodesk, 2011) is a comprehensive sustainable building
design tool. This program can visualize incident solar radiation on windows and surfaces,
during any period (Figure 2.6). Following, the principal visual tools for solar analysis and
calculations are described.
,
Figure 2.6 View of Ecotect´s interface
Sun path diagrams are visual representations on a flat surface, of the sun's path across
the sky. They are used to determine the location of the sun easily at any time of the day,
during any time of year.
In chapter 3, sun path diagrams are used to study the sun´s path on the houses
in a social neighbourhood.
Incident solar radiation, also termed ‘insolation’, refers to the wide spectrum of radiant
energy from the Sun, which strikes an object or surface within the Ecotect model. This
includes both a direct component from the sun itself (sunshine) and a diffuse
component from the visible sky (skylight). Depending on the settings you choose, it can
also contain a reflected component from other surfaces in the model and the ground
(Autodesk, 2010).
It is important to note that insolation refers only to the amount of energy actually falling
on a surface, which is not affected in any way by the surface properties of materials or

31
PART 1 INTRODUCTION AND FRAMEWORK
by any internal refractive effects. Material properties only affect the amount of solar
radiation absorbed and/or transmitted by a surface
In chapter 3, incident radiation on walls and roof of a social housing is calculated
Energy simulation
The "DesignBuilder" energy simulation software program (DBS, 2011) is used to
calculate the internal gains and cooling/heating demand in chapters 4 and 6. This
program uses the EnergyPlus dynamic simulation process (DOE, 2011) to generate
performance data based on the climatic and thermal characteristics of the materials.
The program allows for the calculation of heating and cooling loads using the method
adopted by ASHRAE and implemented in EnergyPlus (Figure 2.7).
The interface of CFD (Computational Fluid Dynamics) in DesignBuilder was used to
evaluate temperature distribution in chapert 6
Figure 2.7 View of DesignBuilder´s interface
2.1.3 Social tools
Discussion group
A discussion or focus group is a qualitative technique that uses group interviews and
discussions to collect relevant information about the research problem. Ideas will be
exchanged, in order to understand the views of different participants regarding
particular subjects, and conclusions will later be drawn from the discussions. The first
focus groups used as a tool of social and market research were introduced in the mid
twentieth century. Merton and Kendall (1946) and Edmiston (1944) wrote papers that
recognized the potential of group interviews during this period.

32
PART 1 INTRODUCTION AND FRAMEWORK
Defining the objectives and the number of people to participate is the first step taken in
setting up a discussion group. The figure of a moderator is important, as he introduces
the subject, asks questions and sets standards for the participation of group members.
In Chapter 3, a discussion group was used, in order to identify barriers and
opportunities to implement greenhouses on the roofs of buildings.
Surveys
The social survey is one of the techniques used by researchers to collect and generate
primary information. Researchers working with an analytical empirical approach, use the
survey to obtain information from a representative group of individuals (the sample)
and from there project the results to the study population.
The social survey is a questionnaire with a set of questions related to one or more
variables or dimensions measured. The content of the questions varies, depending on
the issues that it purports to measure. In order to have rigorous data collection,
questions should be accurate, relevant and concise.
For Chapter 3 of the thesis a survey is designed for inhabitants of social housing
units in the neighborhood under study. The structure of the survey is presented
below.
a) General data: Date, time and name of person interviewed
b) Housing data: m2 , time lived in house.
c) Inhabitants data: Number of inhabitants, age, sex, profession, occupancy period
during the day.
d) Ventilation systems: Air conditioning, ceiling fan or pedestal fan, time of use and
power.
e) Electronic equipment and household appliances: Type of equipment, power and
time of use
f) Perception data: Questions regarding comfort level in relation to heating and
cooling, during summer and winter.
g) Observations: Materials of house, green space, shaded areas and insulation.

33
PART 1 INTRODUCTION AND FRAMEWORK
2.2 Case study presentation
The research presented in this thesis is conducted in two different contexts with the
same objective and applying the same assessment tools for different strategies. Part II is
conducted in the context of Latin American cities and III in the Mediterranean cities of
Europe (Figure 2.8).
Figure 2.8 Delimitation of context and study system
The main characteristics of these case studies are summarized in Figures 2.9 and 2.10.
Late, in each chapter, more details about each case study will be provided.
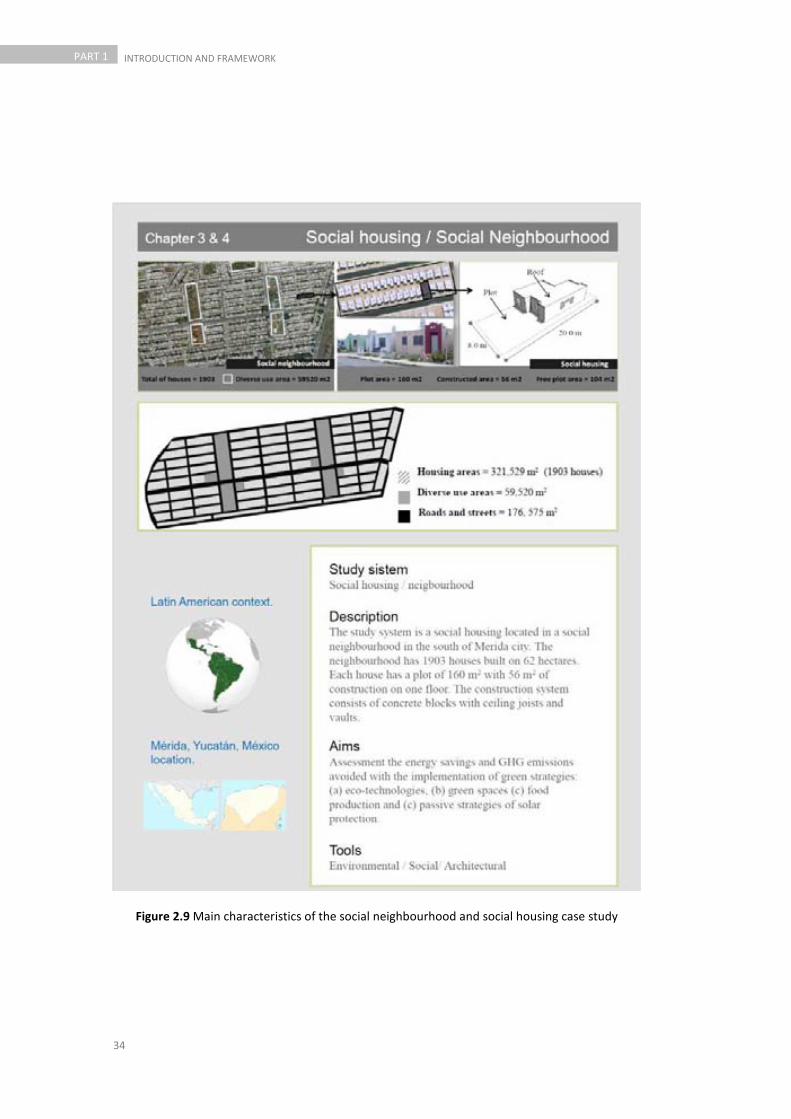
34
PART 1 INTRODUCTION AND FRAMEWORK
Figure 2.9 Main characteristics of the social neighbourhood and social housing case study
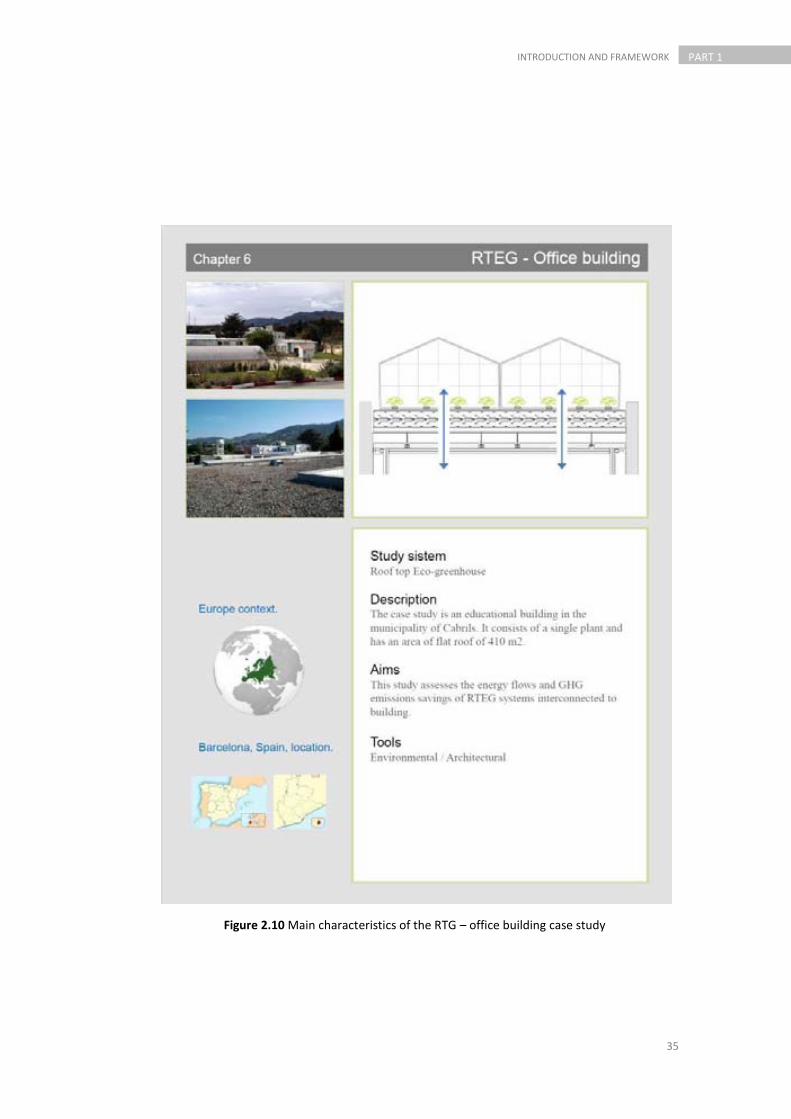
35
PART 1 INTRODUCTION AND FRAMEWORK
Figure 2.10 Main characteristics of the RTG – office building case study
36
PART 1 INTRODUCTION AND FRAMEWORK
References
ASHRAE (2004). Standard 55-2004 -Thermal Environmental Conditions for Human Occupancy. 33P
Autodesk (2011). Autodesk Ecotect analysis. <http://usa.autodesk.com/ecotect-analysis/> Accessed 29.09.12
DBS (2011). DesignBuilder Software Ltd, London, UK. <http://www.designbuilder.co.uk/content/view/1/12/> Accessed 11-06-11
DOE (2011). EnergyPlus Energy Simulation Software, U.S. Departament of Energy. <http://apps1.eere.energy.gov/buildings/energyplus/energyplus_about.cfm> Accessed 26-06-12
Edmiston, V (1946). The Group Interview. Journal of Educational Research, 37: 593–601.
Frischknecht, R., Jungbluth, N (2003). Implementation of Life Cycle Impact Assessment Methods. ecoinvent report Nº3, v2.0 Swiss Centre for Life Cycle Inventory, Dübendorf, Switzerland.
Givoni, B (1998). Climate considerations in building and urban design. New York: Van Nostrand Reinhold
Guinée JB (ed) Gorrée M, Heijungs R, Huppes G, Kleijn R, de Koning A, van Oers L, Wegener Sleeswijk A, Suh S, Udo de Haes HA, de Bruijn H, van Duin R, Huijbregts MAJ, Lindeijer E, Roorda AAH, Weidema BP (2001) Life cycle assessment; An operational guide to the ISO standards; Parts 1 and 2. Ministry of Housing, Spatial Planning and Environment (VROM) and Centre of Environmental Science (CML), Den Haag and Leiden, The Netherlands.
ISO. International Standard (2006). ISO14040: Environmental Management, Life Cycle Assessment – Principles and Framework. Geneva, Switzerland.
ISO. International Standard (1998). ISO14041: Environmental Management ‐ Life Cycle Assessment ‐ Goal and Scope Definition and Inventory Analysis.
ISO. International Standard (2000). ISO14042: Environmental Management, Life Cycle Assessment ‐ Life Cycle Impact Assessment
ISO. International Standard (2000). ISO14043: Environmental Management ‐ Life Cycle Assessment ‐ Life Cycle Interpretation.
ISO. International Standard(2006). ISO14044: Environmental Management ‐ Life Cycle Assessment ‐ Requirements and Guidelines. Geneve, Switzerland.
Koichi, N (1996). Evaluation of the thermal environment in an outdoor pedestrian space. Atmospheric Environment, 30:497-505
Merton, R., Kendall, P (1946). The Focused Interview. The American Journal of Sociology, 51(6): 541-557
PRé Consultants (2012) Pré Consultants home page. Software. <http://www.pre-sustainability.com/content/simapro-lca-software> Accessed 17.08.12
SETAC (1993). Guidelines for Life-Cycle Assessment: a “Code of Practice”. SETAC blications, Brussels.

37
STRATEGIES TO REDUCE ENERGY AND GHG EMISSIONS IN BUILDINGS IN MEXICO: A CASE OF SOCIAL HOUSING PART 2
PAR
T
2 Strategies to reduce energy and GHG
emissions in buildings in Mexico: a case of social housing
38
PART 2 STRATEGIES TO REDUCE ENERGY AND GHG EMISSIONS IN BUILDINGS IN MEXICO: A CASE OF SOCIAL HOUSING
As previously stated, reduction in energy consumption and GHG emission is a priority for
the building sector. Social housing is an important issue that needs attention, specifically
in countries such as Mexico, where there has been a huge increase in the number of
houses constructed cities, due to urban growth.
Part II of this dissertation focuses on a study system, assessing social housing in Mexico
in warm-humid climate. It is composed of two chapters
Chapter 3: Towards a green sustainable strategy for social neighbourhoods in Latin
America: Case from social housing in Merida, Yucatan, Mexico.
Chapter 4: Strategies to reduce the energy requirements and CO2 emissions of cooling
demand on social housing in warm-humid climates of Mexico.
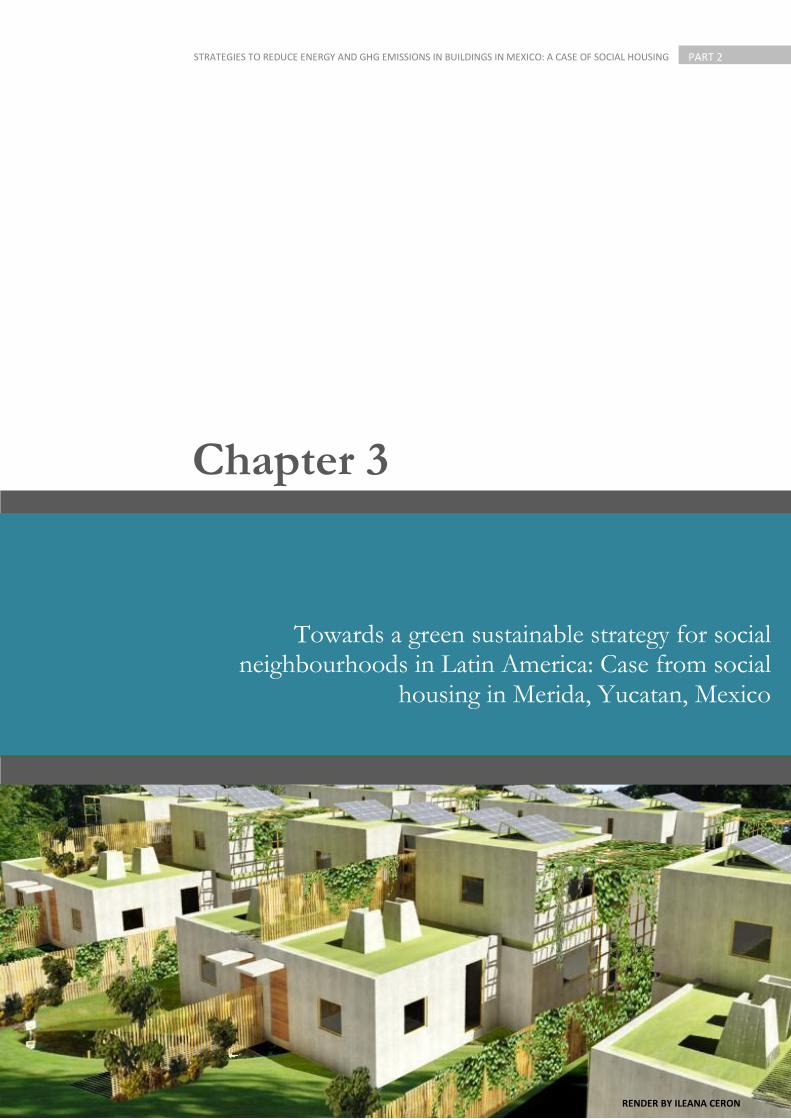
39
STRATEGIES TO REDUCE ENERGY AND GHG EMISSIONS IN BUILDINGS IN MEXICO: A CASE OF SOCIAL HOUSING PART 2
Towards a green sustainable strategy for social neighbourhoods in Latin America: Case from social
housing in Merida, Yucatan, Mexico
Chapter 3
RENDER BY ILEANA CERON

40
PART 2 STRATEGIES TO REDUCE ENERGY AND GHG EMISSIONS IN BUILDINGS IN MEXICO: A CASE OF SOCIAL HOUSING
This chaptes is based in the following paper:
Ceron-Palma I, Oliver-Solà J, Sanyé-Mengual E, Montero JI, Rieradevall J (2013)
Towards a green sustainable strategy for social neighbourhood in Latin America: Case
from social housing in Merida, Yucatan, Mexico. Habitat International, 38: 47-56, in
press
Abstract
In developing countries, particularly in Latin America, the rapid growth of urban areas
has led to complex problems, including the exploitation of natural resources,
environmental pollution and greenhouse gas emissions (GHG). Massive structures are
being built to meet the housing demand. Moreover, there is excessive use of energy
through appliances, interior lightning and air conditioning which generate GHG.
This paper aims to propose green sustainable strategies to reduce GHG emissions
associated with energy consumption in a social neighbourhood in Merida, Mexico. The
strategies were eco-technology (efficient equipment) and green spaces (sedum þ food
production). Once the context is set, the study collected data about energy habits and
consumption. The global warming potential (GWP) was calculated through a life cycle
assessment (LCA) to assess the level of GHG emissions associated with household energy
consumption.
The CO2eq emissions avoided by the transport of the food (tomatoes) from the
production site to the consumer were calculated. Distribution, packaging and retail were
included. All strategies combined can prevent up 1.06 tons CO2eq/year; this represents
67% of the emissions originating from a reference household (34% avoided by eco-
technology, 24.5% fixed by green spaces and 8.4% avoided by food logistics). At city
scale (112,000 houses) this represents 100,352 tons/CO2eq/year.
This study supports the importance of integrating environmental quantitative tools in
planning cities.
Keywords: LCA, green roof, urban agriculture, social housing
41
STRATEGIES TO REDUCE ENERGY AND GHG EMISSIONS IN BUILDINGS IN MEXICO: A CASE OF SOCIAL HOUSING PART 2
3.1 Introduction
The design of sustainable cities is a key issue that addresses most of the global
environmental problems that our society has created (Oliver-Solà et al. 2009). Currently,
cities exert enormous pressure on the natural environment. The world’s cities are
directly or indirectly responsible for 80% of global energy consumption, generating more
than 70% of the total waste and more than 60% of greenhouse gas (GHG) emissions for
the planet (Ash et al. 2008). These data show the high contribution that cities make to
the global warming phenomenon, which is increasing due to urban growth that is
occurring worldwide (Tiwari et al. 2012).
Developing countries, particularly in Latin America, are experiencing an expansive urban
growth (Cohen, 2006). This urban growth causes excessive pressure on the existing
infrastructure, which affects buildings, public transportation, road networks, water
quality, waste collection and public health (Grewal and Grewal, 2012). New settlements
continue to be created informally at the urban periphery (Sullivan and Ward, 2012). In
addition, cities occupy extensive areas and they cause significant loss of agricultural
land, green areas, increased level of consumerism and larger travelling distances in
people’s daily lives (Turok, 2011).
In Mexico, urban and economic growth has resulted in an ever increasing demand for
electricity and an increase in energy use in the transport, industry and residential sectors
(Medina-Ross et al. 2005). Sheinbaum et al. (2011) conducted a study that reported a
2.2% annual increase in energy use in Mexico between 1990 and 2006. In 2011, the
increase was 5.6% compared to 2010 (SENER, 2011).
In the residential sector, this increased energy use has been caused in large part by the
promotion of massive housing construction that has been principally social in nature to
meet the needs caused by urban growth and to reduce excessive settlement in the
peripheries of cities (Aguilar and Santos, 2011). This model has been replicated in
different regions of the country without considering the climatic differences between
regions of Mexico (dry climate, warm, warm humid and tropical). This potentially
increases the use of energy because these models do not consider the climatic
requirements inherent in housing design, and there is no place for users to participate in
the design (Noguchi and Hernandez-Velasco, 2005).
3.1.1 Urban planning and housing sector in Mexico
The rapid population growth in Mexican cities has economic, political, social and
environmental implications. In 1980, the population was 66.8 million, and in 2010, it had
increased to 112.3 million people, of which 77.8% lived in urban areas. Population
growth generates greater housing needs. If in 1980 there were 12.1 million houses in
Mexico, 30 years later, in 2010, this number more than doubled, reaching 28.6 million
houses (INEGI, 2010a).
The construction of these houses causes a significant reduction in the area covered by
vegetation, increasing the area of land covered with concrete in the form of streets,
parks, roofs, etc. (Ward and Aguilar, 2003).
42
PART 2 STRATEGIES TO REDUCE ENERGY AND GHG EMISSIONS IN BUILDINGS IN MEXICO: A CASE OF SOCIAL HOUSING
One notable difference between the housing sector in Mexico and that of other
countries is that in Mexico, home ownership has been encouraged, while developed
countries have stimulated the market for rental housing (Ferguson and Navarrete,
2003).
Of the total housing stock in Mexico in 2010, 90.6% were private and detached houses
(SHF, 2010).
Energy in the housing sector
In Mexico, the growth in housing is responsible for 17% of the total energy consumption
in the country and 8% of the total GHG emissions (Rosas et al. 2010).
The energy consumed in the housing sector is mainly used for water heating (29%), food
preparation (52%), lighting and appliances (19%). The level of GHG emissions associated
with electricity consumption in cities in Mexico varies depending on the need for
artificial cooling systems and/or heating systems (SENER, 2009).
The electrical equipment and participation rates in home electricity consumption in
Mexico are as follows: cooling system (44%), lighting (33%), refrigerator (14%), and
heating (9%) (CONAVI, 2006).
The most important variables affecting housing energy use will be the introduction of
technology, the utilisation of equipment and housing size (Rosas-Flores and Morillon,
2010).
Social housing in Mexico
The name ‘social housing’ is given to housing that is built for sectors of the population
with lower economic resources. It consists of a standardised model constructed
following the same pattern in different regions of Mexico, which ignores the different
climatic conditions.
Currently, in Mexico, social housing can be classified according to its value, which is
based upon how many ‘times the current monthly minimum wage in Mexico City
(VSMMDF)’ the housing costs. This classification includes three types of social housing.
The main difference between the economic, popular and traditional housing types is the
size of the construction in terms of square metres (SHF, 2010).
The construction of this housing is based on conventional materials, such as beam and
vault slabs, concrete and either hollow block walls, clay bricks or concrete walls,
depending on the region. The lots are reduced to optimise the soil surface and are
usually 8x20 m, 10x20 m or 10x25 m (Romero, 2007). Funding programs for social
housing take the form of direct subsidies that require a down payment or advanced
payment that represents between 15% and 25% of household income. This type of
financing has led to more widespread home ownership and massive construction of this
type of housing (González, 2006).
43
STRATEGIES TO REDUCE ENERGY AND GHG EMISSIONS IN BUILDINGS IN MEXICO: A CASE OF SOCIAL HOUSING PART 2
3.1.2 Initiatives in Mexico for energy efficiency and emissions reduction
Due to the importance of the housing sector in the country’s energy consumption in
recent years, there have been various programs and public consultation documents
aimed at improving home energy efficiency. For example, The National Housing
Commission (CONAVI) has drafted documents with guidelines and criteria for
sustainability, energy efficiency and bioclimatic design in homes in Mexico, but these
guidelines are not considered in current building regulations (CONAVI, 2008). The
National Commission for Energy Conservation (CONAE) recently began work to
implement a program for solar water heaters (CONAE, 2011). Morillón (2008) developed
the technical basis for the Green Mortgage program, which consists of a larger credit for
housing financing to incorporate new technology, including solar heaters, solar panels,
insulation and saving lamps. The Federal Electricity Commission (CFE) and the Trust Fund
for Electric Energy Savings (FIDE) encourage the rational and efficient use of electricity in
warm climates in the country along with CONAVI and The Institute of the National Fund
for Workers’ Housing (INFONAVIT). The proposed actions consist of the installation of
compact fluorescent lamps, double glazed thermal windows, air conditioning and the
application of thermal insulation in the roofs of houses. Since 2002, these actions have
reduced CO2 emissions by 5.3 million tons (Rosas-Flores et al. 2011).
Initiatives to reduce GHG emissions have been promoted in the housing through
conventional energy-saving strategies; however there have been no investigations of
other strategies that can prevent and/or fix GHG emissions in neighbourhoods.
Green spaces and food production
Green spaces play a significant role in urban environments. According to studies in
Merida (Mexico) by Canto (2010), higher temperatures were reported in urban areas,
mainly on pavement and buildings. In these areas, the phenomenon of thermal inertia
causes heat to accumulate during the day and then be released until dawn. The lowest
temperatures in the city of Merida are present in areas with considerable vegetation
(Canto, 2010). Plants can reduce the ability of the heat reaching buildings by increasing
the reflection of radiation and shading (Li et al. 2010). Green roofs may also fixe carbon
in plants and soils. The CO2 captured by plants is the result of differences between
atmospheric CO2 absorbed during photosynthesis and the CO2 emitted by the
atmosphere during respiration. This difference is converted into biomass and is usually
between 45 and 50% of the total dry weight of the plant (Carvajal, 2008; Getter et al.
2009).
Beside the above-mentioned advantages, green spaces can produce food. Urban
agriculture in western cities is starting to become a feasible option of self-sufficiency.
In recent years in Mexico, the physical separation between rural and urban areas has
increased. The lack of investment and support for agriculture has meant that food
production in Mexico is not in line with population growth. Insufficient food production
has mainly led to an increase in U.S. imports (Torres, 2001).
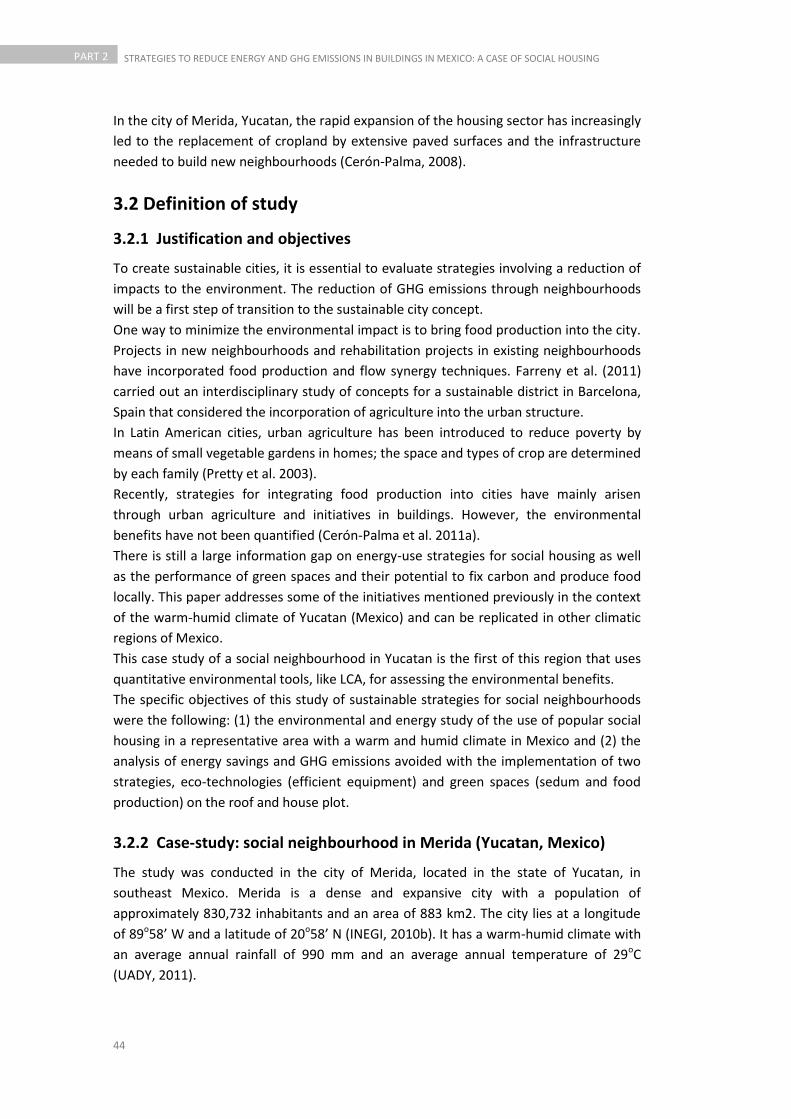
44
PART 2 STRATEGIES TO REDUCE ENERGY AND GHG EMISSIONS IN BUILDINGS IN MEXICO: A CASE OF SOCIAL HOUSING
In the city of Merida, Yucatan, the rapid expansion of the housing sector has increasingly
led to the replacement of cropland by extensive paved surfaces and the infrastructure
needed to build new neighbourhoods (Cerón-Palma, 2008).
3.2 Definition of study
3.2.1 Justification and objectives
To create sustainable cities, it is essential to evaluate strategies involving a reduction of
impacts to the environment. The reduction of GHG emissions through neighbourhoods
will be a first step of transition to the sustainable city concept.
One way to minimize the environmental impact is to bring food production into the city.
Projects in new neighbourhoods and rehabilitation projects in existing neighbourhoods
have incorporated food production and flow synergy techniques. Farreny et al. (2011)
carried out an interdisciplinary study of concepts for a sustainable district in Barcelona,
Spain that considered the incorporation of agriculture into the urban structure.
In Latin American cities, urban agriculture has been introduced to reduce poverty by
means of small vegetable gardens in homes; the space and types of crop are determined
by each family (Pretty et al. 2003).
Recently, strategies for integrating food production into cities have mainly arisen
through urban agriculture and initiatives in buildings. However, the environmental
benefits have not been quantified (Cerón-Palma et al. 2011a).
There is still a large information gap on energy-use strategies for social housing as well
as the performance of green spaces and their potential to fix carbon and produce food
locally. This paper addresses some of the initiatives mentioned previously in the context
of the warm-humid climate of Yucatan (Mexico) and can be replicated in other climatic
regions of Mexico.
This case study of a social neighbourhood in Yucatan is the first of this region that uses
quantitative environmental tools, like LCA, for assessing the environmental benefits.
The specific objectives of this study of sustainable strategies for social neighbourhoods
were the following: (1) the environmental and energy study of the use of popular social
housing in a representative area with a warm and humid climate in Mexico and (2) the
analysis of energy savings and GHG emissions avoided with the implementation of two
strategies, eco-technologies (efficient equipment) and green spaces (sedum and food
production) on the roof and house plot.
3.2.2 Case-study: social neighbourhood in Merida (Yucatan, Mexico)
The study was conducted in the city of Merida, located in the state of Yucatan, in
southeast Mexico. Merida is a dense and expansive city with a population of
approximately 830,732 inhabitants and an area of 883 km2. The city lies at a longitude
of 89o58’ W and a latitude of 20o58’ N (INEGI, 2010b). It has a warm-humid climate with
an average annual rainfall of 990 mm and an average annual temperature of 29oC
(UADY, 2011).

45
STRATEGIES TO REDUCE ENERGY AND GHG EMISSIONS IN BUILDINGS IN MEXICO: A CASE OF SOCIAL HOUSING PART 2
The urban area of Merida has experienced a process of expansion through horizontal
growth of the floor area (OECD, 2007). The impact of this expansion can be seen from
the 1970s, when massive construction of housing began. In the last 10 years, the
construction area has been extended by 10,255 ha (SEDUMA, 2008). This growth is
mainly attributed to the housing boom that emerged due to the acquisition of land at a
low cost by construction companies, thus promoting the massive construction of new
neighbourhoods.
The study system is a social housing located in a social neighbourhood in the south of
Merida city. The neighbourhood has 1903 houses built on 62 ha. In this type of
neighbourhood, tree planting and vegetation is limited or nonexistent. According to
Canto and Pérez (2003), the sparse arborization is due to the size of the housing and the
plot.
According to the “Neighbourhood’s Law of the State of Yucatan” any housing
development has to consider a donation area (Gobierno del Estado de Yucatán, 1985). In
this donation area (diverse use area) parks, equipment or green areas are being
constructed. However, in the areas of donation of the social neighbourhoods,
preference is given to the commercial use of soil, reducing the possibility of
implementing green spaces in them. In the case study a high percentage of these areas
are abandoned (Cerón-Palma, 2008).
Figure 3.1 shows the study area and summarises the features of social neighbourhood.
Figure 3.1 Social neighbourhood. The figure shows the limit of the neighbourhood and main characteristics
Each house has a plot of 160 m2 with 56 m2 of construction on one floor. The
construction system consists of concrete blocks with ceiling joists and vaults. Each house
has two bedrooms, one bathroom and a living room with a kitchen and is usually
occupied by young families consisting of 4 or 5 members.
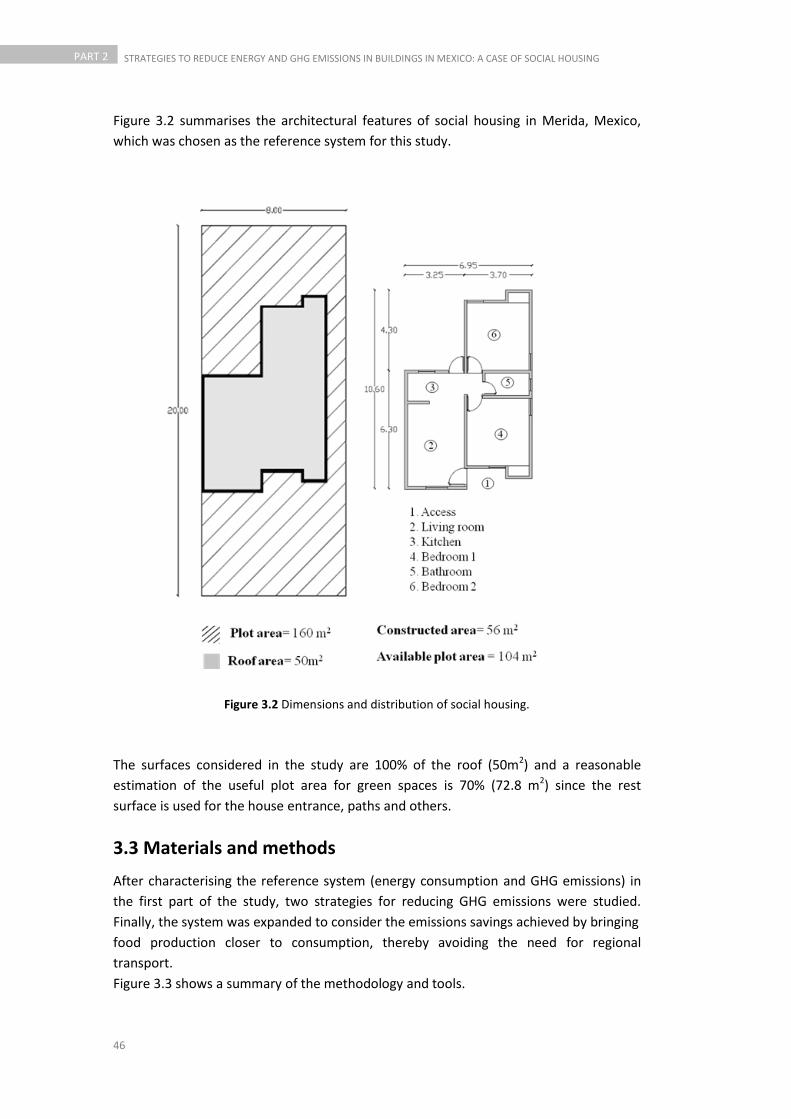
46
PART 2 STRATEGIES TO REDUCE ENERGY AND GHG EMISSIONS IN BUILDINGS IN MEXICO: A CASE OF SOCIAL HOUSING
Figure 3.2 summarises the architectural features of social housing in Merida, Mexico,
which was chosen as the reference system for this study.
Figure 3.2 Dimensions and distribution of social housing.
The surfaces considered in the study are 100% of the roof (50m2) and a reasonable
estimation of the useful plot area for green spaces is 70% (72.8 m2) since the rest
surface is used for the house entrance, paths and others.
3.3 Materials and methods
After characterising the reference system (energy consumption and GHG emissions) in
the first part of the study, two strategies for reducing GHG emissions were studied.
Finally, the system was expanded to consider the emissions savings achieved by bringing
food production closer to consumption, thereby avoiding the need for regional
transport.
Figure 3.3 shows a summary of the methodology and tools.
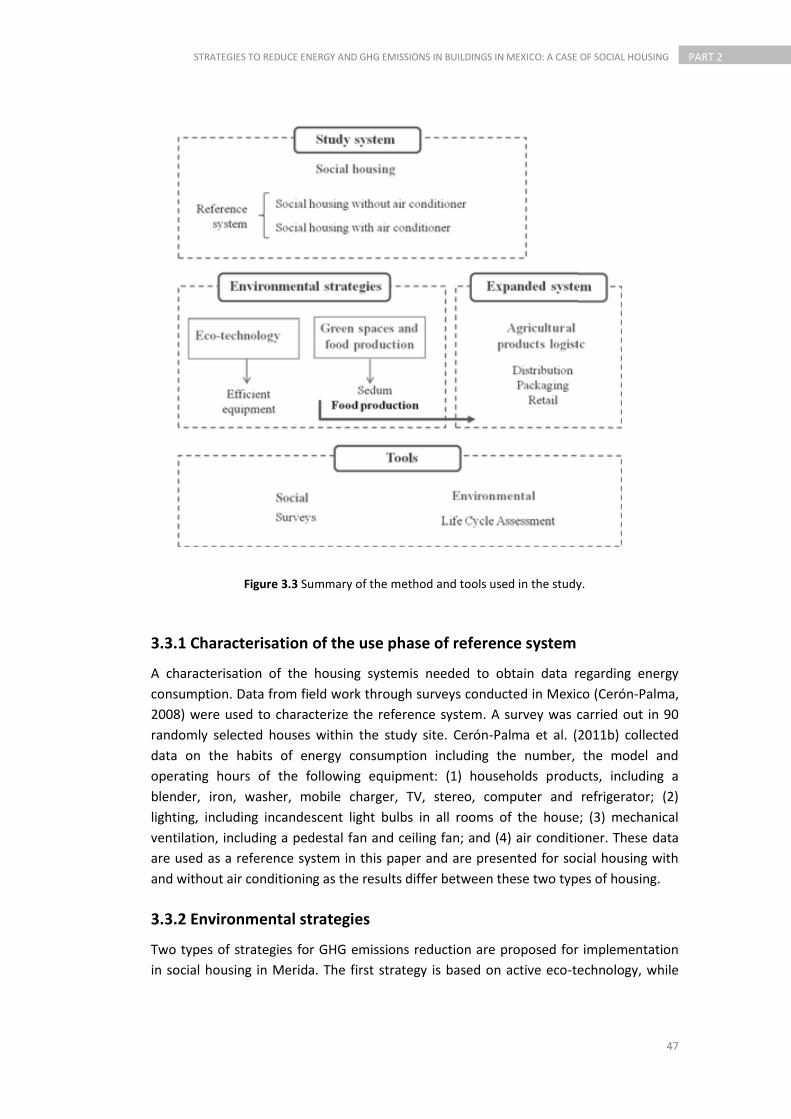
47
STRATEGIES TO REDUCE ENERGY AND GHG EMISSIONS IN BUILDINGS IN MEXICO: A CASE OF SOCIAL HOUSING PART 2
Figure 3.3 Summary of the method and tools used in the study.
3.3.1 Characterisation of the use phase of reference system
A characterisation of the housing systemis needed to obtain data regarding energy
consumption. Data from field work through surveys conducted in Mexico (Cerón-Palma,
2008) were used to characterize the reference system. A survey was carried out in 90
randomly selected houses within the study site. Cerón-Palma et al. (2011b) collected
data on the habits of energy consumption including the number, the model and
operating hours of the following equipment: (1) households products, including a
blender, iron, washer, mobile charger, TV, stereo, computer and refrigerator; (2)
lighting, including incandescent light bulbs in all rooms of the house; (3) mechanical
ventilation, including a pedestal fan and ceiling fan; and (4) air conditioner. These data
are used as a reference system in this paper and are presented for social housing with
and without air conditioning as the results differ between these two types of housing.
3.3.2 Environmental strategies
Two types of strategies for GHG emissions reduction are proposed for implementation
in social housing in Merida. The first strategy is based on active eco-technology, while
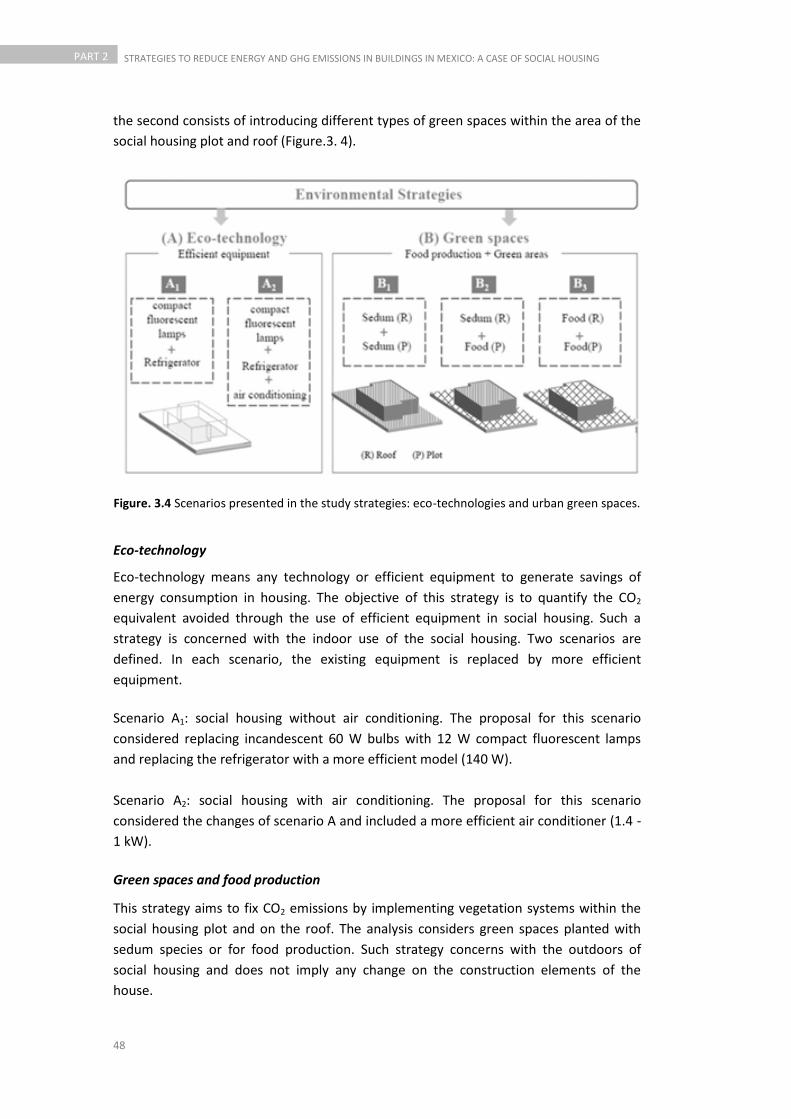
48
PART 2 STRATEGIES TO REDUCE ENERGY AND GHG EMISSIONS IN BUILDINGS IN MEXICO: A CASE OF SOCIAL HOUSING
the second consists of introducing different types of green spaces within the area of the
social housing plot and roof (Figure.3. 4).
Figure. 3.4 Scenarios presented in the study strategies: eco-technologies and urban green spaces.
Eco-technology
Eco-technology means any technology or efficient equipment to generate savings of
energy consumption in housing. The objective of this strategy is to quantify the CO2
equivalent avoided through the use of efficient equipment in social housing. Such a
strategy is concerned with the indoor use of the social housing. Two scenarios are
defined. In each scenario, the existing equipment is replaced by more efficient
equipment.
Scenario A1: social housing without air conditioning. The proposal for this scenario
considered replacing incandescent 60 W bulbs with 12 W compact fluorescent lamps
and replacing the refrigerator with a more efficient model (140 W).
Scenario A2: social housing with air conditioning. The proposal for this scenario
considered the changes of scenario A and included a more efficient air conditioner (1.4 -
1 kW).
Green spaces and food production
This strategy aims to fix CO2 emissions by implementing vegetation systems within the
social housing plot and on the roof. The analysis considers green spaces planted with
sedum species or for food production. Such strategy concerns with the outdoors of
social housing and does not imply any change on the construction elements of the
house.

49
STRATEGIES TO REDUCE ENERGY AND GHG EMISSIONS IN BUILDINGS IN MEXICO: A CASE OF SOCIAL HOUSING PART 2
An extensive green system with sedum species is proposed for the available spaces (roof
and plot) as this system requires a simple installation and low maintenance for the home
building system.
Food production considers the integration of horticultural crops in plots and on roofs.
The tomato crop was analysed as an example of a common food product in the study
area. Three scenarios are defined depending on the species and area of deployment:
Scenario B1, roof and plot with sedum; Scenario B2, roof with sedum and plot with
tomato; and Scenario B3, roof and plot with tomato.
For the estimation of the potential carbon fixation that occurred as a result of the urban
green spaces strategy, the following data from the literature have been used: sedum,
1.37 kgCO2/m2/year (Getter et al. 2009) and tomato crop, 3.18 kgCO2/m2/year (Carvajal,
2008). Fruits, leaves, root and stems are included in the data of tomato crop for the
purpose of considering the annual biomass and associated carbon fixation. The time that
the carbon remains in the soil is not included in these reference data.
In scenarios with tomatoes crop (B2 and B3), the system analysed has been expanded to
include the impact avoided because of not transporting food (tomatoes) from the
production site to the consumer.
The production of tomatoes within the city of Mérida would garner additional CO2
equivalent savings as the transport and distribution stages are avoided. These
environmental savings were also quantified through LCA. The functional unit select for
the LCA studywas1 kg of tomatoes consumed in Merida. Tomatoes consumed in Mérida
come from the states of Puebla, México, Veracruz, Nayarit and Sonora; and are
distributed through distribution centers in Mexico D.F. (comm. verb. Central de frutas y
verduras de Mérida).
Therefore, the analysis assumes that tomatoes are produced in these areas and
transported to Mérida, where they are sold and consumed.
The tomatoes are transported by 30t-trucks and an average distance of 1500 km is used
in the transport calculations (SAGARPA, 2011). Life cycle inventory data were obtained
through local surveys and from a European database. The results of CO2 fixation were
excluded to the LCA. This is because the results of fixation were estimated with nonlocal
data and as the fixation is less than 100 years, it cannot be counted according to the
IPCC (2006a). The systems boundaries are limited to the distribution, packaging and
retail stages.
Distribution. The distribution stage considers a trip from the producer to the supply
centre of Mérida. The return trip is excluded from the system as it is considered that the
truck is filled with other products. During transportation, a loss of 6% of the product is
included due to the dry air refrigeration. The data about the loss of product were
obtained from contact with the manager of a tomato distribution firm (Sanyé, et al.
2012).
Packaging. A wood packaging with a lifetime of 20 uses and a capacity for 6 kg is
considered. Data for the LCI were obtained from the ecoinvent database 2.0 (Werner et
al.2007).

50
PART 2 STRATEGIES TO REDUCE ENERGY AND GHG EMISSIONS IN BUILDINGS IN MEXICO: A CASE OF SOCIAL HOUSING
Retail. Up to 30% of the product is damaged during the retail stage and is landfilled.
Data about final disposal was obtained from ecoinvent 2.0 database (Doka, 2009), but
methane (CH4) emissions were adjusted for organic matter in the Mexican context
(IPCC, 2006b, Chapter 3: Solid waste disposal). The production stage is excluded of the
analysis as the tomato is produced in different areas and inventory data is unavailable.
3.3.3 Environmental tools
The LCA methodology (ISO, 2006), following the method of baseline CML 2000 (Guinee
et al. 2001) to characterise impact factors, has been used in this study. The Global
Warming Potential (GWP) of the energy use in social housing has been calculated
through LCA.
In Mexico, fossil fuels account for approximately 79% of the total primary energy;
renewable energies contribute 16.5% (hydropower 13.5%, geothermal 3% and wind
0.02%), and the remaining 4.5% is from nuclear power (Santoyo-Castelazo et al. 2011).
As a reference, the average emission factor for grid electricity in Mexico in 2008 is 0.47
kgCO2eq/kWh (SEMARNAT, 2008).
3.4 Results
This section describes the results of the quantitative evaluation obtained with the
different tools and methodologies. The results are presented in three stages: (i)
Characterisation of energy consumption and GHG emissions, (ii) eco-technology and (iii)
green spaces.
3.4.1 Characterisation of energy consumption
Table 3.1 presents the list of the main electrical equipment used in social housing and
their frequencies of use per year according to data from the field surveys (Cerón-Palma
et al 2011b). The equipment presented was the most repeated and the frequency is the
representative average. It is important to mention that 30% of the houses included in
the field work had an air conditioner, and therefore, this cooling system was considered
in the study due to the almost 50% increase in energy consumption in housing with air
conditioning.

51
STRATEGIES TO REDUCE ENERGY AND GHG EMISSIONS IN BUILDINGS IN MEXICO: A CASE OF SOCIAL HOUSING PART 2
Table 3.1 Annual energy consumption and emissions associated with the use stage of housing.
Concept
Number Uptime
Hours/year
Power
kW
Consumption
kWh/year
Emissions
kgCO2eq/year
Household products
Blender
Iron
Washer
Mobile charger
TV
Stereo
Computer
Refrigerator
1
1
1
2
1
1
1
1
62
106
216
438
1460
157
1095
2920
0.65
1
0.50
0.005
0.25
0.03
0.30
0.30
Subtotal
40
106
108
4
365
5
329
876
1833
19
50
51
2
172
2
154
412
862
Illumination.
Incandescent bulbs
Living room
Kitchen
Bedrooms
Bathroom
Patio
Access
2
1
4
1
1
1
1825
1095
1825
365
365
1460
0.06
0.06
0.06
0.06
0.06
0.06
Subtotal
219
66
438
22
22
88
855
103
31
206
10
10
41
401
Mechanical Ventilation
Pedestal fan
Ceiling fan
Artificial cooling
1
2
2190
4380
0.08
0.06
Subtotal
175 82
526 247
701 329
Air conditioner
Social housing with air
conditioner
Social housing without
air conditioner
1 2190 1.4
Subtotal
Total
Total
3066 1441
3066 1441
6455 3033
3389 1592
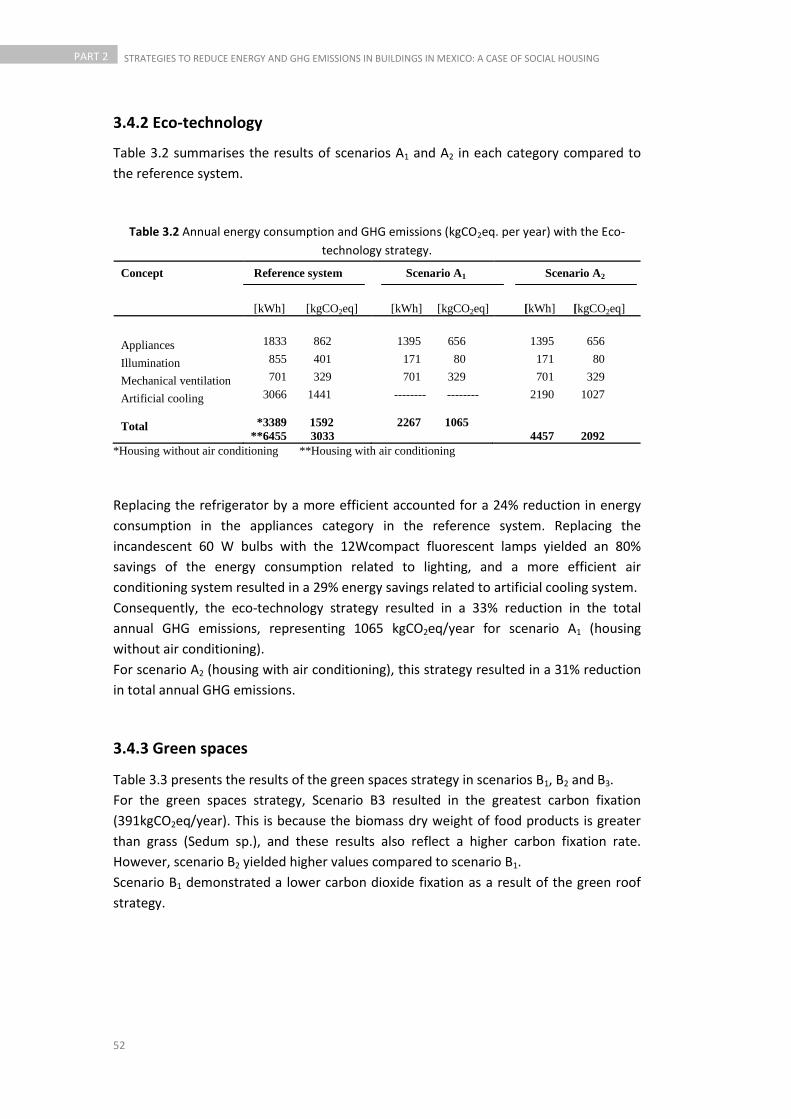
52
PART 2 STRATEGIES TO REDUCE ENERGY AND GHG EMISSIONS IN BUILDINGS IN MEXICO: A CASE OF SOCIAL HOUSING
3.4.2 Eco-technology
Table 3.2 summarises the results of scenarios A1 and A2 in each category compared to
the reference system.
Table 3.2 Annual energy consumption and GHG emissions (kgCO2eq. per year) with the Eco-
technology strategy.
Concept Reference system
[kWh] [kgCO2eq]
Scenario A1
[kWh] [kgCO2eq]
Scenario A2
[kWh] [kgCO2eq]
Appliances 1833 862 1395 656 1395 656
Illumination 855 401 171 80 171 80
Mechanical ventilation 701 329 701 329 701 329
Artificial cooling 3066 1441 -------- -------- 2190 1027
Total *3389 1592
**6455 3033
2267 1065
4457 2092
*Housing without air conditioning **Housing with air conditioning
Replacing the refrigerator by a more efficient accounted for a 24% reduction in energy
consumption in the appliances category in the reference system. Replacing the
incandescent 60 W bulbs with the 12Wcompact fluorescent lamps yielded an 80%
savings of the energy consumption related to lighting, and a more efficient air
conditioning system resulted in a 29% energy savings related to artificial cooling system.
Consequently, the eco-technology strategy resulted in a 33% reduction in the total
annual GHG emissions, representing 1065 kgCO2eq/year for scenario A1 (housing
without air conditioning).
For scenario A2 (housing with air conditioning), this strategy resulted in a 31% reduction
in total annual GHG emissions.
3.4.3 Green spaces
Table 3.3 presents the results of the green spaces strategy in scenarios B1, B2 and B3.
For the green spaces strategy, Scenario B3 resulted in the greatest carbon fixation
(391kgCO2eq/year). This is because the biomass dry weight of food products is greater
than grass (Sedum sp.), and these results also reflect a higher carbon fixation rate.
However, scenario B2 yielded higher values compared to scenario B1.
Scenario B1 demonstrated a lower carbon dioxide fixation as a result of the green roof
strategy.
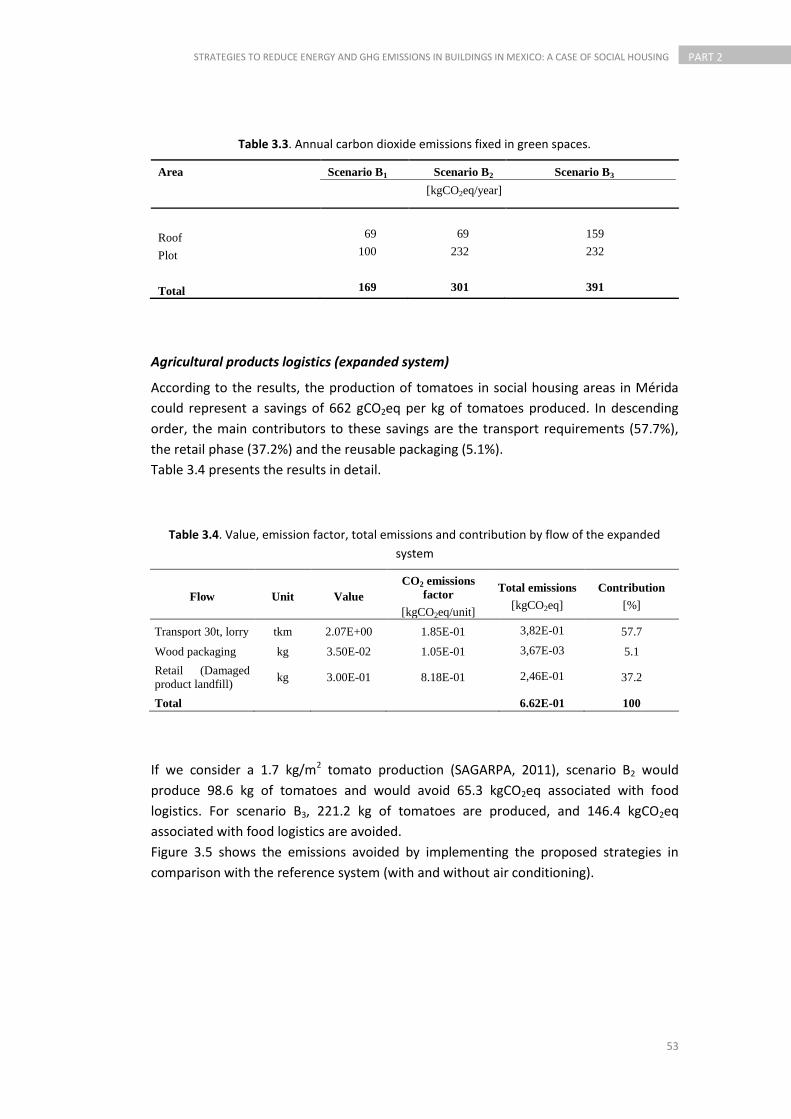
53
STRATEGIES TO REDUCE ENERGY AND GHG EMISSIONS IN BUILDINGS IN MEXICO: A CASE OF SOCIAL HOUSING PART 2
Table 3.3. Annual carbon dioxide emissions fixed in green spaces.
Area Scenario B1
Scenario B2
Scenario B3
Roof 69 69 159
Plot 100 232 232
Total 169 301 391
Agricultural products logistics (expanded system)
According to the results, the production of tomatoes in social housing areas in Mérida
could represent a savings of 662 gCO2eq per kg of tomatoes produced. In descending
order, the main contributors to these savings are the transport requirements (57.7%),
the retail phase (37.2%) and the reusable packaging (5.1%).
Table 3.4 presents the results in detail.
Table 3.4. Value, emission factor, total emissions and contribution by flow of the expanded
system
Flow Unit Value
CO2 emissions
factor
[kgCO2eq/unit]
Total emissions
[kgCO2eq]
Contribution
[%]
Transport 30t, lorry tkm 2.07E+00 1.85E-01 3,82E-01 57.7
Wood packaging kg 3.50E-02 1.05E-01 3,67E-03 5.1
Retail (Damaged
product landfill) kg 3.00E-01 8.18E-01 2,46E-01 37.2
Total
6.62E-01 100
If we consider a 1.7 kg/m2 tomato production (SAGARPA, 2011), scenario B2 would
produce 98.6 kg of tomatoes and would avoid 65.3 kgCO2eq associated with food
logistics. For scenario B3, 221.2 kg of tomatoes are produced, and 146.4 kgCO2eq
associated with food logistics are avoided.
Figure 3.5 shows the emissions avoided by implementing the proposed strategies in
comparison with the reference system (with and without air conditioning).
[kgCO2eq/year]
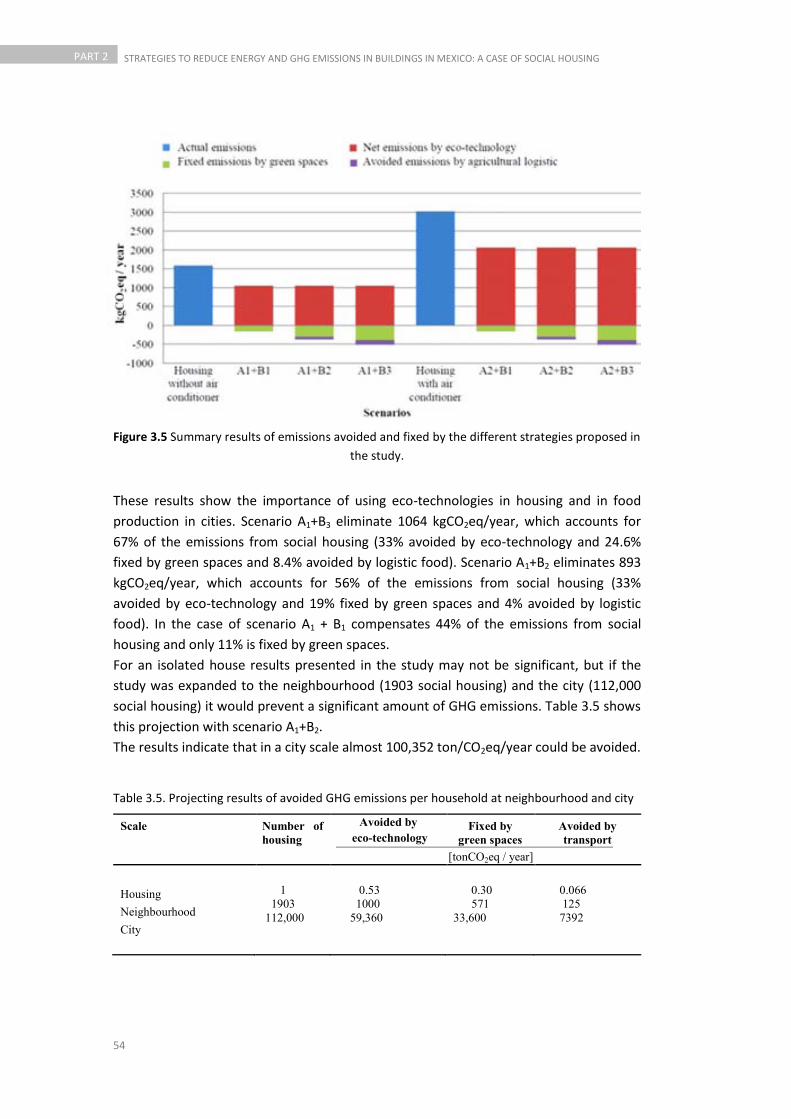
54
PART 2 STRATEGIES TO REDUCE ENERGY AND GHG EMISSIONS IN BUILDINGS IN MEXICO: A CASE OF SOCIAL HOUSING
Figure 3.5 Summary results of emissions avoided and fixed by the different strategies proposed in
the study.
These results show the importance of using eco-technologies in housing and in food
production in cities. Scenario A1+B3 eliminate 1064 kgCO2eq/year, which accounts for
67% of the emissions from social housing (33% avoided by eco-technology and 24.6%
fixed by green spaces and 8.4% avoided by logistic food). Scenario A1+B2 eliminates 893
kgCO2eq/year, which accounts for 56% of the emissions from social housing (33%
avoided by eco-technology and 19% fixed by green spaces and 4% avoided by logistic
food). In the case of scenario A1 + B1 compensates 44% of the emissions from social
housing and only 11% is fixed by green spaces.
For an isolated house results presented in the study may not be significant, but if the
study was expanded to the neighbourhood (1903 social housing) and the city (112,000
social housing) it would prevent a significant amount of GHG emissions. Table 3.5 shows
this projection with scenario A1+B2.
The results indicate that in a city scale almost 100,352 ton/CO2eq/year could be avoided.
Table 3.5. Projecting results of avoided GHG emissions per household at neighbourhood and city
Scale Number of housing
Avoided byeco-technology
Fixed by green spaces
Avoided by transport
HousingNeighbourhoodCity
11903
112,000
0.531000
59,360
0.30 571
33,600
0.066 125
7392
[tonCO2eq / year]

55
STRATEGIES TO REDUCE ENERGY AND GHG EMISSIONS IN BUILDINGS IN MEXICO: A CASE OF SOCIAL HOUSING PART 2
3.5 Discussion
The results demonstrate the importance of applying the eco-technologies and green
spaces strategies proposed in this study to social housing. Based on previous studies, we
know that due to the low quality of social housing in Mexico, air conditioning is
necessary in order to maintain comfort (Cerón-Palma, 2008).
According this study the air conditioning was responsible for 48% of the energy
consumption and associated GHG emissions. For eco-technology strategy, the results
projected a 31% reduction in the total annual of energy consumption and GHG
emissions in housing with air conditioning.
The green-space strategies also produced significant achievements in GHG emission
reductions, particularly scenarios B2 and B3. The green roof strategy (B1) was the strategy
that achieved the lowest result of CO2 fixation. It is worth mentioning that the time that
carbon remains in the soil is not included in this study and carbon fixed in green spaces
is only an estimation.
However, there is no reason for not considering this strategy because it may have other
benefits in energy consumption by functioning as insulation and reduce the heat load of
the roof. It is worth mentioning that the study did not consider the effect of the green
roof as a thermal insulation system for the housing that would reduce its energy
demand and GHG emissions.
Other passive means such as the use of thermal insulation, best house orientation,
window shading, etc., can be implemented in conjunction with the measurements
suggested in this study. Such research on passive means and their effect on energy
consumption are currently under investigation.
Respect to the production of food, the type of crop and its management is another issue
that deserve further considerations.
For instance citrus trees can represent a more favourable strategy for food self-
sufficiency and fixation of carbon emissions. According to previous studies by Carvajal
(2008), the lemon and orange trees may fix between 49 kgCO2 and 106 kgCO2 per year
respectively. If we use this data in the social neigbourhood under study, and we propose
this strategy for half of the donation area (diverse use area), lemon tree crops at a
density of 0.028 tree/m2 would fix around 88 tonCO2/year.
According to the results of this study, the amount of GHG avoided by the eco-technology
strategy is higher than that avoided by the green space strategy and by the reduction in
food logistics. Nevertheless, the integration of food production within cities in addition
to the environmental benefits that were quantified in this study, could contribute to
other economic and social benefits to the neighbourhoods. For example, promote a
sense of community (Flores, 2006), increase access to healthy and nutritious food
(Blaine et al. 2010; Duchemin et al. 2008), and strengthen local economies (Masi, 2008;
Moustier, 2006). Also, this strategy can lead to develop food self-sufficiency
communities with less CO2 emissions; for instance, Doron (2005) calculates that local
production in UK could reduce CO2 emissions by 22%.
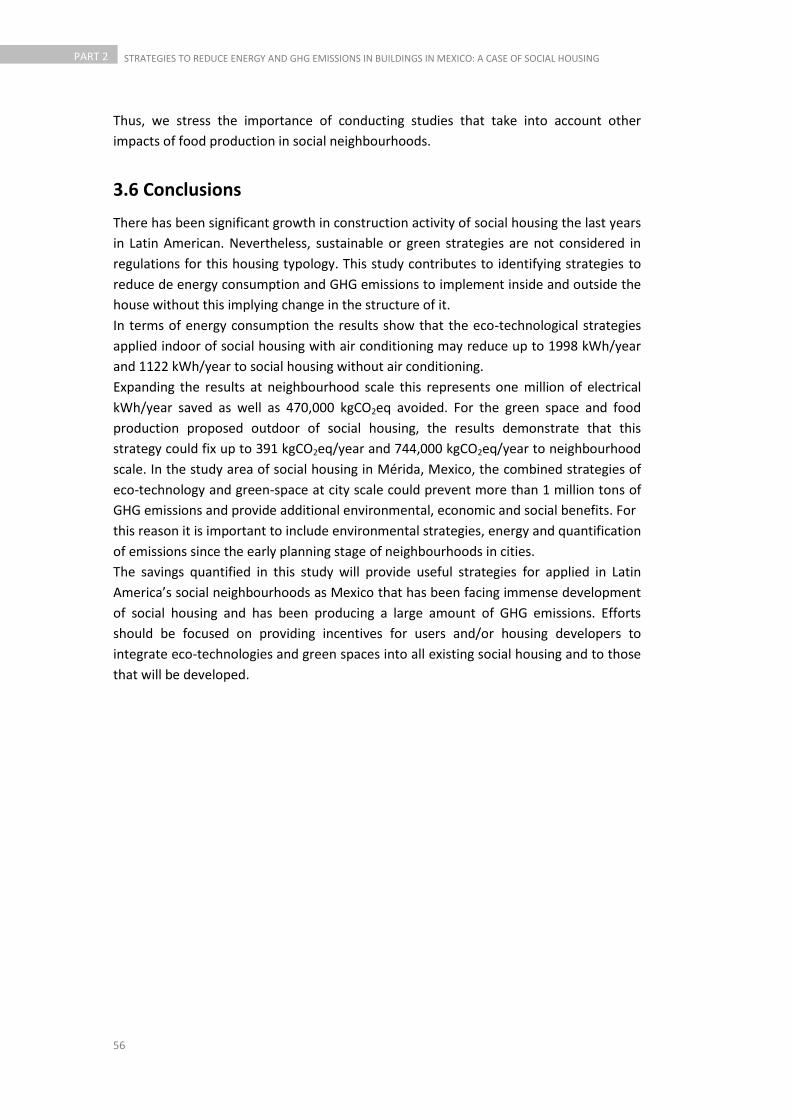
56
PART 2 STRATEGIES TO REDUCE ENERGY AND GHG EMISSIONS IN BUILDINGS IN MEXICO: A CASE OF SOCIAL HOUSING
Thus, we stress the importance of conducting studies that take into account other
impacts of food production in social neighbourhoods.
3.6 Conclusions
There has been significant growth in construction activity of social housing the last years
in Latin American. Nevertheless, sustainable or green strategies are not considered in
regulations for this housing typology. This study contributes to identifying strategies to
reduce de energy consumption and GHG emissions to implement inside and outside the
house without this implying change in the structure of it.
In terms of energy consumption the results show that the eco-technological strategies
applied indoor of social housing with air conditioning may reduce up to 1998 kWh/year
and 1122 kWh/year to social housing without air conditioning.
Expanding the results at neighbourhood scale this represents one million of electrical
kWh/year saved as well as 470,000 kgCO2eq avoided. For the green space and food
production proposed outdoor of social housing, the results demonstrate that this
strategy could fix up to 391 kgCO2eq/year and 744,000 kgCO2eq/year to neighbourhood
scale. In the study area of social housing in Mérida, Mexico, the combined strategies of
eco-technology and green-space at city scale could prevent more than 1 million tons of
GHG emissions and provide additional environmental, economic and social benefits. For
this reason it is important to include environmental strategies, energy and quantification
of emissions since the early planning stage of neighbourhoods in cities.
The savings quantified in this study will provide useful strategies for applied in Latin
America’s social neighbourhoods as Mexico that has been facing immense development
of social housing and has been producing a large amount of GHG emissions. Efforts
should be focused on providing incentives for users and/or housing developers to
integrate eco-technologies and green spaces into all existing social housing and to those
that will be developed.
57
STRATEGIES TO REDUCE ENERGY AND GHG EMISSIONS IN BUILDINGS IN MEXICO: A CASE OF SOCIAL HOUSING PART 2
References to Chapter 3 Aguilar, A., Santos, C (2011). Informal settlements needs and environmental conservation in Mexico City: An unsolved challenge for land-use policy. Land Use Policy, 28: 649–662
Ash, C., Jasny, B., Roberts, L., Stone, R., Sugden, A. (2008). Reimagining cities - Introduction. Science, 319: 739-739.
Blaine, T. W., Grewal, P. S., Dawes, A., Snider, D (2010). Profiling community gardeners. Journal of Extension, 48(6). <http://www.joe.org/joe/2010december/a6.php>. Accesed 17.10.11
Canto, R. (2010). Relación entre tipos de superficies urbanas y la distribución de la temperatura en Mérida. En Canto, R., editor. Cuadernos de Arquitectura de Yucatán. UADY, Yucatán, 24: 34-47
Canto, R., Pérez, M. (2003). Las islas de calor en Mérida. Memoria de la XXVII Semana Nacional de Energía Solar, Chihuahua, México, 457-461
Carvajal, M. (2008). Investigación sobre la absorción de CO2 de los cultivos más representativos. CSIC. <www.lessco2.es/documentacion.htm> Accessed 09.03.11
Cerón-Palma, I. (2008). Evaluación de Factores de Confort y contaminación ambiental en la vivienda económica de clima cálido-húmedo. Master disertación. Facultad de Ingeniería. Universidad Autónoma de Yucatán.
Cerón-Palma, I., Sanyé-Mengual, E., Oliver-Solà, J., Rieradevall, J., Montero, J. (2011a). LCM of green food production in Mediterranean cities: environmental benefits associated to the energy savings in the use stage of Roof Top Greenhouse (RTG) systems. International Conference on life cycle management, LCM2011. Berlin, Germany.
Cerón-Palma, I., Oliver-Solà, J., Sanye-Mengual, E., Rieradevall, J, Montero, JI.(2011b) “Strategies for reducing the carbon footprint in a social housing district in Merida, Yucatan, Mexico”. In proceedings of International Life Cycle Assessment Conference in Latin-America, CILCA 2011. Coatzacoalcos, Veracruz, Mexico.
Cohen, B. (2006). Urbanization in developing countries: Current trends, future projections, and key challenges for sustainability. Technology in Society, 28: 63-80.
CONAE (2011). National Commission for Energy Conservation. <http://www.conuee.gob.mx/wb/CONAE/english>. Accessed 24.06.11
CONAVI (2006). La energía en la vivienda. Uso eficiente de la energía en la vivienda, México, D.F. <http://www.conavi.gob.mx/documentos/publicaciones/guia_energia.pdf.> Accessed 28.05.11
CONAVI (2008). Emisiones de gases de efecto invernadero en la vivienda. En Programa Específico Desarrollo Habitacional Sustentable ante el cambio climático, México, D.F.
Doka, G (2009). Life Cycle Inventories of Waste Treatment Services. Final report ecoinvent v2.1 No. 13. Swiss Centre for Life Cycle Inventories, Dübendorf, CH.
58
PART 2 STRATEGIES TO REDUCE ENERGY AND GHG EMISSIONS IN BUILDINGS IN MEXICO: A CASE OF SOCIAL HOUSING
Doron, G (2005). Urban agriculture: Small, medium, large. Architectural Design, 75(3): 52–59.
Duchemin, E., Wegmuller, F., & Legault, A. M (2008). Urban agriculture: Multidimensional tools for social development in poor neighborhoods. Field actions science report (Vol. 1, No. 1). <http://factsreports.revues.org/index113.html>. Accesed 12.09.11
Farreny, R., Oliver-Solà, J., Montlleó M., Escriba, E., Gabarrel, X., Rieradevall, J. (2011). Transition Towards Sustainable Cities: Opportunities, Constraints and Strategies in Planning. A Neighbourhood Eco-Design Case Study in Barcelona (Spain). Environment and Planning A, 43: 1118-1134
Ferguson, B., Navarrete, J (2003). New approaches to progressive housing in Latin America: A key to habitat programs and policy, Habitat International, 27 (2003): 309–323
Flores, H. C (2006). Food not lawns: How to turn your yard into a garden and your neighborhood into a community (p. 334). Virginia: Chelsea Green Publishing Company.
Getter, K., Bradley, R., Robertson, P., Bert, M., Andresen, A (2009). Carbon Sequestration Potential of Extensive Green Roofs. Environmental Science & Technology, 43 (19): 7564–7570
Gobierno del Estado de Yucatán (1985). Decreto 307, Ley de fraccionamientos del Estado de Yucatán. Secretaría de obras públicas y desarrollo urbano. <http://www.seduma.yucatan.gob.mx/archivos/legislacion-fija/ley-fraccionamientos.pdf> Accesed 12.09.11
González, L. (2006). Política de subsidios, política de vales de despensa. En economía y política de la vivienda en México. PhD Thesis. <http://www.eumed.net/tesis/2006/lgt/> Accesed 17.09.10
Grewal, S.S., Grewal, P.S (2012) Can cities become self-reliant in food? Cities, 29 (1): 1–11
Guinee, J., Gorrée, M., Heijungs, R., Huppes, G., Kleijn, R., de Koning, A., van Oers, L., Wegener Sleeswijk, A., Suh, S., Udo de Haes, H.A., de Bruijn, H., van Duin, R., Huijbregts, M.A.J. (2001). Life cycle assessment—an operational guide to the ISO standards, Centre of Environmental Sciences (CML), Leiden University
INEGI (2010a). Censo de población y vivienda 2010. Total de viviendas habitadas. Estados Unidos Mexicanos. <http://www.inegi.org.mx/sistemas/mexicocifras/default.aspx> Accesed 11.11.2011
INEGI (2010b). Censo de población y vivienda 2010. Población total. Mérida, Yucatán. <http://www.inegi.org.mx/sistemas/mexicocifras/default.aspx?e=31> Accesed 11.11.2011
IPCC (2006a). IPCC Guidelines for National Greenhouse Gas Inventories. Volum 3: Agriculture, forestry and other land use. Geneva, Switzerland.
IPCC (2006b). IPCC Guidelines for National Greenhouse Gas Inventories. Volum 5: Waste; Chapter 3: Solid Waste Disposal. Geneva, Switzerland.
59
STRATEGIES TO REDUCE ENERGY AND GHG EMISSIONS IN BUILDINGS IN MEXICO: A CASE OF SOCIAL HOUSING PART 2
ISO. International Organization of Standardization.14040. (2006) Life cycle assessment—principles and framework. Geneva, Switzerland.
Li, J., Wai, Y., Zhan, J., Ho, A., Li, J., Lam, E. (2010). Effect of green roof on ambient CO2 concentration. Building and environment, 45(12): 2644-2651
Masi, B. (2008). Defining the urban-agrarian space. Cities growing smaller, Kent State University’s Cleveland Urban Design Collaborative, 85-102
Medina-Ross, J.A., Mata-Sandoval, J.C., López-Pérez, R .(2005). Indicators for sustainable energy development in Mexico. Natural Resources Forum, 29: 308-21.
Morillón, D. (2008). Bases para una hipoteca verde en México, camino a la vivienda sustentable. Estudios de Arquitectura Bioclimática. Limusa-UAM, México, 9: 85-1002
Moustier, P., Danso, G. (2006 ). Local economic development and marketing of urban produced food. In Rene van Veenhuizen (Ed.), Cities farming for the future: Urban agriculture for green and productive cities. Ottawa: RUAF Foundation. 173–208
Noguchi, M., Hernandez-Velasco, C. (2005) A ‘mass custom design’ approach to upgrading conventional housing development in Mexico. Habitat International 29 (2005): 325–336
OECD (2007). OECD Territorial Reviews: Yucatan, Mexico. Organisation for Economic Co-operation and Development. OECD, France.
Oliver-Solà, J., Josa, A., Gabarrell, X., Rieradevall, J (2009). Environmental optimization of concrete sidewalks in urban areas. The International Journal of Life Cycle Assessment 14(4), 302-312.
Pretty, JN., Morison, L., Hine, RE. (2003). Reducing food poverty by increasing agricultural sustainability in developing countries. Agriculture, Ecosystems and Environment, 95: 217-230
Romero, R (2007). Informe técnico del proyecto “Confort térmico y ahorro de energía en la vivienda económica en México: Regiones de clima cálido húmedo y seco” CONAVI-CONAFOVI
Rosas-Flores, J.A., Rosas-Flores, D., Morrillón, D (2011). Saturation, energy consumption, CO2 emission and energy efficiency from urban and rural households appliances in Mexico. Energy and Buildings 43: 10–18
Rosas-Flores, J., Morillon, D. (2010). What goes up: Recent trends in Mexican residential energy use. Energy 35: 2596–2602
Rosas, J., Sheinbaum, C., Morillon, D. (2010). The structure of household energy consumption and related CO2 emissions by income group in Mexico. Energy for Sustainable Development 14: 127–133
SAGARPA. (2011). Ministry of Agriculture, Livestock, Rural Development, Fisheries and Food. <http://www.sagarpa.gob.mx/English/Pages/Introduction.aspx> Accessed 08.05.11
Santoyo-Castelazo, E., Gujba, H., Azapagiz, A. (2011). Life cycle assessment of electricity generation in Mexico. Energy, 36: 1488-1499.

60
PART 2 STRATEGIES TO REDUCE ENERGY AND GHG EMISSIONS IN BUILDINGS IN MEXICO: A CASE OF SOCIAL HOUSING
Sanyé, E., Cerón-Palma, I., Oliver-Solà, J., Montero, JI., Rieradevall, J. (2012). Environmental analysis of the logistics of agricultural products through Roof Top Greenhouse (RTG) in Mediterranean urban areas. Journal of the Science of Food and Agriculture (online first).
SEDUMA, 2008. Límites de crecimiento de la zona urbana de Mérida. Secretaría de Desarrollo Urbano y Medio Ambiente, Mérida, Yucatán, México.
SEMARNAT (2008). Programa GEI México. <http://www.geimexico.org/factor.html> Accessed 29.07.11
SENER (2009). Balance de Energía 2008. Secretaría de Energía, México, D.F.
SENER (2011). Estadísticas destacadas del sector energetico. México, DF. <http://www.sener.gob.mx/webSener/portal/Default.aspx?id=1432> Accessed 13.07.2011
Sheinbaum, C., Ruíz, B., Ozawa, L. (2011). Energy consumption and related CO2 emissions in five Latin American countries: Changes from 1990 to 2006 and perspectives. Energy 36(6), 3629-3638
SHF (2010). Sociedad Hipotecaria Federal. Estado actual de la vivienda en México 2010. Mexico: Sestante.
Sullivan , E., Ward, P (2012). Sustainable housing applications and policies for low-income self-build and housing rehabq. Habitat International 36: 312-323
Tiwari, K., Saxena, A., Katare, V. (2012). Mapping and evaluation of urban sprawl using an integrated approach of Remote Sensing and GIS Technique. International Journal of Advanced Technology & Engineering Research (IJATER) 2(1): 21-29
Torres, F (2001). El saldo del siglo XX: La inseguridad alimentaria en México. Universidad Autónoma de México. XXI Seminario de Economía Agrícola, Mexico, D.F.
Turok, I (2011). Deconstructing density: Strategic dilemmas confronting the post-apartheid city. Cities 28(5): 470–477
UADY (2011). Centro Metereológico. Campus de ciencias exactas e ingenierías de la Universidad Autónoma de Yucatán. <http://www.estacionclimatologica.ingenieria.uady.mx/> Accessed 29.07.11
Ward, P., Aguilar, A. (2003). Globalization, regional development and mega city expansion in Latin America: Analyzing Mexico’citys periurban hinterland. Cities 20, 3-21
Werner, F., Althaus, H.-J., Künniger, T., Richter, K., Jungbluth N. (2007). Life Cycle Inventories of Wood as Fuel and Construction Material. Final report ecoinvent data v2.0 No. 9. Swiss Centre for Life Cycle Inventories, Dübendorf, CH.
61
STRATEGIES TO REDUCE ENERGY AND GHG EMISSIONS IN BUILDINGS IN MEXICO: A CASE OF SOCIAL HOUSING PART 2
Strategies to reduce the energy requirements and
CO2 emissions of cooling demand on social
housing in warm-humid climates of Mexico.
Chapter 4
PHOTOGRAPHY BY ILEANA CERON

62
PART 2 STRATEGIES TO REDUCE ENERGY AND GHG EMISSIONS IN BUILDINGS IN MEXICO: A CASE OF SOCIAL HOUSING
This chaptes is based in the following paper:
Ceron-Palma I, Sanyé-Mengual E, Oliver-Solà J, Rieradevall J, Montero JI (2012).
Strategies to reduce the energy requirements and CO2 emissions of cooling demands
on social housing in warm-humid climates of Mexico. Submitted to Energy and
buildings
Abstract
This article is focused on the eco-rehabilitation of existing social housing in Mexico with the goal
of reducing the equivalent CO2 emissions and the energy requirements due to cooling demands.
The objective is to evaluate local passive strategies for social housing in a warm-humid climate
and to quantify the potential savings these measures could yield by reducing the cooling demand
and equivalent CO2 emissions. Four strategies were selected: green roof, roof shade made with
jute-based fabrics, overhangs on walls and louvers in windows.
For the investigation, bioclimatic analysis tools, the quantification of heat contributions and
energy and environmental evaluations were integrated with the support of the programmes
Ecotect, EnergyPlus, DesignBuilder and Simapro.
The results indicate that wall overhangs and louvers in windows reduce the annual requirements
of energy for cooling by 5 and 11%, respectively. Although green roofing provides only a 13%
reduction in the cooling energy requirements, this strategy reduces the annual roof heat
contributions by 51%, due to its insulating effect. Roof shade with jute fabric can conserve up to
27% of the annual cooling energy required to house, and jute materials have a small
environmental impact and low energetic amortisation time.
63
STRATEGIES TO REDUCE ENERGY AND GHG EMISSIONS IN BUILDINGS IN MEXICO: A CASE OF SOCIAL HOUSING PART 2
4.1 Introduction
Currently, the construction sector contributes approximately one-third of the global
energy consumption and greenhouse gas (GHG) emissions worldwide. At the same time,
carbon emissions related to the construction sector are expected to increase from 8.6
billion tonnes in 2004 to 11.1 billion tonnes by 2020 (UNEP, 2011). Several initiatives
have emerged throughout the world to improve energy efficiency and reduce GHG
emissions in the construction sector.
Bioclimatic architecture emerged in the middle of the last century as an alternative
method for constructing, through passive strategies to adapt to climatic conditions of
the site and promote energy efficiency (Tzikopoulos et al. 2005). Due to the potential
savings, the integration of bioclimatic aspects in construction design has received
considerable attention in recent years through various research studies (Radovic, 1996).
It is important to mention that each climate requires specific strategies to achieve
comfort and minimise energy consumption (Vale, 1993). An integration of the
assessment of the environment and climatic parameters in the initial design phase can
lead to a better efficiency of the thermal behaviour of houses (Dahlan et al. 2010).
In developing Latin American countries, such as Mexico, the residential construction
sector is responsible for 17% of the energy consumption (Rosas et al. 2010). In Mexican
cities, the rapid growth of urban areas has caused a huge increase in housing
construction. These houses are built in the same way in different regions of the country,
regardless of climatic differences. This causes an increase in energy consumption in
warm regions due to the large amounts of energy required for domestic cooling and
heating during long periods in order to maintain comfort (Cerón-Palma, 2008). To
address this serious problem in Mexico, there has been a renewed interest in studies
that aim to improve the energy efficiency of newly constructed social houses. There is
also interest in the development of voluntary standards, to ensure the proper use of
materials and in order to limit heat gains. For example, the objective of regulation NOM-
020-ENER-2011 (CONAE, 2011) is the rationalisation of the use of energy in cooling
systems via the house envelope. Regulation NMX-C-460-ONNCCE-2009 (ONCE, 2009)
establishes specifications for the total thermal resistance (‘R’) to be met by houses
through their envelope, in order to improve living conditions and reduce the energy
demand of the thermal conditioning of interior spaces according to the thermal zone of
the country where the house is located.
The National Housing Commission (Comisión Nacional de Vivienda - CONAVI) has
developed guidelines in order to improve energy efficiency and incorporate bioclimatic
analysis into new social housing developments from the design stage. Few guidelines
exist in respect to the rehabilitation of existing housing (CONAVI, 2006). In Merida,
Yucatan, results from studies of the annual temperature and humidity trends inside and
outside four existing social houses showed a low resistivity of the thermal envelope at
higher temperatures during the warmer months (Cerón-Palma et al. 2008). Within the
same study the comfort of 160 people was assessed according to the ISO 7730 (2005).
The results showed people experienced a discomfort level of 90%. A green roof was
64
PART 2 STRATEGIES TO REDUCE ENERGY AND GHG EMISSIONS IN BUILDINGS IN MEXICO: A CASE OF SOCIAL HOUSING
installed on the roof of a bedroom of a social housing unit using low-cost recycled
materials. Measurements were taken during a typical summer month in Merida
(Mexico), and a temperature difference of 2°C was observed in the interior bedroom
compared to a housing unit without a green roof (Cerón-Palma et al. 2010).
4.2 Justification and objectives The majority of previous studies have focused on different strategies used in existing
housing than can be applied in new construction. Considerable efforts are being made in
Latin American countries to incorporate norms that include the thermal behaviour and
energy efficiency in the development of new housing complexes. Nevertheless, in 2010,
the existence of more than 35 million houses in Mexico, was reported as being an
important contributing factor to the country’s total energy consumption (Sheinbaum et
al 2011). Currently, there are a large number of social housing projects constructed in
the last few years, which need to be studied in order to determine strategies for eco-
rehabilitation. These studies will need to be conducted in order to quantify the
environmental and energetic impact of such modifications. According to data reported
by the National Institute of Statistics and Geography (Instituto Nacional de Estadística y
Geografía - INEGI), more than 112,000 social housing units have been constructed in the
city of Mérida, Yucatan, a zone representative of warm-humid climate (INEGI, 2006).
Social housing projects do not consider environmental or energy aspects. The
incorporation of eco-rehabilitation strategies represents an important local and global
action to reduce energy consumption, lower the associated CO2 emissions and improve
the quality of life of people living in these houses. The energy savings attributed to the
internal thermal loads (e.g. households, lighting) in this type of social housing have been
previously studied (Cerón-Palma et al. 2011). Strategies that lead to thermal loads
reductions provided by the house envelope (walls, windows and roof) are analysed in
this study.
The main objective of this study is to evaluate the changes in the thermal behaviour of a
social housing unit in a warm-humid climate, when eco-rehabilitation strategies are
applied using passive approaches in the house envelope. The purpose is to reduce the
cooling energy demand and decrease the equivalent CO2 emissions. Passive strategies
were selected and adapted to the resources and local technologies, in order to
incorporate these measures into the house exteriors. The following additional objectives
were also studied: to quantify the cooling energy requirements of the house when
applying the proposed strategies; to quantify the cumulative energetic demand and CO2
emissions associated with the materials used in each strategy; and to propose the best
environmental and energetic strategies as guidelines for the eco-rehabilitation of
existing social housing.

65
STRATEGIES TO REDUCE ENERGY AND GHG EMISSIONS IN BUILDINGS IN MEXICO: A CASE OF SOCIAL HOUSING PART 2
4.3. Definition of the study system
4.3.1 Study site: general data on the geography and climate
The study was conducted in the city of Merida, located in the state of Yucatan, in the
southeast of Mexico. Merida is a dense and expansive city, with a population of
approximately 900,000 inhabitants. In recent years, large social housing complexes have
been developed, which is why this city was selected as the study area. Merida is located
at latitude of 20o58N and longitude of 89o58 W. According to the bio-climatic
classification of Mexico, the city of Merida has a semi-humid warm climate with an
annual precipitation of 990 mm and an average temperature of 29ºC. The highest
temperatures occur between April and September (OECD, 2007). The highest monthly
average temperatures are in May with a value of 29.1ºC and maximum temperatures of
38.4ºC during this month. The lowest relative humidity and greatest solar radiation are
found in April and May. The minimum monthly average temperature occurs in January,
with a value of 23.1ºC. This data explains the need for cooling during most of the year.
Moreover, the high relative humidity values cause evaporative air conditioning systems
to have a low efficacy, thereby leading to a large consumption of energy.
4.3.2 Object of study: social housing
An eco-rehabilitation study was developed using a standard social housing unit,
representative of the current social housing landscape in Mexico. It is located in a
neighbourhood in the south-eastern part of Mérida, Yucatan. This district consists of
1,903 houses. The lots are of 8 x 20 m, 10 x 20 m and 10 x 25 m, with the majority of lots
being 160 m2. The lateral space separating the houses from each other is 1.0 m. The
typical distribution of houses within the neighbourhood is shown in Figure 4.1. The
house selected for this study is orientated north.

66
PART 2 STRATEGIES TO REDUCE ENERGY AND GHG EMISSIONS IN BUILDINGS IN MEXICO: A CASE OF SOCIAL HOUSING
Figure 4.1. Main characteristics of the distribution of houses in the social housing neighbourhood
Social housing units without improvements have been called the “base case”. The unit
consists of a single floor of 56 m2, which is inhabited by four people. The house is
divided into four zones: adult´s room, children’s room, bathroom and a living-dining
area that includes a kitchen. The construction system is based on conventional
materials, such as concrete block walls, joist and slab coverings. The interior height of
the unit is 2.50 m. The house has windows on the north, south and east facades. The
dimensions and main housing characteristics are summarized in Figure 4.2.
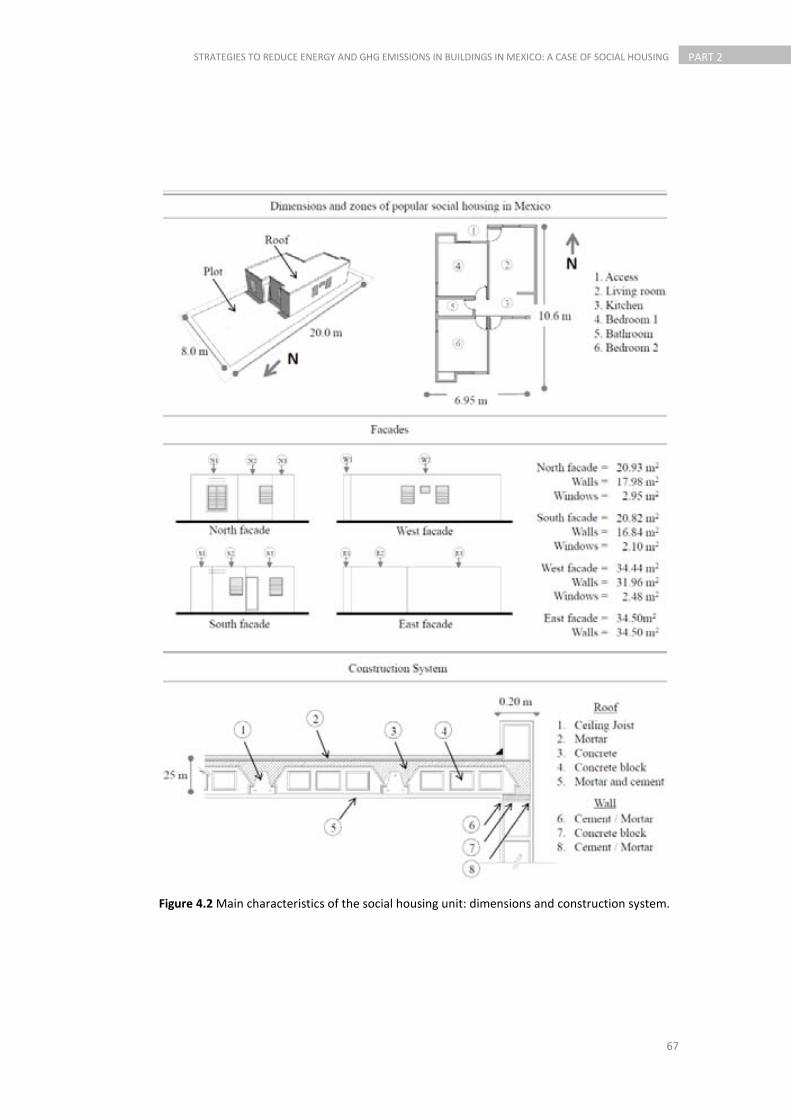
67
STRATEGIES TO REDUCE ENERGY AND GHG EMISSIONS IN BUILDINGS IN MEXICO: A CASE OF SOCIAL HOUSING PART 2
Figure 4.2 Main characteristics of the social housing unit: dimensions and construction system.
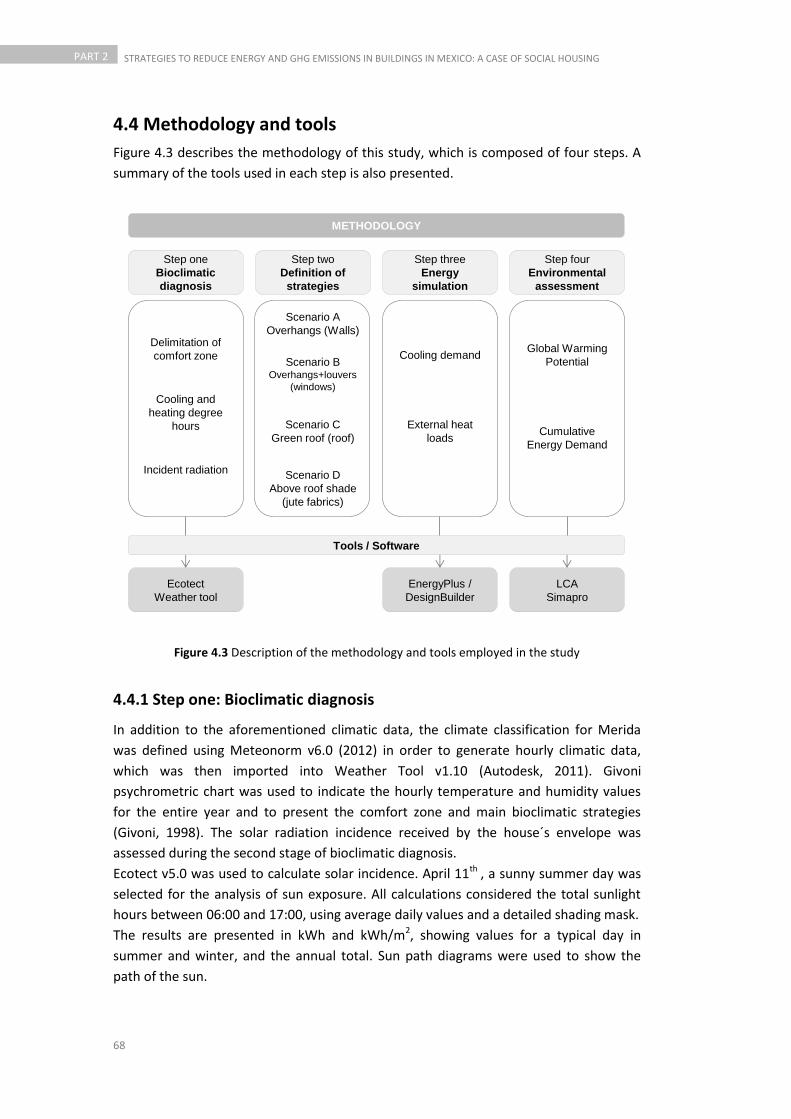
68
PART 2 STRATEGIES TO REDUCE ENERGY AND GHG EMISSIONS IN BUILDINGS IN MEXICO: A CASE OF SOCIAL HOUSING
4.4 Methodology and tools
Figure 4.3 describes the methodology of this study, which is composed of four steps. A
summary of the tools used in each step is also presented.
Figure 4.3 Description of the methodology and tools employed in the study
4.4.1 Step one: Bioclimatic diagnosis
In addition to the aforementioned climatic data, the climate classification for Merida
was defined using Meteonorm v6.0 (2012) in order to generate hourly climatic data,
which was then imported into Weather Tool v1.10 (Autodesk, 2011). Givoni
psychrometric chart was used to indicate the hourly temperature and humidity values
for the entire year and to present the comfort zone and main bioclimatic strategies
(Givoni, 1998). The solar radiation incidence received by the house´s envelope was
assessed during the second stage of bioclimatic diagnosis.
Ecotect v5.0 was used to calculate solar incidence. April 11th , a sunny summer day was
selected for the analysis of sun exposure. All calculations considered the total sunlight
hours between 06:00 and 17:00, using average daily values and a detailed shading mask.
The results are presented in kWh and kWh/m2, showing values for a typical day in
summer and winter, and the annual total. Sun path diagrams were used to show the
path of the sun.
METHODOLOGY
Delimitation of
comfort zone
Step one
Bioclimatic
diagnosis
Step two
Definition of
strategies
Step three
Energy
simulation
Cooling and
heating degree
hours
Incident radiation
Scenario A
Overhangs (Walls)
Scenario BOverhangs+louvers
(windows)
Scenario C
Green roof (roof)
External heat
loads
EnergyPlus /
DesignBuilder
Cooling demand
Step four
Environmental
assessment
Global Warming
Potential
Scenario D
Above roof shade
(jute fabrics)
LCA
Simapro
Ecotect
Weather tool
Tools / Software
Cumulative
Energy Demand

69
STRATEGIES TO REDUCE ENERGY AND GHG EMISSIONS IN BUILDINGS IN MEXICO: A CASE OF SOCIAL HOUSING PART 2
4.4.2 Step two: definition and selection of strategies
After the cooling or heating needs of the study house were assessed using the bio-
climatic analysis and solar incidence, the strategies for this study were defined.
Strategies were proposed under the premise of being suitable for introduction in to
social housing unit, without affecting the housing habitability during implementation.
Solar protection strategies using locally available materials were considered for the
walls, roof and windows (Figure 4.4).
Figure 4.4 Graphic representation of the study scenarios
The strategies that were applied to each of the studied scenarios are presented in detail
in the following section.
Scenario A: Overhangs on walls
For this scenario, overhangs on the eastern (E2) and western (W2) walls with a thickness
of 0.10 m, at a height of 2.5 0 m were used. The eastern and western facades were the
ones that received more solar radiation during the day, and therefore were chosen for
this scenario.
The design variable was the projection length of the overhang, which was 0.30, 0.50 and
0.70 m in scenarios A1, A2 and A3, respectively. Panel W is the system proposed by this
scenario. It is a building system based on the tridimensional structure of steel wire with
polystyrene, where the structure is covered with concrete. The area of Panel W
Scenario A
Louvers
OverhangsOverhangEast
Scenario B
Scenario C Scenario D
Green roof Above roof shade
OverhangWest

70
PART 2 STRATEGIES TO REDUCE ENERGY AND GHG EMISSIONS IN BUILDINGS IN MEXICO: A CASE OF SOCIAL HOUSING
employed in scenarios A1, A2 and A3 were 4.15, 6.93 and 9.7 m2, respectively. The
volumes of concrete were 0.41, 0.69 and 0.96 m3.
Scenario B: overhangs and window louvers.
Overhangs formed an aluminium frame above the windows of all facades. The
overhangs were 0.50 m wide and extended to the same length from both sides. Four
aluminium slats with an inclination of 15o, a depth of 0.20 m and a placement of 0.30 m
from the window glass were used. In total, 88 kg of aluminium were needed cover the
seven windows of the house.
Scenario C: green roof
The scenario consisted of conventional and extensive green roof of 50 m2. The
treatment included water-proofing and anti-root protection, a geotextile layer, a
drainage layer, a filtering layer and a vegetation substrate totalling 0.20 m in height. The
lightweight substrate was composed of low cost mineral (perlite and vermiculite) and
organic material. The total volume of the substrate was 5m3.
Scenario D: Above roof shade
A shade made of jute fabric was proposed to be placed 0.35 m above the roof. This fibre
is obtained from the species Corchorus Capsularis, which is cultivated in warm-humid
climates. Therefore jute fibre can be easily obtained in the study region. In addition, the
processing and extraction of Corchorus Capsularis fibre are performed manually and
does not require the use of energy (Karmaker and Hinrichsen, 1991). The main variables
of this scenario are related to the extension of the shade: D1, perimetric shading; D2,
perimetric shading + 0.50 m of extension; and D3, rectangular shading (Figure 4.5).
Figure 4.5 Graphic representation of the variables in scenario D
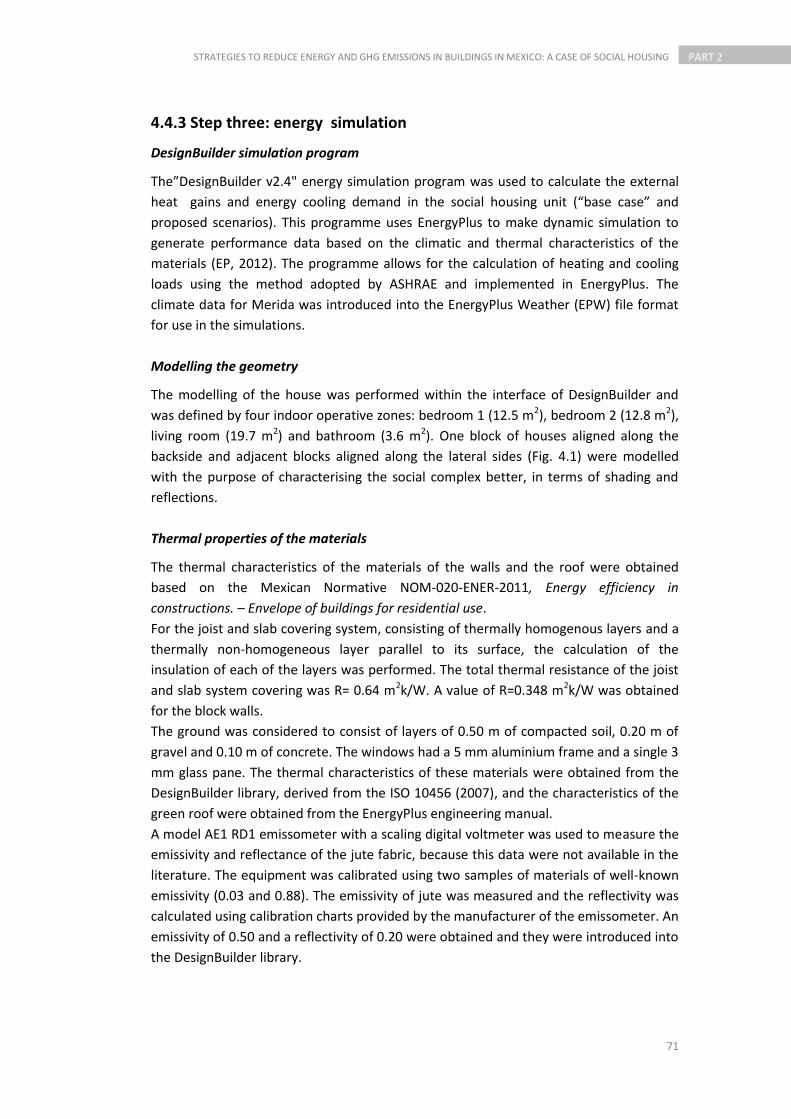
71
STRATEGIES TO REDUCE ENERGY AND GHG EMISSIONS IN BUILDINGS IN MEXICO: A CASE OF SOCIAL HOUSING PART 2
4.4.3 Step three: energy simulation
DesignBuilder simulation program
The”DesignBuilder v2.4" energy simulation program was used to calculate the external
heat gains and energy cooling demand in the social housing unit (“base case” and
proposed scenarios). This programme uses EnergyPlus to make dynamic simulation to
generate performance data based on the climatic and thermal characteristics of the
materials (EP, 2012). The programme allows for the calculation of heating and cooling
loads using the method adopted by ASHRAE and implemented in EnergyPlus. The
climate data for Merida was introduced into the EnergyPlus Weather (EPW) file format
for use in the simulations.
Modelling the geometry
The modelling of the house was performed within the interface of DesignBuilder and
was defined by four indoor operative zones: bedroom 1 (12.5 m2), bedroom 2 (12.8 m2),
living room (19.7 m2) and bathroom (3.6 m2). One block of houses aligned along the
backside and adjacent blocks aligned along the lateral sides (Fig. 4.1) were modelled
with the purpose of characterising the social complex better, in terms of shading and
reflections.
Thermal properties of the materials
The thermal characteristics of the materials of the walls and the roof were obtained
based on the Mexican Normative NOM-020-ENER-2011, Energy efficiency in
constructions. – Envelope of buildings for residential use.
For the joist and slab covering system, consisting of thermally homogenous layers and a
thermally non-homogeneous layer parallel to its surface, the calculation of the
insulation of each of the layers was performed. The total thermal resistance of the joist
and slab system covering was R= 0.64 m2k/W. A value of R=0.348 m2k/W was obtained
for the block walls.
The ground was considered to consist of layers of 0.50 m of compacted soil, 0.20 m of
gravel and 0.10 m of concrete. The windows had a 5 mm aluminium frame and a single 3
mm glass pane. The thermal characteristics of these materials were obtained from the
DesignBuilder library, derived from the ISO 10456 (2007), and the characteristics of the
green roof were obtained from the EnergyPlus engineering manual.
A model AE1 RD1 emissometer with a scaling digital voltmeter was used to measure the
emissivity and reflectance of the jute fabric, because this data were not available in the
literature. The equipment was calibrated using two samples of materials of well-known
emissivity (0.03 and 0.88). The emissivity of jute was measured and the reflectivity was
calculated using calibration charts provided by the manufacturer of the emissometer. An
emissivity of 0.50 and a reflectivity of 0.20 were obtained and they were introduced into
the DesignBuilder library.

72
PART 2 STRATEGIES TO REDUCE ENERGY AND GHG EMISSIONS IN BUILDINGS IN MEXICO: A CASE OF SOCIAL HOUSING
Internal heat gains
A house occupied by two adults and two children was studied. The bedrooms were
occupied from 16:00 to 7:00, and the living area was occupied during the day. The
metabolic rate consisting of the energy produce by the user when performing an activity
is mainly transformed into heat. This was determined according to ISO (2005), based on
the activity in each locale of the house and was represented in “met” units (bedrooms =
0.90, kitchen = 1.15 and living room = 1.2). An illumination of 4 W/m2 for all of the zones
was considered. For the electrical equipment, 4 W/m2 were considered in the bedrooms
and 16 W/m2 in living area.
Simulation parameters
The building thermal network was solved four times per hour during simulations. A
temperature of 26 ° C was used as the control temperature for the air conditioning
operation (ASHRAE, 2003). For the shading calculations, all of the adjacent buildings
were included and the reflections and obstructions were modelled.
4.4.4 Step four: environmental assessment
The environmental evaluation was performed according to the Life Cycle Analysis (LCA)
methodology according to the ISO 14040 (2006). The classification of the flows and the
characterisation of the environmental impacts followed the CML 2000 method (Guinée
et al. 2001). The impact categories considered in this study are embodied energy (MJeq)
according to the Cumulative Energy Demand (CED) method and, global warming
potential. This quantifies the emissions of Greenhouse Gases (GHG) and their associated
effects and is expressed in equivalent carbon dioxide emissions (CO2 eq.). The Life Cycle
Inventory (LCI) for panel W, aluminium, green roof and jute were extrapolated from
Ecoinvent (2012) and ITEC (2012) databases, due to the absence of a specific database
for Mexico. Whereas the data for concrete is specific for Mexico (Table 4.1). The lifetime
assumed for each scenario is also shown in Table 1 according to data in the bibliography.
However, to compare the scenarios directly, the results considered a lifetime of 30 years
for each scenario.

73
STRATEGIES TO REDUCE ENERGY AND GHG EMISSIONS IN BUILDINGS IN MEXICO: A CASE OF SOCIAL HOUSING PART 2
Table 4.1 Description, inventory of materials, specific weight, assumed lifetime (years) and main
sources for each scenario
Scenario Description Materials
Specific
weight
Assumed
Lifetime
[years]
Main data
sources
A Overhangs
with panel W
Gravel 1890 kg/m3 30
Portland cement 300 kg/m
3
Tap water 186 kg/m3
Panel W
(Polystyrene +
steel)
1.6 kg/m2
B
Overhang +
sidefins with
aluminium
Aluminium
primary 6 kg/m
2 15
C Green roof
Additive 0.25 kg/m2 30
Fibreglass 0.066 kg/m2
Polyester 0.51 kg/m2
Polyethylene 1.37 kg/m2
Bitumen 7.57 kg/m2
Organic material 11.11 kg/m
2
Perlite 115 kg/m3
Vermiculite 90 kg/m3
Water 23.12 kg/m2
D Above roof Jute fabric shade 0.36 kg/m
2 10
The balance of the global warming potential of the materials and the potential savings
associated with the cooling systems were obtained in order to evaluate the
environmental impact of each scenario. The global warming potential associated with
the materials was obtained for each of the defined scenarios. In addition the CO2
emissions associated with cooling energy savings in each scenario has been calculated.
4.5 Results
4.5.1 Bioclimatic factors
Figure 4.6 shows the hourly temperature and humidity values for the entire year,
represented in a psychrometric chart generated using the Weather Tool. The analysis of
thermal comfort area indicates that 90% of the days of the year fall outside of the
thermal comfort zone. The psychrometric chart for Merida shows greater requirements
for cooling than heating (54,573 cooling degree hours versus 614 heating degree hours).
(Ecoinvent,
2011;
Oliver-Solá
et al. 2009)
(Ecoinvent, 2011;
ITEC, 2011)
(ITEC, 2011;
Rivela et al.
2011)
(González, 2005)
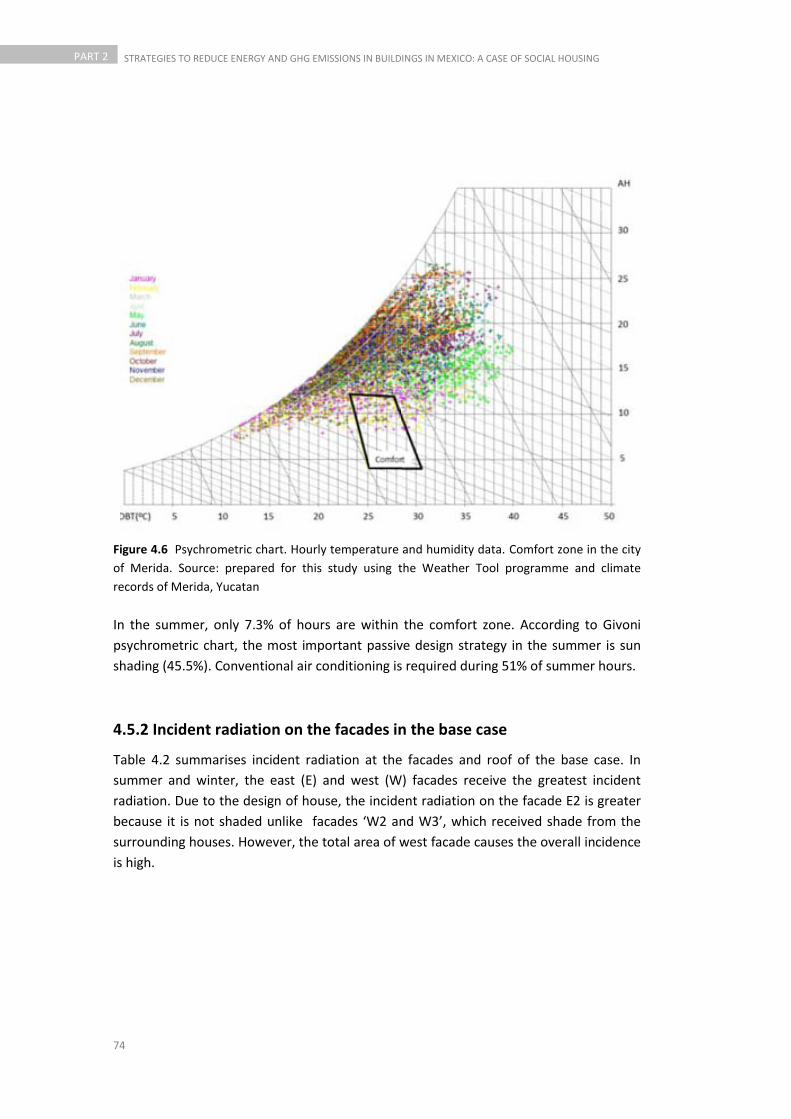
74
PART 2 STRATEGIES TO REDUCE ENERGY AND GHG EMISSIONS IN BUILDINGS IN MEXICO: A CASE OF SOCIAL HOUSING
Figure 4.6 Psychrometric chart. Hourly temperature and humidity data. Comfort zone in the city
of Merida. Source: prepared for this study using the Weather Tool programme and climate
records of Merida, Yucatan
In the summer, only 7.3% of hours are within the comfort zone. According to Givoni
psychrometric chart, the most important passive design strategy in the summer is sun
shading (45.5%). Conventional air conditioning is required during 51% of summer hours.
4.5.2 Incident radiation on the facades in the base case
Table 4.2 summarises incident radiation at the facades and roof of the base case. In
summer and winter, the east (E) and west (W) facades receive the greatest incident
radiation. Due to the design of house, the incident radiation on the facade E2 is greater
because it is not shaded unlike facades ‘W2 and W3’, which received shade from the
surrounding houses. However, the total area of west facade causes the overall incidence
is high.
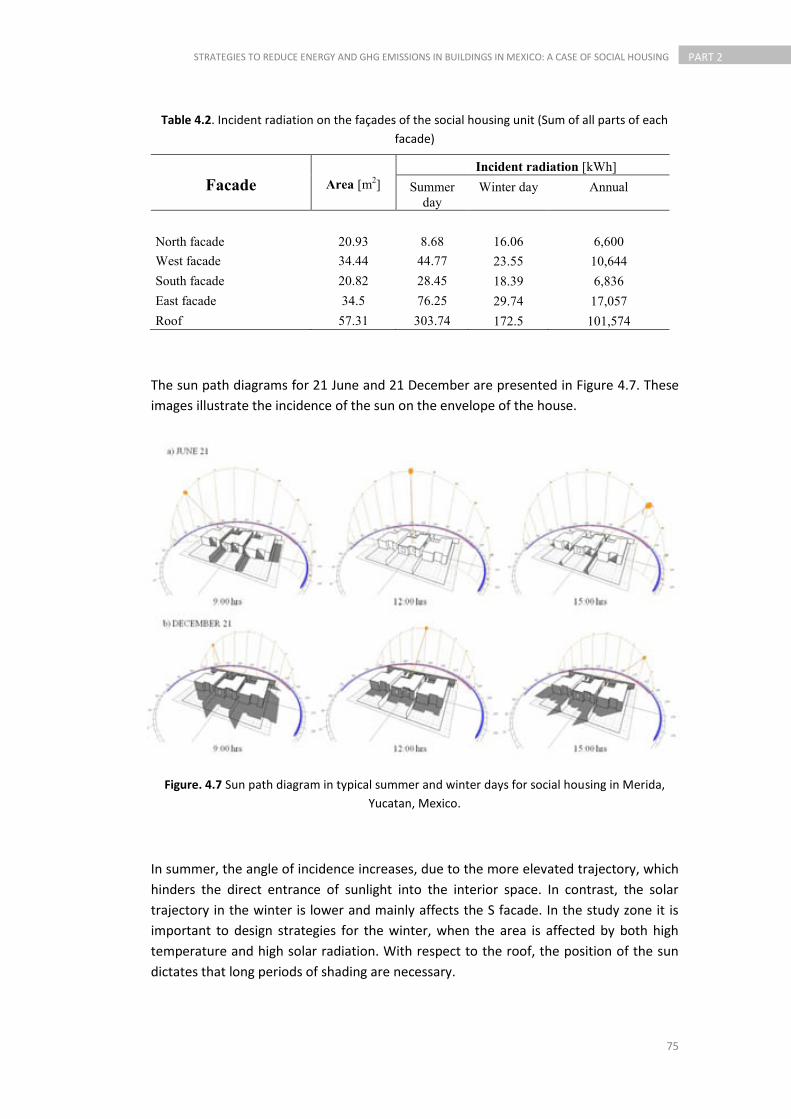
75
STRATEGIES TO REDUCE ENERGY AND GHG EMISSIONS IN BUILDINGS IN MEXICO: A CASE OF SOCIAL HOUSING PART 2
Table 4.2. Incident radiation on the façades of the social housing unit (Sum of all parts of each
facade)
Facade Area [m2]Incident radiation [kWh]
Summer day
Winter day Annual
North facade 20.93 8.68 16.06 6,600West facade 34.44 44.77 23.55 10,644South facade 20.82 28.45 18.39 6,836East facade 34.5 76.25 29.74 17,057Roof 57.31 303.74 172.5 101,574
The sun path diagrams for 21 June and 21 December are presented in Figure 4.7. These
images illustrate the incidence of the sun on the envelope of the house.
Figure. 4.7 Sun path diagram in typical summer and winter days for social housing in Merida,
Yucatan, Mexico.
In summer, the angle of incidence increases, due to the more elevated trajectory, which
hinders the direct entrance of sunlight into the interior space. In contrast, the solar
trajectory in the winter is lower and mainly affects the S facade. In the study zone it is
important to design strategies for the winter, when the area is affected by both high
temperature and high solar radiation. With respect to the roof, the position of the sun
dictates that long periods of shading are necessary.
76
PART 2 STRATEGIES TO REDUCE ENERGY AND GHG EMISSIONS IN BUILDINGS IN MEXICO: A CASE OF SOCIAL HOUSING
4.5.3 External heat loads in the base case
Table 4.3 shows the heat transferred to the house from the walls, roof and windows for
the base case on an annual basis and for typical summer and winter days.
Table 4.3 Heat transferred to the building from the envelope (walls, roof and windows)
Component Summer day Winter day Annual
Wall
17.45
-3.27
1,539
Roof 14.78 2.37 2,974
Windows 9.26 11.25 3,428
Figure 4.8 shows heat transfer into the house during an entire year.
Figure 4.8 Heat transferred to the building from the walls, roof and windows during a full year in
the base case
The windows show a similar behaviour throughout the year and are the main annual
heat contributors. However, we can consider windows to be modifiable elements,
according to the habits of the users because they can be opened or closed at will. The
roof and the walls had a higher heat transfer from April to September. The roof was the
main component of the heat transfer from the outside environment to the inner house
air during the hottest months. The roof contributed 2974 kWh per year. A negative value
indicates that this component acted as a sink of energy from the air, this was also the
case for the walls during the winter period (Table 4.3 and Figure 4.8).
The exterior walls were the main source of heat input into the house on a typical
summer day; they contributed a total of 17.45 kWh. The highest values occurred
between 17:00 and 6:00, mainly due to the thermal inertia of the walls, which were
-100.00
0.00
100.00
200.00
300.00
400.00
500.00
J F M A M J J A S O N D
kWh
Months
Wall Roof Windows
[kWh]

77
STRATEGIES TO REDUCE ENERGY AND GHG EMISSIONS IN BUILDINGS IN MEXICO: A CASE OF SOCIAL HOUSING PART 2
heated during the sunny hours. The windows transferred a total of 9.26 kWh; the
highest values occurred at 14:00 and 17:00, primarily due to the angle of the sun and
the direct impact on the windows. In the case of the roof, the heat transfer was 14.78
kWh, and the highest values occurred from 16:00 and 19:00.
It is important to mention that although the roof received the most incident solar
radiation annually, in a typical summer´s day the results yielded a greater heat
contribution from the walls. This observation is attributable to the walls’ smaller
resistance (R= 0.348 m2k/W) to heat transfer relative to the roof (R= 0.64 m2k/W).
On a typical winter´s day, the walls did not transfer heat into the house, and the
windows were the principal contributor of heat. The contribution from the windows was
mainly associated with the sun trajectory, which was lower relative to the summer
position and allowed for a greater incidence on the windows.
4.5.4 Energy demand of cooling
Table 4.4 summarises the annual energy cooling demand for social housing for the base
case, as well as the scenarios studied. The energy associated with the production of the
materials and the amortisation time in terms of energy are also included in Table 4.4.
Table 4.4 Energy requirements for cooling demand
The energy requirement for cooling in the base case was 9,640 kWh/year. Scenarios A1
and A2 corresponded to a 4% reduction in the annual energy cooling demand relative to
the base case, whereas scenario A3 corresponded to a reduction of 5%. It is apparent
that the effect of an ‘overhang’ is limited and that the various studied projection lengths
do not yield a significant improvement. The solar protection of the windows (scenario B)
reduced the total annual cooling load by 11%. This scenario has the greatest built-in
energy demand due to the materials, i.e., the production of aluminium. Thus, the
amortisation time of scenario B is 4.5 years. If we consider a lifetime of 30 years for all
Scenario Variable
Energy balance Materials
Energy
payback
Cooling
demand
Scenario
savings
Energy
embodied
[kWh/year] [kWh/year] [kWh] [years]
Base case
9,640 0 - -
A
A1 9,281 359 276 0.77
A2 9,230 410 450 1.10
A3 9,141 499 726 1.45
B 8,586 1,054 4,742 4.5
C 8,409 1,231 8,018 6.5
D
D1 9,150 490 1,212 2.47
D2 8,600 1,040 1,536 1.47
D3 7,040 2,600 1,500 0.57

78
PART 2 STRATEGIES TO REDUCE ENERGY AND GHG EMISSIONS IN BUILDINGS IN MEXICO: A CASE OF SOCIAL HOUSING
scenarios, the amortisation time of scenario B is not significantly different. For scenario
C, the results indicate a saving of 13%, solely due the insulating effect of the roof. The
total energy incorporated in the materials of the green roof is greater than that of
aluminium in scenario B and the amortisation time is 6.5 years. Scenario D3 resulted in a
lower energy cooling demand of 7,039 kWh/year, which represents a 27% reduction
relative to the base case. Scenarios D2 and D1 yielded reductions of 11% and 5%,
respectively. Other simulation results of scenario D, which are not included in this
article, showed small differences between shading at heights of 0.30 m and 1.80 m.
Therefore, the decreased energy cooling demand was due to the reduction of the solar
incidence by shade, rather than a convective effect of the movement of air at the roof of
the house. Although the above roof shade proposed in scenario D is made of a natural
fibre and its production does not require large amounts of energy, the results of this
scenario show that a greater amount of energy is incorporated into the materials
relative to scenario A (Panel W). These results are most likely attributed to the relatively
short lifetime of jute (10 years) compared to concrete (30 years). However, due to the
significant savings in the energy cooling demand of scenario D3, the amortisation time
was the lowest of all the scenarios.
Figure 4.9 shows how the monthly results of each strategy compared to the base case.
For scenarios A and D, only the variables with the greatest savings were compared (i.e.,
scenarios A3 and D3). A similar behaviour is observed in the energy cooling requirements
throughout the year for all scenarios, which presented greater requirements during
March to October. The highest values were observed in May.
Figure 4.9 Energy requirements for cooling demand during the year
Due to the fact that energy requirements for cooling are mainly attributed to the heat
contributions of the house envelope (e.g., roof, walls and windows), this analysis has
been included in order to understand the behaviour of the cooling demands.
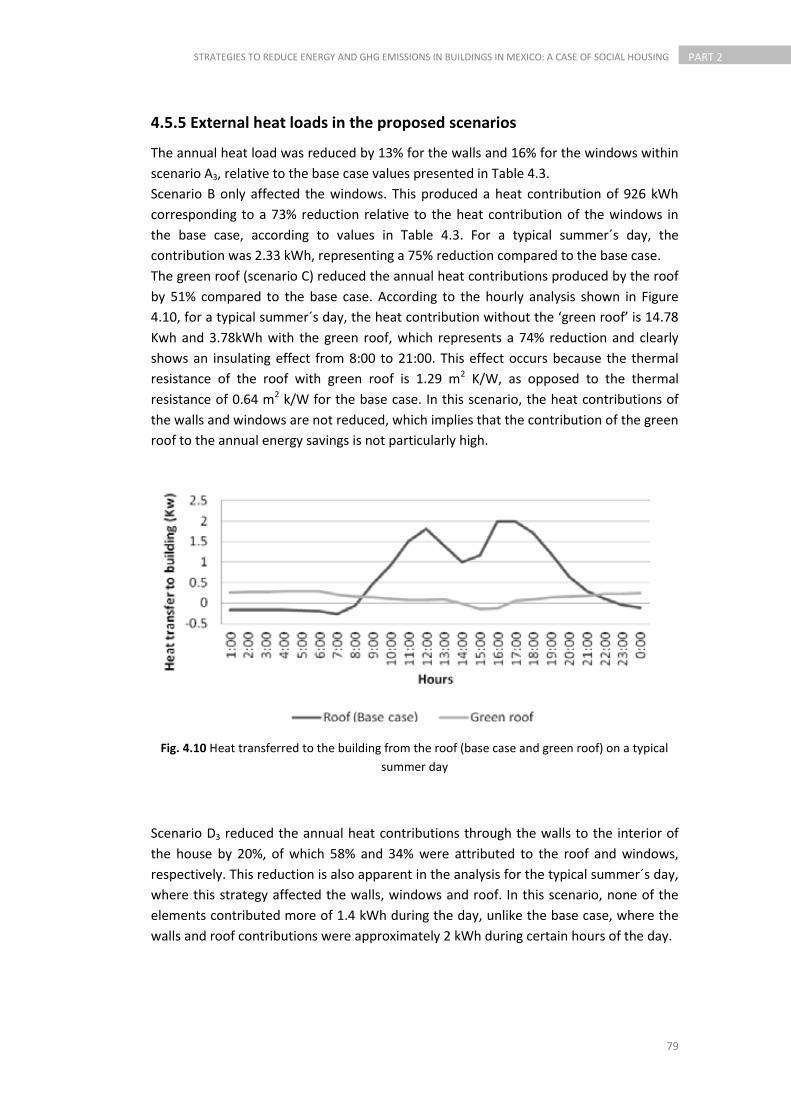
79
STRATEGIES TO REDUCE ENERGY AND GHG EMISSIONS IN BUILDINGS IN MEXICO: A CASE OF SOCIAL HOUSING PART 2
4.5.5 External heat loads in the proposed scenarios
The annual heat load was reduced by 13% for the walls and 16% for the windows within
scenario A3, relative to the base case values presented in Table 4.3.
Scenario B only affected the windows. This produced a heat contribution of 926 kWh
corresponding to a 73% reduction relative to the heat contribution of the windows in
the base case, according to values in Table 4.3. For a typical summer´s day, the
contribution was 2.33 kWh, representing a 75% reduction compared to the base case.
The green roof (scenario C) reduced the annual heat contributions produced by the roof
by 51% compared to the base case. According to the hourly analysis shown in Figure
4.10, for a typical summer´s day, the heat contribution without the ‘green roof’ is 14.78
Kwh and 3.78kWh with the green roof, which represents a 74% reduction and clearly
shows an insulating effect from 8:00 to 21:00. This effect occurs because the thermal
resistance of the roof with green roof is 1.29 m2 K/W, as opposed to the thermal
resistance of 0.64 m2 k/W for the base case. In this scenario, the heat contributions of
the walls and windows are not reduced, which implies that the contribution of the green
roof to the annual energy savings is not particularly high.
Fig. 4.10 Heat transferred to the building from the roof (base case and green roof) on a typical
summer day
Scenario D3 reduced the annual heat contributions through the walls to the interior of
the house by 20%, of which 58% and 34% were attributed to the roof and windows,
respectively. This reduction is also apparent in the analysis for the typical summer´s day,
where this strategy affected the walls, windows and roof. In this scenario, none of the
elements contributed more of 1.4 kWh during the day, unlike the base case, where the
walls and roof contributions were approximately 2 kWh during certain hours of the day.
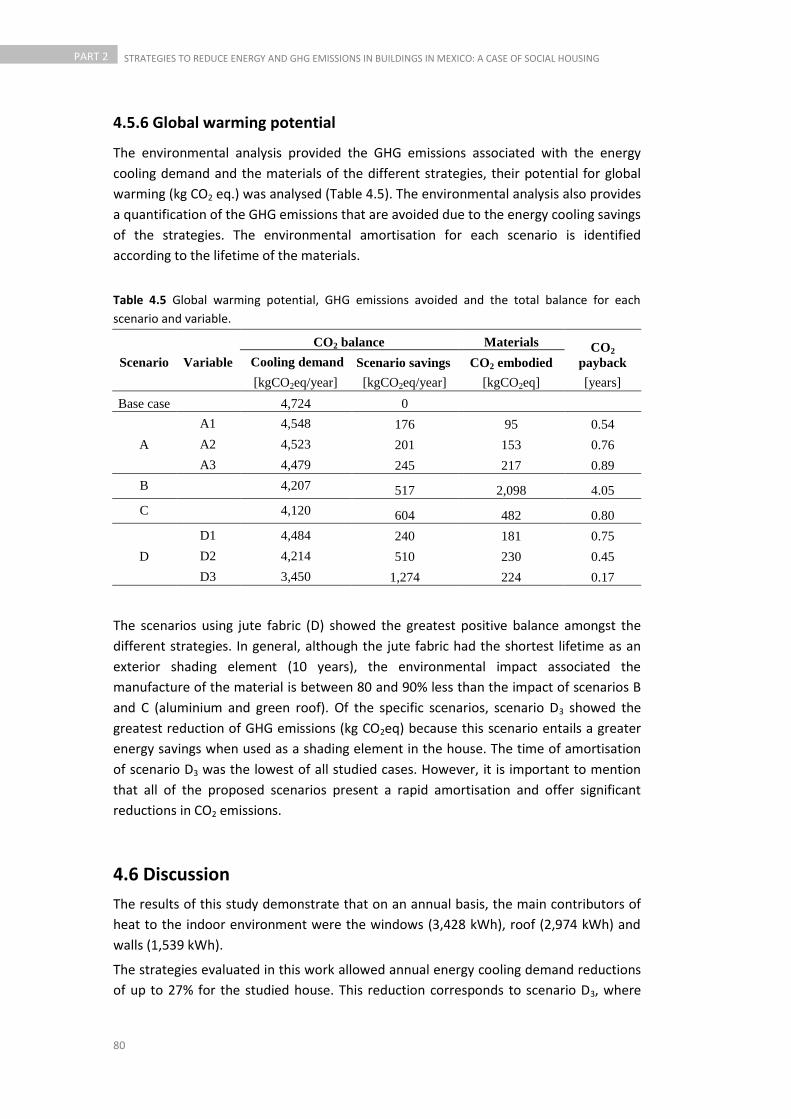
80
PART 2 STRATEGIES TO REDUCE ENERGY AND GHG EMISSIONS IN BUILDINGS IN MEXICO: A CASE OF SOCIAL HOUSING
4.5.6 Global warming potential
The environmental analysis provided the GHG emissions associated with the energy
cooling demand and the materials of the different strategies, their potential for global
warming (kg CO2 eq.) was analysed (Table 4.5). The environmental analysis also provides
a quantification of the GHG emissions that are avoided due to the energy cooling savings
of the strategies. The environmental amortisation for each scenario is identified
according to the lifetime of the materials.
Table 4.5 Global warming potential, GHG emissions avoided and the total balance for each
scenario and variable.
Scenario Variable
CO2 balance Materials CO2
payback Cooling demand Scenario savings CO2 embodied
[kgCO2eq/year] [kgCO2eq/year] [kgCO2eq] [years]
Base case
4,724 0
A
A1 4,548 176 95 0.54
A2 4,523 201 153 0.76
A3 4,479 245 217 0.89
B 4,207 517 2,098 4.05
C 4,120 604 482 0.80
D
D1 4,484 240 181 0.75
D2 4,214 510 230 0.45
D3 3,450 1,274 224 0.17
The scenarios using jute fabric (D) showed the greatest positive balance amongst the
different strategies. In general, although the jute fabric had the shortest lifetime as an
exterior shading element (10 years), the environmental impact associated the
manufacture of the material is between 80 and 90% less than the impact of scenarios B
and C (aluminium and green roof). Of the specific scenarios, scenario D3 showed the
greatest reduction of GHG emissions (kg CO2eq) because this scenario entails a greater
energy savings when used as a shading element in the house. The time of amortisation
of scenario D3 was the lowest of all studied cases. However, it is important to mention
that all of the proposed scenarios present a rapid amortisation and offer significant
reductions in CO2 emissions.
4.6 Discussion
The results of this study demonstrate that on an annual basis, the main contributors of
heat to the indoor environment were the windows (3,428 kWh), roof (2,974 kWh) and
walls (1,539 kWh).
The strategies evaluated in this work allowed annual energy cooling demand reductions
of up to 27% for the studied house. This reduction corresponds to scenario D3, where

81
STRATEGIES TO REDUCE ENERGY AND GHG EMISSIONS IN BUILDINGS IN MEXICO: A CASE OF SOCIAL HOUSING PART 2
the roof shade made of jute is proposed to provide solar protection to the walls and
windows of the posterior facade (south and east orientation); this shade not only
reduces the heat gain of the roof but also that of the walls and windows.
Scenario C, corresponding to the green roof, reduced the annual energy demand of
cooling by 13%. This strategy directly affected the roof by reducing its heat contribution
to the interior by 74%, which indicates that green roof functions as a suitable insulator
and increases the resistance (R value) of the roof from 0.64 m2-K/W to 1.29 m2-K/W. It is
noteworthy that this strategy has other benefits, such as restoration of the habitat and
CO2 fixation. According to a recent study, CO2 fixation of 69 kgCO2/year take place in a
social housing unit with a green roof (Cerón-Palma et al. 2012). Also, it is important to
mention that the green roof would present the greatest complexity to build, as well as
the highest installation and maintenance costs relative to the other studied scenarios.
Nevertheless, it is recommended that laboratory studies using vegetation of the region
and lightweight substrates take place in order to determine the most appropriate
installation strategy.
Overhangs and window louvers (scenario B) resulted in an 11% reduction in the energy
cooling demand in relation to the base case.
Regarding scenario A, a maximum energy reduction of 5% was obtained using overhangs
of 0.70 m long (A3). This result indicates that further study is necessary to determine
other low-cost strategies to reduce the heat contribution from the outer walls of the
house, such as vegetation screens. A 32% reduction in the energy demand for cooling is
expected, if scenarios B (which affects the heat contributed by the windows of the
house) and D3 (which affects the roof and walls of the posterior façade) are combined.
With respect to the emissions of CO2eq from the materials proposed in each scenario,
the results demonstrate that the annual savings associated with any of the scenarios are
greater than the impacts caused by their manufacture, due to an amortisation time of
greater than four years. In the proposed shading strategy using jute fabric (scenario D3),
the amortisation of energy and CO2 emissions occur in less than a year.
Future investigations will consider the integration of eco-designs as a tool for the
proposal and evaluation of new shading elements and insulating materials.
4.7 Conclusions
There is a significant potential for the eco-rehabilitation of the social housing sector in
Mexico. This study identified strategies such as: wall overhangs, green roof, jute fabric
roof shade and window louvers, which reduce the energy cooling demand in a social
housing unit in a warm-humid climate by up to 1,274 kWh per year. The LCA was
demonstrated to be an important factor in proposing materials by considering CO2
emissions caused by their production, as well as the time of energetic amortisation. The
integration of the strategies presented in this study could be an economic driver for the
transformation of existing social housing, as well as the integration of environmental
criteria in evaluation and decision making. Similarly, the results of this study can
contribute to improvements in the competitiveness of developing new housing, when

82
PART 2 STRATEGIES TO REDUCE ENERGY AND GHG EMISSIONS IN BUILDINGS IN MEXICO: A CASE OF SOCIAL HOUSING
these strategies and methodologies are integrated from the design stage. We expect
that the methodology of this work will allow other investigators and designers to apply
similar studies to other climatic regions. This well contribute to the spread of bio-
climatic analysis, the use of passive strategies and a reduction in energy consumption
and CO2 emissions for a sustainable rehabilitation of the social housing sector.
83
STRATEGIES TO REDUCE ENERGY AND GHG EMISSIONS IN BUILDINGS IN MEXICO: A CASE OF SOCIAL HOUSING PART 2
References for Chapter 4
ASHRAE (2003). American society of heating, refrigerating and air-conditioning engineers. Standard 55, Thermal Environmental Conditions for Human Occupancy, Atlanta.
Autodesk, Inc (2012). Weather tool software v2011. <http://usa.autodesk.com/> Accessed 09.01.12.
Cerón-Palma, I (2008). Evaluación de Factores de Confort y contaminación ambiental en la vivienda económica de clima cálido-húmedo, Máster disertación, 2008, Facultad de Ingeniería. Universidad Autónoma de Yucatán.
Ceron-Palma, I., Oliver-Solà, J., Sanyé-Mengual, E., Montero, JI., Rieradevall, J (2013). Towards a green sustainable strategy for social neighbourhood in Latin America: Case from social housing in Merida, Yucatan, Mexico. Habitat International, 38: 47-56
Ceron-Palma, I., Sanye-Mengual, E., Oliver-Sola, J., Rieradevall,, J., Montero, J (2011). Strategies for reducing the carbon footprint in a social housing district in Merida, Yucatan, Mexico, In proceeding of International Life Cycle Assessment Conference in Latin-America. Coatzacoalcos, Veracruz, Mexico.
Cerón-Palma I., López, M., Ponce, C., Giacoman, G., Pérez, M (2008). Evaluación de la calidad ambiental en la vivienda económica en Mérida, Yucatán, Congreso Interamericano de Ingeniería Sanitaria y Ambiental AIDIS, Santiago de Chile.
Cerón-Palma, I., Contreras-Carrillo, J., Aguilar, A., Novelo, R (2010). Implementation of a low cost green roof in a social housing in Merida, Yucatan, Mexico. 5th World Environmental Education Congress, Montreal, Canada.
CONAE (2011). Norma Oficial Mexicana NOM-020-ENER-2011, Eficiencia energética en edificaciones, Envolvente de edificios para uso habitacional.
CONAVI (2006). La energía en la vivienda. Uso eficiente de la energía en la vivienda, México, D.F, 2006. <http://www.conavi.gob.mx/documentos/publicaciones/guia_energia.pdf>. Accessed 28.04.11.
DB (2012). DesignBuilder software <http://www.designbuilder.co.uk/> Accessed 9.01.2012
Dahlan, N., Jones, P., Alexander D., Salleh, E., Alias, J (2010). Daylight ratio, luminance, and visual comfort assessments in typical Malaysian hostels, Indoor and Built Environment, 45: 2505-2516.
EP (2012) EnergyPlus, Energy simulation software. <http://apps1.eere.energy.gov/buildings/energyplus/> Accessed 11.01.12
Guinee, J., Gorrée, M., Heijungs, R., Huppes, G., Kleijn, R., de Koning, A., van Oers, L., Wegener Sleeswijk, A., Suh, S., Udo de Haes, H.A., de Bruijn, H., van Duin, R., Huijbregts, M.A.J. (2001). Life cycle assessment—an operational guide to the ISO standards, Centre of Environmental Sciences (CML), Leiden University
INEGI (2006). Conteos de Población y vivienda, 1995 y 2005. México, DF.
84
PART 2 STRATEGIES TO REDUCE ENERGY AND GHG EMISSIONS IN BUILDINGS IN MEXICO: A CASE OF SOCIAL HOUSING
Givoni, B (1998). Climate considerations in building and urban design, John Wiley&Son, USA.
González, R (2005). Vida útil ponderada de edificaciones, tesis profesional, Facultad de Ingeniería, Benemérita Universidad Autónoma de Puebla de México.
INFONAVIT (2011). Estudio de optimización de la eficiencia energética en viviendas de interés social < http://portal.infonavit.org.mx > Accessed 02.03.12
ISO (2007). International Standard ISO10456: Building materials and products, Procedures for determining declared and design thermal values
ISO (2005). International Standard ISO7730: Ergonomics of the thermal environment - Analytical determination and interpretation of thermal confort.
ISO (2006). International Standard ISO14040: Life cycle assessment—principles and framework. Geneva, Switzerland.
ITEC (2012). Instituto de Tecnología de la Construcción de Cataluña, Base de datos de materiales <http://www.itec.cat/nouBedec.e/presentaciobedec.aspx> Accesed 09.04.12
Meteonorm (2012) Meteonorm software v.06 <http://www.meteonorm.com> Accessed 09.01.12
NAHB (2007). National Association House of Building, Study of life expectancy of home components, Bank of America Home Equity, USA.
Karmaker, A., Hinrichsen, G (1991). Processing and Characterization of Jute Fiber Reinforced Thermoplastic Polymers, Polymer-Plastics, Technology and Engineering, 30(5): 609-629
OECD (2007). OECD Territorial Reviews: Yucatan, Mexico. Organisation for Economic Co-operation and Development. OECD, France.
Oliver-Solà, J., Josa, A., Gabarrell, X., Rieradevall, J (2009). Environmental optimization of concrete sidewalks in urban areas. The International Journal of Life Cycle Assessment, 14: 302-312.
ONNCE (2009). Norma Mexicana, NMX-C-460-ONNCCE-2009, Industria de la construcción - aislamiento térmico – valor “r” para las envolventes de vivienda por zona térmica para la república mexicana – especificaciones y verificación”
Tzikopoulos, A., Karantza M., and. Paravantis J (2005). Modeling energy efficiency of bioclimatic buildings, Energy and Building, 37: 529-544
UNEP (2011). Nuevo Movimiento para Desarrollar Estándares globales para Medir el Consumo de Energía en Edificaciones, 2011. <http://www.unep.org/Documents.Multilingual/Default.asp?DocumentID=2649&ArticleID=8823&l=es> Accessed 26.01.12
Radovic, D (1996). Bioclimatic design as the core of environment programmes, Energy and Building, 23:271-275Rivela, B., Cuerda, I., Bedoya, C., Neyla, J (2011) Green or ecological roofs, Towards Life Cycle Sustainability Management, LCM 2011 Conference, Berlin, Germany

85
STRATEGIES TO REDUCE ENERGY AND GHG EMISSIONS IN BUILDINGS IN MEXICO: A CASE OF SOCIAL HOUSING PART 2
Rosas, J., Sheinbaum, C., Morillon, D (2010). The structure of household energy consumption and related CO2 emissions by income group in Mexico, Energy for Sustainable Development, 14:127–133
Sheinbaum, C., Ruíz, B., Ozawa, L (2011). Energy consumption and related CO2 emissions in five Latin American countries: Changes from 1990 to 2006 and perspectives. Energy, 36(6): 3629-3638
Vale, B., Vale, R (1993). Green Architecture. Design for a sustainable future. Thames and Houdson, Ltd, London.

86
PART 2 STRATEGIES TO REDUCE ENERGY AND GHG EMISSIONS IN BUILDINGS IN MEXICO: A CASE OF SOCIAL HOUSING

87
ECO-INNOVATION TO IMPROVE SYNERGY FLOWS IN BUILDINGS IN SPAIN: THE CASE OF ROOFTOP ECO-GREENHOUSE
PART 3
PAR
T
3 Eco-innovation to improve synergy flows in
buildings in Spain. The case of Rooftop Eco-greenhouse
88
PART 3 ECO-INNOVATION TO IMPROVE SYNERGY FLOWS IN BUILDINGS IN SPAIN: THE CASE OF ROOFTOP ECO-GREENHOUSE
As previously stated, buildings have been detected as a priority area for reduction of the
total energy consumption within the European Union. Eco-innovation is an alternative
strategy that can contribute to improving resource efficiency in the building sector.
Part III of this dissertation focuses on an eco-innovation project in a European context:
The integration of food production in buildings through the synergy concept called
‘Rooftop Eco-Greenhouse’(RTEG). It is composed of two chapters
Chapter 5: Barriers and opportunities regarding the implementation of Rooftop Eco-
Greenhouses (RTEG) in Mediterranean cities of Europe.
Chapter 6: Energy and environmental analysis of heat flows in Rooftop Eco-
Greenhouses: A case study in the Mediterranean City of Barcelona.

89
ECO-INNOVATION TO IMPROVE SYNERGY FLOWS IN BUILDINGS IN SPAIN: THE CASE OF ROOFTOP ECO-GREENHOUSE
PART 3
Barriers and opportunities regarding the
implementation of Rooftop Eco-Greenhouses (RTEG)
in mediterranean cities of Europe.
Chapter 5
90
PART 3 ECO-INNOVATION TO IMPROVE SYNERGY FLOWS IN BUILDINGS IN SPAIN: THE CASE OF ROOFTOP ECO-GREENHOUSE
This chaptes is based in the following paper:
Ceron-Palma I, Oliver-Solà J, Sanyé-Mengual E, Montero JI, Rieradevall J (2012)
Barriers and opportunities regarding the implementation of Rooftop Eco-Greenhouses
(RTEG) in Mediterranean cities of Europe. Journal of Urban Technology, in press
( DOI:10.1080/10630732.20).
Abstract
Today 50% of the population live in cities. This entails an excessive exploitation of
natural resources, an increase in pollution and an increase in the demand for food. One
way of reducing the ecological footprint of cities is to introduce agricultural activities to
them. In the current food and agriculture model the fragmentation of the city and the
countryside means energy use, CO2 emissions from transport and large scale marketing
requirements.
Roof Top Eco.Greenhouses (RTEG) consist in a greenhouse interconnected to building in
terms of energy, water and CO2 flows; is a new model for a sustainable production an
eco-innovative concept for producing high quality vegetables and improving the
sustainability of buildings in cities. The main objective of this study is to examine the
barriers and opportunities regarding the implementation of RTEG in Mediterranean
cities in Europe. The work method consisted of discussion seminars involving an
interdisciplinary group of experts in the area of agronomy, architecture, engineering,
environmental sciences, industrial ecology and other related disciplines. The barriers
and opportunities of RTG take into account social, economic, environmental and
technological aspects and were determined and analysed according to three scenarios
of implementation: residential buildings, educational or cultural buildings and industrial
buildings
We would highlight the interconnection of the building and the greenhouse as an
opportunity of RTEG, making use of water, energy and CO2 flows between both, as well
as the decrease in food transportation requirements. The methodology applied to the
study was positive due to the interdisciplinary participation of experts which facilitated a
global vision of the implementation of the project.
Keywords: Greenhouses, food self-sufficiency, eco-cities, urban agriculture

91
ECO-INNOVATION TO IMPROVE SYNERGY FLOWS IN BUILDINGS IN SPAIN: THE CASE OF ROOFTOP ECO-GREENHOUSE
PART 3
5.1 Introduction In recent years, cities have increased pressure on local and global natural ecosystems, a
result of an increase in the urban population, the expansion of urban land, the
exploitation of natural resources, the increase in the demand for food, water, and
energy flows, as well as an increase in the pollution of the atmosphere and water (Lee,
2008).
The world’s cities are directly or indirectly responsible for 75 percent of global energy
consumption and 80 percent of greenhouse gas (GHG) emissions (Ash et al., 2008). The
urban population is projected to be roughly 60 percent of the total world population by
2030 (United Nations, 2008), while global primary energy demand and related GHG
emissions are predicted to increase 40 percent relative to the 2007 reference values
(IEA, 2009). With these data, the incorporation of sustainability criteria in this process of
urban growth will be one of the main
challenges of the twenty-first century (Alberti, 2008).
The sustainable urban model for the future should facilitate the exchanges of flows
between cities, the natural environment, and urban subsystems from an industrial
ecology perspective. In order to improve urban systems, analysis and quantification data
are required of the inflows of energy, water, materials, natural resources, and the
outflows of emissions from the urban system (Saheley et al., 2003). The most common
city model has linear ingoing and outgoing
flows, characterized by imported resources and exporting emissions without closing
cycles (Wadel et al., 2010). Currently, the flow of food to cities follows a linear model,
causing a high consumption of energy resources and the generation of waste and CO2
emissions per food unit (kg) throughout its life cycle (EEA, 2010). At the same time, cities
use over two-thirds of the world’s energy production and account for more than 80
percent of global greenhouse gas (GHG) emissions (IEA, 2008). Figure 5.1 shows the
flows of resources and emissions as well as the fragmentation and disconnection of
cities from rural areas.
Figure 5.1 Lineal flow system in urban and agricultural systems.
92
PART 3 ECO-INNOVATION TO IMPROVE SYNERGY FLOWS IN BUILDINGS IN SPAIN: THE CASE OF ROOFTOP ECO-GREENHOUSE
The growth and concentration of the population in cities are associated with the
increase in commercialization on a global scale, the exploitation of new lands for
agricultural use, and as a result, the loss of biodiversity (Winston, 2010).
According to the Food and Agriculture Organization of the United Nations (FAO), over
the next 30 years, many of the environmental problems associated with agriculture will
remain serious, such as the loss of biodiversity caused by the expansion and
intensification of agriculture in developed countries (FAO, 2010).
5.2 Food production initiatives in cities.
Apart from agriculture in rural areas, there is an incipient development of agriculture in
urban and peri-urban areas that is incorporated into urban economic and ecological
urban systems (Viljoen et al., 2005). Community gardens, school gardens, urban farms,
among others, are some forms urban agriculture is taking (Grewal and Grewal, 2012).
Incorporating agriculture into urban lands and buildings can optimize urban space.
5.2.1 Initiatives to incorporate food into urban and peri-urban lands.
Initiatives to introduce agriculture into urban lands exist in countries around the world.
Cities in Latin American countries such as Brazil, Colombia, and Peru, have used urban
agriculture to alleviate urban poverty and improve food security at the local level
(Davila, 2006). In Vietnam, geographical research has been carried out about increasing
the surface area of urban agriculture in order to satisfy the population’s food needs
(Thapa and Murayama, 2008).
In Africa, various studies have demonstrated the need to increase the production of
vegetables
in the future because of urban growth, and the idea of incorporating urban agriculture
to be managed by communities themselves is being considered (Parrot et al., 2008).
In Europe, various projects in new neighborhoods and restoration projects in existing
neighborhoods have incorporated food production and flow synergy techniques, based
on the conviction that incorporating agriculture into urban spaces would provide the
area with fresh produce and promote sociability among the community of neighbors; an
example of this strategy is the community gardens in East London (Sustain, 2012).
Farreny et al. (2011) carried out an interdisciplinary study of concepts for a sustainable
district in Barcelona, Spain, and Jansma et al. (2010) did the same thing for the city of
Almere in The Netherlands. Catalonia in northeast Spain offers an example of land
protected from development by the creation of agricultural parks—some of which are
planned and others are already in operation. These include the Agricultural Park of
Llobregat, in operation since 1998, the Agricultural Park of Sabadell, and the Rural Space
of Gallecs, among others (Ruralcat, 2009).
93
ECO-INNOVATION TO IMPROVE SYNERGY FLOWS IN BUILDINGS IN SPAIN: THE CASE OF ROOFTOP ECO-GREENHOUSE
PART 3
5.2.2 Initiatives to incorporate food into buildings
Currently, actions to promote introducing food into buildings are being implemented by
different strategies. Rooftop farming is the practice of cultivating food on the rooftops
of buildings, and this is done in roof gardens (RG) and rooftop greenhouses (RTG).
The RG is sometimes confused with the term “green roof,” but a green roof requires a
complicated multi-layer structure to support it and usually covers a large area. RG is an
area that is generally used for the recreation of a building´s resident and is available for
local food production (Ong, 2003). Examples of buildings with a roof garden are Trent
University in Ontario, Canada; Chicago City Hall (Schwartz, 2009), and Changi General
Hospital in Singapore (Wilson, 2005).
RTGs have as their objective more intensive production than rooftop gardens (Puri and
Caplow, 2009). In New York, greenhouses were built in two educational centers—
Eleanor Roosevelt School and New York Harbor School—to provide students with
information and practical training about sustainability, the environment, food
production, and nutrition in cities (BFS, 2009). Similar efforts have been made in the
European Union (EU) to integrate greenhouses and buildings with the construction of
facade and/or rooftop greenhouses. For instance, the second prototype of the Watergy
project funded by the EU and consisted of the experimental assembly of a greenhouse
on the facade of a building constructed in Berlin, Germany with the aim of reducing
energy consumption in Northern European cities (Zaragoza et al., 2007).
Vertical Farming (VF) is other initiative and the concept refers to skyscrapers used to
produce food within the skyscrapers (Despommier, 2010). Despommier (2008) defined
the VF technique as a future model of agricultural production in cities using hydroponic
cultivation systems. One obstacle to the implementation of VF is the limited availability
of sunlight for vegetable production on multiple layers, besides the major investment
needed to construct and integrate technologies in the case of new buildings exclusively
designed for producing food.
There has been some research on how RG produces energy savings in buildings.
Ekaterini and Dimitris (1998) found that, from the total solar radiation on the
rooftopwith a garden, 27 percent was reflected, 60 percent was absorbed by plants and
soil, and 13 percent was transferred into the building. The effect of RG on reducing the
energy consumption of commercial buildings was measured to be up to 14.5 percent in
Singapore (Wong et al., 2003). In the case of VF, the projects are still at the design level
and currently no demonstrative prototype is available.
There are demonstrative and operational models for RTG, but there is no quantification
data regarding energy savings in the buildings where they are used.
5.2.3 Initiatives to develop greenhouse technology for cities
New technical developments in horticulture aim at achieving a zero-environmental-
impact greenhouse (Montero et al. 2008). This is particularly important in urban

94
PART 3 ECO-INNOVATION TO IMPROVE SYNERGY FLOWS IN BUILDINGS IN SPAIN: THE CASE OF ROOFTOP ECO-GREENHOUSE
environments, where emissions from greenhouse production must be strongly
minimized if food production is to be compatible with urban living.
The closed or semi-closed greenhouse concept is a less-input, low-emission greenhouse
production system that reduces energy for heating and recycles the drainage water from
irrigated crops (Montero et al., 2009) so it is a suitable concept for urban food
production.
Some closed greenhouse technologies have been implemented and researched in urban
greenhouses. For example, a solar desalination system by the Seawater greenhouse was
implemented in United Arab Emirates in 2000 (Seawater, 2000). This system is primarily
focused on water efficiency and proposes produced fresh water for irrigation by
evapo/condensation, using only seawater and sunlight (Davies and Paton, 2005). The
advantages of CO2 accumulation and non-chemical pest control could not be provided.
A new humid air solar collected is proposed in the Watergy project financed by the
European Union (Buchholz et al., 2004). The first experimental prototype of greenhouse
focuses mainly on reduced energy and water consumption in Southern European
greenhouses; it allows 85 percent recycling of irrigation water. (Buchholz et al., 2008).
The collector is formed by a greenhouse connected with a solar chimney, inside of which
a cooling duct contains an air-to-water heat exchanger connected to a heat accumulator
(Zaragoza et al., 2007). Economically the system was not viable because of the high costs
of heat exchangers. The GeslotenKas system, developed by Innogrow Company, is a
closed greenhouse system for increased horticultural production, using CO2
accumulation. It is designed to collect and store energy from the sun without releasing it
into the environment. The climate control system is mainly focused on primary energy
(heat pump) and this is a disadvantage because it uses fossil fuels (Opdam et al., 2005)
The first commercial-scale Innogrow system was built in Holland in 2004 on 5.4 ha. This
greenhouse, occupying 27 percent of the production area resulted in 36 percent energy
savings in the first year of operation (Timmenga, 2009).
In Sweden, the Plantagon company developed a vertical greenhouse, the Plantagon
Greenhouse. It is a spiral-shaped transport mechanism that moves soil-filled planting
boxes upward. With the boxes resting on a pair of rails that corkscrew through the
entire volume of the structure, a third rail carries a device that continuously cycles from
the top of the spiral to the bottom, nudging each box a few centimeters upward. When
they reach the top, the mature plants are pushed out onto the harvest platform, and
new boxes of soil and seed are pulled in at the bottom (Plantagon, 2011). This system
requires large economic investments in construction and technology.
A plant factory is another initiative in which all the environmental elements are
artificially controlled. There are three types of plant factories, one with complete
artificial lighting in a totally-enclosed environment, another with combined use of solar
and artificial lighting, and a third with solar lighting alone (Yano Research Institute,
2011). This initiative was designed to decrease costs and introduce special varieties of
plants. A Closed Transplant Production System (CTPS) at Chiba University is a materially-
closed system for producing a maximum number of high-quality transplants, with a
minimum use of resources and a minimum emission of environmental pollutants and

95
ECO-INNOVATION TO IMPROVE SYNERGY FLOWS IN BUILDINGS IN SPAIN: THE CASE OF ROOFTOP ECO-GREENHOUSE
PART 3
heat (Chun and Kozai, 2001). The CTPS is a warehouse-like structure covered with
opaque thermal insulators.
Further research in needed in this system to elaborate the utilization efficiencies of light
and water of the CTPS, in comparison with those in the greenhouse and the fields (Kozai,
2006).
5.3 Justification and objectives of the study
In Barcelona, a number of studies have identified a surface area of 95 ha of roofs on
private and public buildings in the city with the potential for green and farming use (BCN
Ecologia, 2010). If considering that in the city, buildings are one of the priority areas for
reducing energy consumption for the European Union, since 40 percent of the total
consumption corresponds to this sector (European Parliament and Council, 2010); then
establishing new synergies seems to be an advantageous way to make cities more
sustainable and self-sufficient.
RTG and VF are strategies that propose the integration of food production into
buildings; however, these strategies are in an emerging stage of research and
development. In Mediterranean cities in Europe there is another concept, “greenhouse-
buildings” that we have called Rooftop Eco-Greenhouses (RTEG).
RTEGs are greenhouses interconnected with buildings in terms of energy, residual heat,
water, and CO2. The aim of this study is to examine the barriers and social, economic,
environmental, and technological opportunities regarding the implementation of this
new interconnection concept called RTEG in Mediterranean cities in Europe.
5.4 Definition of the study system
5.4.1 Conceptualization
RTEG is presented as an eco-innovative system that incorporates agriculture into the
rooftops of buildings in the city from an industrial ecology perspective, as a new
approach to sustainable food production in urban settings. It is defined by three main
aspects: (1) the eco-innovation represented by the greenhouse-building incorporation as
a model for producing food and as a new option of occupying territory for agriculture,
using a rooftop; (2) the eco-design of the greenhouse with the criteria of low
environmental impact and energy efficiency; (3) the incorporation of the concept of
symbiosis and industrial ecology into the exploitation of flows. Figure 5.2 presents the
conceptualization of the project.
Future research will attempt to determine whether food produced in rooftop
greenhouses that share energy, water, and CO2 flows in a common metabolism with a
connecting building can generate significant economic, environmental, and social
benefits.

96
PART 3 ECO-INNOVATION TO IMPROVE SYNERGY FLOWS IN BUILDINGS IN SPAIN: THE CASE OF ROOFTOP ECO-GREENHOUSE
Figure 5.2 Conceptualization of RTG. The illustration emphasizes the interchange of water,
energy and gas (e.g. CO2) flows between the rooftop greenhouse and the associated building.
5.4.2 Type of greenhouse and growing system
In this study, the setting for the RTEG was the Mediterranean city of Barcelona, Spain.
The RTEG system examined had a Mediterranean design, which means that the
greenhouse weight was approximately 7.7 kg/m2 (Montero et al. 2008) and was a
relatively light structure adapted to the mild climatic conditions of the Mediterranean. It
was designed to withstand the wind more than the snow. Mediterranean greenhouses
are usually a plastic film rooftop with a large surface area of windows to eliminate
excess heat. In some cases, they have heating systems, although in the Southern
Mediterranean, heating is not usually essential. It is a predominantly passive
greenhouse, meaning that it has low energy consumption and little air conditioning
equipment, since the Mediterranean climate is by nature very favorable for growing
crops. Two main hydroponic systems could be used: aggregate culture, where the plants
are grown in containers of various shapes and sizes filled with inert (perlite, pumice,
rockwool) and/or organic (peat, coconut coir, etc.) substrate; and water culture, where
bare-rooted plants are cultivated in stagnant (floating system) or flowing (nutrient film
technique or NFT) nutrient solution. Aggregate culture is generally used for growing row
crops such as fruit and vegetables (e.g., tomatoes and strawberries), while water culture
is more appropriate for leafy vegetables and herbs that are grown at high crop density.
For this study, tomatoes were grown. Tomatoes are the most important crop in terms of
production in the EU-27 (around 14 million tons produced per year), particularly for

97
ECO-INNOVATION TO IMPROVE SYNERGY FLOWS IN BUILDINGS IN SPAIN: THE CASE OF ROOFTOP ECO-GREENHOUSE
PART 3
Mediterranean countries; Spain is the second largest producer of tomatoes in the EU-27,
contributing 27 percent of the total European tomato production (EUROSTAT, 2009).
5.5 Materials and methods.
The perception study of the barriers and opportunities regarding RTEG in Mediterranean
cities in Europe was carried out through discussion seminars. An interdisciplinary team
was set up of 15 people who specialize in agriculture, environmental sciences,
engineering, and city lanning. They came from both private companies and research
institutes such as ICTA of Autonomous University of Barcelona, IRTA and companies
within the consortium "Vertical Farming S.L." Figure 5.3 summarizes the areas of
knowledge and the actors involved in the study.
Figure 5.3 Areas of knowledge involved in the RTEG study
Once the interdisciplinary team of experts had been formed, the work sessions began.
Figure 5.4 show the methodology applied to evaluate and analyze the study system.
Figure 5.4 Methodology of work sessions regarding the perception study of the RTEG Project
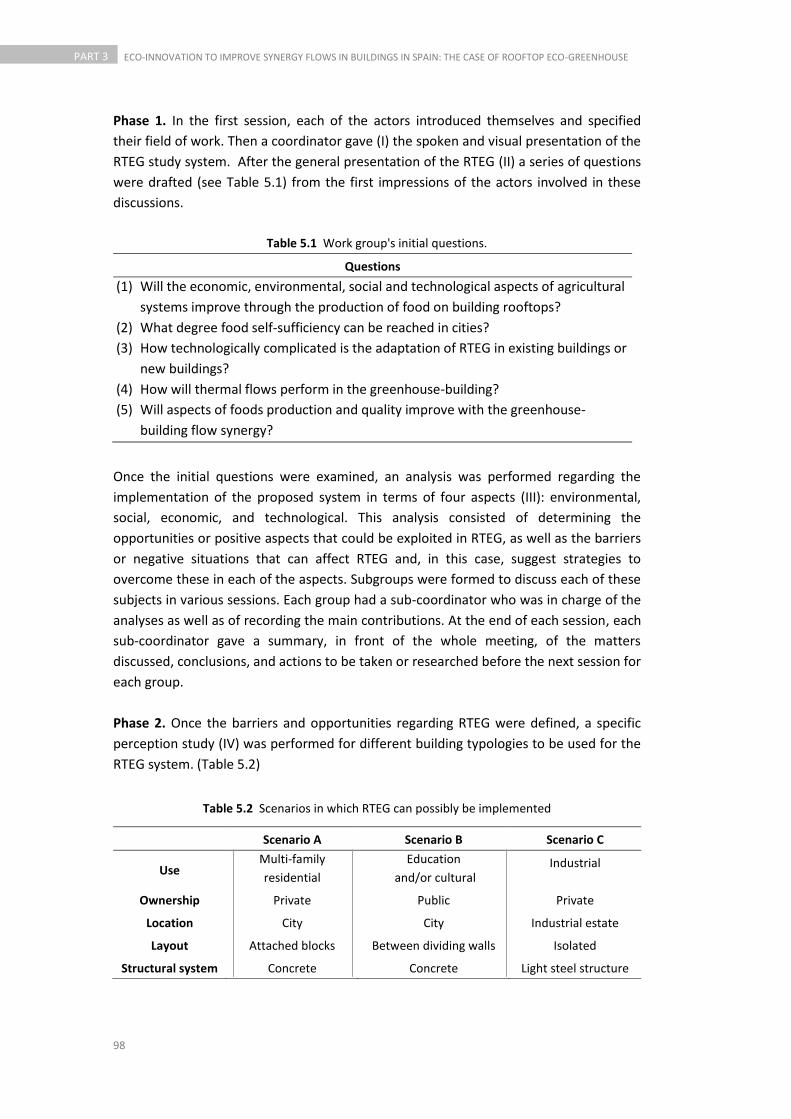
98
PART 3 ECO-INNOVATION TO IMPROVE SYNERGY FLOWS IN BUILDINGS IN SPAIN: THE CASE OF ROOFTOP ECO-GREENHOUSE
Phase 1. In the first session, each of the actors introduced themselves and specified
their field of work. Then a coordinator gave (I) the spoken and visual presentation of the
RTEG study system. After the general presentation of the RTEG (II) a series of questions
were drafted (see Table 5.1) from the first impressions of the actors involved in these
discussions.
Table 5.1 Work group's initial questions.
Questions
(1) Will the economic, environmental, social and technological aspects of agricultural
systems improve through the production of food on building rooftops?
(2) What degree food self-sufficiency can be reached in cities?
(3) How technologically complicated is the adaptation of RTEG in existing buildings or
new buildings?
(4) How will thermal flows perform in the greenhouse-building?
(5) Will aspects of foods production and quality improve with the greenhouse-
building flow synergy?
Once the initial questions were examined, an analysis was performed regarding the
implementation of the proposed system in terms of four aspects (III): environmental,
social, economic, and technological. This analysis consisted of determining the
opportunities or positive aspects that could be exploited in RTEG, as well as the barriers
or negative situations that can affect RTEG and, in this case, suggest strategies to
overcome these in each of the aspects. Subgroups were formed to discuss each of these
subjects in various sessions. Each group had a sub-coordinator who was in charge of the
analyses as well as of recording the main contributions. At the end of each session, each
sub-coordinator gave a summary, in front of the whole meeting, of the matters
discussed, conclusions, and actions to be taken or researched before the next session for
each group.
Phase 2. Once the barriers and opportunities regarding RTEG were defined, a specific
perception study (IV) was performed for different building typologies to be used for the
RTEG system. (Table 5.2)
Table 5.2 Scenarios in which RTEG can possibly be implemented
Scenario A Scenario B Scenario C
Use Multi-family
residential
Education
and/or cultural Industrial
Ownership Private Public Private
Location City City Industrial estate
Layout Attached blocks Between dividing walls Isolated
Structural system Concrete Concrete Light steel structure
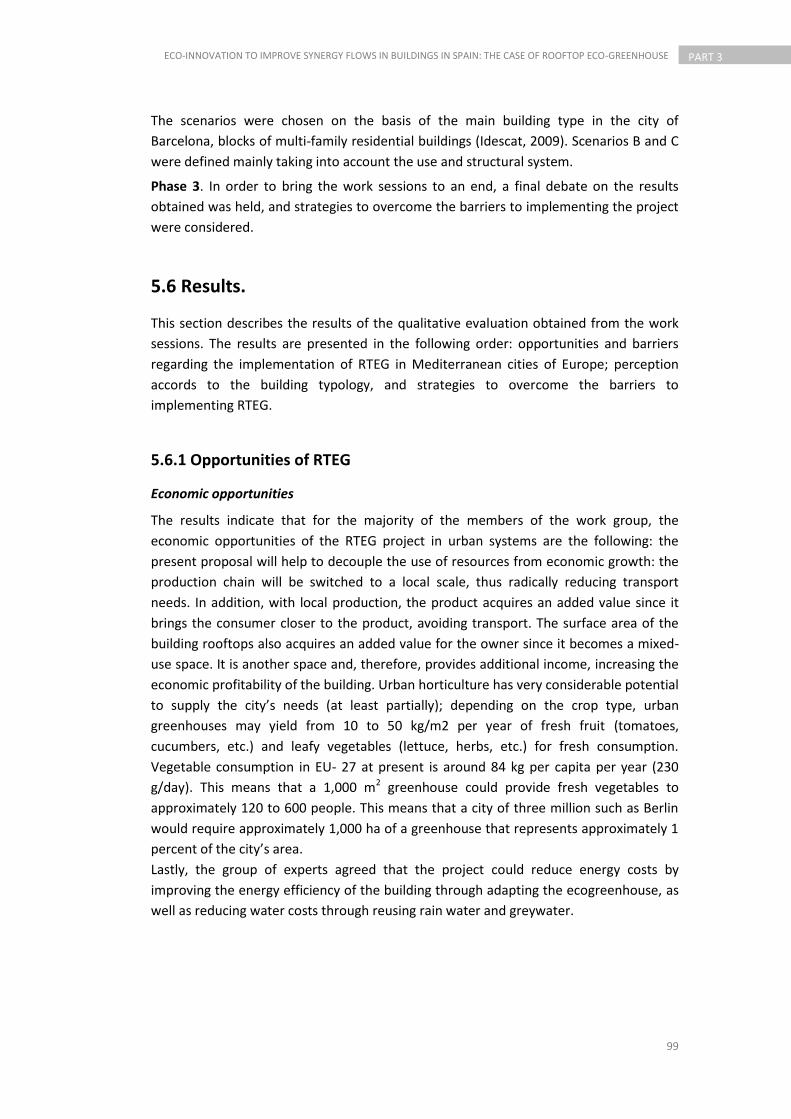
99
ECO-INNOVATION TO IMPROVE SYNERGY FLOWS IN BUILDINGS IN SPAIN: THE CASE OF ROOFTOP ECO-GREENHOUSE
PART 3
The scenarios were chosen on the basis of the main building type in the city of
Barcelona, blocks of multi-family residential buildings (Idescat, 2009). Scenarios B and C
were defined mainly taking into account the use and structural system.
Phase 3. In order to bring the work sessions to an end, a final debate on the results
obtained was held, and strategies to overcome the barriers to implementing the project
were considered.
5.6 Results.
This section describes the results of the qualitative evaluation obtained from the work
sessions. The results are presented in the following order: opportunities and barriers
regarding the implementation of RTEG in Mediterranean cities of Europe; perception
accords to the building typology, and strategies to overcome the barriers to
implementing RTEG.
5.6.1 Opportunities of RTEG
Economic opportunities
The results indicate that for the majority of the members of the work group, the
economic opportunities of the RTEG project in urban systems are the following: the
present proposal will help to decouple the use of resources from economic growth: the
production chain will be switched to a local scale, thus radically reducing transport
needs. In addition, with local production, the product acquires an added value since it
brings the consumer closer to the product, avoiding transport. The surface area of the
building rooftops also acquires an added value for the owner since it becomes a mixed-
use space. It is another space and, therefore, provides additional income, increasing the
economic profitability of the building. Urban horticulture has very considerable potential
to supply the city’s needs (at least partially); depending on the crop type, urban
greenhouses may yield from 10 to 50 kg/m2 per year of fresh fruit (tomatoes,
cucumbers, etc.) and leafy vegetables (lettuce, herbs, etc.) for fresh consumption.
Vegetable consumption in EU- 27 at present is around 84 kg per capita per year (230
g/day). This means that a 1,000 m2 greenhouse could provide fresh vegetables to
approximately 120 to 600 people. This means that a city of three million such as Berlin
would require approximately 1,000 ha of a greenhouse that represents approximately 1
percent of the city’s area.
Lastly, the group of experts agreed that the project could reduce energy costs by
improving the energy efficiency of the building through adapting the ecogreenhouse, as
well as reducing water costs through reusing rain water and greywater.

100
PART 3 ECO-INNOVATION TO IMPROVE SYNERGY FLOWS IN BUILDINGS IN SPAIN: THE CASE OF ROOFTOP ECO-GREENHOUSE
Social opportunities
Regarding opportunities in the social context, most notable is the promotion of
sociability among the community of neighbors through the creation of jobs in the case
of residential buildings because tenants would be in charge of managing this new space.
In the educational context, incorporating greenhouses into buildings would be a tool to
demonstrate not only food selfsufficiency policies, but also energy and water saving
policies. In this way, environmental education is strengthened. Also, there would be
easy access to fresher products of better quality in terms of safety, taste, and nutritional
values.
This would be achieved through the hydroponic cultivation of cultivars with better
organoleptic and nutritional properties, the application of crop-specific bio fortification
strategies, and the adoption of biological control of pests and diseases (so, no pesticides
would be used).
Environmental opportunities
The reduction of the carbon footprint of horticultural products by minimizing the
distance between growers and consumers (the km 0 approach) is one of the main
environmental opportunities of the RTEG system. At present, the carbon footprint of
shipping tomatoes from producers in southern Spain to consumers in Barcelona is 166
gCO2 per kg of tomato(Sanyé-Mengual et al. 2012). Also notable in this system would be
the reduction in the flow of water resources and fertilizers through the incorporation of
hydroponic systems compared to current peri-urban agriculture and the collection and
use of rain water and greywater fromthe building. Annual per capita water
consumptionmay exceed 90 m3 (EWA, 2010) and the proportion ofgreywater may reach
80 percent of the total wastewater generated by households.
Water consumption of year-round greenhouse cultivation is 0.7–1.5 m3/m2, depending
on crop and site. Therefore, the irrigation water from a rooftop greenhouse operation of
1,000m2 can be wholly supplied by the greywater produced by fewer than 200
inhabitants. Grey water is suitable for reuse in horticulture because of its low organic
pollutant and pathogen content.
Also, greenhouse gas emissions frombuildings can be decreased by fixing the CO2 of the
air coming from the ventilation systems in the greenhouse caused by the photosynthetic
activity of the crops. CO2 concentration in non-residential buildings is normally around
2,700 ppm, making this a rich source for plant carbon dioxide enrichment. Lastly, of the
environmental opportunities, most notable are the reduction of the building’s energy
demands through the insulation of the rooftops and the "naturalization" of the city by
creating new urban green spaces for food production.
Technological opportunities
Regarding technological opportunities, the group of experts highlighted the reduction of
the demand for urban infrastructures that would come with RTEGs, making cities more
self-sufficient. Also, they noted there is a growing body of information on the
101
ECO-INNOVATION TO IMPROVE SYNERGY FLOWS IN BUILDINGS IN SPAIN: THE CASE OF ROOFTOP ECO-GREENHOUSE
PART 3
technologies associated with RTEG, including information, climatic architecture,
lightweight materials, and energy control systems. Also, the European Union, in
particular, has devoted considerable efforts to devising strategies to integrate new
technologies and “smart city” concepts (Caragliu et al., 2011). RTEG can be part of this
technology and of eco-innovation in cities.
5.6.2 Barriers of RTEG
Economic barriers
There were several barriers to implementing RTEG in Mediterranean cities according to
the majority of the members of the work group. In the economic context, investors
perceive a low profit margin for agricultural products, a high investment cost as well as
long-term repayment. It would also be expensive to rehabilitate existing buildings to
accommodate RTEG. Implementing this system makes it difficult to develop other
rooftop business models such as those related to renewable energy (thermal or
photovoltaic), and presents legal difficulties when being installed on rooftops,
considering the legal framework surrounding greenhouses. Furthermore, it presents
installation difficulties in cities due to local regulations concerning the maximum
building height, surface area, and volume that can be built in a certain place. It can
involve a high supply cost of drinkable tap water if rain water and greywater resources
are not sufficient. In addition, drinkable water is normally not permitted by law for
agricultural use.
Social barriers
Of the social barriers, most notable is the functional incompatibility that can be created
in urban buildings when an agricultural activity is mixed with industrial and service
activities. Another barrier is consumers’ lack of trust in the quality of urban agricultural
products since it is a new model of food production, and not enough data exist about
how it performs in view of the environmental pollution in cities. The lack of agricultural
professionals qualified in urban systems and the possible job losses in rural areas are
also considered as social barriers to the implementation of RTEG.
Environmental barriers
Of the main environmental barriers, most notable is the reduction of surface areas
available on building rooftops for other environmental purposes such as renewable
energy (photovoltaic installation, thermal solar panels). Likewise, the impacts associated
with the life cycle were also highlighted, such as: materials, building and dismantling the
greenhouse with a high environmental impact. Lastly, local resources such as rain water
would not be sufficient to meet the crops’ needs, and in a semi-arid atmosphere, its
contribution would bevery low.

102
PART 3 ECO-INNOVATION TO IMPROVE SYNERGY FLOWS IN BUILDINGS IN SPAIN: THE CASE OF ROOFTOP ECO-GREENHOUSE
Technological barriers
Of the technological barriers, most notable was the complexity of incorporating flows of
food, energy, water, and emissions between the greenhouse and buildings, as well as
the complicated rehabilitation that would be required in the building’s structure in order
to adapt it to the excess loads generated by the greenhouse and the crops. The lack of
simulation models of these agro-architectural hybrid systems was considered to be a
technological barrier.
Table 5.3 presents a summary of the results shown in this section.
Table 5.3 Barriers and opportunities regarding implanting RTEG in Mediterranean cities

103
ECO-INNOVATION TO IMPROVE SYNERGY FLOWS IN BUILDINGS IN SPAIN: THE CASE OF ROOFTOP ECO-GREENHOUSE
PART 3
5.6.3 Perception of incorporating RTG according to different urban
building typologies.
The opportunities regarding the implementation of RTEGs on building rooftops without
specifying the activity or the typology of the building are applied to the three study
scenarios outlined in Table 5.2, highlighting the promotion of sociability in scenario A
and incorporation into the educational system in scenario B. Of the implementation
barriers, most notable is that concerning the rehabilitation of existing buildings when
the structure needs to be strengthened due to the extra weight of the greenhouse. This
would mainly affect scenario C due to the type of light metal structure commonly used
in this type of industrial building in industrial estates. Furthermore, the type of activity
carried out in these scenarios could bring about an incompatibility of uses with the
production of food.However, it could be positive in terms of the logistic aspects of food
production due to the large surface areas of these industrial estates for maneuvering as
well as the greater surface area of rooftops.
5.6.4 Recommendations and observations of the work group regarding
actions to overcome the barriers to implementing RTEG
As the final part of the evaluation process of the RTEG project, recommendations and
observations to facilitate the implementation were presented:
Consider the rooftop greenhouse as part of an installation in the building (like
ventilation towers, cooling system, solar panels, etc.) so that it is not affected by
the local regulations that limit its implementation. Infrastructure and new
technology has become an integrated and necessary part of urban life, and
today’s urban dwellers use many types of technology to keep the urban
environment civilized, habitable, and comfortable (Tschangho et al. 2009).
The problem of the water cycle is crucial. One constraint may be the source of
the water: rainwater alone will not be sufficient to meet crop needs, and in a
semi-arid environment its contribution will be very small. On the other hand,
drinkable water cannot be used for crop production as this is normally
prohibited by law and in any case the price is too high. The project will consider
the use of greywater for the greenhouse. For this, a fraction of the building’s
greywater will be treated before being used for irrigation. Research must be
done on developing technology to collect rain and condensation water and,
more importantly, to treating the greywater from the building and processing
the drainage water from crop irrigation.
The energy cycle is particularly important: the greenhouse can act as a solar
collector during the day, providing heat for the building; at night the building’s
residual heat can help to maintain a given set-point greenhouse temperature to
favour plant growth. During warm periods plant transpiration and roof shading
can help to reduce the heat load of the building. All of these energy exchange
processes need to be quantified and modelled. They also require new
104
PART 3 ECO-INNOVATION TO IMPROVE SYNERGY FLOWS IN BUILDINGS IN SPAIN: THE CASE OF ROOFTOP ECO-GREENHOUSE
technologies for the interchange of flows. Moreover, innovative and specific
control systems are needed to manage the greenhouse-building combination.
In order for RTEGs to be profitable a business model describing the types of
investments required and the benefits offered must exist, defining a new value
chain for the sustainable city of the future with less waste, emissions, and
energy consumption, and drafting a marketing plan with sales forecasts, profits
and losses.
The technological solutions of the project in all building typologies must present
the least environmental impact possible during the entire life cycle. Therefore,
eco-design methodologies and environmental tools such as life cycle analysis are
recommended prior to construction in order to guarantee the use of low
environmental impact materials and techniques.
RTEGs must be able to operate in new buildings and existing buildings. This
means they must overcome the technological and integration barriers
presented, as well as technical problems related to water, energy and gas
exchange.
5.7 Conclusions
This investigation presents the results of a participative experience through work
seminars with an interdisciplinary group of experts to determine the barriers and
opportunities regarding the implementation of the Rooftop Eco.Greenhouse (RTEG)
project in Mediterranean cities in Europe. RTEGs are greenhouses interconnected with
buildings for producing high-quality vegetables and improving the sustainability of
buildings in European urban environments by integrating buildings and food production.
A goal of this project is to demonstrate that buildings having food produced in rooftop
greenhouses can reduce energy, water, and CO2 flows and generate significant
economic, environmental, and social benefits.
The experts agreed that the reduction in the transport of foods is one of the main
opportunities of the project in favor of the environment since the energy consumption
and CO2 emissions were reduced in the three implementation scenarios studied.
Furthermore, RTEG would be the start of a trend of self-sufficiency in cities. For scenario
A most notable is the sociability between the community of neighbors, as well as an
environmental education tool for scenario B. One of the largest barriers in the three
scenarios concerns local regulations regarding building the project on the rooftop.
Therefore, it was suggested that the greenhouse should be considered as another
building installation. In order to overcome the investment and long-term repayment of
the project, a business model was created that would define a new value chain for the
sustainable city of the future with less waste, emissions, energy consumption. Also
drafting a marketing plan was recommended if it included forecasts of sales, profits, and
losses. For scenario C, the complexity of strengthening the structure involves a greater
investment, but at the same time the larger surface areas are in industrial zones. To
minimize the possible environmental impact on materials to strengthen the structure,

105
ECO-INNOVATION TO IMPROVE SYNERGY FLOWS IN BUILDINGS IN SPAIN: THE CASE OF ROOFTOP ECO-GREENHOUSE
PART 3
the use of environmental tools to quantify the impacts on stages prior to building is
advised.
The methodology applied to the study provided positive results, studying the barriers
and opportunities of the project from environmental, economic, social, and
technological points of view. The interdisciplinary character of the experts who
participated in this study provided a broad and comprehensive perspective on the topic.
106
PART 3 ECO-INNOVATION TO IMPROVE SYNERGY FLOWS IN BUILDINGS IN SPAIN: THE CASE OF ROOFTOP ECO-GREENHOUSE
5.7 References
Alberti, M (2008). Advances in Urban Ecology: Integrating Humans and Ecological Processes in Urban Ecosystems. Springer.
Ash, C., Jasny, B., Roberts, L., Stone, R., Sugden, A (2008). Reimagining cities – Introduction. Science 319: 739.
BCN Ecologia (2010). Estudio del potencial de cubiertas y muros verdes en Barcelona [Study of the green roof and facades potential in Barcelona]. Environment Division, Barcelona City Council.
BFS (2009). Brigth Farm Systems. “Eleanor Roosevelt School” <http://brightfarmsystems.com/selected-design-studies/eleanor-roosevelt-school-usa>. Accessed 11.09.2010.
Bulchholz, M., and Zaragoza, G (2004). A closed greenhouse for energy, water and food supply. Habitation 9(3): 116.
Buchholz, M., Schmidt, M., Buchholz, R., Geyer, P., Steffan, C (2008). Heating and cooling with sun and salt – a thermo-chemical seasonal storage system in combination with latent heat accumulation . Technische Universitat Berlin,Germany. <http://130.149.107.244/pub/Rio_2009.pdf>. Accessed 09.07.2011
Caragliu,A., Del Bo, C., Nijkamp, P (2011). Smart Cities in Europe. Journal of Urban Technology, 18(2): 65-82
Ceron-Palma, I., Sany-Mengual, E., Oliver-Sola, J., Montero, J.I., Rieradevall, J (2011). LCM of green food production in Mediterranean cities:Environmental benefits associated to the energy savings in the use stage of Roof Top Greenhouse (RTG) systems. A case study in the city of Barcelona (Catalonia,Spain). Paper presented at Life Cycle Management Conference, Berlin, Germany.
Chun, C., Kozai, T (2001). A Closed Transplant Production System, A Hybrid of Scaled-up Micropropagation System and Plant Factory. Journal of Plant Biotechnology, 3(2): 59-66.
Davila, J (2006). Falling between stools? Policies, strategies and the peri-urban interface in D. McGregor, D. Simon and D. Thompson, eds. The Peri-urban Interface: Approaches to Sustainable Natural and Human Resource Use (London: Earthscan).
Davies, P. A., and Paton C (2005). The Seawater Greenhouse in the United Arab Emirates: thermal modeling and evaluation of design options. Desalination 173(2): 103–111.
Despommier, D (2010). The Vertical Farm: Feeding the World in the 21st Century. (New York: Thomas Dunne Books)
Despommier, D (2008). The Vertical Farm: Reducing the impact of agriculture on ecosystem functions and services. <http://www.verticalfarm.com/more?essay>. Accessed 17.04.2011
Ekaterini, E., Dimitris, A (1998). The contribution of a planted roof to the thermal protection of buildings in Greece. Energy and Buildings, 27(1):29-36.
107
ECO-INNOVATION TO IMPROVE SYNERGY FLOWS IN BUILDINGS IN SPAIN: THE CASE OF ROOFTOP ECO-GREENHOUSE
PART 3
Montero, J., Stanghellini, C., Castilla, N (2008). Invernadero para la producción sostenible en áreas de clima de invierno suaves. Horticultura International 65: 14-28
European Parliament and the Council of the European Union (2010). Directive 2010/31/EU.(2009). Official Journal of the European Union. 153: 13-35. Luxembourg: Publications Office of the European Union
European Environment Agency (EEA) (2010).10 messages for 2010 Agricultural ecosystems. Office for Official Publications of the European Union. Copenhagen. <http://www.eea.europa.eu/themes/agriculture> Accessed 12.01.2011.
EWA-European Water Association- (2010). "EWA Yearbook 2010/2011" EWA: Germany (2010)EUROSTAT(2009). Agricultural Statistics, Main Results 2007-2008. Office for Official Publications of the European Communities, Luxembourg.
FAO (2010). Agricultura mundial: Hacia los años 2015/2030. Informe resumido de la Organización de las Naciones Unidas para la Agricultura y la Alimentación. <http://www.fao.org/DOCREP/004/Y3557S/Y3557S00.HTM.> Accesed 07.01.2011
Farreny, R., Oliver-Solá, J., Montlleó, M., Escriba, E., Gabarrel, X., Rieradevall, J(2011). Transition Towards Sustainable Cities: Opportunities, Constraints and Strategies in Planning. A Neighbourhood Eco-Design Case Study in Barcelona (Spain). Environment and Planning A, 43:1118-1134.
Grewal, S., Grewal, S (2012). Can cities become self-reliant in food? Cities 29 (1): 1–11.
Jansma, J.E., Dekking, A.J.G., Migchels, G., de Buck, A.J., Ruijs, M.N.A., Galama, P.J., Visser, A.J (2010). Agromere, stadslandbouw in Almere, van toekomstbeelden tot ontwerp <http://www.agromere.wur.nl/NR/rdonlyres/9B133549-63C7-483C-A07D8326410CC74E/104470/Agromererapportdef.pdf>. Accesed 23.01.2012.
Idescat. Institut d'Estadística de Catalunya (2009). <http://www.idescat.cat/.> Accessed 21.06.2010.
IPES (2009). Con agricultura urbana, Bucaramanga (Colombia) enfrenta problemas de desnutrición. Boletín de agricultura urbana, 14. <http://www.ipes.org/au/Boletin/Boletin14.htm. Accesed 12.12.2010>.
IEA (2008). International Energy Agency. World Energy Outlook 2008.ISBN: 978-92-64-04560-6, Paris.
IEA (2009). International Energy Agency. World Enery Outlook 2009. Executive Summary, Paris.
Kozai, T (2006). Closed Systems for High Quality Transplants Using Minimum Resources, in D. Gupta and Y. Ibaraki, ed., Plant Tissue Culture Engineering. Springer Netherlands,275-312.
Lee, H.Y (2008). An analysis on development capacity of an urbanized area for urban growth management. Journal of the Korean Urban Geographical Society 11: 1-18.
Montero, J.I., Stanghellini, C., Castilla, N (2009). Greenhouse technology for sustainable
108
PART 3 ECO-INNOVATION TO IMPROVE SYNERGY FLOWS IN BUILDINGS IN SPAIN: THE CASE OF ROOFTOP ECO-GREENHOUSE
production in mild winter climate areas: trends and needs, in Y. Tüzel, G.B. Öztekin and M.K. Meric, eds., Proceedings of International Symposium on Strategies Towards Sustainability of Protected Cultivation in Mild Winter Climate. Antalya, Turkey.
Opdam, J.J.G, Schoonderbeek G.G, Heller, E.M.B., de Gelder, A (2005). Closed Greenhouse: A Starting Point for Sustainable Entrepreneurship in Horticulture, in: G.P.A. Bot, L.M.F. Marcelis (Eds.). International Conference on Sustainable Greenhouse Systems, ISHS Acta Horticulturae 691, Leuven, Belgium.
Ong, B (2003). Green plot ratio: an ecological measure for architecture and urban planning. Landscape and Urban Planning, 63(4): 197-211.
Parrot, L., Dongmo, C., Ndoumbe, M., Poubom, C (2008). Horticulture, livelihoods and urban transition in Africa: evidence from South-West Cameroon. Agricultural Economics 39: 245–256
Plantagon. The plantagon Greenhouse (2011).
<http://plantagon.com/plantagon/sites/default/files/greenhouse_presentation_english
.pdf>. Accesed 21.03.2012
Puri, V., Caplow, T (2009). Building integrated agriculture, in: Droege, P. (Ed). One hundred per cent renewable. USA: Earthscan.
Ruralcat. Parcs agraris de Catalunya, Espanya i Europa (2009). <http://www.ruralcat.net/web/guest/gecnews.module.ruralcat/-/journal_content/
56_INSTANCE_8hUE/10136/686485>.Accesed 23.07.2010
Saheley, H.R, Dudding, S., Kennedy, C.A (2003). Estimation of urban metabolism of Canadian Cities: Greater Toronto Area case study. Canadian Journal Civil Engineering, 30: 468-483
Sanyé-Megual, E., Cerón-Palma, I., Oliver-Solà, J., Montero, J.I., Rieradevall, J (2011). LCM of green food production in Mediterranean cities: Environmental benefits associated to the distribution stage of Roof Top Greenhouse (RTG) systems. A case study in the city of Barcelona (Catalonia,Spain). Paper presented at Life Cycle Management Conference, Berlin, Germany.
Schwartz. Gotham Greens Building First Hydroponic Rooftop Farm in NYC (2009). http://www.fastcompany.com/blog/ariel-schwartz/sustainability/gotham-greens-building-first-hydroponic-rooftop-farm-nyc. Accesed 14.03.2012
Seawater Greenhouse. (2000) http://www.seawatergreenhouse.com/. Accesed 21.06.2011.
Sustain (2012). A Growing Trade - a guide for community groups growing food to sell in our towns and cities. Sustain: The alliance for better food and farming, London.
Thapa, R., Murayama, Y (2008). Land evaluation for peri-urban agriculture using analytical hierarchical process and geographic information system techniques: a case study of Hanoï. Land Use Policy 25: 225–239.
Timmenga, H (2012). Geo-thermal heating and cooling in ‘closed greenhouse’ concept.
<http://www.greenhousecanada.com/content/view/948/>. Accesed 23.03.2012.

109
ECO-INNOVATION TO IMPROVE SYNERGY FLOWS IN BUILDINGS IN SPAIN: THE CASE OF ROOFTOP ECO-GREENHOUSE
PART 3
Tschangho, J.M., Kim, J., Claus, M., Rank, J.S., Xiao, Y (2009). Technology and Cities: Processes of Technology-Land Substitution in the Twentieth Century. Journal of Urban Technology, 16(1): 63-89.
United Nations (UN) (2008). World Urbanization Prospects: The 2007 Revision Population Database. <http://esa.un.org/unup/>. Accessed 11.04.2009.
Viljoen , K., Bohn , J., Howe, J (2005). Continuous Productive Urban Landscapes: Designing Urban Agriculture for Sustainable. Cities, Oxford: Architectural Press.
Wadel, G., Avellaneda, J., Cuchí, A (2010). Sustainability in industrialised architecture: closing The materials cycle. Informes de la Construcción, 62: 37-51.
Wilson, G (2005). The next profit frontier for green roof companies is “Foof from the roof”.<http://www.greenroofs.com/archives/gf_nov-dec05.htm#November/December0 5> . Accesed 12.03.2012
Winston, N (2010). Regeneration for Sustainable Communities? Barriers to Implementing Sustainable Housing in Urban Areas. Sustainable Development. 18: 319-330.
Wong, N.H., Chen, Y., Ong, C.L., Sia, A (2003). Investigation of thermal benefits of rooftop garden in the tropical environment. Building and Environment, 38(2):261-270.
Yano Research Institute Ltd. Plant Factories in Netherlands and Japan: Research Findings in 2010. <http://www.yanoresearch.com/press/pdf/737.pdf>. Accesed 11.01.2012.
Zaragoza, G., Buchholz, M., Jochum, P., Perez-Parra, J (2007). Watergy project: Towards a rational use of water in greenhouse agriculture and sustainable architecture. Desalination. 211(1-3):296-303.

110
PART 3 ECO-INNOVATION TO IMPROVE SYNERGY FLOWS IN BUILDINGS IN SPAIN: THE CASE OF ROOFTOP ECO-GREENHOUSE

111
ECO-INNOVATION TO IMPROVE SYNERGY FLOWS IN BUILDINGS IN SPAIN: THE CASE OF ROOFTOP ECO-GREENHOUSE
PART 3
111
Introduction and famework
Chapter 6
Energy and environmental analysis of heat flows in
Rooftop Eco-Greenhouse:
A case study in the Mediterranean City of Barcelona.
RENDER BY ILEANA CERON
112
PART 3 ECO-INNOVATION TO IMPROVE SYNERGY FLOWS IN BUILDINGS IN SPAIN: THE CASE OF ROOFTOP ECO-GREENHOUSE
This chaptes is based in the following paper:
Ceron-Palma I, Sanyé-Mengual E, Oliver-Solà J, Rieradevall J, Montero JI (2012). Energy
and environmental analysis of heat flows in Rooftop Eco-Greenhouse: A case study in
the Mediterranean City of Barcelona. Submitted to Building and environment
Abstract
The building sector has been accused of excessive energy consumption in terms of use,
operation and maintainance. Cooling and heating requirements to improve comfort in
buildings has a great impact on energy consumption. Insulation strategies and the
incorporation of renewable energy in buildings has been evaluated and implemented in
Europe. In order to reduce the energy consumption and CO2 emissions in buildings, it is
necessary to development and research new synergies in this sector. Rooftop Eco-
Greenhouse (RTEG) is presented as an eco-innovative system that incorporates
agriculture into the rooftops of buildings in the city from an industrial ecological
perspective, as a new approach for sustainable food production in urban systems. This
paper report results of a preliminary energy analysis of RTEG in a public building in
Barcelona, Spain. The main purpose of the study was to assess the heating demand and
heat flow behaviour in an interconnected RTEG system. The building and greenhouse
have been modeled in Designbuilder simulation software.
The analysis was divided into three stages. First, we determined insulation effect of
greenhouse in the building, through the amount of heat energy saved. Then, we
analyzed the behaviour of indoor temperature in the system and the thermal balance in
the building, without heating. Finally, we determined the residual heat potential that
could be transferred through the interconnected system.
In addition, a sensitivity analysis of CO2 emissions associated with heating demands has
been quantified using the Life Cycle Assessment (LCA) method.
The results indicated that the insulative effect of the greenhouse on the building in
terms of energy saved represents a small percentage (less than 5%) of heating demand
in the building.
Preliminary results indicate the existence of residual heat in the building and
greenhouse. The potential of residual heat to transfer from the greenhouse to the
building was estimated as 87kWh for a day in winter. This could represent a saving of
79% in energy requirements for heating, during a day in winter.
CO2eq emissions avoided by heating systems would represent 34.45KgCO2eq/day,
29.66KgCO2eq/day and 23.88KgCO2eq/day in electrical, gas and diesel systems
respectively.
Keywords: smart cities, RTEG, eco-innovation, synergy flows, food in buildings
113
ECO-INNOVATION TO IMPROVE SYNERGY FLOWS IN BUILDINGS IN SPAIN: THE CASE OF ROOFTOP ECO-GREENHOUSE
PART 3
6.1 Introduction
Worldwide, 30-40% of all primary energy is used in buildings (UNEP, 2007). The building
sector, like other industries, is based on the production model defined by the linear
sequence: mining, manufacturing and residue (Wadel et al. 2010).
Internationally, the negative impact of the current energy model on the environment
has led governments of the states and cities to consider various measures, through
agreements such as the Rio de Janeiro Summit (UNCED, 1992), Kyoto (UNFCC, 1998),
Johannesburg (UN, 2002), Aalborg (ICLEI, 2004) and more recently Rio+20 (UN, 2012).
Currently, buildings use about one-third of the world´s energy (Griffith et al, 2007) and
this has been detected as a priority area for reduction of the total energy consumption
within the European Union (EU). According to the IPCC, buildings provide the most
economic mitigation potential for reduction of CO2 emissions (Roche, 2010). One
initiative of European Commission (2007a) has been the European Energy Policy Plan
(20-20-20) to 2020. This consists of a 20% reduction in CO2 emissions; 20% improvement
in energy processes; and a 20% replacement of primary energy with renewable energy
(Fiashi et al. 2012).
In addition to energy, food provides another significant energy flow within the urban
system. The flow of food to cities follows a lineal model, causing a high consumption of
energy resources, generation of waste and CO2 emissions per food unit (kg), throughout
its life cycle (EEA, 2010).
At present, the carbon footprint of shipping tomatoes from producers in Southern Spain
to consumers in Barcelona is 166 g of CO2 per kg of tomato (Sanyé-Mengual et al., 2011).
Multifunctional landscape management and integration of agriculture into cities will
help to reduce the carbon footprint of food production and make urban systems more
sustainable (FAO 2012; Arosamena, 2012).
6.1.1 Energy efficiency and food production in buildings: An overview
Energy efficiency is a factor of great importance for sustainable buildings (Chwieduk,
2003). Energy saving is without doubt the fastest, most efficient and most profitable way
to reduce emissions and improve air quality. Therefore it is necessary to promote the
implementation of new policies and new technologies (Delgado et al. 2009).
In the European Mediterranean area, buildings standards play an important role. In the
case of Spain, the Building Technical Code, with particular reference to the closure of
buildings and their envelope is crucial in saving energy through insulation, thermal
inertia and exposure to radiation (CTE, 2011). The use phase of the building is where
most energy is consumed. The energy consumption during the operational phase of a
building depends on several factors, such as the level of thermal demand, location and
climate, materials and building design (UNEP, 2007). Cooling and heating demands are
significant parameters for evaluating the energy performance of buildings in Europe
(Tsikaloudaki et al. 2012).
114
PART 3 ECO-INNOVATION TO IMPROVE SYNERGY FLOWS IN BUILDINGS IN SPAIN: THE CASE OF ROOFTOP ECO-GREENHOUSE
Considerable efforts are being made in the building sector to incorporate initiatives that
can improve energy efficiency. The Institute for Diversification and Saving of Energy in
Spain (IDEA, 2011) is currently implementing the "Energy Saving and Efficiency Action
Plan 2011-2020". It involves measures to control, in terms of energy consumption, not
only for industry, but also for agricultural holdings, particularly greenhouses. The energy
demand of a greenhouse depends on the relationship between the outdoor climate and
the environmental needs of the crops. The climate control is used in order to improve
the conditions for plants and helps to reach production goals.
Eco-innovation is an alternative strategy that can contribute to improving resource
efficiency in the building sector. “Eco-innovation is any form of innovation aiming at
significant and demonstrable progress towards the goal of sustainable development,
through reducing impacts on the environment or achieving a more efficient and
responsible use of natural resources, including energy” (European Commission, 2007b).
Integrating eco-innovation in building is not solely about improve energy efficiency or
resources use, but also about finding new and better ways to achieve the same or even
higher functionality with new technologies and new synergies with other buildings or by
using less resources (EIO, 2011). One eco-innovation strategy that could be used to
improve energy efficiency and synergy with food in buildings is the implementation of
Rooftop Greenhouses (RTGs).
Integrating food production using greenhouses on the roofs of buildings has started to
be studied in different countries. As part of the “inFARMING” project in Germany, a
prototype of the so called “Rooftop Farming” is being developed by the Fraunhofer in
Haus Center (2012) in collaboration with BrightFarm Systems (2011). The goal is to
demonstrate the possibility of implementation in Germany. In the private sector, local
food suppliers are planning new projects such as car parks on the roof of service
buildings in Vancouver, and a project called “Fresh from the roof” on a former factory
roof in Berlin (Frish Von Bach, 2012). The first commercial-scale rooftop greenhouse was
recently built in Montreal (Lufa Farms, 2011). This 3000m2 greenhouse started to offer
weekly vegetable baskets to local residents in Spring 2011. To our knowledge, there are
no residual flow connections between the RTG and the building below. These initiatives,
and others, are still in the development phase. However, it is still necessary to study
proposals for the integration of greenhouses that allow quantified benefits and
synergies with the building and urban system.
This study presents the preliminary energy and environmental analysis of one eco-
innovation project in a European context: The integration of food production in
buildings through the synergy concept called ‘Rooftop Eco-Greenhouse’(RTEG)(Figure
6.1).
RTEG is defined by three main aspects: (1) Eco-innovation represented by greenhouse-
building incorporation as a model for producing food and as a new option of utilising
territory for agriculture, using a rooftop; (2) the eco-design of the greenhouse with
criteria of low environmental impact and energy efficiency; (3) the incorporation of the
concept of symbiosis and industrial ecology into the exploitation of flows (Cerón-Palma
et al. 2012).
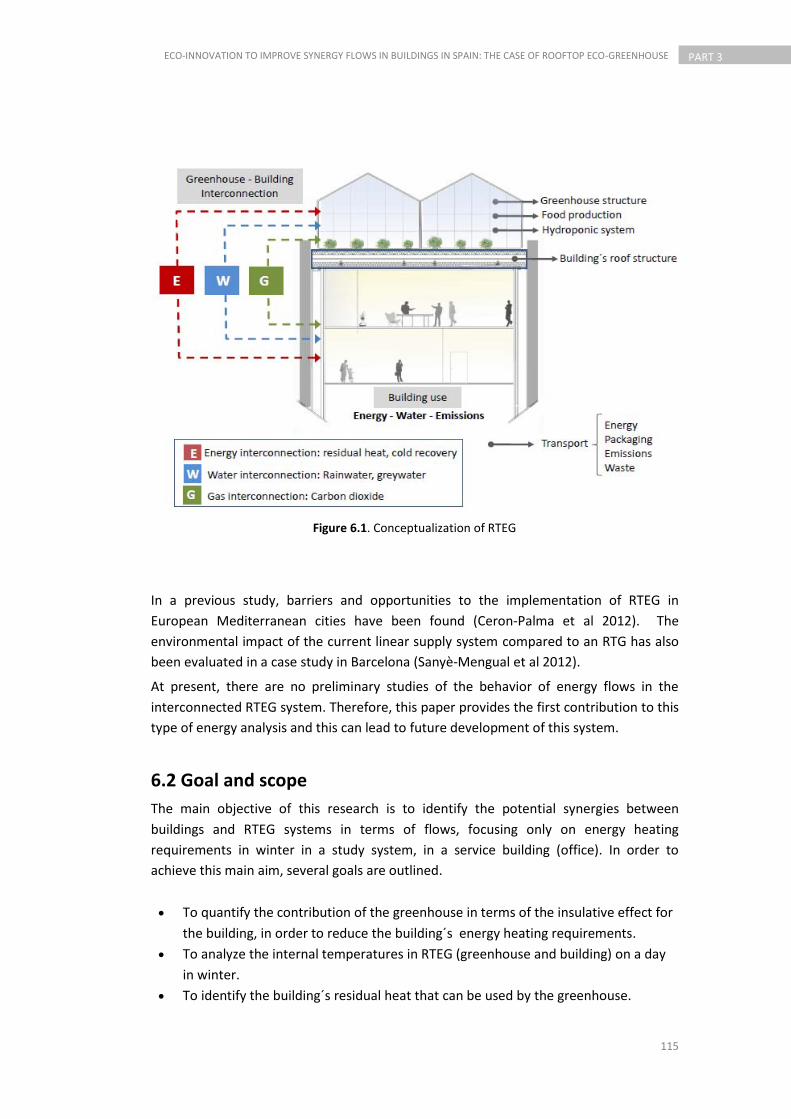
115
ECO-INNOVATION TO IMPROVE SYNERGY FLOWS IN BUILDINGS IN SPAIN: THE CASE OF ROOFTOP ECO-GREENHOUSE
PART 3
Figure 6.1. Conceptualization of RTEG
In a previous study, barriers and opportunities to the implementation of RTEG in
European Mediterranean cities have been found (Ceron-Palma et al 2012). The
environmental impact of the current linear supply system compared to an RTG has also
been evaluated in a case study in Barcelona (Sanyè-Mengual et al 2012).
At present, there are no preliminary studies of the behavior of energy flows in the
interconnected RTEG system. Therefore, this paper provides the first contribution to this
type of energy analysis and this can lead to future development of this system.
6.2 Goal and scope
The main objective of this research is to identify the potential synergies between
buildings and RTEG systems in terms of flows, focusing only on energy heating
requirements in winter in a study system, in a service building (office). In order to
achieve this main aim, several goals are outlined.
To quantify the contribution of the greenhouse in terms of the insulative effect for
the building, in order to reduce the building´s energy heating requirements.
To analyze the internal temperatures in RTEG (greenhouse and building) on a day
in winter.
To identify the building´s residual heat that can be used by the greenhouse.

116
PART 3 ECO-INNOVATION TO IMPROVE SYNERGY FLOWS IN BUILDINGS IN SPAIN: THE CASE OF ROOFTOP ECO-GREENHOUSE
To identify the greenhouse´s residual heat that can be used by the building.
To estimate CO2 emissions avoided by minimizing resource consumption of
heating systems (electric, gas, diesel).
6.3 Methodology
6.3.1 The site
The study was conducted in an office building located in the South of Europe in the
municipality of Cabrils, in the county of Maresme, in Barcelona, Spain (Figure 6.2).
Cabrils is located at latitude 41o 31´N and longitude 2o22’ E. It has a population of
approximately 7196 inhabitants, and an area of 7.1 km2. It has a Mediterranean climate
with mild temperatures in winter and warm temperature in summer.
Figure 6.2. Location of the building in Cabrils
6.3.2 Definition of study system
This section describes the main features of the building and greenhouse that compose
the RTEG study system.
Office building
The building has a rectangular shape (27m long by 15.20m wide) with a total area of
about 410m2 with five zones (Figure 6.3). The outer walls are constructed of a double
concrete block (0.20m) with air gap (0.10m). The roof is a concrete waffle slab (0.40m).
There is a false ceiling with an air gap of 0.50m (Figure 6.4).
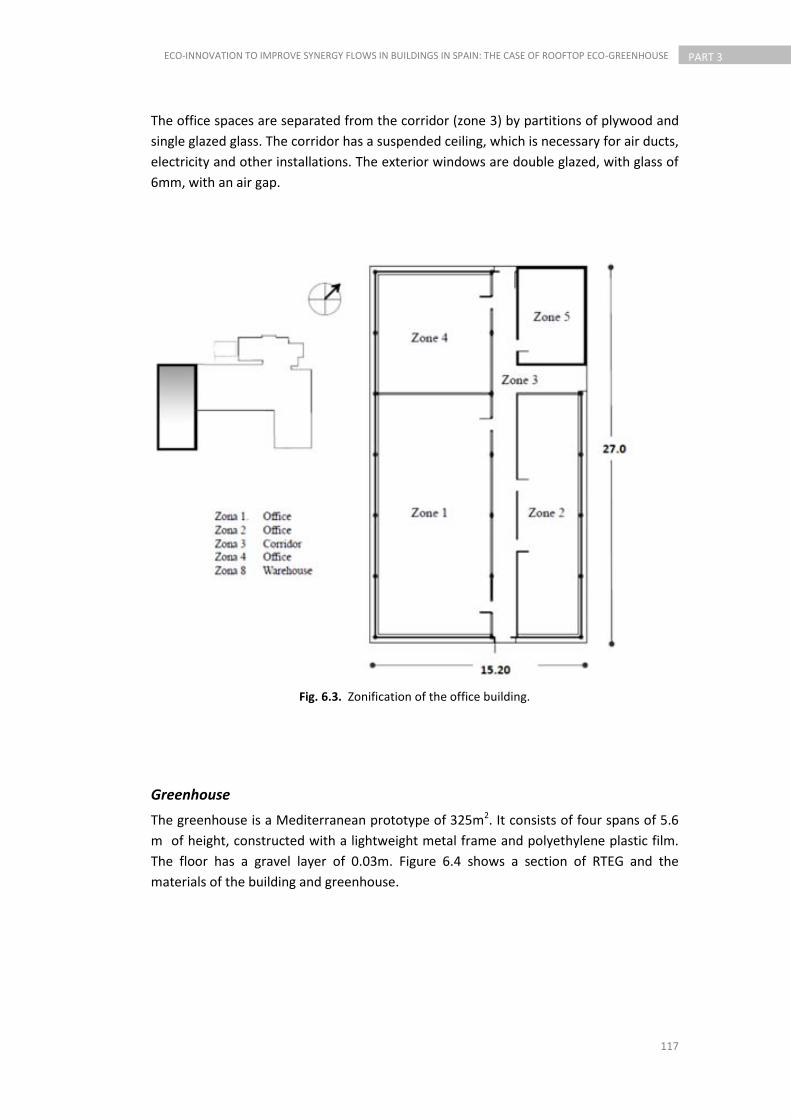
117
ECO-INNOVATION TO IMPROVE SYNERGY FLOWS IN BUILDINGS IN SPAIN: THE CASE OF ROOFTOP ECO-GREENHOUSE
PART 3
The office spaces are separated from the corridor (zone 3) by partitions of plywood and
single glazed glass. The corridor has a suspended ceiling, which is necessary for air ducts,
electricity and other installations. The exterior windows are double glazed, with glass of
6mm, with an air gap.
Fig. 6.3. Zonification of the office building.
Greenhouse
The greenhouse is a Mediterranean prototype of 325m2. It consists of four spans of 5.6
m of height, constructed with a lightweight metal frame and polyethylene plastic film.
The floor has a gravel layer of 0.03m. Figure 6.4 shows a section of RTEG and the
materials of the building and greenhouse.
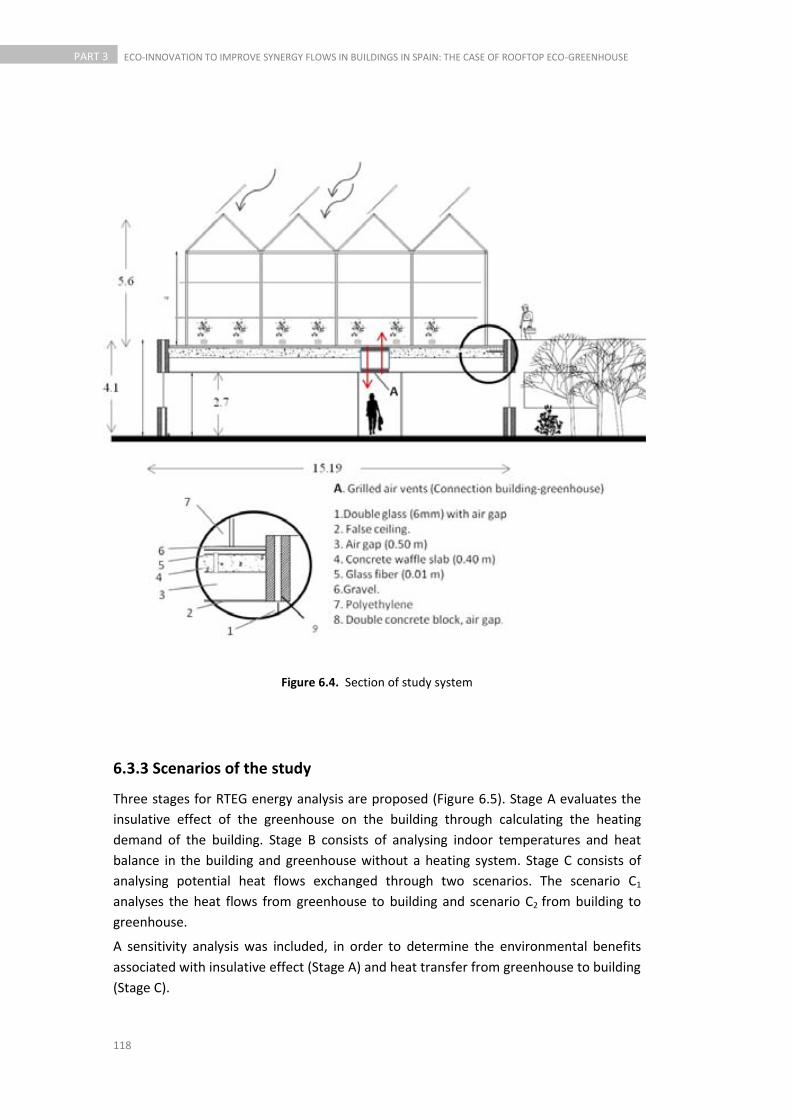
118
PART 3 ECO-INNOVATION TO IMPROVE SYNERGY FLOWS IN BUILDINGS IN SPAIN: THE CASE OF ROOFTOP ECO-GREENHOUSE
Figure 6.4. Section of study system
6.3.3 Scenarios of the study
Three stages for RTEG energy analysis are proposed (Figure 6.5). Stage A evaluates the
insulative effect of the greenhouse on the building through calculating the heating
demand of the building. Stage B consists of analysing indoor temperatures and heat
balance in the building and greenhouse without a heating system. Stage C consists of
analysing potential heat flows exchanged through two scenarios. The scenario C1
analyses the heat flows from greenhouse to building and scenario C2 from building to
greenhouse.
A sensitivity analysis was included, in order to determine the environmental benefits
associated with insulative effect (Stage A) and heat transfer from greenhouse to building
(Stage C).

119
ECO-INNOVATION TO IMPROVE SYNERGY FLOWS IN BUILDINGS IN SPAIN: THE CASE OF ROOFTOP ECO-GREENHOUSE
PART 3
Figure 6.5. Summary of stages to be evaluated in RTEG system
6.3.4 Energy simulation
Software program
The "DesignBuilder" energy simulation program (DB, 2011) was used to calculate the
internal gains and heating demand in the study system. This program uses the
EnergyPlus dynamic simulation process (DOE, 2011) to generate performance data
based on the climatic and thermal characteristics of the materials. The program allows
for the calculation of heating loads using the method adopted by ASHRAE and
implemented in EnergyPlus. The geometric model of the building and greenhouse were
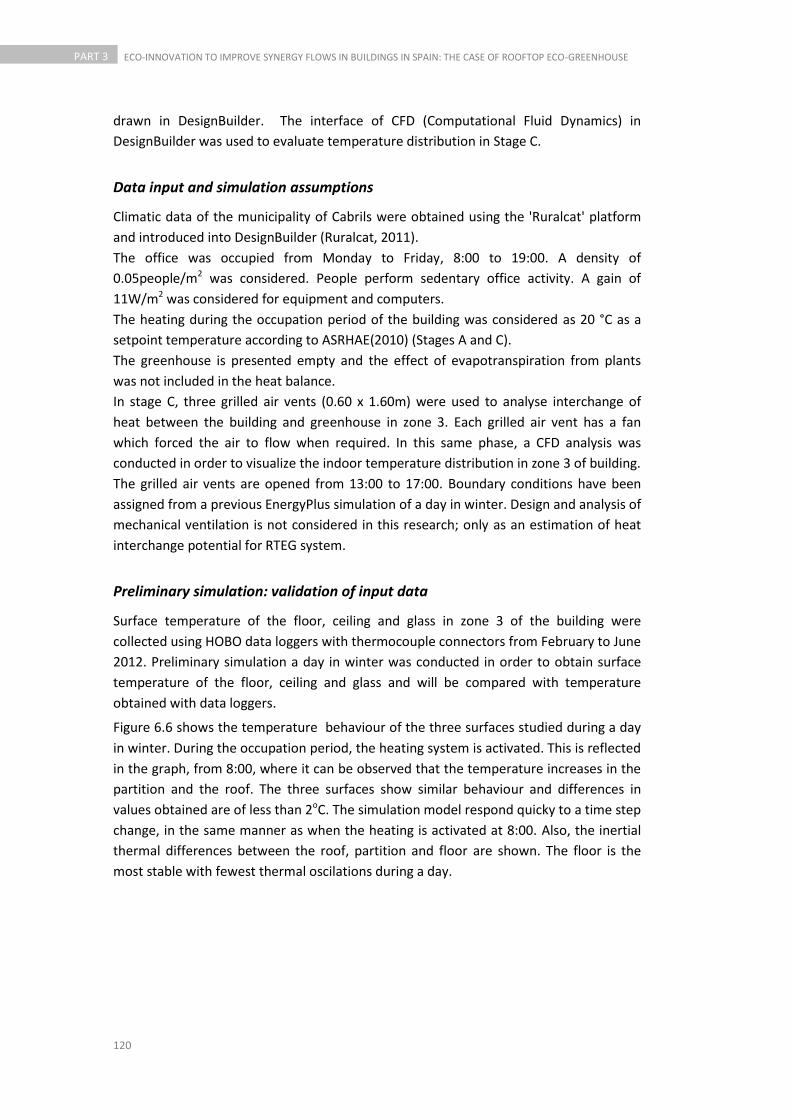
120
PART 3 ECO-INNOVATION TO IMPROVE SYNERGY FLOWS IN BUILDINGS IN SPAIN: THE CASE OF ROOFTOP ECO-GREENHOUSE
drawn in DesignBuilder. The interface of CFD (Computational Fluid Dynamics) in
DesignBuilder was used to evaluate temperature distribution in Stage C.
Data input and simulation assumptions
Climatic data of the municipality of Cabrils were obtained using the 'Ruralcat' platform
and introduced into DesignBuilder (Ruralcat, 2011).
The office was occupied from Monday to Friday, 8:00 to 19:00. A density of
0.05people/m2 was considered. People perform sedentary office activity. A gain of
11W/m2 was considered for equipment and computers.
The heating during the occupation period of the building was considered as 20 °C as a
setpoint temperature according to ASRHAE(2010) (Stages A and C).
The greenhouse is presented empty and the effect of evapotranspiration from plants
was not included in the heat balance.
In stage C, three grilled air vents (0.60 x 1.60m) were used to analyse interchange of
heat between the building and greenhouse in zone 3. Each grilled air vent has a fan
which forced the air to flow when required. In this same phase, a CFD analysis was
conducted in order to visualize the indoor temperature distribution in zone 3 of building.
The grilled air vents are opened from 13:00 to 17:00. Boundary conditions have been
assigned from a previous EnergyPlus simulation of a day in winter. Design and analysis of
mechanical ventilation is not considered in this research; only as an estimation of heat
interchange potential for RTEG system.
Preliminary simulation: validation of input data
Surface temperature of the floor, ceiling and glass in zone 3 of the building were
collected using HOBO data loggers with thermocouple connectors from February to June
2012. Preliminary simulation a day in winter was conducted in order to obtain surface
temperature of the floor, ceiling and glass and will be compared with temperature
obtained with data loggers.
Figure 6.6 shows the temperature behaviour of the three surfaces studied during a day
in winter. During the occupation period, the heating system is activated. This is reflected
in the graph, from 8:00, where it can be observed that the temperature increases in the
partition and the roof. The three surfaces show similar behaviour and differences in
values obtained are of less than 2oC. The simulation model respond quicky to a time step
change, in the same manner as when the heating is activated at 8:00. Also, the inertial
thermal differences between the roof, partition and floor are shown. The floor is the
most stable with fewest thermal oscilations during a day.
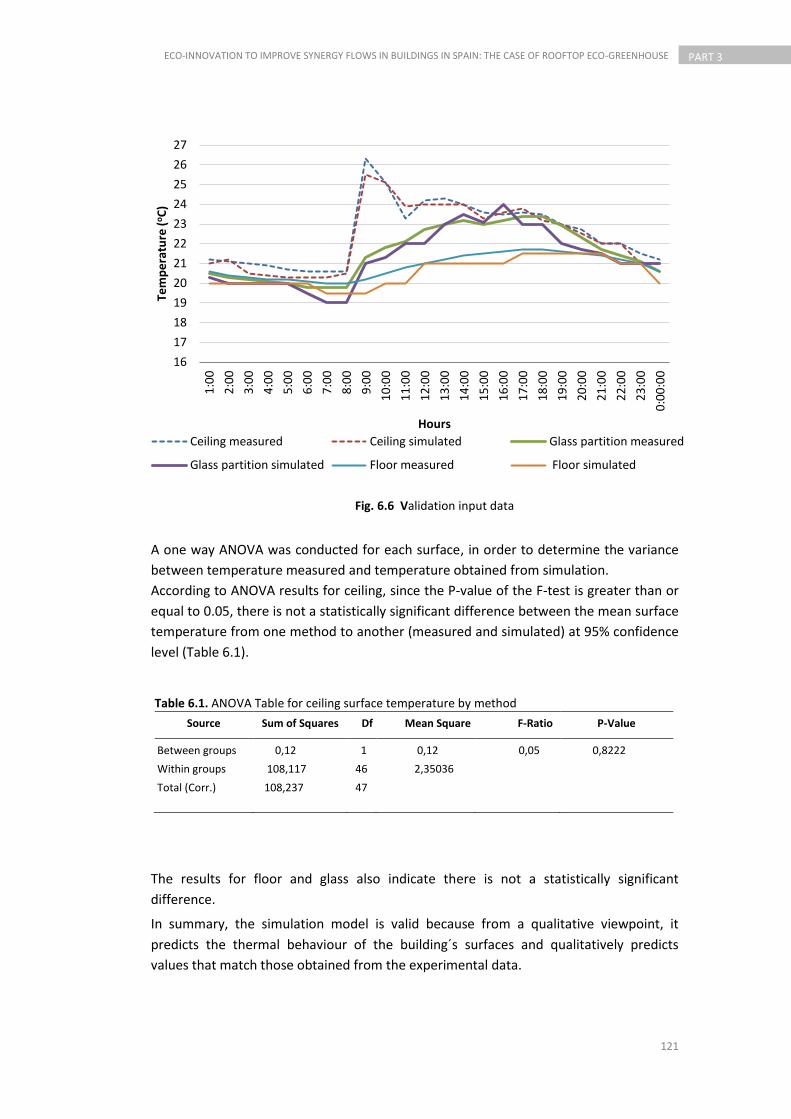
121
ECO-INNOVATION TO IMPROVE SYNERGY FLOWS IN BUILDINGS IN SPAIN: THE CASE OF ROOFTOP ECO-GREENHOUSE
PART 3
A one way ANOVA was conducted for each surface, in order to determine the variance
between temperature measured and temperature obtained from simulation.
According to ANOVA results for ceiling, since the P-value of the F-test is greater than or
equal to 0.05, there is not a statistically significant difference between the mean surface
temperature from one method to another (measured and simulated) at 95% confidence
level (Table 6.1).
The results for floor and glass also indicate there is not a statistically significant
difference.
In summary, the simulation model is valid because from a qualitative viewpoint, it
predicts the thermal behaviour of the building´s surfaces and qualitatively predicts
values that match those obtained from the experimental data.
Table 6.1. ANOVA Table for ceiling surface temperature by method
Source Sum of Squares Df Mean Square F-Ratio P-Value
Between groups 0,12 1 0,12 0,05 0,8222
Within groups 108,117 46 2,35036
Total (Corr.) 108,237 47
Fig. 6.6 Validation input data
16
17
18
19
20
21
22
23
24
25
26
27
1:0
0
2:0
0
3:0
0
4:0
0
5:0
0
6:0
0
7:0
0
8:0
0
9:0
0
10
:00
11
:00
12
:00
13
:00
14
:00
15
:00
16
:00
17
:00
18
:00
19
:00
20
:00
21
:00
22
:00
23
:00
0:0
0:0
0
Tem
pe
ratu
re (
oC
)
Hours
Ceiling measured Ceiling simulated Glass partition measured
Glass partition simulated Floor measured Floor simulated
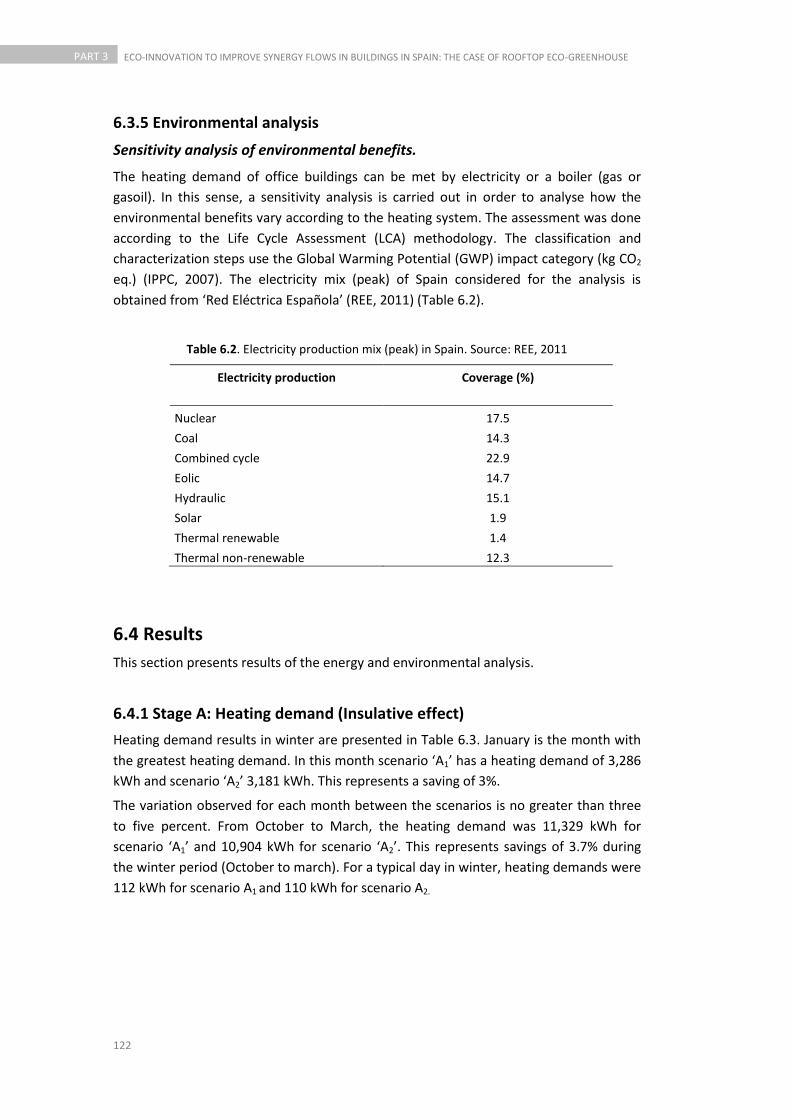
122
PART 3 ECO-INNOVATION TO IMPROVE SYNERGY FLOWS IN BUILDINGS IN SPAIN: THE CASE OF ROOFTOP ECO-GREENHOUSE
6.3.5 Environmental analysis
Sensitivity analysis of environmental benefits.
The heating demand of office buildings can be met by electricity or a boiler (gas or
gasoil). In this sense, a sensitivity analysis is carried out in order to analyse how the
environmental benefits vary according to the heating system. The assessment was done
according to the Life Cycle Assessment (LCA) methodology. The classification and
characterization steps use the Global Warming Potential (GWP) impact category (kg CO2
eq.) (IPPC, 2007). The electricity mix (peak) of Spain considered for the analysis is
obtained from ‘Red Eléctrica Española’ (REE, 2011) (Table 6.2).
Table 6.2. Electricity production mix (peak) in Spain. Source: REE, 2011
Electricity production Coverage (%)
Nuclear 17.5
Coal 14.3
Combined cycle 22.9
Eolic 14.7
Hydraulic 15.1
Solar 1.9
Thermal renewable 1.4
Thermal non-renewable 12.3
6.4 Results
This section presents results of the energy and environmental analysis.
6.4.1 Stage A: Heating demand (Insulative effect)
Heating demand results in winter are presented in Table 6.3. January is the month with
the greatest heating demand. In this month scenario ‘A1’ has a heating demand of 3,286
kWh and scenario ‘A2’ 3,181 kWh. This represents a saving of 3%.
The variation observed for each month between the scenarios is no greater than three
to five percent. From October to March, the heating demand was 11,329 kWh for
scenario ‘A1’ and 10,904 kWh for scenario ‘A2’. This represents savings of 3.7% during
the winter period (October to march). For a typical day in winter, heating demands were
112 kWh for scenario A1 and 110 kWh for scenario A2.

123
ECO-INNOVATION TO IMPROVE SYNERGY FLOWS IN BUILDINGS IN SPAIN: THE CASE OF ROOFTOP ECO-GREENHOUSE
PART 3
Table 6.3. Comparison of the heating demand in a building with and without a greenhouse
Months
Building without greenhouse (A1)
Building with greenhouse ( A2) Saving
[kWh] [kWh/m2] [kWh] [kWh/m2]
October 252 0.61 241 0.59 4%
November 1514 3.70 1451 3.50 4%
December 2721 6.60 2631 6.40 3%
January 3286 8.00 3181 7.75 3%
February 2085 5.10 2007 4.90 4%
March 1471 3.60 1393 3.40 5%
Total Winter 11329 27.63 10904 26.60 4%
Energy savings of lower than 5% between scenarios A1 and A2 show the need to explore
new forms of interconnection, in order to enable greater energy saving. The results of
stage B are presented below, which provides a first approximation of the potential
residual heat in the RTG system in this study system.
6.4.2 Stage B: Variation of indoor temperatures and thermal balance
Building
Figure 6.7 shows the hourly behavior of indoor temperature during a day in winter. In
the occupancy period, heating is required from 8:00 to 15:00. At 15:00, the air
temperature is 20o C remaining in the comfort zone until 18:00. This is attributed mainly
to external solar gains, according to Figure 6.8. Heat is mainly lost through the walls and
partitions in the period of highest radiation. Partitions are made of glass and plywood;
their thermal inertia means that during daytime the partitions are cooler than the
surrounding internal air and so they absorb energy from the air.
Figure 6.7. Results of temperatures in a building with greenhouse during a day in winter. The
building was unheated.
0
5
10
15
20
25
1:0
0
2:0
0
3:0
0
4:0
0
5:0
0
6:0
0
7:0
0
8:0
0
9:0
0
10
:00
11
:00
12
:00
13
:00
14
:00
15
:00
16
:00
17
:00
18
:00
19
:00
20
:00
21
:00
22
:00
23
:00
0:0
0:0
0
Tem
pe
ratu
re (
oC
)
Hours
Indoor temperature Outside temperature Comfort temperature
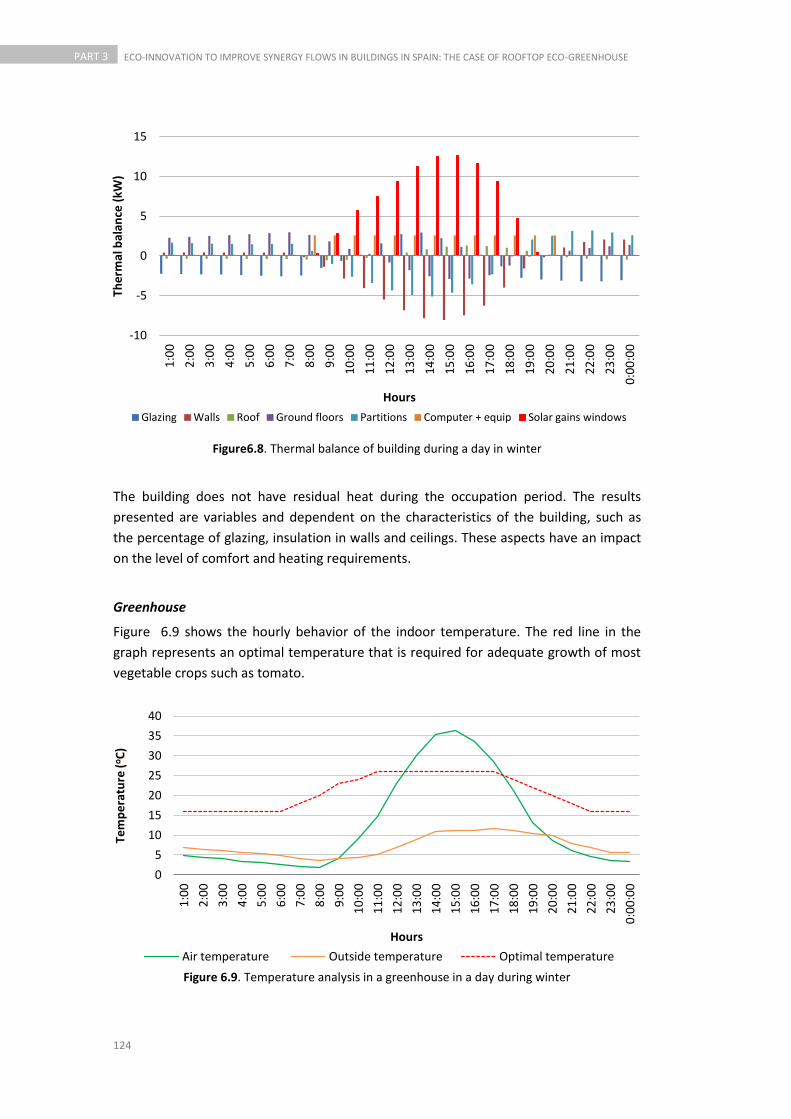
124
PART 3 ECO-INNOVATION TO IMPROVE SYNERGY FLOWS IN BUILDINGS IN SPAIN: THE CASE OF ROOFTOP ECO-GREENHOUSE
Figure6.8. Thermal balance of building during a day in winter
The building does not have residual heat during the occupation period. The results
presented are variables and dependent on the characteristics of the building, such as
the percentage of glazing, insulation in walls and ceilings. These aspects have an impact
on the level of comfort and heating requirements.
Greenhouse
Figure 6.9 shows the hourly behavior of the indoor temperature. The red line in the
graph represents an optimal temperature that is required for adequate growth of most
vegetable crops such as tomato.
Figure 6.9. Temperature analysis in a greenhouse in a day during winter
-10
-5
0
5
10
15
1:0
0
2:0
0
3:0
0
4:0
0
5:0
0
6:0
0
7:0
0
8:0
0
9:0
0
10
:00
11
:00
12
:00
13
:00
14
:00
15
:00
16
:00
17
:00
18
:00
19
:00
20
:00
21
:00
22
:00
23
:00
0:0
0:0
0
The
rmal
bal
ance
(kW
)
Hours
Glazing Walls Roof Ground floors Partitions Computer + equip Solar gains windows
0
5
10
15
20
25
30
35
40
1:0
0
2:0
0
3:0
0
4:0
0
5:0
0
6:0
0
7:0
0
8:0
0
9:0
0
10
:00
11
:00
12
:00
13
:00
14
:00
15
:00
16
:00
17
:00
18
:00
19
:00
20
:00
21
:00
22
:00
23
:00
0:0
0:0
0
Tem
pe
ratu
re (
oC
)
Hours
Air temperature Outside temperature Optimal temperature
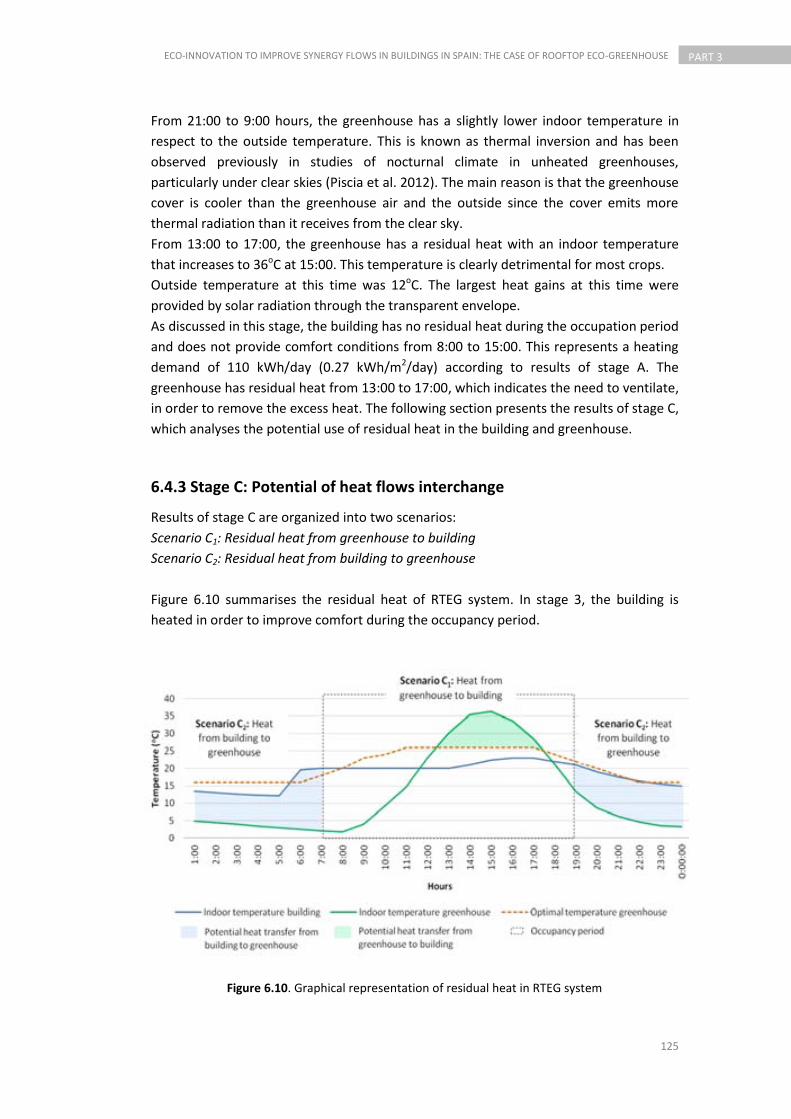
125
ECO-INNOVATION TO IMPROVE SYNERGY FLOWS IN BUILDINGS IN SPAIN: THE CASE OF ROOFTOP ECO-GREENHOUSE
PART 3
From 21:00 to 9:00 hours, the greenhouse has a slightly lower indoor temperature in
respect to the outside temperature. This is known as thermal inversion and has been
observed previously in studies of nocturnal climate in unheated greenhouses,
particularly under clear skies (Piscia et al. 2012). The main reason is that the greenhouse
cover is cooler than the greenhouse air and the outside since the cover emits more
thermal radiation than it receives from the clear sky.
From 13:00 to 17:00, the greenhouse has a residual heat with an indoor temperature
that increases to 36oC at 15:00. This temperature is clearly detrimental for most crops.
Outside temperature at this time was 12oC. The largest heat gains at this time were
provided by solar radiation through the transparent envelope.
As discussed in this stage, the building has no residual heat during the occupation period
and does not provide comfort conditions from 8:00 to 15:00. This represents a heating
demand of 110 kWh/day (0.27 kWh/m2/day) according to results of stage A. The
greenhouse has residual heat from 13:00 to 17:00, which indicates the need to ventilate,
in order to remove the excess heat. The following section presents the results of stage C,
which analyses the potential use of residual heat in the building and greenhouse.
6.4.3 Stage C: Potential of heat flows interchange
Results of stage C are organized into two scenarios:
Scenario C1: Residual heat from greenhouse to building
Scenario C2: Residual heat from building to greenhouse
Figure 6.10 summarises the residual heat of RTEG system. In stage 3, the building is
heated in order to improve comfort during the occupancy period.
Figure 6.10. Graphical representation of residual heat in RTEG system

126
PART 3 ECO-INNOVATION TO IMPROVE SYNERGY FLOWS IN BUILDINGS IN SPAIN: THE CASE OF ROOFTOP ECO-GREENHOUSE
Figure 6.10 shows that the greenhouse can benefit from the building´s residual heat
during most of the night, whilst the building can benefits from using heat from the
greenhouse during the central part of the day.
Scenario C1: Residual heat from greenhouse to building
Figure 6.11 shows the indoor temperature behaviour in the greenhouse when
mechanical ventilation (Fans) was applied. A total of 87 kWh/day of heat was removed
from the greenhouse in order to decrease its temperature. This data indicates the
potential amount of heat that can be transferred to the building in a study day.
Figure 6.11 Results of temperature analysis in a greenhouse with mechanical ventilation during
a day in winter.
If we assume that the building has an energy requirement for heating of 110 kWh
according to the results from stage A, introducing heat recovered from the greenhouse
would represent an estimated saving of 79% of the energy requirements for heating.
This percentage represents the total heat energy saving for the building if heat from
greenhouse could be transferred and distributed effectively. The design of a system to
transfer the heat from greenhouse to building or to distribute the heat once it is in the
building, is beyond the scope of this study.
Figure 6.12 shows the distribution of indoor temperature in greenhouse and zone 3 of
the office building interconnected through grilled air vents at 14:00. At this time, a
greenhouse without interconnection has a temperature of 35oC. The grilled air vents
were opened at 13:00, which means that by 14:00, the temperature in the greenhouse
has decreased by 5 °C (Figure 6.11).
0
5
10
15
20
25
30
35
40
1:0
0
2:0
0
3:0
0
4:0
0
5:0
0
6:0
0
7:0
0
8:0
0
9:0
0
10
:00
11
:00
12
:00
13
:00
14
:00
15
:00
16
:00
17
:00
18
:00
19
:00
20
:00
21
:00
22
:00
23
:00
0:0
0:0
0
Tem
pe
ratu
re (
oC
)
Hours
Greenhouse Greenhouse interconnected
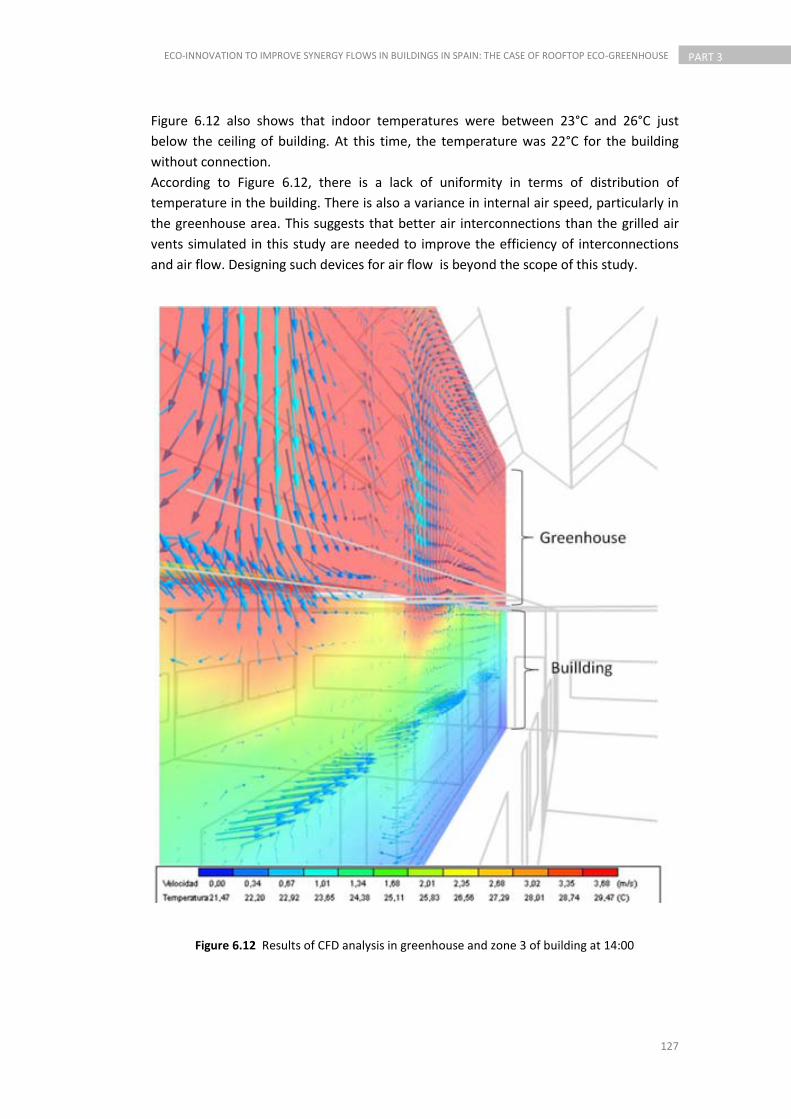
127
ECO-INNOVATION TO IMPROVE SYNERGY FLOWS IN BUILDINGS IN SPAIN: THE CASE OF ROOFTOP ECO-GREENHOUSE
PART 3
Figure 6.12 also shows that indoor temperatures were between 23°C and 26°C just
below the ceiling of building. At this time, the temperature was 22°C for the building
without connection.
According to Figure 6.12, there is a lack of uniformity in terms of distribution of
temperature in the building. There is also a variance in internal air speed, particularly in
the greenhouse area. This suggests that better air interconnections than the grilled air
vents simulated in this study are needed to improve the efficiency of interconnections
and air flow. Designing such devices for air flow is beyond the scope of this study.
Figure 6.12 Results of CFD analysis in greenhouse and zone 3 of building at 14:00
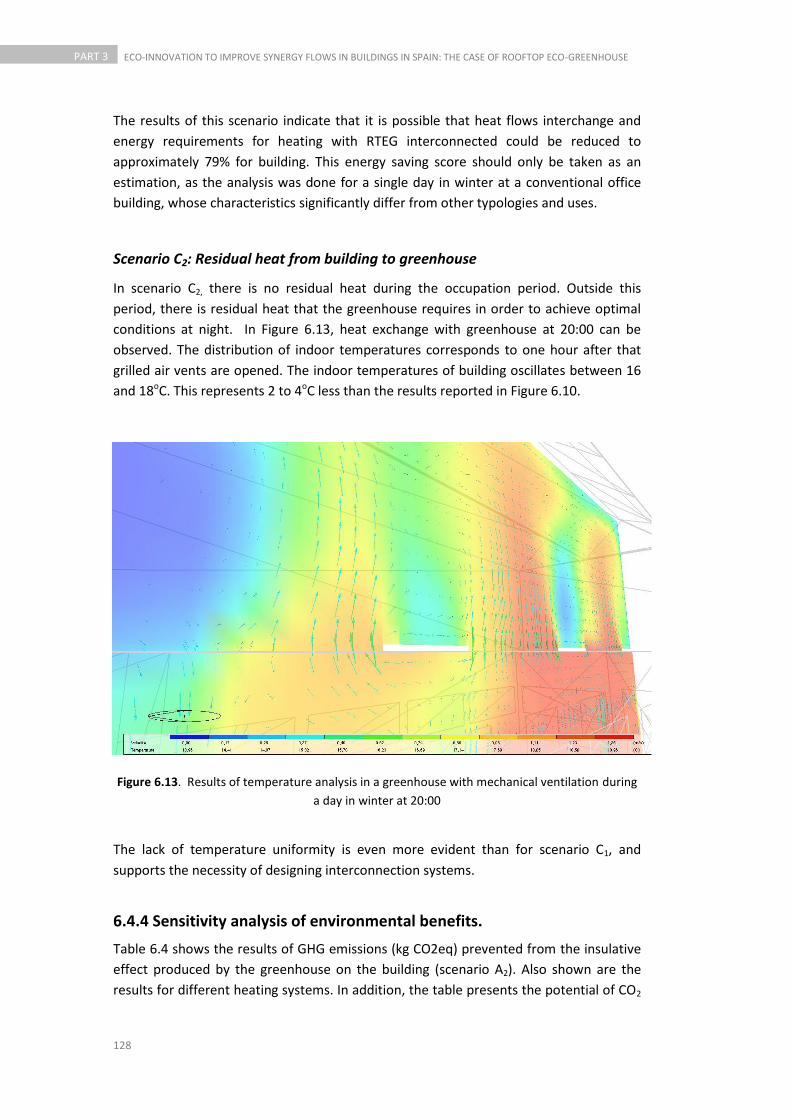
128
PART 3 ECO-INNOVATION TO IMPROVE SYNERGY FLOWS IN BUILDINGS IN SPAIN: THE CASE OF ROOFTOP ECO-GREENHOUSE
The results of this scenario indicate that it is possible that heat flows interchange and
energy requirements for heating with RTEG interconnected could be reduced to
approximately 79% for building. This energy saving score should only be taken as an
estimation, as the analysis was done for a single day in winter at a conventional office
building, whose characteristics significantly differ from other typologies and uses.
Scenario C2: Residual heat from building to greenhouse
In scenario C2, there is no residual heat during the occupation period. Outside this
period, there is residual heat that the greenhouse requires in order to achieve optimal
conditions at night. In Figure 6.13, heat exchange with greenhouse at 20:00 can be
observed. The distribution of indoor temperatures corresponds to one hour after that
grilled air vents are opened. The indoor temperatures of building oscillates between 16
and 18oC. This represents 2 to 4oC less than the results reported in Figure 6.10.
Figure 6.13. Results of temperature analysis in a greenhouse with mechanical ventilation during
a day in winter at 20:00
The lack of temperature uniformity is even more evident than for scenario C1, and
supports the necessity of designing interconnection systems.
6.4.4 Sensitivity analysis of environmental benefits.
Table 6.4 shows the results of GHG emissions (kg CO2eq) prevented from the insulative
effect produced by the greenhouse on the building (scenario A2). Also shown are the
results for different heating systems. In addition, the table presents the potential of CO2

129
ECO-INNOVATION TO IMPROVE SYNERGY FLOWS IN BUILDINGS IN SPAIN: THE CASE OF ROOFTOP ECO-GREENHOUSE
PART 3
saved if all the heat recovered from the greenhouse (scenario C1) could be used in the
building, in order to reduce energy requirements for heating.
For both scenarios, the results show that the CO2eq saved are higher for electric heating
systems than a gas boiler (≈ 144%) or diesel (≈ 115%).
Table 6.4: Results of sensitivity analysis of CO2eq avoided in the heating system
Months CO2 saved due to insulation effect (A2) CO2 saved due to heat transfer ( C1)
[KgCO2eq/day] [KgCO2eq/m2/day] [KgCO2eq/day] [KgCO2eq/m2/day]
Electricity 0.79 0.002 34.45 0.08
Gas 0.55 0.001 23.83 0.06
Diesel 0.70 0.0017 29.66 0.07
Results are presented for a day in a winter (Table 4). However, an annual analysis for
scenario A2 (all winter) shows that emissions of CO2eq saved in electric heating systems
would be 168 KgCO2eq/year, whilst gas and diesel would be 116 and 136 KgCO2eq/year
respectively. Comparing annual values with daily results, it is observed that the amount
of emissions avoided by heating systems during the year (winter) is lower, if we consider
that in a single day, residual heat can avoided the use of 34.45 KgCO2eq/day in electrical
systems. Further research is needed to determine an appropriate design of connections
and heat transfer systems, which is beyond the scope of this study.
Local production of hydroponic tomatoes in RTEG system in the study area on site
provides environmental savings of 0.44 kg kgCO2eq related to distribution of tomatoes
(transport and loss of product avoided and optimised packaging) (Sanye-Mengual et al.
2012). With a productivity of 15 kg/m2 (Anton et al., 2005), the annual savings would be
6.6 kgCO2eq/m2. Compared to the scenario A2, the insulative effect is equivalent to a 6%
(0.41 kgCO2eq/m2/year) saving of distribution.
6.5 Discussion and future research
As previously described, this paper introduced a research of energy flows in the RTEG
system. The main constraints found during the research were related to the variety of
buildings with different characteristics that could be considered as a study systems. The
office had limitations in relation to exploration the exchange of heat from the building
to the greenhouse (scenario C2). This is because the building needed to be heated
during part of occupation period. Moving the heat from the building to greenhouse
could produce an increased demand for heating.
For this study system, further research is needed in order to evaluate if removing heat
from the building has an implication in the supply of heat through the heating system in
order to meet comfort conditions
130
PART 3 ECO-INNOVATION TO IMPROVE SYNERGY FLOWS IN BUILDINGS IN SPAIN: THE CASE OF ROOFTOP ECO-GREENHOUSE
However, similar research could have been conducted using other climate data and
other typologies of building. In context of service buildings, how restaurants and gyms
could provide residual heat for greenhouses is of great interest to study. In this same
scenario (C2), we also noticed the importance of an air quality study for the viability of
using heat flows from building to greenhouse. According to CTE (2011), the transfer or
re-circulation of air can only be used if it contains a low level of contamination or less
than 400ppm of CO2 (UNE-EN 13779, 2005). Building air quality would be important to
analyse in future research, in order to provide optimal CO2 conditions for plants in
greenhouses.
In scenario C1, the potential of residual heat to transfer from greenhouse to building was
estimated as 87kWh for a day in winter. This residual heat recovered in its entirety and
efficiently distributed through a system designed for the interconnection of the building
with the greenhouse (which is not considered in the scope of this study), could provide
savings of 79% in daily heating demand (110 kWh/day) according to the results of this
investigation. An important issue to be considered in future research is the assessment
of the energy consumption that is required by fans systems to move heat.
The results of the environmental study related to GHG emissions (kg CO2eq) avoided in
different heating systems ( electrical, gas and diesel) on a day in winter were 98% higher
in stage C (residual heat potential) compared to stage A (insulation effect). However, it is
necessary to consider annual simulations for energy and environmental global balance
of benefits of the system. An extend annual study could assess the heat flows savings
compared with other RTEG flows such as transport.
CFD analysis showed that the indoor temperature increased between 2 and 4oC in
building when residual heat of the greenhouse was transferred through grilled air vents.
This provides improved building comfort conditions by increasing the temperature to
20oC. According to ASHRAE, comfort limits in winter are 20 to 24oC. If there is heat left
over in one of the spaces, another option is to transfer it to nearby buildings. This is
within the concept of industrial ecology, which focuses on how to change a waste
product into a raw material.
Areas of future research are presented:
Conduct studies of RTEG in summer to analyse the potential of residual cold
connection. This may provide an energy and environmental annual balance of
RTEG integrated in buildings in a Mediterranean climate.
Extend energy analysis in buildings with different construction systems,
percentage of glazed and/or double skin facade.
Extend the study with greenhouses made from other materials such as glass or
polycarbonate film.
Design and evaluate connection systems in buildings of several levels and the
distribution of heat within each of them.
Compare the importance of interconnection with other RTEG system benefits,
such as logistics of food.
Expand the study to cold areas of Central Europe
131
ECO-INNOVATION TO IMPROVE SYNERGY FLOWS IN BUILDINGS IN SPAIN: THE CASE OF ROOFTOP ECO-GREENHOUSE
PART 3
Conduct a parametric study to determine the optimal percentage of surface
system components (building and greenhouse).
6.6 Conclusions
In this article, we have analyzed how RTEG provides synergy with energy flows in a office
building.
As part of the methodology, the preliminary simulation demonstrated the validity of the
model which did not find significant differences between the surface temperature (floor,
ceiling and partitions) data found on site and the results obtained using DesignBuilder.
This validates the use of the model for future research.
The energy analysis identified that the RTEG system without interconnection has low
energy saving in the heating demand of the building during winter (425kWh/year).
The heat balance of the building showed that the main heat gains during the day occur
from the high percentage of glazed surface of the building. It is necessary to expand the
study in the future, using other types of glass facades (with a lower glazed percentage),
as this may affect the heating demand.
The energy analysis determined the existence of residual heat in the greenhouse during
4 hours in the study day. Estimated data of 87 kWh/day of residual heat available to be
transferred from the greenhouse to the building was obtained. This would represent a
79% savings in the energy required to heat the building in the same day, if there was an
effective connection system that would allow the retrieval and distribution of all residual
heat from the greenhouse. CO2eq emissions avoided by heating systems would
represent 34.45KgCO2eq/day, 29.66KgCO2eq/day and 23.88KgCO2eq/day in electrical,
gas and diesel systems respectively.
The building shows residual heat during periods in which it remains unoccupied. The
exchange of heat flows from the building to the greenhouse is possible in this study
system, as shown by the CFD analysis. However, future studies are needed to determine
how movement of heat would affect heating demand during periods of occupation.
Based on the results generated by this research, further lines of research can be
investigated, in order to determine other energy and environmental benefits of the
RTEG system.

132
PART 3 ECO-INNOVATION TO IMPROVE SYNERGY FLOWS IN BUILDINGS IN SPAIN: THE CASE OF ROOFTOP ECO-GREENHOUSE
References to Chapter 6
Antón, A., Montero, JI., Muñoz, P., Castells, F (2005). LCA and tomato production in Mediterranean greenhouses. Int J Agric ResourGovernEcol 4:102–112
Arosemena, G (2012). Urban agriculture, Gustavo Gili, Spain.
ASHRAE (2010). American society of heating, refrigerating and air-conditioning engineers. Standard 55, Thermal Environmental Conditions for Human Occupancy, Atlanta.
Brightfarms (2011) BrightFarms Inc, New York, USA. < http://brightfarms.com/> Retrieved on January 2012> Accesed 26.06.12
Ceron-Palma, I., Oliver-Solà, J., Sanyé-Mengual, E., Montero, JI., Rieradevall, J (2012) Barriers and opportunities regarding the implementation of Rooftop Eco-Greenhouses (RTEG) in Mediterranean cities of Europe. Journal of Urban Technology, in press ( DOI:10.1080/10630732.20).
CTE (2011). Código Técnico de Edificación, España. <http://www.codigotecnico.org/web/recursos/documentos/dbhe/> Accessed 03.04.11
Chwieduk, D (2003). Towards sustainable-energy buildings, Applied Energy 76(3): 211-217
Davide Piscia, D., Montero, Baeza, E., Bailey, B (2012). A CFD greenhouse night-time condensation model Biosystems Engineering, 111(2)141-154
DBS (2011) DesignBuilder Software Ltd, London, UK. <http://www.designbuilder.co.uk/content/view/1/12/> Accessed 11-06-11
Delgado A, Hernández C, Jiménez D, Nieto J. Rehabilitación energética de edificios. Respuesta clave y urgente ante la crisis. 2009. Reunión GTPES, España.
DOE (2011) EnergyPlus Energy Simulation Software, U.S. Departament of Energy. <http://apps1.eere.energy.gov/buildings/energyplus/energyplus_about.cfm> Accessed 26-06-12
EEA (2010). The European Environment – State and Outlook 2010. EEA, Copenhagen.
EIO (2011). Thematic Report: Resource-efficient construction. Ecoinnovation Observatory. <www.eco-innovation.eu> Accesed 09-07-12
European Commission (2007b). Competitiveness and Innovation Framework Programme (2007 to 2013) Brussels.
European Commission (2007a). Action plane European energy policy: (20-20-20 package) <http://ec.europa.eu>. Accesed 09-07-12
FAO (2012). Food for cities. <www.fao.org/fcit> Accesed 12.10.12
133
ECO-INNOVATION TO IMPROVE SYNERGY FLOWS IN BUILDINGS IN SPAIN: THE CASE OF ROOFTOP ECO-GREENHOUSE
PART 3
Fiashi, D., Bandinelli, R., Conti, S (2012). A case study for energy issues of public buildings and utilities in a small municipality: Investigation of possible improvements and integration with renewables. Applied Energy. 97,101–114
Griffith, B., Long, N., Torcellini, P., Judkoff, R., Crawley, D., Ryan, J (2007). Assessment of the technical potential for achieving net-zero energy buildings in the commercial sector, NREL/TP-550-41957 <www.nrel.gob/docs/fy08osti/41957.pdf> Accessed 17.10.12
ICLEI (2004). European Sustainable Cities & Towns Conference Aalborg (Denmark) <http://www.iclei-europe.org/products-activities/?cmd=view&aid=346> Accessed 11.05.12
Fraunhofer inHaus-Center (2012). Harvesting on urban rooftops <http://www.umsicht.fraunhofer.de/content/dam/umsicht/en/documents/infomaterial/OE300/111011-infarming.pdf> Accessed 24-10-12
Frish Von Bach (2012). Fresh from the roof <http://www.ecf-center.de/wp-content/uploads/2011/11/fvd.english.pdf> Accessed 30.09.12
IDEA (2011). Energy saving a 2011-2010. Instituto para la Diversificación y Ahorro de la Energía. España. http://www.idae.es/
IPCC (2007) Climate Change 2007: Synthesis Report. Contribution of Working Groups I, II and III to the Fourth Assessment Report of the Intergovernmental Panel on Climate Change [Core Writing Team, Pachauri, R.K and Reisinger, A. (eds.)] . International Panel on Climate Change, Geneva.
Lufa Farms (2011). Fresh local <https://lufa.com/> Accessed 04-07-12
Norma UNE-EN 13779 (2005). Ventilación de edificios no residenciales. Requisitos de prestaciones de los sistemas de ventilación y acondicionamiento de recintos.
Roche, P. Calculating green house gas emissions for building: analysis of the performance of several carbon counting tools in different climates. Informes de la Construcción. Vol. 62, No. 517, 2010, 61-80
Ruralcat (2011). Departamento de Agricultura, Ramadería, Pesca, Alimentación y Medio Natural. Generalitat de Catalunya. <http://www.ruralcat.net/web/guest> Accessed 03.04.11
Sanyé, E., Cerón-Palma, I., Oliver-Solà, J., Montero, JI., Rieradevall, J (2012). Environmental analysis of the logistics of agricultural products through Roof Top Greenhouse (RTG) in Mediterranean urban areas. Journal of the Science of Food and Agriculture (online first).
Tsikaloudaki, K., Laskos, K., Theodosiou, Th., Bikas, D (2012). Assessing cooling energy performance of windows for office buildings in the Mediterranean zone. Energy and buildings, 49: 192-199
UN (2002). World Summit on Sustainable Development, Johannesburg, South Africa. <http://www.sommetjohannesburg.org/> Accessed 11.05.12
UN (2012). United Nations Conference on Sustainable Development, Rio de Janerio, Brasil. <www.uncsd2012.org> Accessed 11.05.12
134
PART 3 ECO-INNOVATION TO IMPROVE SYNERGY FLOWS IN BUILDINGS IN SPAIN: THE CASE OF ROOFTOP ECO-GREENHOUSE
UNCED (1992). United Nations Conference on Environment and Development (UNCED or the Earth Summit) Rio de Janeiro, Brazil <http://www.un.org/esa/dsd/resources/res_docukeyconf_eartsumm.shtml> Accessed 21.10.12
UNEP (2007). Buildings and climate change status, challenges and Opportunities. United Nations Environment Programme, París.
Wadel, G., Avellaneda, J., Cuchí, A (2010). Sustainability in industrialised architecture: closing the materials cycles. Informes de la Construcción. 62 (517): 37-51
UNFCCC (1998) Kyoto Protocol. United Nations Framework Convention on Climate Change. <http://unfccc.int/resource/docs/convkp/kpeng.pdf> Accessed 11-09-12

135
CONCLUSIONS AND FUTURE RESEARCH
PART 4
PAR
T
4 Conclusions and future research

136
PART 4 CONCLUSIONS AND FUTURE RESEARCH

137
CONCLUSIONS AND FUTURE RESEARCH
PART 4
PAR
T
Conclusions of dissertation
Chapter 7
PHOTOGRAPHY BY ILEANA CERON

138
PART 4 CONCLUSIONS AND FUTURE RESEARCH
This dissertation has presented eco-innovative strategies for buildings, with special
attention paid to energy and CO2 emissions. We are now in a position to formulate
general conclusions.

139
CONCLUSIONS AND FUTURE RESEARCH
PART 4
9.1 Conclusions of methodological aspects The conclusions regarding several tools applied in the Chapters 3 to 6 can be
summarized as follows:
Integration of multidisciplinary tools as a strategy to introduce eco-
innovation in buildings.
LCA has been demonstrated as a tool for decision making in the construction
sector, considering environmental factors in the selection of materials, in
relation to GHG emissions and cumulative energy demand.
The main complexity of the use of LCA in this study was the absence of a
materials database in building sector in Mexico.
It has been observed in the investigation that energy simulation analysis could
help to define better strategies to reduce energy requirements for cooling
and/or heating. It could be used from the planning stage for new buildings or in
the rennovation of existing buildings.
Bioclimatic diagnostic tools could help to determine the need for heating or
cooling in a study site and propose strategies in relation to climatic conditions,
in order to improve comfort in buildings and reduce the use of cooling or
heating systems.
Interdisciplinary participation of experts in seminars can provide a global vision
of the implementation of strategies as a 'Rooftop Eco-Greenhouse'. The
importance of these ‘social tools’ should not be underestimated.
9.2 Eco-innovation in buildings as strategy for sustainable
urban systems. Eco-innovation could reduce the impact that the building sector has on the environment
and energy efficiency could also be improved in this area. General conclusions of several
strategies evaluated in this dissertation can be summarised as follows:
Strategies to reduce energy and GHG emissions in social housing in
Mexico
Indoor strategies of social housing: Eco-technologies
Eco-technologies could potentially provide an annual reduction of 31% of energy
consumption and GHG emissions in social housing. In terms of energy
consumption, the results of this dissertation show that the eco-technological
strategy applied indoors in social housing (scenario with air conditioner) could
provide a reduction of up to 35.7kWh/m2/year, compared with 20kWh/m2/year
in social housing without air conditioning.

140
PART 4 CONCLUSIONS AND FUTURE RESEARCH
Efforts should be focused on providing incentives for users and/or housing
developers to integrate eco-technologies into existing social housing and to
those that will be constructed in the future.
Expanding the results to a social neighbourhood scale (1903 social houses in a
warm-humid climate) show one million of electrical kWh/year could be saved
and 470,000 kgCO2eq emissions could be avoided.
Outdoor (building envelope) strategies for social housing: Shading and insulation
From the four strategies evaluated (Above roof shade, overhangs on walls,
louvers in windows and green roof), above roof shade made with jute-based
material performed the best in relation to the environment and energy.
Strategies were proposed under the premise of being suitable for introduction
in to a social housing unit, without affecting habitability during implementation.
Social house with ‘Above roof shade’ strategy can provide a saving of 27%
compared to a standard house in a warm humid climate (126kWh/m2/year). This
strategy can be installed using local resources and can be implemented at a low
cost.
The embodied energy for jute of ‘Above roof shade’ strategy was 1500 kWh. This
represented a greater energy input in comparison to aluminium, Panel W and
green roof materials. However, this strategy presented major savings in relation
to annual energy cooling requirements, and therefore the payback time was less
than one year. It also showed the greatest reduction of GHG emissions (kg
CO2eq), with savings of 22.8 kg CO2eq/m2/year.
Green roof was other strategy that provided energy benefits, solely due to the
insulating effect. This strategy reduced the annual heat contributions produced
by the roof by 51%, compared with the house without a green roof. The results
show a saving of 22 kWh/m2/year in relation to energy requirements for cooling.
However, this strategy needed the largest amount of energy for materials and
the payback period was 6.5 years.
The payback period for CO2 embodied for green roof materials in relation to CO2
emissions avoided associated with the use of cooling systems, was less than one
year.
Aluminium used for louvers in windows was the major contributor to Global
Warming Potential (2098 KgCO2eq).
Innovation strategy for social housing: Food production in low density cities
Food production in plot and the roof of social house can represent a favourable
strategy for food self-sufficiency and fixation of carbon emissions. This can also
increase security in relation to food production in urban areas.
In expanding the study system (social house) to food production, we have
observed that in this new system-product, it is crucial consider the
141
CONCLUSIONS AND FUTURE RESEARCH
PART 4
environmental impact avoided in relation to food logistics as one of the benefits
gained by introducing food production into cities. According to the results, the
production of tomatoes in social housing areas in Merida (Mexico) could provide
a savings of 662 gCO2eq per kg of tomatoes produced. In descending order, the
main contributors to these savings are transport requirements (57.7%), the
retail phase (37.2%) and re-usable packaging (5.1%).
Carbon fixation for food production (tomato) on plot and roof was 391
kgCO2eq/year. This represents 56% more than the green spaces strategy that
used sedum.
Food production in plot and sedum on roof was the scenario recommended for
social housing. This is in relation to accessibility issues and also prevents
logistical problems of installation. Carbon fixation for this scenario was 301
kgCO2eq/year.
Rooftop Eco.Greenhouse (RTEG) as a synergy concept in relatoin to
buildings in Spain
A list of environmental, economical, technological and social barriers (and the
ways to counter-act the barriers) to the RTEG system have been obtained.
Barriers to implementation RTEG
Several constraints in RTEG challenged the implementation. One of the largest
barriers concerns local regulations regarding installing the greenhouse on the
rooftop. Therefore, it was suggested that the greenhouse should be considered
as a part of the building equipment, instead of a permanent construction. These
legal barriers have been verified and overcome in the pilot project in a catering
service building (Xiringuito Escriba) in Barcelona (See preface section page XIV).
Another constraint was the source of the water: rainwater alone will not be
sufficient to meet crop needs, and drinkable water cannot be used for crop
production. Therefore, some greywater needed to be treated and moved from
the building to the greenhouse.
The lack of simulation models of these agro-architectural hybrid systems was
considered to be a technological barrier.
Eco-design methodologies and environmental tools are recommended, in order
to guarantee the use of low environmental impact materials and techniques.
This will reduce the environment impact of the technologies used in the
scenarios.
In terms of rehabilitation strategies, the structures of some buildings would
need to be strengthened, due to the extra weight of the greenhouse. This would
mainly affect industrial buildings, due to the type of light metal structure
commonly used.

142
PART 4 CONCLUSIONS AND FUTURE RESEARCH
Opportunities to implementation of RTEG
Several benefits, such as the reduction in the transport of foods, provided a
positive environmental effect in relation to reduction of energy consumption
and CO2 emissions.
The existence of financial aids for new eco-innovative products is considered to
be an important incentive for companies.
The surface area of the building rooftops acquires an added value for the owner
since it becomes a mixed-use space.
RTEG could reduce energy costs by improving the energy efficiency of the
building through adapting the eco-greenhouse, as well as reducing water costs
through re-using rain water and grey water.
The promotion of sociability in multi-household buildings and incorporation into
the educational system in educational buildings were considered opportunities
for implementation of these typologies. There would be a positive effect for
industrial buildings in relation to food production and logistics.
The RTEG system has significant potential to be investigated and implemented.
Energy and environmental analysis of RTEG
The conclusions of the energy and environmental analysis of RTEG, are in relation to the
the Mediterranean climate context, during the winter period. The RTEG system is
composed of an office building (410m2) and a mediterranean greenhouse of 310m2.
The energy analysis results indicate that an RTEG system without
interconnection provides contribution of 1kWh/m2 in heating demand saving, in
the study building during winter.
Energy analysis has determined there is a potential of 87 kWh of residual heat
created during in greenhouse during winter day. This energy could be
transferred to the building, in order to reduce heating demand and improve
comfort conditions. However it is necessary to conducted studies in order to
design and evaluate distribution systems.
An efficient system to recover and distribute heat flows in the building could
provide a saving of 79% of the current heating demand of the building, which is
110 kWh for the study day.
The insulation effect represents a savings of 0.80, 0.50 and 0.70KgCO2eq/day in
electric heating, gas and diesel respectively.
The estimated savings in heating demand for the building associated with heat
transferred from greenhouse represents a savings of 34.45, 23.83 and 29.66
KgCO2eq/day in electric heating, gas and diesel respectively.
This study has determined the presence of residual energy in both the
greenhouse and the building. However, it is necessary to increase the period of
simulation and also the number of study systems, in order for more conclusive
results to be obtained.

143
CONCLUSIONS AND FUTURE RESEARCH
PART 4
Future research
Chapter 8
PHOTOGRAPHY BY ILEANA CERON

144
PART 4 CONCLUSIONS AND FUTURE RESEARCH
Chapter 8 focuses on further work that could be undertaken following this dissertation,
and focuses particularly on two potential areas of study. Actions that could lead to the
implementation of research outcomes and the expansion of the research into other
areas are highlighted.
145
CONCLUSIONS AND FUTURE RESEARCH
PART 4
8.1 Strategies to reduce energy and GHG emissions in social
housing in Mexico.
Proposed integration of strategies to reduce energy and GHG emissions with
multidisciplinary assessment tools. Expand assessment of strategies investigated
and propose new strategies in other regions and other orientations of social
housing.
Environmental improvements through the eco-design of each of the strategies
proposed.
Expand the study to evaluate all strategies with an economic approach, paying
special attention to time for payback according to energy saving in houses.
The green roof study could be extended, in order to quantify environmental and
economic benefits and impacts.
Determine the substrate and appropriate plants according to the study
site through laboratory and field studies.
Conduct studies of carbon fixation in species of the region.
Determine the environmental impact of irrigation and maintenance.
Expand social studies, in order to evaluate incentives and perceptions of ‘green
roof’ with inhabitants of social neighbourhoods. Positive aspects, such as
improving the quality of life of the people that work in agriculture, and
negatives aspects, such as the perception that food produced in the city is more
contaminated, should be studied.
Expand the materials proposed for eco-rehabilitation strategies in order to have
a wider range of possible materials and understand their environmental
impacts.
Expand the LCA of materials to all impact categories.
Generate life cycle inventories for the building sector in Mexico.
8.2 Rooftop Eco-Greenhouse in mediterranean cities of Europe
The RTEG system has significant potential to be investigated. There are a number of avenues for research:
An environmental, economic and social assessment of RTEG could take place, in
order to demonstrate the advantages of RTEG in comparison with current
systems of vegetable production.
Design and evaluate an efficient connection and control for exchange of residual
energy, water and CO2 between the RTG and the building below.
Develop a combined set of top-down and bottom-up indicators for measuring
the sustainability performance of RTEG based on attributional LCA, Material and
Energy Flow Analysis (MEFA) and consequential LCA.
146
PART 4 CONCLUSIONS AND FUTURE RESEARCH
Test and evaluate the RTEG operation through pilot tests in different locations
with varied climates.
Develop technology to collect rain water and condensation, and more
importantly, to treat the greywater in the building and process the drainage
water from crop irrigation.
Demonstrate that food produced in rooftop greenhouses connected to the
building below can generate significant benefits, in terms of energy, water and
CO2 flows within a common metabolism.
Determine the technical, agriculture, legal, planning and economic criteria for
facilitating the implementation of RTEG
Analyse in detail each flow that is integrated into the system: water, energy,
CO2, food and materials.
Future research of energy analysis of this dissertation could be summarised as follows:
Expand the number of simulations and energy flow analysis to all year.
Design and assess different interconnection systems and equipment of heat
recovered.
Develop an air quality study for the viability of using heat fluxes from building to
greenhouse.
Extend the study to other building typologies, different construction systems
and percentage of glazed or double skin facade.
Assessment of the energy consumption that is required by the fans to retrieve
and move heat to and from the building.
Extend CFD analysis to all zones of the building and the greenhouse.
Conduct studies in the summer period, in order to analyse the existence and
potential of residual cold for interchange. This would provide an assessment of
the annual balance of RTEG connected to buildings in a Mediterranean climate.
Develop a parametric study to determine the optimal percentage of surface
area of system components (building and greenhouse)
Compare the importance of interconnection with other benefits of RTEG system,
such as food logistics.
All these enhancement strategies aim to facilitate the sustainable development of urban
systems, through researching eco-innovation in the field of improvement of social
housing in developing countries and urban agriculture in compact cities.