strategy, risks and key performance indicators (“kpis”) · contribution to jam or similar...
TRANSCRIPT

42 SpUr CorporAtion ltd INTEGRATED REPORT 2014
StrategyOur vision commits us to making a positive and lasting difference in the lives of our employees, franchisees, communities and the environment. This can only be achieved through running a business that takes a long-term view of sustainability to maximise positive economic, social and environmental impacts. It also requires a strong focus on ensuring effective governance structures and processes are in place.
Our franchisees are a key part of our business for a number of reasons. They are the group’s direct interface with our customers – when they do a good job, our customers leave happy and our franchisees make money. We work closely with our franchisees to ensure that they can build great businesses. This includes:
• analysingtheviabilityoftradingsites;• trainingtheiremployees;• helping them implement the correct procedures to operate
efficiently; and • ensuring they receive the best quality ingredients required to
prepare great tasting food.
The group’s ability to deliver value to our stakeholders is directly tied to the success of our franchisees. The majority of group EBITDA comes from franchise fees, which comprise a percentage of franchisee turnover. We receive a margin of around 3% on supplies sold through our distributor. We also earn income from our majority-owned international and local restaurants, sauce and décor manufacturing facilities, décor unit and exports.
StrateGY, rISkS anD keY perForManCe InDICatorS (“kpIs”)
Our growth strategy targets organic and acquisitive growth across our brands in South Africa and abroad, which now cover the full economic spectrum. We will also consider opportunities for vertical integration where these help to strengthen our strategic positioning, such as the acquisition of the 30% stake in the Braviz Fine Foods rib processing facility. While we have a strong statement of financial position, we will only make an acquisition where this creates overall shareholder wealth and improves return on equity.
Customer satisfaction is another critical area of focus. We are only as good as our last meal – a bad experience at one of our restaurants can damage the trusted brands we have worked so hard to establish. Our quality assurance function assesses our suppliers constantly to ensure our food is of the highest quality. We provide comprehensive training to our franchisees’ employees and operations management teams monitor restaurant performance closely to ensure excellent service and food preparation.
Ensuring that our procurement procedures favour sustainable suppliers improves the sustainability of our own business. We also take our responsibility to run an environmentally responsible company seriously and this extends to our commitment to influencing our suppliers and sharing information with our customers.
Our vision of being passionate people also drives our approach to social sustainability, including our investments in the communities around us through the Spur Foundation, supporting a healthier lifestyle through our sporting sponsorships, our commitment to Broad-based Black Economic Empowerment and the way in which we interact with our own employees.
SuStaInaBLe LonG-terM
returnS
GroW nuMBer oF LoCaL
reStaurantS
SuStaInaBLe LoCaL
FranCHISeS
GroW InternatIonaLLY
SuStaInaBLe BuSIneSS
praCtICeS

SpUr CorporAtion ltd INTEGRATED REPORT 2014 43
key performance indicators (“kpIs”)This table details key historic and target information for Spur Corporation and its brands.
kpI 2011 2012 2013*tarGet
2014 2014tarGet
2015tarGet
2019
financial performance
Operating profit before finance income (Rm) 112.0 168.9 190.6 205.3 194.6 215.0 345.5
Growth in adjusted operating profit (as defined on page 7) 4.4% 26.6% 21.1% 15.0% (2.3%) 11.4% 15.0%
Operating profit margin (as defined on page 7) 32.2% 32.7% 29.7% 29.6% 26.6% 28.0% 34%
Return on equity (as defined on page 7) 21.1% 26.0% 29.7% 27.0% 26.4% 27.0% 28.0%
Return on investment (dividends per share plus change in share price for the year expressed as a percentage of share price at the beginning the year) 18.9% 35.5% 59.3% 15.0% 22.2% 15.0% 15.0%
restaurants
new local restaurants
– Spur 10 12 14 6 9 10 10pa
– Panarottis 7 3 10 5 8 10 8pa
– John Dory’s 3 1 2 4 5 7 4pa
– Captain DoRegos 2 11 11 4 8 10pa
– The Hussar Grill 0 6 3pa
Closed local restaurants
– Spur 6 7 1 6
– Panarottis 5 3 1 1
– John Dory’s 2 – 1 1
– Captain DoRegos 6 13 15
– The Hussar Grill 0
total local restaurants
– Spur 249 254 267 269 270 278 310
– Panarottis 52 52 61 65 68 77 105
– John Dory’s 27 28 29 33 33 38 50
– Captain DoRegos 74 72 81 61 67 99
– The Hussar Grill 6 12 24
relocated#/revamped local restaurants
– Spur 32 64 58 45 68 40
– Panarottis 2 8 7 12 11 8
– John Dory’s 1 1 9 8 3 8
– Captain DoRegos 0 7 2 5
– The Hussar Grill 0 0
* Restated due to the adoption of IFRS10. Refer note 47.3 on page 160 of this report for details of change in accounting policy.# A relocation of a restaurant to a new site in the same general geographical area and where the franchisee remains the same is not considered
a closure. Relocations are necessary as circumstances in areas change over time.

44 SpUr CorporAtion ltd INTEGRATED REPORT 2014
kpI 2011 2012 2013*tarGet
2014 2014tarGet
2015tarGet
2019
total restaurant turnover
– Spur (Rm) 2 703 3 085 3 554 3 911 3 954 4 301 5 648
Percentage growth in restaurant turnover 9.9% 14.2% 15.2% 10.0% 11.3% 8.8%
Percentage growth in existing restaurant turnover 7.9% 11.7% 13.0% 9.3% 9.8% 7.7%
– Panarottis (Rm) 233 268 352 408 450 516 757
Percentage growth in restaurant turnover 4.5% 14.7% 31.4% 16.1% 28.2% 14.7%
Percentage growth in existing restaurant turnover 0.3% 13.0% 22.4% 12.1% 15.2% 10.5%
– John Dory’s (Rm) 194 222 247 295 299 347 541
Percentage growth in restaurant turnover 9.8% 14.2% 11.4% 19.4% 21.0% 16.1%
Percentage growth in existing restaurant turnover 4.5% 11.7% 9.3% 11.2% 12.0% 8.50%
– Captain DoRegos (Rm) 60 191 213 165 165 369
Percentage growth in restaurant turnover 11.5% (13.8%) 0.0%
Percentage growth in existing restaurant turnover 5.5% (16.2%) (5.7%)
– The Hussar Grill (Rm) 29 81 172
– Total worldwide (Rm) 3 489 4 048 4 859 5 424 5 509 6 145 8 684
loyalty
Family Card loyalty spend (Rbn) 0.2 0.8 1.1 1.2 1.7 1.9 2.7
Family Card membership (million) 0.2 1.1 1.4 1.5 1.7 1.9 2.5
Secret Tribe membership (million) 1.1 0.9 1.1 1.1 1.1 1.1 1.4
John’s Club loyalty spend (Rm) 24 36 42 46 71 85 113
John’s Club membership 37 630 50 753 119 891 135 000 166 000 199 000 260 000
Sustainable local franchise model
Number of smaller format Spur outlets 4 7 10 13 12 14 22
Number of Panarottis Pizza Express outlets 4 5 9 11 10 6 12
international expansion
Percentage of international revenue to total group revenue 28.9% 28.6% 31.3% 34.0% 34.4% 33.3% 36.1%
Percentage of international profits to total group profit before income tax (23.9%) 1.9% (3.7%) 3.2% 0.8% 3.4% 8.6%
Number of international outlets 36 48 50 57 52 62 85
Sustainable supply of raw materials
Percentage of suppliers managed by the group that have adequate and appropriate sustainability plans in place 20% 64% 83% 83% 97% 100% 100%
Percentage of seafood products managed by the group that comply with SASSI guidelines 80% 95% 95% 95% 100% 100% 100%
product responsibility
Percentage of suppliers managed by the group that are HACCP/ISO22000 compliant 65% 91% 97% 97% 100% 100% 100%
Percentage of menu items that are rBST and MSG free 93% 93% 93% 93% 98% 100% 100%
* Restated due to the adoption of IFRS10. Refer note 47.3 on page 160 of this report for details of change in accounting policy.

SpUr CorporAtion ltd INTEGRATED REPORT 2014 45
kpI 2011 2012 2013*tarGet
2014 2014tarGet
2015tarGet
2019
Community support
Contribution to JAM or similar organisation (R) 87 412 95 000 582 749 1 300 000 1 309 901 1 900 000 2 600 000
Contribution to FoodBank (corporate and employees) (R) 23 400 21 060 49 300 55 000 49 340 52 000 55 000
Skills development
Number of people trained 4 269 5 171 7 220 8 000 8 565 8 800 9 680
Number of successful graduates of Spur College of Excellence 4 6 13 24 13 24 36
head office employees
Head office employee rotation 20% 10% 8% 10% 17% 10% 10%
Employee loans (education and housing) (R) 163 355 275 682 499 319 500 000 412 957 500 000 500 000
Employee training costs (including dependents’ bursaries) (R) 274 163 499 942 684 303 718 600 1 053 145 1 470 000 1 850 000
environmental sustainability
Corporate
Carbon footprint (Energy kWh) 445 267 475 739 460 000 401 028 401 000 400 000
Percentage of waste recycled or composted 55% 70% 91% 95% 85% 90% 95%
Percentage water usage reductionΔ 0% 10% 15% 15% 15% 15%
Percentage travel reduction
22.1% increase on 2012
12.1% decrease
on 2013
15.6% decrease
on 2013
5% decrease on 2014
10% decrease on 2014
procurement
Percentage takeaway packaging made from renewable materials† 58% 60% 65%
* Restated due to the adoption of IFRS10. Refer note 47.3 on page 160 of this report for details of change in accounting policy.Δ Cumulative percentage reduction compared to baseline audit benchmark at July 2011.† Total weight of packaging amounted to 1 432.8 tons of which 832.3 tons was made from renewable materials and 600.5 tons was made from
non-renewable materials.

46 SpUr CorporAtion ltd INTEGRATED REPORT 2014
Financial performanceGroup operating profit before finance income (but including share of profit/loss of equity-accounted investees) of R194.6 million (2013 restated: R190.6 million) fell short of our target of R205.3 million. Operating profit includes a number of one-off items that are reconciled in the pages that follow to support a fuller understanding of contributors to overall profit. Excluding the impact of these items, comparable operating profit before finance income increased by 9.5% and comparable profit before income tax increased by 9.9%. The difference between these two measures relates to the interest forgone on cash invested in The Hussar Grill and Braviz Fine Foods.
While we had targeted a growth in adjusted operating profit of 15.0%, adjusted operating profit declined by 2.3% for the year. This figure adjusts operating profit for items of headline earnings and foreign exchange gains and losses. Operating profit margin of 26.6% similarly fell short of the 29.6% target as did return on equity at 26.4% (compared to the target of 27.0%).
The main reasons for the shortfall in profitability against target include:
• The adverse swing in the cost of the group’s long-term share-linked employee retention scheme net of the related hedge.
• Write-offs associated with the underperforming Mohawk Spur inWandsworth (UK).
• Professional costs to defend the additional assessments issued bythe South African Revenue Service (“SARS”) in relation to controlled foreign companies.
• Professional costs relating to the international group restructureundertaken to ensure the uninterrupted operation of the international franchise division.
• Legal, due diligence and other costs incurred in acquiring The Hussar Grill.
• CostsassociatedwiththeclosureoftheCaptainDoRegosdistributioncentre.
• Margin declines at the group’s secret sauce factory as the groupabsorbed rising input costs rather than passing the full extent of these on to franchisees.
• The Captain DoRegos franchise division fell short of expectationsas more outlets closed than expected, fewer outlets opened than expected and turnover from existing outlets grew at lower than expected levels as a result of the hardships experienced in the lower LSM target market.
• TheUKperformedworsethanexpectedasturnoverlevelsremainedsubdued amid the slow economic recovery in the region.
• Australia underperformed as planned new store openings weredelayed and the implementation of labour saving point of sale devices could not be implemented during the year.
• Delays in planned new stores and additional investment in humanresource to facilitate future expansion resulted in the Africa division falling short of budget.
The addition of the three company-owned retail outlets in The Hussar Grill has resulted in a marginal decline in the group’s operating profit margin. Retail operations operate at lower margins than the franchise businesses.
The fundamentals of the group’s core activities, comprising the franchise operations of its flagship brands, remain strong. The local franchise business showed healthy growth in a competitive market feeling the impact of constrained economic growth.
operatInG MarGIn anD return on equItY (%)
0
10
20
30
40
141312111009
0
10
20
30
40
Operating pro�t marginReturn on equity
2010
2009
20
11
2012
2013
2014
NUMBER OF STORES
33.3
35.8
32.2
17.6
20.9
21.1
26.0
29.7
32.7
29.7
26.6
26.4
GroWtH In aDJuSteD operatInG proFIt (%)
0
5
10
15
20
25
3015
14
13
12
11
10
09
2010
2009
20
11
2012
2013
2014
NUMBER OF STORES
14.3 14.5
4.4
26.6
20.2
15
-2.3
11.4
0
5
-5
10
15
20
25
30
2014 Target
2015
Targ
et
operatInG proFIt BeFore FInanCe InCoMe (r’m)
0
50
100
150
200
25015
14
13
12
11
10
09
0
50
100
150
200
250
NUMBER OF STORES
96.2
118.5112.0
168.9
190.6 194.6
215.0
205.3
2014 Target
2010
2009
20
11
2012
2013
2014
2015
Targ
et

SpUr CorporAtion ltd INTEGRATED REPORT 2014 47
CoMpArABle operAting profitComparable profit is reconciled in the table below. Please note that this reconciliation does not aim to show sustainable or maintainable profit, but is presented to provide users of this report with an understanding of key items included in profit.
2014r’000
2013*r’000 % CHanGe
profit before income tax 201 871 196 539 2.7%
Australian entity windup costs – 1 052
Captain DoRegos distribution centre closure costs 1 326 –
Foreign exchange (gain)loss (2 616) 6 510
Impairment and associated losses 5 974 2 188
International restructure and tax query costs 2 169 567
Legal costs – John Dory’s – 1 424
Rent review – Cheyenne Spur in 02 Arena in London, England – 603
Panarottis Tuggerah – profit on disposal (2 154) –
Share appreciation rights (net of related hedge) 10 195 (10 711)
Spur Foundation (122) (216)
The Hussar Grill acquisition costs 1 620 –
Trade fair – 640
Comparable profit before income tax 218 263 198 596 9.9%
Net finance income (7 251) (5 909)
Comparable profit before finance income 211 012 192 687 9.5%
* Restated due to the adoption of IFRS10. Refer note 47.3 on page 160 of this report for details of change in accounting policy.
A description of the above exceptional and one-off items that distort profit growth calculations are listed in the table that follows on page 48.

48 SpUr CorporAtion ltd INTEGRATED REPORT 2014
The exceptional and one-off items that distort profit growth calculations are listed in the table below.
IteM 2014 2013
Australian entity wind-up costs Rnil. R1.052 million in winding up certain Australian equity-accounted associates which ceased trading in previous years.
Captain DoRegos distribution centre closure costs
R1.326 million, which includes retrenchment costs of R0.238 million, the loss on asset sales of R0.329 million, the increased cost of working (arising on the sale of assets while still operating) of R0.759 million.
Rnil.
Foreign exchange movements A net gain of R2.616 million, which includes a loss of R0.770 million in realised and unrealised exchange differences and a gain of R3.386 million relating to translation differences of foreign operations (initially taken directly to equity) recycled to profit as the related foreign operations were deregistered or abandoned during the year.
A loss of R6.510 million, which includes a loss of R5.668 million in realised and unrealised exchange differences and a loss of R0.842 million relating to translation differences of foreign operations (initially taken directly to equity) recycled to profit as the related foreign operations were deregistered during the year.
Impairment and associated losses
R2.496 million relates to the impairment of property, plant and equipment of the Panarottis in Blacktown (Australia). R1.866 million relates to the impairment of the franchise rights intangible asset and R1.612 million relates to the accelerated amortisation of leasing rights relating to the Mohawk Spur in Wandsworth (UK).
R2.188 million relating to the impairment of property, plant and equipment of the Panarottis in Tuggerah (Australia).
International restructure and tax query costs
Professional services costs of R2.169 million associated with defending assessments issued by SARS in respect of the group’s controlled foreign companies and the implementation of a restructure to facilitate the uninterrupted operation of the group’s international franchise division as detailed in notes 46.1 and 36.1 on pages 159 and 144, respectively, of the annual financial statements.
Professional services costs of R0.567 million associated with defending assessments issued by SARS in respect of the group’s controlled foreign companies as detailed in note 46.1 on page 159 of the annual financial statements.
Legal costs – John Dory’s Rnil. Professional services costs of R1.424 million in respect of the John Dory’s Franchise (Pty) Ltd shareholder dispute and related Financial Services Board investigation, which was resolved during the prior year.
Rent review (UK) Rnil. The lease in respect of Cheyenne Spur in the 02 Arena in London (UK) is a 25-year lease that is subject to five-year rent reviews. Rental costs are adjusted every five years to market-related amounts. The rent review was only finalised during the prior year but back-dated to January 2012. The prior year thus included an amount of R0.603 million that related to earlier years.
Profit on disposal of Panarottis Tuggerah
The group realised a profit of R2.154 million on the sale of its 80% interest in the Panarottis in Tuggerah (Australia) to the former operating partner of the outlet – see note 35.1 on page 140 of the annual financial statements.
Rnil.
Share-based payments charge in respect of the group’s cash-settled, long-term share-linked retention scheme
R28.117 million – see note 23 on page 132 of the annual financial statements.
R23.645 million – see note 23 on page 132 of the annual financial statements.
Fair value gain on the hedge derivative financial instrument on the retention scheme
R17.922 million – see note 17 on page 128 of the annual financial statements.
R34.357 million – see note 17 on page 128 of the annual financial statements.
Spur Foundation Loss of R0.122 million. While the Spur Foundation is required to be consolidated in terms of IFRS, the full profit/loss is attributable to non-controlling interest.
Loss of R0.216 million. While the Spur Foundation is required to be consolidated in terms of IFRS, the full profit/loss is attributable to non-controlling interest.
The Hussar Grill acquisition costs Legal, due diligence and consulting costs of R1.620 million were incurred in the acquisition of The Hussar Grill franchise and retail outlets during the year. These costs are required to be expensed in accordance with IFRS.
Rnil.
Trade fair costs Rnil. R0.640 million to attend the US National Restaurants’ Association convention in Chicago, USA.

SpUr CorporAtion ltd INTEGRATED REPORT 2014 49
Local restaurant revenue growthSustainable growth in revenue and profits requires Spur Corporation to maintain or grow market share while increasing the number of viable restaurants. Restaurant growth should not be achieved at the expense of quality. The challenges our growth strategy for local restaurant revenues faces are summarised below.
SUitABle SiteS for reStAUrAntSThe group’s history of strong performance and brand recognition has helped our success in securing good locations for our restaurants. There have been fewer large shopping centres built recently than there were in the past decade and competition for restaurant sites is increasing.
We apply rigid site selection criteria based on demographic and spending patterns in the area. Our development team establishes and maintains relationships with property developers, landlords and potential franchisees to ensure that new potential sites are identified as early as possible and matched to appropriate franchisees. Site availability is something of a virtuous cycle – as a brand trades better and becomes more established, landlords become more interested. Spur is already well regarded by landlords and the strong recent performance of Panarottis and John Dory’s has supported access to good locations.
SUitABle frAnChiSeeSPotential franchisees are rigorously assessed to ensure that they have the necessary skills, resources and work ethic to run a successful restaurant. When a restaurant does not perform to expectations, it affects customers, the viability of the franchisee’s business and the brand’s reputation.
The substantial funds required to cover the start-up costs of a restaurant represent a significant hurdle for many prospective franchisees. Therefore, we continue working with financial institutions to facilitate funding for good prospective franchisees. Prospective franchisees may be less inclined to commit funds in the current economic environment, especially in the newer group brands.
We also manage outlet set-up costs to keep these reasonable through a focus on cost and quality of raw materials, efficient use of space and practical functionality in restaurant layouts and blueprints. We match the appropriate outlet model to the opportunity that is presented.
frAnChiSee B-BBee CoMpliAnCeFranchisees’ ability to secure new leases and operating licences such as liquor licences may be linked to their B-BBEE compliance in future. If suppliers are not encouraged and supported to ensure they comply with B-BBEE requirements, the group may not be able to maintain its restaurant and revenue growth targets.
Our approach is to ensure that franchisees are aware of the business imperative of transformation and highlight practical methods for them to achieve transformation within their businesses. Specific plans include:
• Thegroup’stransformationexecutivehostingfranchiseeroadshowson transformation.
• MakinginformationandguidelinesontheB-BBEEscorecardavailableto franchisees.
• Undertakingabaselinestudyonasampleofoutletstoidentifygapsand devise generic transformation strategies for franchisees, and then setting relevant 2020 targets.
• Being vigilant in identifyingopportunities for black franchisees andproviding them with the necessary support.
• Enforcingtheinstallationofa10%blackworkingpartnerinfranchisedrestaurants, to the extent possible.
0
5
10
15
20
2515
14
13
12
11
10
09John Dory's PanarottisSpur
0
5
10
15
20
25
2010
2011
2012
2013
2014
2015
Targ
et
2015
Targ
et
2015
Targ
et
2014
2014
2009
2010
2011
2012
2013
2009
2010
2011
2012
2013
2009
NUMBER OF STORES
Spur Panarottis John Dory’s
2014 Target
eXIStInG reStaurant turnoVer GroWtH (%)
growth in oUr tArget MArKetMarket demographics in South Africa are shifting and we believe that growth in our middle to higher LSM target markets will continue, although at a slower rate than in the past decade. Consumers in the lower LSM markets served by Captain DoRegos remain under pressure.
Our strategy is to attract more customers into our restaurants through excellent food, good service, competitive specials and targeted marketing initiatives. We also incentivise increased average spend per visit through upselling and through our loyalty programmes. Our continued investment in business intelligence improves our understanding of customer behaviour and market research helps us to identify and respond to changes in consumer trends. Uptake of loyalty cards in Spur and John Dory’s is growing strongly and spend from card holders in June 2014 accounted for 44% of total sales at Spur and 24% at John Dory’s. We keep our restaurants attractive through ongoing revamps and where necessary, through relocating outlets to better trading sites.
ChAnging ConSUMer tASteSMarket share growth depends on our ability to continue meeting changes in consumers’ taste profiles, keeping our product offerings relevant and ensuring that our restaurants always meet our customers’ needs and wants. We monitor this through market research, our business intelligence and through constant interactions with our franchisees and customers. We constantly re-evaluate our menu to ensure that it remains topical and that we give consumers what they want.

50 SpUr CorporAtion ltd INTEGRATED REPORT 2014
Financially successful franchisees keep their customers happy, contribute more to group franchise fee income, build our brands and make them more attractive for future potential franchisees and landlords. We focus on maximising the proportion of our outlets achieving model cash flow margins and increasing the number of smaller format outlets.
Model CASh flow MArginS Under preSSUreRising administered costs such as property rates and taxes, electricity and fuel costs are a concern for all businesses in South Africa. Employment costs are rising due to the implementation of minimum wage rates and sectoral determinations above inflation. Food inflation has consistently run ahead of overall CPI figures and where our brands use imported ingredients, these have been affected by the weakening of the rand. Certain of the above factors have contributed to increased occupancy costs as landlords look to pass on these increases to their tenants. The net result is a squeeze on franchisee operating margins.
With these trends also directly affecting consumers’ discretionary spending, consumers are increasingly focused on quality and value for money. This makes it difficult to pass on increasing input costs to consumers without affecting our competitive advantage and value proposition. While it is unavoidable that some of these costs will be passed on to consumers, we try to minimise menu price increases as much as possible. To reduce the impact on franchisee margins, it is necessary to work smarter to improve efficiency within the franchise system.
We work closely with our franchisees to ensure their financial sustainability. Franchise financial models are reviewed and revised on at least an annual basis to ensure that franchisee cash flow profit margins are maintained. Our operations management teams regularly review restaurant financial information to identify potential inefficiency and proactively work with franchisees to address these.
We review all aspects of the franchise model to manage costs as effectively as possible to ensure that our franchisees can continue generating a reasonable return on their investment. Areas of specific focus include:
• Designing restaurants tokeep set-upcosts as lowaspossiblewhilemaintaining high standards.
• Managinggrossmarginstocompensateforthemedium-termtrendswe anticipate in utilities, labour costs and occupancy costs.
• Expandingtheoutsourceddistributionmodel tofacilitateobtainingthe best pricing of raw materials, while maintaining consistent quality and ensuring sustainable supplier practices.
• Menu engineering to optimise sales mix, food cost and productrange, which can help to reduce labour and occupancy costs and increase energy efficiency.
• Developing training material and delivering training to franchiseeemployees and management to ensure efficient use of employees and human resource planning.
• Implementing lessons learned from the higher labour-cost modelsencountered in the UK and Australia.
• Assistingfranchisees innegotiatingwith landlordstomanagerentalescalations and related costs as much as possible.
• Investigatingandcommunicatingwaystomanageelectricity,gasandwater usage to franchisee employees and management. Efficient use of these costly resources also helps to reduce the environmental impact of the group.
SMAller forMAt reStAUrAntSSmaller format restaurants allow franchisees to set up in areas where the demographics might not justify a standard format outlet. This mainly applies to Spur and Panarottis. While these smaller outlets generate less turnover than a standard outlet, the set-up costs are lower and operational efficiencies better, which translate into good returns on investment for franchisees.
We rolled out two smaller format Spur outlets and opened one Panarottis Pizza Express outlet. We are refining our business models and identifying good sites for the potential expansion of these formats. We have found that some Panarottis Pizza Express outlets become so well established in a particular market that they justify conversion to a full sit-down Panarottis restaurant. We will be converting three such Express outlets in the 2015 financial year.
With the imminent entry of international brands into the local takeaway pizza market, we expect competition to increase significantly. Therefore, we have decided to take time to evaluate the risks and opportunities arising from this development before actively rolling out more Panarottis Pizza Express outlets.
Sustainable local franchise model
eXIStInG reStaurant
turnoVerGroWtH
%
totaL reVenue
rm
nuMBer oF LoCaL outLetS
nuMBer oF reVaMpS/
reLoCatIonSLoYaLtY
MeMBerSHIp
LoYaLtY SpenD
rm
Spur Steak Ranches 7.7 4 301 278 40 1 900 000 1 900
Panarottis Pizza Pasta 10.5 516 77 8 – –
John Dory’s Fish Grill Sushi 8.5 347 38 8 199 000 85
Captain DoRegos (5.7) 165 67 5 – –
The Hussar Grill N/A 81 12 – – –
targets for 2015
We opened more outlets than targeted in each brand apart from Captain DoRegos where closures of underperforming outlets resulted in the total number of outlets declining to 61 at year-end (2013: 72).
Existing restaurant turnover (total turnover adjusted to exclude new outlets opened during the current year) grew above target for Spur, Panarottis and John Dory’s. However, this declined in Captain DoRegos
due to the closure of 15 outlets during the year, exacerbated by the highly competitive market in which the brand operates and the impact of the economic slowdown on its target consumers. Comparative data is not provided for The Hussar Grill as it has only been included for the six-month period since its acquisition in January 2014.

SpUr CorporAtion ltd INTEGRATED REPORT 2014 51
0
2
4
6
8
10
12
1415
14
13
12
11
10
Panarotti Express Smaller format Spur outlets0
2
4
6
8
10
12
14
NUMBER OF STORES
Smaller format Spur outlets
Panarottis Pizza Express
2010
2011
2012
2013
2014
2015
Targ
et
2010
2011
2012
2013
2014
2015
Targ
et
2014 Target
Menu prICe InFLatIon anD FooD InFLatIon (%)MENU PRICE INFLATION AND FOOD INFLATION
0
2
4
6
8
10
12
0
2
4
6
8
10
12
Food in�ation*
Spur
PanarottisJohn Dory’s
Oct
-11
Ap
r-11
Jul-
11
Jan
-11
Oct
-10
Jul-
10
Oct
-12
Ap
r-12
Jul-
12
Jan
-12
Jul-
13
Ap
r-13
Jan
-13
Oct
-13
Ap
r-14
Jun
-14
Jan
-14
* Source: STATSSA
SMaLLer ForMat outLetS
tarGetS For 2014 aCHIeVeD In 2014 tarGetS For 2015
Open three smaller format Spur outlets Two smaller format Spur outlets opened Open a further two smaller format Spur outlets
Open two Panarottis Pizza Express outlets One Panarottis Pizza Express outlet opened No new Panarottis Pizza Express outlets to be opened in 2015, while three existing Panarottis Pizza Express outlets are to be converted to full sit-down offering

52 SpUr CorporAtion ltd INTEGRATED REPORT 2014
The group evaluates growth opportunities continuously in South Africa and internationally. We analyse potential new international opportunities carefully to ensure we have a good understanding of local demographics, spending patterns and market conditions. The UK and Australia have significantly higher labour and occupancy costs than the South African market. The rest of Africa offers exciting opportunities for growth, balanced by challenges in securing suitable sites at a reasonable cost, placing skilled employees and ensuring consistent delivery of quality ingredients.
The retail business in the UK and Australia – where the group directly owns and operates certain restaurants – adds financial risk to our business model and we monitor this aspect of the business particularly closely. The UK and Australia remain self-funding.
The high set-up cost of a full Spur Steak Ranch in the UK is proving to be a significant obstacle to pursuing a franchise business model, which is the group’s ultimate strategy. In response to this, the Spur RBW (Ribs Burgers Wings) high street model is being developed and we anticipate our first pilot store in the 2015 financial year. This model will be a smaller, counter service concept that will offer essentially ribs, burgers and chicken wings. This allows for a lower set-up cost, more manageable occupancy costs and reduces labour. The group will invest in the pilot stores to demonstrate their financial feasibility, but it is anticipated that the model will be an attractive franchising opportunity.
The group is intending to dispose of its interests in the three remaining retail outlets in Australia, which will then operate on a franchise basis, in order to focus resources on expanding the franchise business in that region. Our focus remains on rolling out franchised outlets in Australia, the rest of Africa and Mauritius.
International revenue comprised 34.4% of group revenue for the financial year, marginally exceeding target and benefiting from the depreciation of the rand. Profit before income tax includes impairments and write-offs associated with the Panarottis outlet in Blacktown (Australia) – amounting to R2.5 million – and Mohawk Spur in Wandsworth (UK) – amounting to R3.5 million – as well as one-off costs associated with an international restructure required to ensure the uninterrupted operation of the international franchise business amounting to R1.7 million. This resulted in us missing our target of 3.2% of total profit before income tax being contributed by international operations. We also did not end the year with as many international outlets as we had planned due to delays in the development of locations for planned restaurants.
On a comparable basis, operating profit from the international operations increased by 49.2%.
0
10
20
30
4015
14
13
12
11
10
09
0
10
20
30
40
-25
-20
-15
-10
-5
0
5
15141312111009
-25
-20
-15
-10
-5
NUMBER OF STORES
30
2729 29
31
3434
% International revenue to group revenue
% International pro�ts to total group pro�t
2014 Target % international revenue to group revenue
2009
2010
2011
2015
Targ
et
2013
2014
2012
33
International expansion
0
10
20
30
40
50
60
7015
14
13
12
11
10
09
0
10
20
30
40
50
60
70
2010
2009
20
11
2012
2013
2014
NUMBER OF STORES
3538
36
4850
52
62
57
2015
Targ
et
2014 Target
nuMBer oF InternatIonaL outLetS
perCentaGe oF InternatIonaL reVenue anD proFIt
tarGetS For 2014 aCHIeVeD In 2014 tarGetS For 2015
International revenue 34.0% of total group revenue
International revenue comprised 34.4% of group revenue
International revenue 33.3% of total group revenue
International profits 3.2% of total group profit International profits comprised 0.8% of total group profit
International profits 3.4% of total group profit
57 international outlets 52 international outlets 62 international outlets

SpUr CorporAtion ltd INTEGRATED REPORT 2014 53
0
20
40
60
80
100
12015
14
13
12
11
100
20
40
60
80
100
2010
20
11
2012
2013
2014
NUMBER OF STORES
20
64
10
8383
97100
2014 Target
2015
Targ
et
SuStaInaBLe SuppLIerS* (%)
* Suppliers managed by the group that have adequate and appropriate sustainability plans in place
* Seafood suppliers managed by the group that comply with SASSI guidelines
0
20
40
60
80
100
12015
14
13
12
11
10
0
20
40
60
80
10020
10
20
11
2012
2013
2014
NUMBER OF STORES
60
80
95 9595
100 100
2014 Target
2015
Targ
et
Our restaurant brands use significant quantities of raw materials. The chicken the group buys in a year weighs as much as 19 Boeing 747s. If all the potato chips we bought in a year were laid end to end, they would stretch nine times the length of the Great Wall of China. The group uses enough cooking oil in a year to fill an Olympic sized swimming pool and buys enough juice and water to fill 30 family-sized swimming pools.
Therefore, it is critically important that the supply of our raw materials is consistent, predictable and of the highest quality. High volume foods we use include beef, chicken, pork, seafood, potatoes and cheese. We have established relationships with multiple reputable suppliers to ensure that the group is not exposed to a single supplier across our core products. These include local and foreign suppliers where necessary and we try to ensure that alternative suppliers are separated geographically to limit the impact of a regional event.
The group acquired an interest in Braviz Fine Foods, a start-up rib processing factory, to better manage the supply of this key product. This facility is due to commence production in December 2014.
The supply of raw materials may be disrupted by a number of factors over the long term. Social and labour unrest could interrupt supply. There were several strikes at our suppliers during the year. While contingency plans were in place and production facilities ran on skeleton staff, inventory levels were pressured. Spur Corporation’s strong long-term relationships with key suppliers help us to flag possible supply interruptions early and allow contingencies to be implemented timeously.
Climate change is likely to lead to shifting weather patterns that may negatively affect food production. Over time, stress on food producers to meet the rising demands of the growing world population will increase. In the short term, shifts in the availability of raw materials affect food prices, which in turn put pressure on franchisee margins. As a responsible corporate citizen, Spur Corporation needs to work closely with its suppliers to ensure that they use sustainable practices so the group will have access to the food it needs at a reasonable price.
Our procurement department specifies sustainable practices in the criteria it applies when selecting preferred suppliers. These include seafood suppliers’ adherence to Southern African Sustainable Seafood Initiative (SASSI) guidelines. All seafood products supplied by the group locally are on the SASSI green list. We review our key suppliers’ sustainability plans and processes annually to ensure that they apply sustainable practices that align with group values.
Sustainable supply of raw materials
SaSSI SuppLIerS* (%)
knoW Your SeaFooD! SMS tHe naMe oF tHe FISH to 079 499 8795 to CHeCk on tHe SuStaInaBILItY oF tHe SpeCIeS. VISIt WWW.WWFSaSSI.Co.za
GoaLS For 2014 aCHIeVeD In 2014 GoaLS For 2015
83% of suppliers managed by the group have adequate and appropriate sustainability plans in place
97% of suppliers managed by the group have adequate and appropriate sustainability plans in place
100% of suppliers managed by the group have adequate and appropriate sustainability plans in place
95% of seafood suppliers managed by the group comply with SASSI guidelines
All seafood products procured centrally are on the SASSI green list.
Maintain 100% of seafood products managed by the group to comply with SASSI guidelines

54 SpUr CorporAtion ltd INTEGRATED REPORT 2014
The final product we promise our customers is great food and excellent service in a welcoming family environment. This quality must be delivered consistently across our restaurants and each time our customers return. We know that we are only as good as the last meal we serve and with the broad reach of social media, we understand that any interaction that may affect customer goodwill can have an impact on our brands.
Some of the preventative and qualitative measures undertaken are as follows:
• We train our franchisees’ employees in food preparation, customer service, food safety and the other relevant areas necessary to ensure that they have the knowledge and tools to deliver the quality products and service our customers demand.
• Operations managers regularly visit each restaurant to monitor quality through checks of food quality, specifications and portion sizes of certain products in store, including meat and oil.
• The group has implemented Hazard Analysis and Critical Control Points (“HACCP”) compliance at our own manufacturing facilities and monitors the compliance of our suppliers and our outsourced distributor to ensure the highest standards of food safety are applied.
• New suppliers are subjected to a capability assessment process that includes a review of their HACCP and/or ISO22000 compliance.
• Major suppliers are regularly audited to assess their performance against their capability assessment. We actively encourage suppliers who are not HACCP and/or ISO22000 to become compliant. The group engages an independent third party to conduct specialised food safety audits at suppliers.
The group is also committed to ensuring that as far as possible, customers and employees are protected from personal injury and loss. We invest time, money and effort in educating franchisees about their health and safety legal obligations. However, the onus remains on franchisees to ensure that they are compliant with the applicable legislation, franchise agreement and group operating standards.
We support our customers to make informed decisions about their diet. Spur provides a full nutritional analysis of its entire menu on its website (www.spur.co.za/nutrition). Panarottis is in the process of completing a similar exercise, although the recent changes to the menu have delayed the process. We aim to eliminate MSG from the food we serve – 98% of the products on our menus are MSG free – although alternative products without MSG can be significantly more expensive.
0
20
40
60
80
100
120Menu items that are rBST and MSG free
HACCP / ISO22000 Compliant Suppliers
151413121110
0
40
20
60
80
100
120
2010
20
11
2012
2013
2014
NUMBER OF STORES
5965
93 93 979391
HACCP/ISO22000 Compliant suppliers
Menu items that are rBST and MSG free
2014 Target: Menu items that are rBST and MSG free
2014 Target: HACCP/ISO22000 compliant suppliers
2015
Targ
et
100 100 10098
9397
HaCCp/ISo22000 CoMpLIanCe anD Menu IteMS (%)
product responsibility
GoaLS For 2014 aCHIeVeD In 2014 GoaLS For 2015
97% of suppliers managed by the group are HACCP/ISO22000 compliant
100% of suppliers managed by the group are HACCP/ISO22000 compliant
100% of suppliers managed by the group remain HACCP/ISO22000 compliant
93% of menu items are rBST and MSG free 98% of menu items are rBST and MSG free 100% of menu items are rBST and MSG free

SpUr CorporAtion ltd INTEGRATED REPORT 2014 55

56 SpUr CorporAtion ltd INTEGRATED REPORT 2014
Community supportThe Spur Foundation was established on Mandela Day, 2012 to manage and coordinate the group’s corporate social investment (“CSI”) initiatives. The Foundation was funded with a R670 000 donation from the Spur group. The value of the donation resonates with the ’67 minutes’ theme of Mandela Day, and recognises the founding of the Spur family in 1967. In July 2014, the group announced the proposed donation of 500 000 treasury shares over a period of five years to the Spur Foundation. This donation, approved by shareholders on 3 October 2014, will provide annuity income to sustain the Spur Foundation’s ongoing charitable donations.
The activities of the Foundation align with our vision to make a positive and lasting difference in the lives of our communities and our core value of generosity. The Foundation aims to uplift and improve the lives of South Africa’s families, with a special emphasis on assisting children.
The Foundation supports initiatives that administer feeding schemes and provide basic necessities and amenities to assist children in impoverished communities. The activities of the Foundation are available through the Foundation’s social media campaigns on Facebook and Twitter (@spur_cares).

SpUr CorporAtion ltd INTEGRATED REPORT 2014 57
Current BeneFICIarIeS oF tHe Spur FounDatIon
Franchisees are encouraged to get involved in initiatives that support their surrounding communities, joining hands with the Spur Foundation to contribute towards the identified needs of selected charities in the major provinces. The group encourages employees to offer up their time in support of worthy causes and has a voluntary employee salary deduction scheme.
More detail on these and the Foundation’s other beneficiaries is available on our website at www.spurcorporation.co.za.
0
200000
400000
600000
800000
1000000
1200000
1400000CSI investment*
151413:12111009 0
500 000
1 000 000
1 500 000
2 000 000
2 500 000
2010
2009
20
11
2012
2013
2014
NUMBER OF STORES
157 826223 615
110 812116 060
632 049
1 359 241
1 952 000
2015
Targ
et
0
200000
400000
600000
800000
1000000
1200000
1400000CSI investment*
151413:12111009
2014 Target
1 355 000
CSI InVeStMent* (r)
* Includes voluntary employee salary deductions
Spur Corporation also encourages families and children to improve their health while having fun and experiencing the Spur taste for life through supporting numerous community-focused events aimed at uplifting communities through sport. Funds raised from these events support feeding schemes.
Total CSI spend including voluntary employee salary deductions was R1 359 241 in 2014 (2013: R632 049), representing 1.0% of net profit after income tax, in line with our goal.
More detail on these and the other events the group supports is available on our website at www.spurcorporation.co.za.
GoaLS For 2014 aCHIeVeD In 2014 GoaLS For 2015
CSI investment R1.355 million CSI investment R1.360 million CSI investment R1.952 million

58 SpUr CorporAtion ltd INTEGRATED REPORT 2014
peopLe traIneD
0
1000
2000
3000
4000
5000
6000
7000
8000
900014
13
12
11
0
1 000
2 000
3 000
4 000
5 000
6 000
7 000
8 000
9 000
10 000
20
11
2012
2013
2014
4 269
5 171
7 220
8 565
9 680
8 000
2014 Target
2015
Targ
et
Spur CoLLeGe oF eXCeLLenCe GraDuateS
0
5
10
15
20
25
3014
13
12
11
0
5
10
15
20
25
30
20
11
2012
2013
2014
NUMBER OF STORES
4
6
13 13
2424
2014 Target
2015
Targ
et
Skills developmentOngoing training and development of group and franchisee employees is an important way in which we ensure the long-term sustainability of the group and its brands. Our training programmes support the highest standards of food quality and service at our restaurants and contribute to the personal development of franchisee and corporate employees.
Skills development initiatives are also important to address the declining numeracy and literacy skills in South African school leavers. This challenge makes it difficult for franchisees to identify and recruit suitably qualified employees to run and manage their restaurants, and for the group to attract employees who match our work ethic and culture.
groUp eMploYee trAiningThe group spent R769 482 in 2014 on skills development initiatives for corporate employees. Training covered various areas including client service, business writing, office IT skills, assertiveness/conflict resolution, legislative compliance, literacy and numeracy, management and leadership, and technical skills.
Employee development initiatives have enabled us to maintain knowledge and capacity where business areas have been affected by employee turnover.
frAnChiSee eMploYee trAiningSkills development of franchisee employees is one of the most important ways in which the group supports its franchisees to run successful businesses. It is also a way in which the group can ensure that it continues to build its brands and foster consumer support, through ensuring that every visit to a group restaurant is a fun and satisfying experience.
Skills development initiatives take place through a number of channels discussed below.
Spur training academy courses Training courses are delivered to franchisee employees through training centres in Johannesburg and Cape Town. Skills development focus areas include food preparation and food safety, operational efficiencies, financial management, sales techniques, management skills environmental awareness and customer safety. During 2014, 8 565 franchisee and corporate office employees were trained through internal and external workshops, an 18.6% increase on 2013.
The Spur Steak Ranch Management Prestige Training programme was implemented during 2014. The programme features six modules of two weeks each. Trainees that complete each module receive visible recognition of their achievements through graded caps and shirts that form part of the employee uniform. Management Prestige Training programmes for Panarottis and John Dory’s are currently under development.
practical training Practical training to ensure franchisees and management are capable of operating all aspects of a franchise business is delivered at accredited training restaurants in Gauteng, KwaZulu-Natal and the Western Cape. During 2014, 198 people were trained in these restaurants.
Spur College of excellenceThe Spur College of Excellence is based in Johannesburg and Cape Town and underwent facility upgrades to provide a better learning environment. The College is accredited with the CATHSSETA and aims to build capacity at middle management and above. The comprehensive six-month course covers all aspects of operating and managing one of our franchise outlets through lectures, practical training and workshops. The College produced 13 graduates with 12 more delegates entering the programme in August 2014.
GoaLS For 2014 aCHIeVeD In 2014 GoaLS For 2015
8 000 employees trained (franchise and corporate)
8 565 delegates were trained 8 800 employees trained
24 Spur College of Excellence graduates 13 graduates 24 Spur College of Excellence graduates
SpUr CorporAtion ltd INTEGRATED REPORT 2014 59
Spur Corporation is a proudly South African company and fully supports the principles of transformation and Broad-based Black Economic Empowerment (B-BBEE). Transformation and employment equity are driven by the group transformation executive.
Our main transformation focus this financial year has been on improving the group’s employment equity profile and finalising the strategic empowerment transaction that was announced at the end of July 2014.
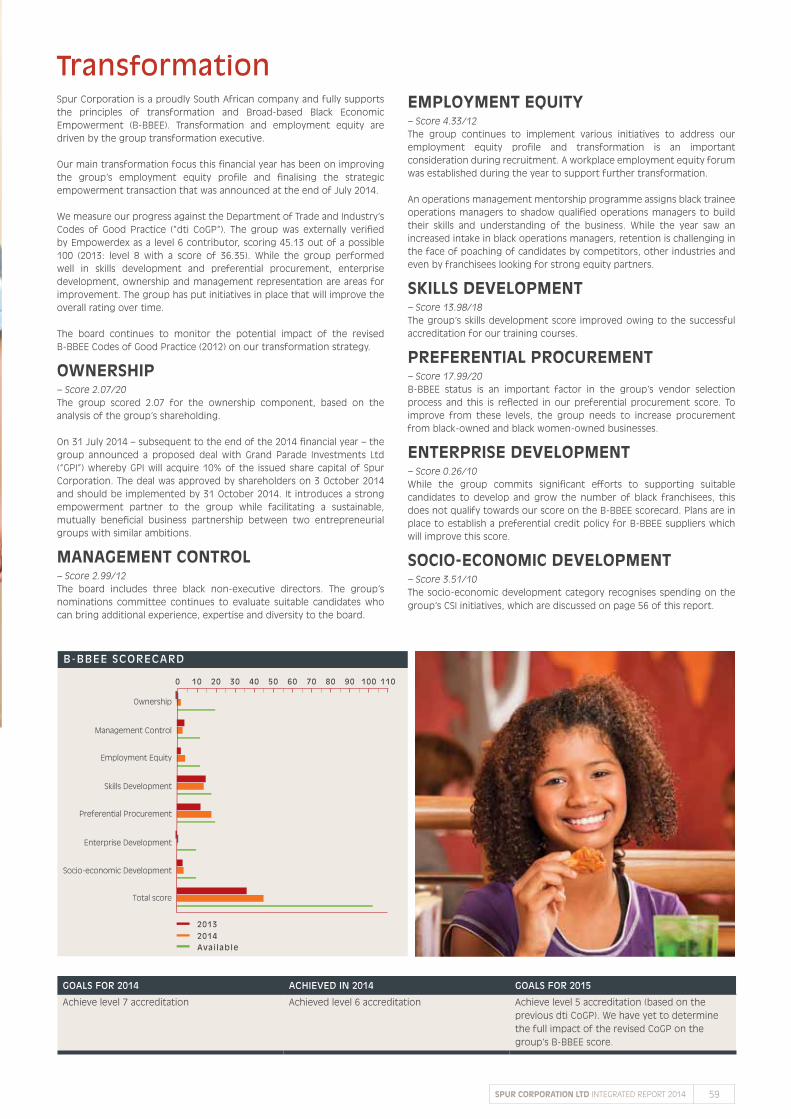
We measure our progress against the Department of Trade and Industry’s Codes of Good Practice (”dti CoGP“). The group was externally verified by Empowerdex as a level 6 contributor, scoring 45.13 out of a possible 100 (2013: level 8 with a score of 36.35). While the group performed well in skills development and preferential procurement, enterprise development, ownership and management representation are areas for improvement. The group has put initiatives in place that will improve the overall rating over time.
The board continues to monitor the potential impact of the revised B-BBEE Codes of Good Practice (2012) on our transformation strategy.
ownerShip– Score 2.07/20The group scored 2.07 for the ownership component, based on the analysis of the group’s shareholding.
On 31 July 2014 – subsequent to the end of the 2014 financial year – the group announced a proposed deal with Grand Parade Investments Ltd (“GPI”) whereby GPI will acquire 10% of the issued share capital of Spur Corporation. The deal was approved by shareholders on 3 October 2014 and should be implemented by 31 October 2014. It introduces a strong empowerment partner to the group while facilitating a sustainable, mutually beneficial business partnership between two entrepreneurial groups with similar ambitions.
MAnAgeMent Control– Score 2.99/12The board includes three black non-executive directors. The group’s nominations committee continues to evaluate suitable candidates who can bring additional experience, expertise and diversity to the board.
eMploYMent eqUitY– Score 4.33/12The group continues to implement various initiatives to address our employment equity profile and transformation is an important consideration during recruitment. A workplace employment equity forum was established during the year to support further transformation.
An operations management mentorship programme assigns black trainee operations managers to shadow qualified operations managers to build their skills and understanding of the business. While the year saw an increased intake in black operations managers, retention is challenging in the face of poaching of candidates by competitors, other industries and even by franchisees looking for strong equity partners.
SKillS developMent– Score 13.98/18The group’s skills development score improved owing to the successful accreditation for our training courses.
preferentiAl proCUreMent– Score 17.99/20B-BBEE status is an important factor in the group’s vendor selection process and this is reflected in our preferential procurement score. To improve from these levels, the group needs to increase procurement from black-owned and black women-owned businesses.
enterpriSe developMent– Score 0.26/10While the group commits significant efforts to supporting suitable candidates to develop and grow the number of black franchisees, this does not qualify towards our score on the B-BBEE scorecard. Plans are in place to establish a preferential credit policy for B-BBEE suppliers which will improve this score.
SoCio-eConoMiC developMent– Score 3.51/10The socio-economic development category recognises spending on the group’s CSI initiatives, which are discussed on page 56 of this report.
B-BBee SCoreCarD
0 30 60 90 120 150
Target
Score
Total score
Socio-economic Development
Enterprise Development
Preferential Procurement
Skills Development
Employment Equity
Management Control
Ownership
Total score
Socio-economic Development
Enterprise Development
Preferential Procurement
Skills Development
Employment Equity
Management Control
Ownership
0 10 20 30 40 50 60 70 80 90 100 110
0 10 20 30 40 50 60 70 80 90 100 110
20132014Available
NUMBER OF STORES
transformation
GoaLS For 2014 aCHIeVeD In 2014 GoaLS For 2015
Achieve level 7 accreditation Achieved level 6 accreditation Achieve level 5 accreditation (based on the previous dti CoGP). We have yet to determine the full impact of the revised CoGP on the group’s B-BBEE score.

60 SpUr CorporAtion ltd INTEGRATED REPORT 2014
Successful execution of Spur Corporation’s strategy is critically dependent on our ability to identify and attract passionate people with the right attitude and cultural fit. Our skills development initiatives demonstrate our commitment to investing in the growth of our people. Retaining employees depends on creating a work environment that is stimulating and rewarding, and linking good performance to competitive remuneration. The group values the diversity of its workforce as an asset to the company and seeks to create equal opportunities for all deserving employees. We do not tolerate discrimination of any form.
The group has a formalised disciplinary and grievance policy and procedures in place and these are communicated to all employees.
The main human capital challenges the group faces are ensuring the continued transformation of the workforce, attracting and retaining high-calibre people and ensuring that the group’s management and leadership pipeline has the skills, support and diversity to meet the requirements of our business strategy.
Total South African permanent employees increased 32% to 368 in 2014, due largely to the acquisition of the three The Hussar Grill retail outlets in January 2014.
The number of learners attending the group’s adult education training (“AET”) programme increased and the training courses were extended to include Gauteng employees. We continued the management assessment process and began developing the contents of the management development programme. The group’s standard performance appraisal process includes a training and development analysis, which is to be completed by all local corporate employees and their respective line managers. A focused employee engagement initiative was rolled out across the sauce factory and décor manufacturing divisions.
The leadership skills needs analysis initiated last year continued. This project forms part of the group leadership development programme and will be extended to include more managers in the year ahead. Succession planning progressed as the focus narrowed to include only the identified core, critical employees for monitoring, support and coaching. A Spur Group Competency Framework has been designed and crafted, which forms part of our leadership journey. This competency framework is intended to act as a compass in all recruitment, development and talent retention engagements.
Refinements to our operational health and safety programme have been rolled out in the décor manufacturing division and will be extended to the sauce factory during 2015.
eMpLoYee traInInG CoStS (r)
0
200000
400000
600000
800000
1000000
1200000
1400000
160000015
14
13
12
11
10
09
0
200 000
400 000
600 000
800 000
1 000 000
1 200 000
1 400 000
1 600 000
2010
2009
20
11
2012
2013
2014
NUMBER OF STORES
262 001259 489
274 163
499 942
1 470 000
684 303
1 053 145
718 600
2015
Targ
et
2014 Target
HeaD oFFICe eMpLoYee rotatIon (%)
0
5
10
15
20
2515
14
13
12
11
10
09
0
5
10
15
20
25
NUMBER OF STORES
1112
20
10
8
17
1010
2014 Target
2009
2010
2011
2012
2013
2014
2015
Targ
et
totaL SoutH aFrICan-BaSeD perManent eMpLoYeeS
0
50
100
150
200
250
300
350
40014
13
12
11
10
09
0
50
100
150
200
250
300
400
350
2010
2009
20
11
2013
2012
2014
NUMBER OF STORES
182 184 186
250
279
368
Head office employeesThe group’s employees are not unionised and there were no strikes at group operations during the year.
The group offers financial support to assist employee upliftment, including paying for business-related studies and offering loans for education, housing and other requirements.
The group invested R1 053 145 in employee training during the financial year (excluding internal time), an increase of 53.9% on 2013 and ahead of our target for the year of R718 600. This figure includes group funding of tertiary studies for employees and bursaries for the education of employees’ dependants. Retrenchments linked to the closure of the Captain DoRegos distribution centre at the end of October caused head office employee rotation to increase to 17% in 2014 from 8% in 2013, well above our long-term target of 10%.

SpUr CorporAtion ltd INTEGRATED REPORT 2014 61
GoaLS For 2014 aCHIeVeD In 2014 GoaLS For 2015
Head office employee rotation 10% 17% 10%
Employee loans R500 000 Employee loans R412 957 Employee loans R500 000
Employee training costs (including bursaries to dependents) R718 600
R1 053 145 R1 470 000
CASe StUdY
The basic skills of reading and writing are not only fundamental requirements for work, they are
critically important tools to enable personal and career development.
It is estimated that close to four million South africans are unable to read and write. Spur Corporation’s aet programme not only boosts productivity and performance, and creates meaningful opportunities for employees, but it also builds self-esteem in the individual and helps to make South africa a better country.
our aet programme is available to head office employees in Cape town and Johannesburg as well as to employees from the sauce factory and décor manufacturing divisions. the programme includes both computer-based and book-based learning as well as facilitation once a week. the company accommodates two hours per week during working hours, and the learner needs to complete one hour in their own time. the courses begin with english literacy and once learners have completed these modules they move onto mathematical literacy.
the second phase of the project completed in September 2013 with 17 learners enrolled, of which 14 completed the course. all those who completed the course passed their final exams. all the learners were from historically disadvantaged groups, 29% were women and 71% men.
the third phase of the project ran from november 2013 to June 2014 and 16 learners wrote and passed exams, while seven rolled over onto the next level of studies. Women comprised 47% of the learners and all learners were from historically disadvantaged groups.
the aet course has strong support within Spur Corporation and at the end of each course participants are recognised at a ceremony where the chief executive officer personally hands out the certificates of achievement. as a direct result of the programme, employees have been able to access opportunities that were previously closed to them.

62 SpUr CorporAtion ltd INTEGRATED REPORT 2014
Spur Corporation’s commitment to transformation includes a commitment to transforming the demographic profile of our workforce. This principle is enshrined in the group’s human resources policies, which align with employment equity legislation and aim to eliminate discrimination in the group and promote transformation and employment equity. The group established a workplace employment equity committee, which includes appropriately diverse representation from all race groups, to support this process.
Senior and junior management representation improved in 2014. However, identifying, developing and retaining employees with the required skills and industry experience for top management is an ongoing challenge. While the number of black middle managers increased from four in 2013 to nine in 2014, the overall increase in middle management diluted the increased number in percentage terms.
2014 2013
oCCupatIonaL LeVeL MAle feMAle totAl BlACK* white MaLe FeMaLe totaL BLaCk* WHIte
Top management 5 1 6 – 6 5 1 6 – 6
Senior management 15 5 20 4 16 24 4 28 4 24
Professionally qualified and experienced specialists and mid-management 27 11 38 9 29 9 7 16 4 12
Skilled technical and academically qualified workers, junior management, supervisors, foremen and superintendents 65 52 117 63 54 58 56 114 53 61
Semi-skilled and discretionary decision-making 58 94 152 103 49 42 56 98 83 15
Unskilled and defined decision-making 5 25 30 29 1 11 6 17 17 –
total permanent 175 188 363 208 155 149 130 279 161 118
Non-permanent 4 1 5 4 1 – – – – –
total 179 189 368 212 156 149 130 279 161 118
* Black as defined by the dti CoGP relating to B-BBEE.
ManaGeMent repreSentatIon (%)
0
20
40
60
80
100Total group representation
Junior management representation
Mid-management representation
Senior management representation
141312111009
0
20
40
60
80
100
Total proportion of black employees*Proportion of junior management who are black employees*Proportion of mid-management who are black employees*Proportion of senior management who are black employees*
2010
2009
20
11
2012
2013
2013
Targ
et
2014
Targ
et
2010
2009
20
11
2012
2014
2013
NUMBER OF STORES
5854
2420
employment equity
The employee composition in South Africa at 30 June was as follows:
* Black as defined by the dti CoGP rating to B-BBEE

SpUr CorporAtion ltd INTEGRATED REPORT 2014 63
Spur group’s vision to make a positive and lasting difference to the people, communities and environment around us is evidenced in our commitment to sustainable environmental practices. The group has an environmental sustainability committee, comprising executive and operational members, to oversee the drafting and implementation of policies, as well as the tracking, measurement and verification of all results. The board is ultimately responsible for sustainability in the group, including environmental sustainability and climate change, and the environmental sustainability committee reports progress to the board on a regular basis. For the year ahead, the board has included sustainability in the ambit of the social and ethics committee’s terms of reference, further enforcing the board’s commitment to sustainability.
All regional offices now report on key environmental indicators and through our procurement and operational gatekeepers, we encourage our suppliers, business partners and franchisees to minimise their environmental impact wherever possible.
oUr SUStAinABilitY JoUrneY So fAr
energY-effiCienCY The group is committed to integrating the impacts of climate change into its risk management processes and strategy where these are material. The group understands its responsibility to reduce greenhouse gas emissions by promoting efficient energy use at group and franchisee level. An energy audit was conducted at corporate offices and franchised restaurants to identify the group’s overall energy requirements, key concern areas and ultimate intervention plan. The group invested in retrofits to minimise and monitor energy consumption.
Corporate
The reporting offices have implemented various energy-saving initiatives, including timer switches for lights and air conditioning, energy-saving light bulbs and tinted window films. Spur Corporation consumed 401 028 kWh of electricity in 2014, a 15.7% decrease
inCreASing environMentAl AwAreneSSThe group’s eco-toolkit aims to raise awareness throughout the group, including corporate employees, franchisees and their employees. The toolkit provides information and practical implementation guidance on environmental matters.
The group’s sustainability team facilitates various training courses to corporate and franchisee employees to raise awareness and provide practical tips on environmental issues. The team trained over 200 employees and selected franchisees during 2014 on the group’s environmental sustainability policy and eco-toolkit rollout programme.
environmental sustainabilityThe group’s environmental sustainability policy (available on our franchisee extranet and website at http://www.spurcorporation.co.za) encourages employees at the group’s restaurants and corporate offices to implement the group’s environmental principles and practices and addresses the following areas:
• Energy efficiency• Water conservation• Waste reduction• Procurement/supply chain management• Transport• Packaging• Events• Measuring and reporting• Awareness• Community involvement
The policy is supported by a detailed set of environmental sustainability policy guidelines and by an environmental sustainability pledge signed by store owners, managers and employees.
Environmental champions have been identified to drive a greener way of doing business across the group and its franchisees.
The group also raises awareness of environmental issues to customers through the ecological messaging in the quarterly Spur Secret Tribe magazine, now also available on bookstands. Spur’s EcoWarriors initiative engages kids from different communities on developing and ensuring a sustainable living. The EcoWarriors website (www.spur.co.za/ecowarriors) includes eco tips for children and fun activities to increase environmental awareness. Other forms of engagement with stakeholders include messaging around environmental initiatives in print, on social media, emailers and internal communications.
on 2013 (475 739 kWh). These figures relate to the Gauteng, Durban and Port Elizabeth regional offices and Cape Town head office, training and customer care centre. Calculated per person at these operations, consumption fell from 222 kWh per person in 2013 to 173 kWh per person in 2014.
Franchisees
The group’s energy efficiency campaign aims to raise awareness among franchisees and their employees through eco-toolkit training, green operations assessments, information posters and stickers to educate, inform and engage at grassroots level.
Given the rapid increase in the price of electricity, improving energy efficiency has become an important focus to protect franchisees’ cash flow margins. All franchisees have received guidelines on how to reduce their energy consumption, with the added benefits of reducing their operating costs and making their businesses more environmentally sustainable. The group has developed revised restaurant building specifications for franchisees that incorporate energy-saving principles and practical implementation guidelines.
wAter ConServAtion And redUCtionThe group’s corporate offices do not use significant amounts of water. The group sources most of its water from local municipalities with a small amount of ground water used to water the gardens. The environmental sustainability committee has identified the group’s sauce and décor manufacturing facilities as critical consumers of water.
Water-saving initiatives focus primarily on ensuring production efficiencies in the group’s manufacturing plants and raising awareness to change employee behaviour. The environmental sustainability committee has recommended that the group focuses on water management instead of water saving.
Water quality is becoming an increasing concern for franchisees, especially those outside of the large cities. In certain areas, franchisees are forced to ensure an alternative supply of water where municipal water quality does not meet our standards.

64 SpUr CorporAtion ltd INTEGRATED REPORT 2014
wASte MAnAgeMentCorporate
The Spur group’s corporate offices have implemented waste reduction and recycling programmes. The environmental sustainability committee has provided all corporate offices with the necessary guidance and information to ensure accurate and complete data collection. Waste recycled includes organic waste and general office items such as paper, packaging (cardboard, plastic and tin) and office-related electronic waste.
Spur Corporation has partnered with the Zero-to-Landfill programme to manage the waste generated by head office. This programme informs employees how to separate organic waste and recyclables in a clear and practical fashion. Currently, 85% of the waste generated by head office is recycled or composted, with only 15% going to landfill.
The group’s operations do not generate material air or water emissions.
Franchisees
Franchisees are mostly tenants in shopping centres and are dependent on their landlords to facilitate efficient waste management. Spur Corporation’s head office has engaged franchisees and landlords to implement a practical waste management process at restaurant level and waste reduction will be considered as an integral part of the design of a store going forward.
The group participates in a cooking oil recycling programme. We achieved our first significant milestone during 2012, converting more than 1 million litres (cumulative aggregate) of vegetable cooking oil from group franchised restaurants in the Western Cape to biodiesel to power fishing vessels, trucks and mining equipment. We formalised relationships with established collectors in all regions during the year and for the period 1 January 2014 to 30 June 2014 (the period for which reliable data could be obtained) we collected 454 633 litres in Gauteng, 176 875 litres in KwaZulu-Natal and 179 553 in the Western Cape.
proCUreMent/SUpplY ChAin MAnAgeMentOur franchise network is a significant consumer of food products. While sustainable procurement is a key risk for the group and forms a large part of our overarching strategy, it is also one of the most difficult strategies to implement. Sustainable practices are a key consideration when assessing suppliers and we actively manage our supply chain to reduce environmental risk.
The scope of issues under consideration has widened to include commodities such as palm oil, a core product for the group, which is associated with the displacement of people and destruction of forests in developing countries. Spur Corporation takes great care to ensure goods are procured from ethical sources with environmental best practices in place.
Refer page 53 for further strategies concerning the sustainable supply of raw materials.
pACKAgingThe design team has developed a packaging range that uses mostly renewable materials and reduced ink coverage and number of colours across the Spur, Panarottis and John Dory’s brands to reduce the environmental impact during the manufacturing process. The procurement team engages with its packaging and printing suppliers continually to develop and explore sustainable alternatives and minimise waste.
Where plastic packaging cannot be avoided, only recyclable plastics are used. All packaging contains clear messaging on what it is and how it can be recycled.
In 2014, 1 433 metric tons of takeaway packaging was used across the group’s brands. Furthermore, 58% of the packaging was made from renewable resources such as paper from trees and 42% was from non-renewable resources such as plastic from oil.
trAnSport MAnAgeMent Spur Corporation is essentially a people business and site visits are necessary for the operations management teams and management to monitor and add value to franchisees. Operations management teams report on vehicle mileage and fuel consumption. Total travel fell during the year, due to an increased focus on reducing travel costs and the use of technology such as Skype where possible. Local return flights during the year decreased 12% to 1 187 flights, international flights reduced by 9% to 258 flights and car hire bookings fell 26% to 358 bookings, relative to the prior year.
15%
85%
HeaD oFFICe WaSte ManaGeMent 2013
recyclable
non-recyclable
15%
85%
9 432 kg Waste
generated by Cape town
head office and décor facility.
Waste diverted
from landfill
8 064 kg

SpUr CorporAtion ltd INTEGRATED REPORT 2014 65
MeASUring And reportingCorporate
The group has set reduction targets for various sustainability metrics, which are currently being re-evaluated in light of the realities of the business. Data collection is also at an early stage, as not all group sites have reported consumption figures.
Franchisees
The group’s eco-checklist, together with the green operations assess-ment, introduces environmental KPIs at franchisee level so that these can be monitored and the group’s total environmental impact better understood. KPIs cover specific greening initiatives, energy efficiency, waste reduction, water conservation, eco-procurement and general administration. The process also creates regular awareness of issues among franchisees. During the year, the green operations assessment was rolled out to all Spur Steak Ranches and Panarottis outlets across South Africa and the operations management teams report biannually on their progress. Training was held for John Dory’s and this operation will be rolling out its own green operations assessment from September 2014. The environmental sustainability committee will further be engaging with The Hussar Grill and Captain DoRegos to establish their sustainability baseline during the 2014-2015 financial year.
CoMMUnitY involveMentThe environmental sustainability committee currently supports a number of ongoing initiatives that align with the group’s sustainability principles, including Creating Change, our WESSA schools project and a clean-up project with Ocean View Football Club in May 2014. More information on these and other Spur Corporation projects are available on our website at www.spurcorporation.co.za.
The group is proud of its achievements to date. However, we acknowledge that many opportunities remain to improve our environmental performance on the road to building a more sustainable business into the future.
eCo-tooLkIt

66 SpUr CorporAtion ltd INTEGRATED REPORT 2014
SUStAinABilitY frAMeworK 2015
transport management
and policy development
green operations assessment
implementation at franchisee
level
environmental sustainability training and awareness
Measurement and verification
of environ-mental Kpis
Stakeholder engagement on environmental issues relating
to group operations
event greening (all outdoor
events)
procurement and supply
chain review to reduce
environmental risk
Alignment with extended
producer responsibility
engagement on environmental
legislation
keY enVIronMentaL StrateGIeS For 2015
our peopLe a
nD
CoM
MunItIeSa
proFItaBLe anD
SuStaInaBLeBuSIneSS
our enVIro
nM
en
taL
FootprInt
Build a transformative and inclusive business for employees
Supply chain management
and HaCCp and ISo22000compliance
reduction in resource
consumption with specific
focus on energy and water
Waste management
and reduction
ongoingmeasurement
and reporting
Increased profitability
due to efficient resource
management
ongoingengagement
around environmental
policy
Grow community involvement and increase
CSI spendStakeholder engagementon material concerns
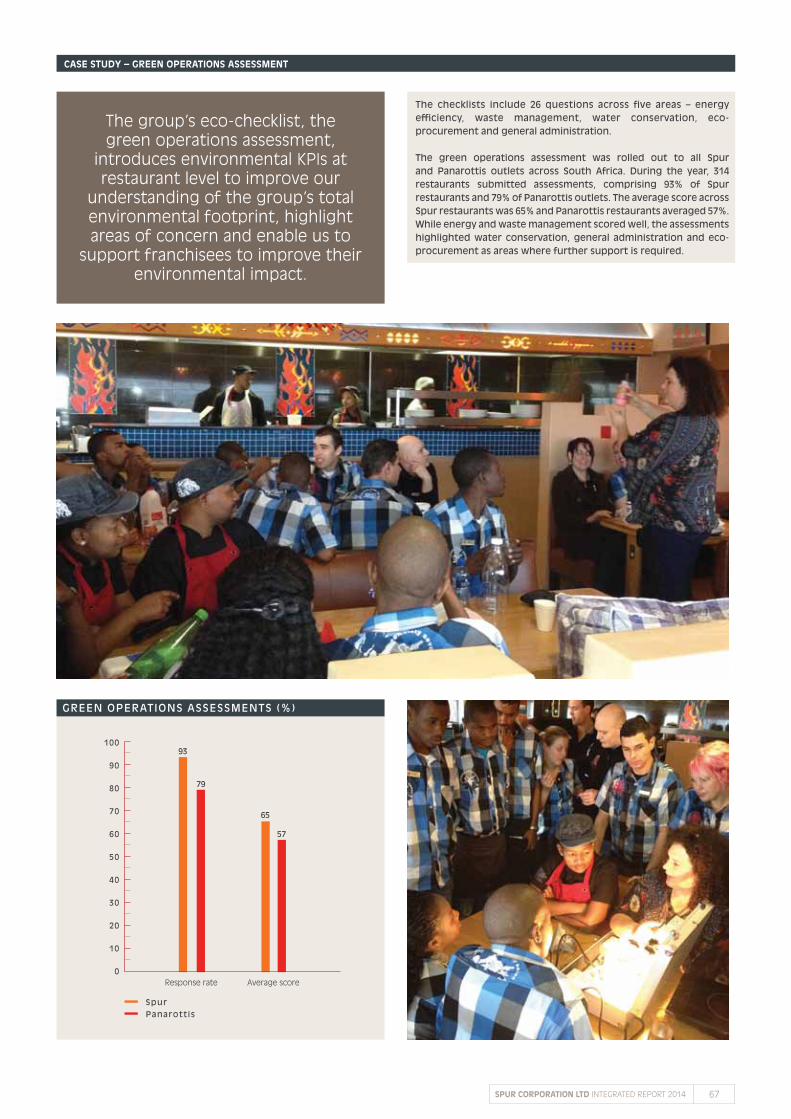
SpUr CorporAtion ltd INTEGRATED REPORT 2014 67
CASe StUdY – green operAtionS ASSeSSMent
Green operatIonS aSSeSSMentS (%)
0
10
20
30
40
60
50
70
80
90
100
NUMBER OF STORES
93
79
65
57
SpurPanarottis
Response rate Average score
The group’s eco-checklist, the green operations assessment,
introduces environmental KPIs at restaurant level to improve our
understanding of the group’s total environmental footprint, highlight areas of concern and enable us to
support franchisees to improve their environmental impact.
the checklists include 26 questions across five areas – energy efficiency, waste management, water conservation, eco-procurement and general administration.
the green operations assessment was rolled out to all Spur and panarottis outlets across South africa. During the year, 314 restaurants submitted assessments, comprising 93% of Spur restaurants and 79% of panarottis outlets. the average score across Spur restaurants was 65% and panarottis restaurants averaged 57%. While energy and waste management scored well, the assessments highlighted water conservation, general administration and eco-procurement as areas where further support is required.